measuring locations of critical points along car- tographic lines...
TRANSCRIPT

Measuring locations of critical points along car-tographic lines with eye movements
Theodora Bargiota, Vasilis Mitropoulos, Vassilios Krassanakis, Byron
Nakos
School of Rural & Surveying Engineering, National Technical University of Athens, Zographos, Greece
Abstract. This paper examines the relation between the observation of cartographic lines and locations distinguished by critical points. It specifi-cally assesses the results of an experiment designed for this purpose. The method applied in order to measure the subjects' performance is the eye movement analysis. The application of eye tracking methodology provides the opportunity to inspect the human gaze. In this experiment, three lines studied in Marino's research, Thapa's test line and the coastline of Peristera Island compose the visual scenes observed. Subjects are asked to scan these lines for a predefined duration. The regions of the visual scenes where sub-jects fixate, are revealed through data analysis and visualizations, composed of fixations' locations and heatmaps respectively. The results deriving from eye movement analysis are tested in locations distinguished by critical points. The results of the study reveal the existence of relation between fixa-tion points and locations of critical points.
Keywords: critical points, eye movements, fixations, heatmaps
1. Introduction
How do we distinguish an object as a specific-individual entity when we are looking at it? Although this question initiates from the scientific field of psychology its effectiveness is widely spread to other scientific fields like information theory (pattern recognition, computer vision), as well as, car-tography. As a result many research studies on visual perception completed during the last thirty years are based on computational theories. In a rele-vant study, Attneave (1954) states that during the observation of a graphic object, the brain receives a great number of stimuli. These stimuli transfer a similarly great amount of information that cannot be stored and utilized in

general. In addition, only a small part of it is essential for the identification of the object. Attneave points out that each location configuring a graphic object transmits different amount of information to the observer. He con-cludes that the information concentrated along the contours of an object and especially at points of high slope changes is distinctive and suffices in order to describe its shape. Thus, the brain acts in a number of ways (con-scious or not) so as to select and store the stimuli found in these distinctive points and to remove the redundant ones.
Due to the fact that line generalization is a process during which a cartogra-pher retains only the relevant points so as to configure the derivative line, Attneave’s principle offered an interesting point of view on how to control certain cartographic generalization processes. In cartographic literature, these distinctive points are called ‘critical points’. Marino (1979) underlines their existence and impact in an empirical study. In her research, six lines representing natural phenomena (rivers and coastlines) are presented to a group of cartographers and non-cartographers. The subjects are asked to select a set of points which they considered necessary to retain the charac-ter and the shape of the line in three levels of generalization. The number of points to be selected is specific for each task. The results’ analysis demon-strates that all subjects came to a close agreement on the points they select-ed, on all three levels of generalization. It should be added that these points were detected at locations of high slope change. Considering a cartographic line to be a set of points with redundant information, Marino’s study testi-fies that Attneave’s principle applies to the manual line generalization pro-cess.
In computer cartography, researchers attempt to pattern the manual sim-plification techniques and to modulate them so as to fit the demands of dig-ital representations (assuming that cartographic lines are usually repre-sented in vector structure), and therefore to automate line generalization process. For this reason the concept of critical points is widely implemented in digital cartography. It comprises the conceptual foundation of many line simplification algorithms whilst being used as a criterion for the quantita-tive and qualitative assessment of line simplification procedures. As it has been mentioned in several studies (McMaster 1987, Thapa 1988, Visvalin-gam & Whyatt 1990, Dutton 1999), critical points themselves are usually not adequate to configure a generalized line. However, their detection and retention is essential in order to retain the basic character and shape of the derivative line.
In this context, Thapa (1988) proposes a critical points’ detection algorithm based on the use of zero-crossings. Thapa assesses this algorithm in a theo-retical test line, specifically a geometrical model comprised by the repre-
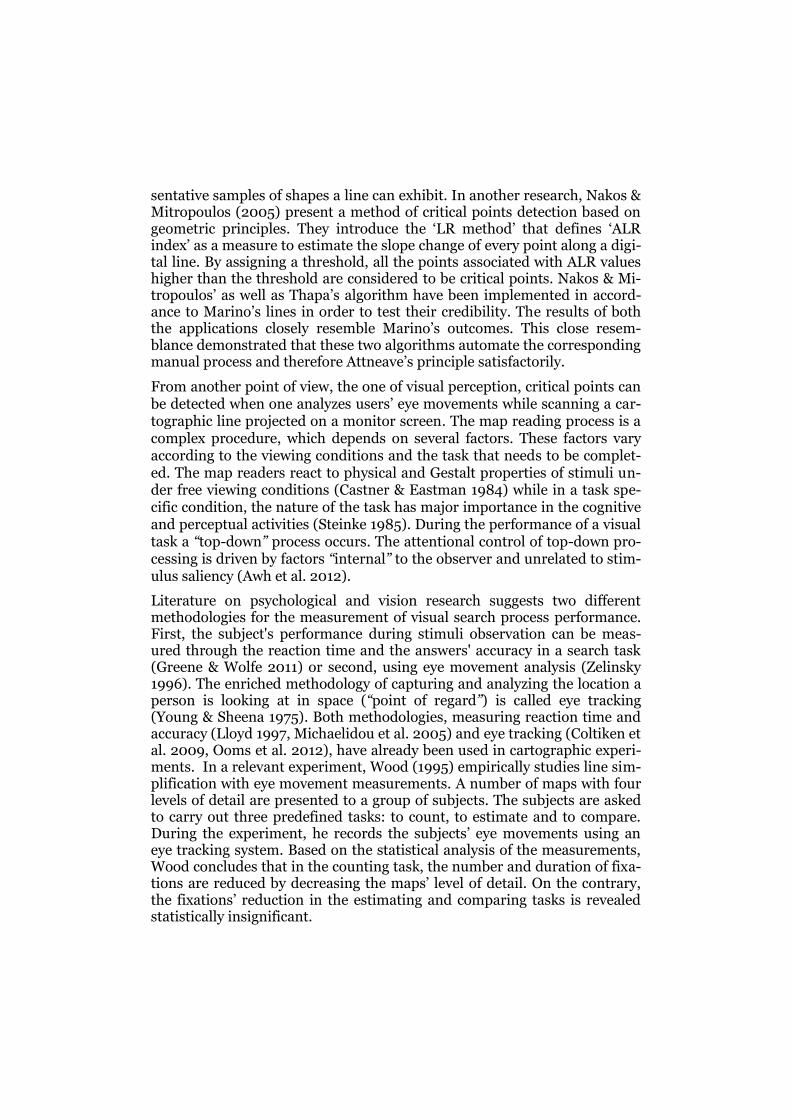
sentative samples of shapes a line can exhibit. In another research, Nakos & Mitropoulos (2005) present a method of critical points detection based on geometric principles. They introduce the ‘LR method’ that defines ‘ALR index’ as a measure to estimate the slope change of every point along a digi-tal line. By assigning a threshold, all the points associated with ALR values higher than the threshold are considered to be critical points. Nakos & Mi-tropoulos’ as well as Thapa’s algorithm have been implemented in accord-ance to Marino’s lines in order to test their credibility. The results of both the applications closely resemble Marino’s outcomes. This close resem-blance demonstrated that these two algorithms automate the corresponding manual process and therefore Attneave’s principle satisfactorily.
From another point of view, the one of visual perception, critical points can be detected when one analyzes users’ eye movements while scanning a car-tographic line projected on a monitor screen. The map reading process is a complex procedure, which depends on several factors. These factors vary according to the viewing conditions and the task that needs to be complet-ed. The map readers react to physical and Gestalt properties of stimuli un-der free viewing conditions (Castner & Eastman 1984) while in a task spe-cific condition, the nature of the task has major importance in the cognitive and perceptual activities (Steinke 1985). During the performance of a visual task a “top-down” process occurs. The attentional control of top-down pro-cessing is driven by factors “internal” to the observer and unrelated to stim-ulus saliency (Awh et al. 2012).
Literature on psychological and vision research suggests two different methodologies for the measurement of visual search process performance. First, the subject's performance during stimuli observation can be meas-ured through the reaction time and the answers' accuracy in a search task (Greene & Wolfe 2011) or second, using eye movement analysis (Zelinsky 1996). The enriched methodology of capturing and analyzing the location a person is looking at in space (“point of regard”) is called eye tracking (Young & Sheena 1975). Both methodologies, measuring reaction time and accuracy (Lloyd 1997, Michaelidou et al. 2005) and eye tracking (Coltiken et al. 2009, Ooms et al. 2012), have already been used in cartographic experi-ments. In a relevant experiment, Wood (1995) empirically studies line sim-plification with eye movement measurements. A number of maps with four levels of detail are presented to a group of subjects. The subjects are asked to carry out three predefined tasks: to count, to estimate and to compare. During the experiment, he records the subjects’ eye movements using an eye tracking system. Based on the statistical analysis of the measurements, Wood concludes that in the counting task, the number and duration of fixa-tions are reduced by decreasing the maps’ level of detail. On the contrary, the fixations’ reduction in the estimating and comparing tasks is revealed statistically insignificant.

In the present paper an experiment is performed in order to examine how far eye movement measurements during the observation of cartographic lines under a simple scanning task are related to locations distinguished by critical points. The stimuli of the experiment are composed of five carto-graphic lines. Subjects are asked to scan these cartographic lines for a pre-defined duration. The aim of the experiment is to examine if the observa-tion of cartographic lines is related to locations distinguished by critical points which are detected through the implementation of the ‘LR method’ (Nakos & Mitropoulos 2005).
2. Experimental Design
The experiment is designed and performed in the Laboratory of Cartog-raphy at National Technical University of Athens.
Figure 1. Two views of the eye tracking system configuration used for the experi-
ment.
2.1. Method
The methodology used in order to measure the subjects’ reaction is eye tracking. Specifically, the ViewPoint Eye Tracker ® from Arrington Re-search is used. Eye movements are recorded in 60 Hz frequency, which is translated in duration length of approximately 16.67 msec between succes-sive data. The Eye Tracker's accuracy varies between 0.25-1.00 degrees of visual arc, when the recording resolution is 0.15 degrees of visual arc. For stimuli projection, a 19-inch monitor is used. The distance between the monitor for stimuli projection and the subject is 60 cm. Figure 1 illustrates the eye tracking configuration system in experiment measuring conditions.
More information about the eye tracker equipment can be found in Kras-sanakis et al. (2011).
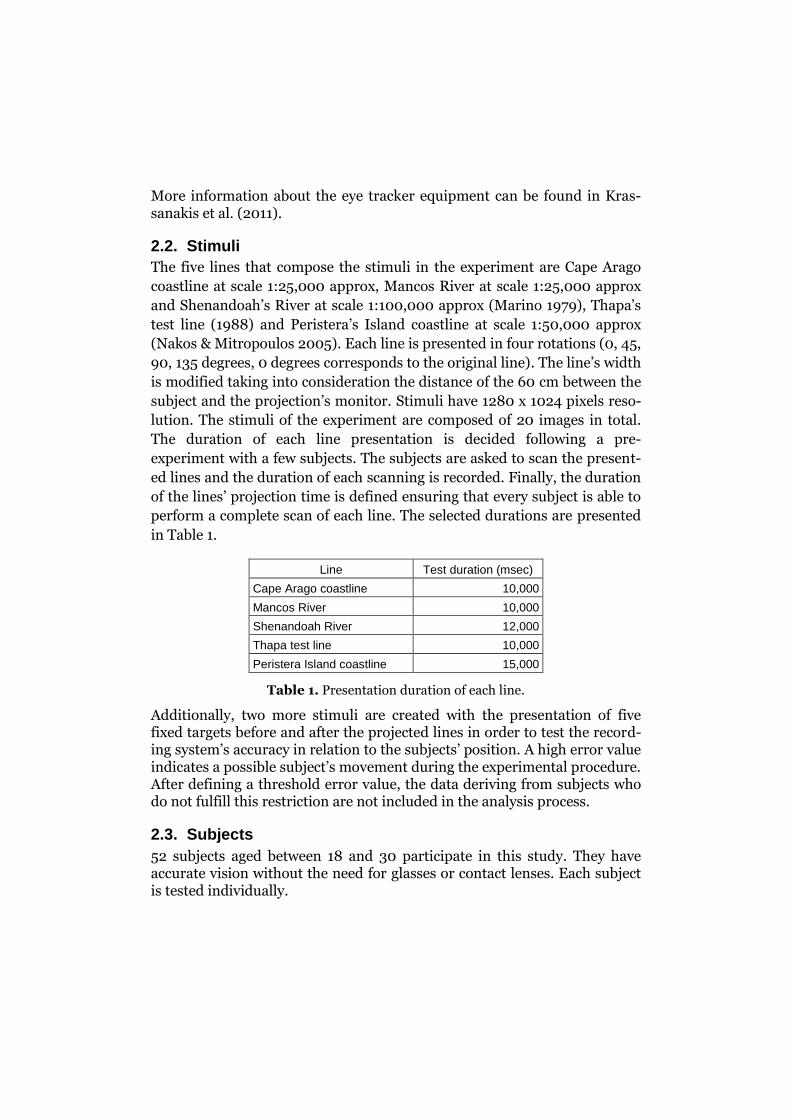
2.2. Stimuli
The five lines that compose the stimuli in the experiment are Cape Arago
coastline at scale 1:25,000 approx, Mancos River at scale 1:25,000 approx
and Shenandoah’s River at scale 1:100,000 approx (Marino 1979), Thapa’s
test line (1988) and Peristera’s Island coastline at scale 1:50,000 approx
(Nakos & Mitropoulos 2005). Each line is presented in four rotations (0, 45,
90, 135 degrees, 0 degrees corresponds to the original line). The line’s width
is modified taking into consideration the distance of the 60 cm between the
subject and the projection’s monitor. Stimuli have 1280 x 1024 pixels reso-
lution. The stimuli of the experiment are composed of 20 images in total.
The duration of each line presentation is decided following a pre-
experiment with a few subjects. The subjects are asked to scan the present-
ed lines and the duration of each scanning is recorded. Finally, the duration
of the lines’ projection time is defined ensuring that every subject is able to
perform a complete scan of each line. The selected durations are presented
in Table 1.
Line Test duration (msec)
Cape Arago coastline 10,000
Mancos River 10,000
Shenandoah River 12,000
Thapa test line 10,000
Peristera Island coastline 15,000
Table 1. Presentation duration of each line.
Additionally, two more stimuli are created with the presentation of five fixed targets before and after the projected lines in order to test the record-ing system’s accuracy in relation to the subjects’ position. A high error value indicates a possible subject’s movement during the experimental procedure. After defining a threshold error value, the data deriving from subjects who do not fulfill this restriction are not included in the analysis process.
2.3. Subjects
52 subjects aged between 18 and 30 participate in this study. They have accurate vision without the need for glasses or contact lenses. Each subject is tested individually.

The subjects are asked to scan the set of projected lines from start to end. Additional instructions include, that if a subject ends the scanning before the time that the presented line expires, he/she is allowed either to repeat the scan or to look in a random spot on the screen for the remaining time. Moreover, the calibration of the system is performed using 9 fixed targets for each participant. Furthermore, 4 sets of images are created and tested in 4 groups of 12, 13, 13 and 14 subjects respectively. Each set of images con-tains 5 pictures that depict the 5 test lines. In order to avoid biases, the ro-tation and sequence of the presentation is random. After detecting each subjects’ accuracy with the five targets stimuli, the raw data of 40 persons (10 per group) with error less than 50 pixels, are selected for the analysis.
3. Results Analysis and Discussion
The data used in the analysis are those deriving from the first scan of each line. Additional data points that derived from successive attempts of scan-ning are not included in further processing. The eye tracking protocol of each subject is analyzed in fixations and saccadic movements. The complete sequence between fixations and saccades compose the scan-path of visual search. OGAMA software (Voßkühler et al. 2008) is used for the analysis of raw data to fundamental eye movement metrics (fixations and saccades).
Figure 2. Heatmaps of the five tested lines.
The fixations’ calculation parameters are defined as follows: the maximum distance that a point may vary from the average fixation point and still be

considered part of the fixation is set to 20 pixels and the minimum number of samples that can be considered to be a fixation is set to 5. The fixation detection ring size is set to 31 pixels. The size of the ring defines the buffer size used to detect fixations.
The exported fixations are compared to the critical points of the five tested lines. Critical points are detected using the ‘LR method’ (Nakos & Mi-tropoulos 2005). Specifically, the ‘ALR index’ is applied.
Moreover, heatmaps visualizations are produced for every tested line (see Figure 2). Heatmap is a visualization technique which represents different levels of observation intensity (Spakov & Miniotas 2007) using colors. The colors of the heatmaps presented in Figure 2 alter from green to red when the fixations’ density increases. It is observed that the fixations are denser in locations where two opposite parts of the line collide or in locations of successive fluctuations. It is noted that these locations are characterized by high accumulation of critical points detected by the ‘ALR index’.
Figure 3. The geometry of the system subject-monitor during the experiment.
An important issue involved handling the data collected in the experiment has to do with the fact that the granularity of both raw data and exported fixations are coarser than the vertices of the tested lines. This phenomenon is due to the recording precision of the eye tracker system. Moreover, the eyes are relatively stationary during a fixation movement. In order to over-come this shortcoming, a buffer zone is created around both the tested line and the corresponding critical points. The eye movement recordings placed in the generated buffer zones correspond to the observation of the tested elements (lines and critical points). The buffer’s size (S) is determined tak-

ing into account the accuracy of the recording system (φ) and the distance between subject and stimuli monitor (D) (see Figure 3). Given that the dis-tance D is 60 cm during the experiment, the buffer’s size (S) equals to 20 pixels.
The duration of the observation for all subjects (total) and per subject (av-erage) for each line (line buffer zone), as well as, for locations around its critical points (critical points buffer zones) using the raw data are presented in Table 3. A first finding seen in Table 3, is that subjects spend a rather high scanning time in order to observe those locations containing critical points along the lines.
Total duration (msec) Average & standard deviation
of duration (msec)
Line Critical
points Line
Critical
points
Cape Arago coastline 364,993 154,000 9,125 (±1,251) 3,850 (±2,201)
Mancos River 371,361 180,368 9,284 (±904) 4,509 (±2,645)
Shenandoah River 447,567 256,317 11,189 (±1,615) 6,408 (±1,812)
Thapa test line 360,591 114,333 9,015 (±1,140) 2,858 (±1,250)
Peristera Island coastline 510,005 265,000 12,750 (±2,332) 6,625 (±1,963)
Table 3. Scanning duration of raw data for each line and for locations around crit-
ical points.
After performing the fixation analysis process, the duration density of fixa-tions per pixel in locations around each line (included inside the line buffer zone) and in locations around critical points (incl. inside critical points buffer zones) are computed. Additionally, the duration density of fixations per pixel in locations around non-critical points for each line is calculated as the difference between the computed values. The results for all subjects participating in the experiment are presented in Table 4.
Fixations’ duration density (msec) per pixel
Line Locations of
critical points
Locations of
non-critical points
Cape Arago coastline 3.98 4.35 3.14
Mancos River 3.21 3.30 2.65
Shenandoah River 4.45 4.48 4.35
Thapa test line 2.14 2.38 1.89
Peristera Island coastline 3.88 4.33 3.01
Table 4. Fixations’ duration density per pixel around each line and in locations
around critical points and non-critical points.

A general conclusion occurring by the examination of Table 4 is that sub-jects fixate more to critical points locations when observing a line. This finding is valid for all lines tested. Regarding the results of Shenandoah River test line in specific, it becomes evident that the duration of the fixa-tions in locations of critical and non-critical points is quite similar. This finding may have to do with the roughly sinusoidal shape of the line (Figure 2). The critical points are generally located at the peaks of the curves. Con-sidering the fact that the curves of Shenandoah River test line are close to each other and that the intermediate, non-crucial line segments are short in length, distinguishing between critical and non-critical locations becomes difficult for the observer. On the contrary, critical points in the rest the lines tested are usually detected at more discernible locations. Thus, subjects apparently fixate more easily at the locations of critical points.
As mentioned above, Thapa’s test line is a geometrical model which con-tains several representative samples of shapes that a line can exhibit. For this reason, a more thorough analysis of the experimental procedure’s out-comes is attempted to that line. The locations of Thapa’s test line that con-tain critical points are grouped so as to generate line segments of common geometrical attributes. As shown in Figure 4, the line is divided to: (i) parts of successive fluctuations (a, b, c), (ii) parts of abrupt directional change (slope changes close to 90 degrees) (d, e, f), (iii) parts that shape a triangle (g, i) and (iv) the endpoints (j, k). In Figure 4, the critical points are depict-ed with black dots.
Figure 4 . Thapa’s test line, the critical points and the four types of line segments.
When comparing the fixations’ durations corresponding to locations of crit-ical points it becomes evident that subjects fixate more at the fluctuated parts of the line (a, b and c in Figure 4). Specifically, the line part ‘b’, which is characterized by dense, sharp and medium sized fluctuations, is observed
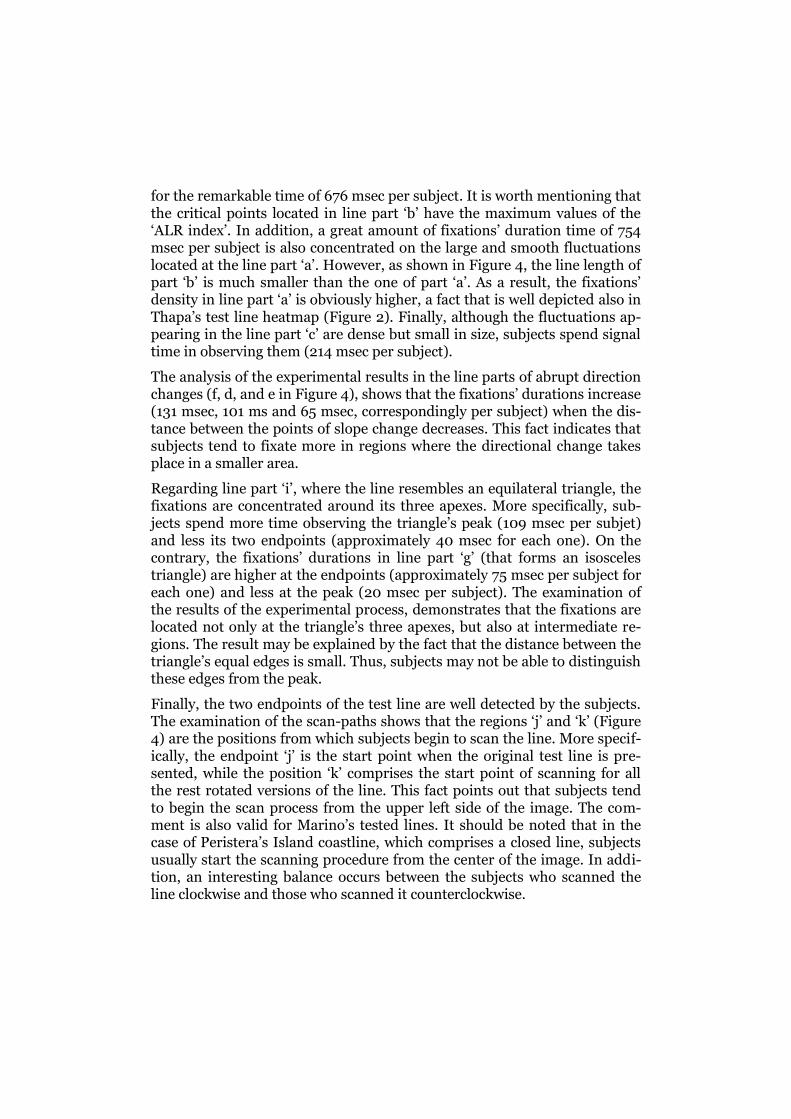
for the remarkable time of 676 msec per subject. It is worth mentioning that the critical points located in line part ‘b’ have the maximum values of the ‘ALR index’. In addition, a great amount of fixations’ duration time of 754 msec per subject is also concentrated on the large and smooth fluctuations located at the line part ‘a’. However, as shown in Figure 4, the line length of part ‘b’ is much smaller than the one of part ‘a’. As a result, the fixations’ density in line part ‘a’ is obviously higher, a fact that is well depicted also in Thapa’s test line heatmap (Figure 2). Finally, although the fluctuations ap-pearing in the line part ‘c’ are dense but small in size, subjects spend signal time in observing them (214 msec per subject).
The analysis of the experimental results in the line parts of abrupt direction changes (f, d, and e in Figure 4), shows that the fixations’ durations increase (131 msec, 101 ms and 65 msec, correspondingly per subject) when the dis-tance between the points of slope change decreases. This fact indicates that subjects tend to fixate more in regions where the directional change takes place in a smaller area.
Regarding line part ‘i’, where the line resembles an equilateral triangle, the fixations are concentrated around its three apexes. More specifically, sub-jects spend more time observing the triangle’s peak (109 msec per subjet) and less its two endpoints (approximately 40 msec for each one). On the contrary, the fixations’ durations in line part ‘g’ (that forms an isosceles triangle) are higher at the endpoints (approximately 75 msec per subject for each one) and less at the peak (20 msec per subject). The examination of the results of the experimental process, demonstrates that the fixations are located not only at the triangle’s three apexes, but also at intermediate re-gions. The result may be explained by the fact that the distance between the triangle’s equal edges is small. Thus, subjects may not be able to distinguish these edges from the peak.
Finally, the two endpoints of the test line are well detected by the subjects. The examination of the scan-paths shows that the regions ‘j’ and ‘k’ (Figure 4) are the positions from which subjects begin to scan the line. More specif-ically, the endpoint ‘j’ is the start point when the original test line is pre-sented, while the position ‘k’ comprises the start point of scanning for all the rest rotated versions of the line. This fact points out that subjects tend to begin the scan process from the upper left side of the image. The com-ment is also valid for Marino’s tested lines. It should be noted that in the case of Peristera’s Island coastline, which comprises a closed line, subjects usually start the scanning procedure from the center of the image. In addi-tion, an interesting balance occurs between the subjects who scanned the line clockwise and those who scanned it counterclockwise.

4. Concluding Remarks
The outcome of the experiment described in the present paper is in accord-ance with the principle that information is concentrated in points of high slope changes along a line. As shown in Table 4, subjects fixate for more time in locations of critical points than in the straight or smooth parts of a cartographic line when they are asked to perform a simple scanning task. The heatmaps depicted in Figure 2 also confirm this finding.
The recording accuracy of the eye tracking system does not allow comparing one-by-one the fixations with the critical points. Buffer zones around criti-cal points are introduced in order to overcome this shortcoming. However, nowadays, the research in the realm of line generalization focuses on the concept of line segmentation in homogenous parts and their generalization by implementing the appropriate operators. In that sense, it may be more useful for a cartographer to focus on locations around critical points (in-stead of isolated points) along a cartographic line that transmit to the ob-server a great amount of measurable information.
References
Attneave F (1954) Some Informational Aspects of Visual Perception. Psychological Review 61(3): 183-193
Awh E, Belopolsky A V, Theeuwes J (2012) Top-down versus bottom-up attentional control: a failed theoretical dichotomy. Trends in Cognitive Sciences 16(8): 437-443
Castner H W, & Eastman J R (1984) Eye-movement parameters and perceived map complexity-I. The American Cartographer 11(2): 107-117
Coltekin A, Heil B, Garlandini S, Fabrikant S (2009) Evaluating the Effectiveness of Interactive Map Interface Designs: A Case Study Integrating Usability Metrics with Eye-movement Analysis. Cartography and Geographic Information Science 36(1): 5-17
Dutton G (1999) Scale, Sinuosity and Point Selection in Digital Line Generalization, Cartography and Geographic Information Science 26(1): 33-53
Greene M R, & Wolfe J M (2011) Global image properties do not guide visual search. Journal of Vision 11(6): 1-9
Lloyd R (1997) Visual Search Processes Used in Map Reading. Cartographica 34(1): 11-32
Krassanakis V, Filippakopoulou V, Nakos B (2011) An Application of Eye Tracking Methodology in Cartographic Research, Proceedings of the EyeTrackBehavior (Tobii), Frankfurt

Marino J S, (1979) Identification of Characteristic Points Along Naturally Occurring Lines / An Empirical Study. The Canadian Cartographer 16(1): 70-80
McMaster R B (1987) Automated Line Generalization, Cartographica 24(2): 74-111
Michaelidou E, Filippakopoulou V, Nakos B, Petropoulou A (2005) Designing Point Map Symbols: The effect of preattentive attribute of shape, Proceedings of the 22th International Cartographic Association Conference, A Coruna
Nakos B & Mitropoulos V (2005) Critical Points Detection Using the Length Ratio (LR) for Line Generalization. Cartographica 40(3): 35-51
Ooms K, De Maeyer P, Fack V, Van Assche E, Witlox F (2012) Interpreting maps through the eyes of expert and novice users. International Journal of Geographical Information Science 26(10): 1773-1788
Spakov O, Miniotas D (2007) Visualization of Eye Gaze Data using Heat Maps. Electronics and electrical engineering 2(74): 55-58
Steinke T R (1987) Eye movements studies in cartography and related fields. Cartographica 24(2): 40-73
Thapa K (1988) Automatic Line Generalization in Raster Data Using Zero-Crossings. Photogrammetric Engineering and Remote Sensing 54(4): 511-517
Visvalingam M, Whyatt, JD (1990) The Douglas-Peucker Algorithm for Line Simplification: Re-evaluation through Visualization, Computer Graphics Forum 9: 213-228
Voßkühler A, Nordmeier V, Kuchinke L, Jacobs A M (2008) OGAMA (Open Gaze and Mouse Analyzer): open-source software designed to analyze eye and mouse movements in slideshow study designs. Behavior Research Methods 40(4): 1150-1162
Wood C (1995) Perceptual responses to line simplification in a task-oriented map analysis experiment. Cartographica 32(1): 22-32
Young L R, & Sheena D (1975) Survey of eye movement recording methods. Behavior Research Methods & Instrumentation 7(5): 397-429
Zelinsky G J (1996) Using Eye Saccades to Assess the Selectivity of Search Movements. Vision Research 36(14): 2177-2187