measuring marketing performance -...
TRANSCRIPT
Measuring Marketing Performance: The BI Roadmap to Information Nirvana
October 2007
~ Underwritten, in Part, by ~
Measuring Marketing Performance: The BI Roadmap to Information Nirvana Page 2
© 2007 Aberdeen Group. Telephone: 617 723 7890
Executive Summary Research Benchmark
Aberdeen’s Research Benchmarks provide an in-depth and comprehensive look into process, procedure, methodologies, and technologies with best practice identification and actionable recommendations.
This report is a roadmap for marketing and business executives who desire to improve overall marketing performance through Best-in-Class use of marketing performance measurement capabilities and enabling technologies. The ability to analyze performance across all activities and generate improved results defines the “information nirvana” marketers are looking for. Traditionally, companies have taken a "hit-or-miss" or "do what worked before” strategy toward developing and executing their marketing initiatives and campaigns. This has resulted in a lack of perceived value of marketing to the enterprise. Companies are striving to alleviate this pressure through the implementation of specific measures that will yield Best-in-Class performance results.
Best-in-Class Performance Aberdeen used four key performance criteria to distinguish Best-in-Class companies.
Marketing operations performance:
• 9% mean increase in Return on Marketing Investment (ROMI) "Our marketing and promotion efforts in the past could be defined as: throw everything we have at the wall and then see what sticks. Now we take a very analytical approach before, during, and after the process. We have the ability to make changes to promotions mid-campaign. The investment [we made in the BI technology supporting this capability] paid for itself in the first holiday season."
~ Vice President, IT, Large Beverage Distributor
• 12% mean increase in new leads to the pipeline
Customer marketing performance:
• 11% mean increase in customer cross-sell / up-sell opportunities
• 10% mean increase in customer retention rate
Competitive Maturity Assessment Survey results show that the firms enjoying Best-in-Class performance shared several common characteristics. For example:
• 75% of the Best-in-Class currently segment and profile customers, versus 61% of Industry Average and 56% of Laggard companies
• 33% of the Best-in-Class have created a test-measure-refine methodology for all campaigns, versus 17% of Industry Average and 11% of Laggard companies
• 41% of the Best-in-Class integrate market analysis into the campaign creation process, versus 32% of Industry Average and 16% of Laggard companies
Required Actions In addition to the specific recommendations in Chapter Three of this report, to achieve Best-in-Class performance, companies must:
• Improve the timeliness of marketing performance information. Sixty-one percent (61%) of Best-in-Class companies have increased
www.aberdeen.com Fax: 617 723 7897
Measuring Marketing Performance: The BI Roadmap to Information Nirvana Page 3
© 2007 Aberdeen Group. Telephone: 617 723 7890
their ability to close the gap between actual business activity and availability of information. This translates into advantage through the ability to respond to marketing response while it is being generated as opposed to waiting until the activity is finished before analyzing results.
• Elevate the role of marketing within the organization. Thirty-six percent (36%) of Best-in-Class organizations identify establishing marketing's value to the organization as the top pressure driving marketing performance measurement activity. This is higher on the list than improving managements view into marketing information, finding and increasing efficiencies, and outperforming the competition. For true success, companies need to shift the focus from internal pressures to external pressures.
www.aberdeen.com Fax: 617 723 7897
Measuring Marketing Performance: The BI Roadmap to Information Nirvana Page 4
© 2007 Aberdeen Group. Telephone: 617 723 7890 www.aberdeen.com Fax: 617 723 7897
Table of Contents Executive Summary....................................................................................................... 2
Best-in-Class Performance..................................................................................... 2Competitive Maturity Assessment....................................................................... 2Required Actions...................................................................................................... 2
Chapter One: Benchmarking the Best-in-Class ..................................................... 6Business Context ..................................................................................................... 6
Marketing Performance Drivers ...................................................................... 6The Maturity Class Framework............................................................................ 7The Best-in-Class PACE Model ............................................................................ 7Best-in-Class Strategies........................................................................................... 8
Chapter Two: Benchmarking Requirements for Success ..................................10Competitive Assessment......................................................................................11Capabilities and Enablers ......................................................................................12
Process.................................................................................................................13Organization .......................................................................................................13Knowledge Management..................................................................................14Performance Management...............................................................................15Technology..........................................................................................................16
Chapter Three: Required Actions .........................................................................21Laggard Steps to Success......................................................................................21Industry Average Steps to Success ....................................................................21Best-in-Class Steps to Success ............................................................................22
Appendix A: Research Methodology.....................................................................23Appendix B: Related Aberdeen Research............................................................25Featured Underwriters ...................................Error! Bookmark not defined.
Figures Figure 1: Pressures Driving Marketing Performance Strategies......................... 6 Figure 2: Top Strategies Employed to Improve Marketing Performance Measurement.................................................................................................................. 8Figure 3: Top Process Management Capabilities .................................................13Figure 4: Key Organizational Management Capability ........................................14Figure 5: Top Knowledge Management Capabilities...........................................14Figure 6: Top Performance Management Capabilities........................................15Figure 7: Best-in-Class Current and Planned Capabilities .................................16Figure 8: Current Marketing Performance Measurement System Deployed by Tool Category ........................................................................................................17Figure 9: Top Technology Enablers ........................................................................18Figure 10: Best-in-Class Current and Planned Technology Enablers..............19Figure 11: Technology Purchase Priorities - Rated High/Critical ....................20
Measuring Marketing Performance: The BI Roadmap to Information Nirvana Page 5
© 2007 Aberdeen Group. Telephone: 617 723 7890 www.aberdeen.com Fax: 617 723 7897
Tables Table 1: Companies with Top Performance Earn Best-in-Class Status ........... 7 Table 2: The Best-in-Class PACE Framework ....................................................... 7Table 3: The Competitive Framework...................................................................11Table 4: The PACE Framework Key ......................................................................24Table 5: The Competitive Framework Key ..........................................................24Table 6: The Relationship Between PACE and the Competitive Framework.........................................................................................................................................24
Measuring Marketing Performance: The BI Roadmap to Information Nirvana Page 6
© 2007 Aberdeen Group. Telephone: 617 723 7890
Chapter One: Benchmarking the Best-in-Class
Business Context Fast Facts
√ 55% of Best-in-Class companies have improved their lead-to-pipeline conversion rate by greater than 10%, compared to 14% of Industry Average and 3% of Laggards
√ 55% of Best-in-Class companies have increased the number of people with visibility to marketing performance measurement information, compared to 41% of Industry Average and 18% of Laggards
Improvement of marketing performance, and specifically the ability to pinpoint the drivers and detractors for performance, is the holy grail of marketing organizations. The ability to analyze performance across all activities and generate improved results defines the “information nirvana” marketers are looking for. Traditionally, companies have taken a “hit-or-miss” or “let’s do what worked before” strategy toward developing and executing their marketing initiatives and campaigns. As the pressure to improve performance has increased and budgets have come under close scrutiny, organizations are now faced with finding new ways to make marketing activity more effective, efficient, and yield higher return.
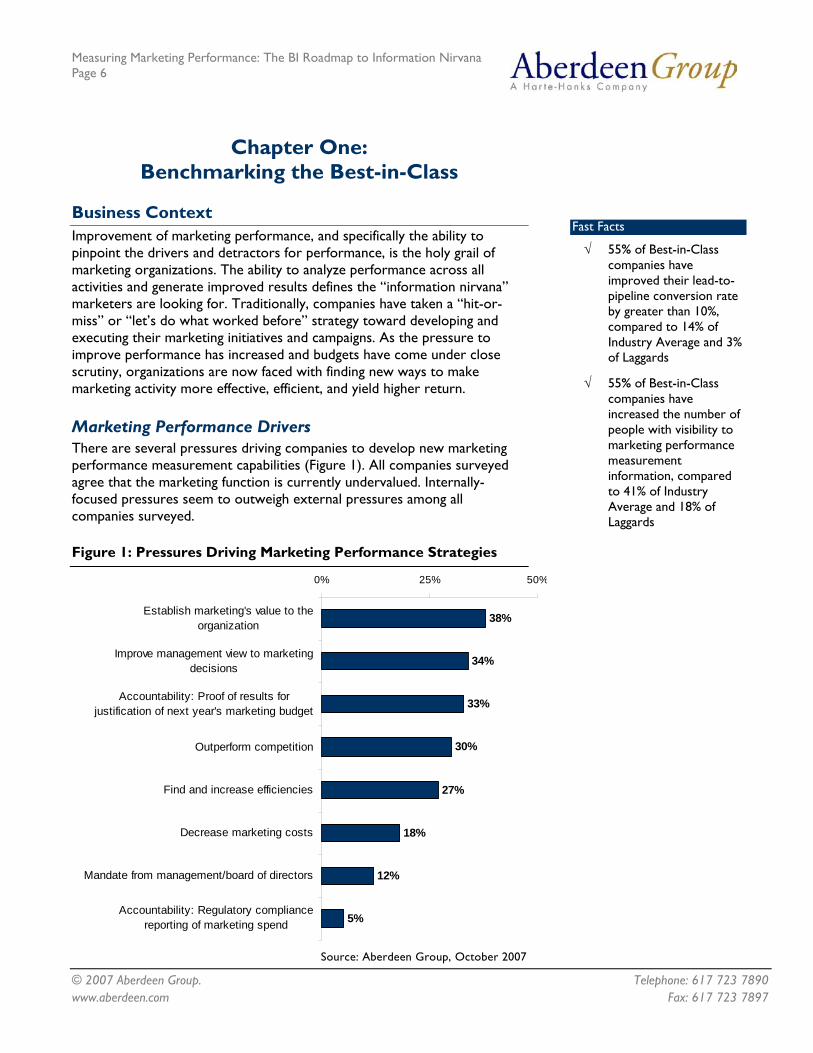
Marketing Performance Drivers There are several pressures driving companies to develop new marketing performance measurement capabilities (Figure 1). All companies surveyed agree that the marketing function is currently undervalued. Internally-focused pressures seem to outweigh external pressures among all companies surveyed.
Figure 1: Pressures Driving Marketing Performance Strategies
18%
12%
5%
38%
34%
33%
30%
27%
0% 25% 50%
Establish marketing's value to theorganization
Improve management view to marketingdecisions
Accountability: Proof of results forjustification of next year's marketing budget
Outperform competition
Find and increase efficiencies
Decrease marketing costs
Mandate from management/board of directors
Accountability: Regulatory compliancereporting of marketing spend
Source: Aberdeen Group, October 2007
www.aberdeen.com Fax: 617 723 7897
Measuring Marketing Performance: The BI Roadmap to Information Nirvana Page 7
© 2007 Aberdeen Group. Telephone: 617 723 7890 www.aberdeen.com Fax: 617 723 7897
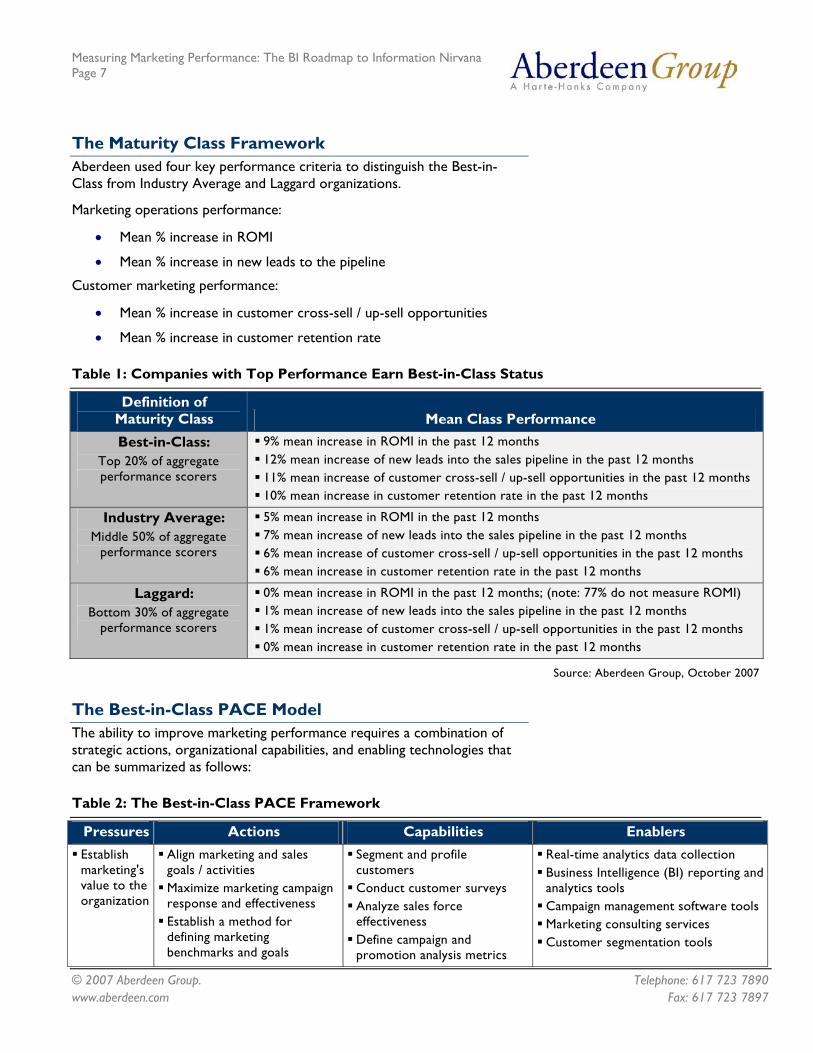
The Maturity Class Framework Aberdeen used four key performance criteria to distinguish the Best-in-Class from Industry Average and Laggard organizations.
Marketing operations performance:
• Mean % increase in ROMI
• Mean % increase in new leads to the pipeline
Customer marketing performance:
• Mean % increase in customer cross-sell / up-sell opportunities
• Mean % increase in customer retention rate
Table 1: Companies with Top Performance Earn Best-in-Class Status
Definition of Maturity Class Mean Class Performance Best-in-Class:
Top 20% of aggregate performance scorers
9% mean increase in ROMI in the past 12 months 12% mean increase of new leads into the sales pipeline in the past 12 months 11% mean increase of customer cross-sell / up-sell opportunities in the past 12 months 10% mean increase in customer retention rate in the past 12 months
Industry Average: Middle 50% of aggregate
performance scorers
5% mean increase in ROMI in the past 12 months 7% mean increase of new leads into the sales pipeline in the past 12 months 6% mean increase of customer cross-sell / up-sell opportunities in the past 12 months 6% mean increase in customer retention rate in the past 12 months
Laggard: Bottom 30% of aggregate
performance scorers
0% mean increase in ROMI in the past 12 months; (note: 77% do not measure ROMI) 1% mean increase of new leads into the sales pipeline in the past 12 months 1% mean increase of customer cross-sell / up-sell opportunities in the past 12 months 0% mean increase in customer retention rate in the past 12 months
Source: Aberdeen Group, October 2007
The Best-in-Class PACE Model The ability to improve marketing performance requires a combination of strategic actions, organizational capabilities, and enabling technologies that can be summarized as follows:
Table 2: The Best-in-Class PACE Framework
Pressures Actions Capabilities Enablers Establish marketing's value to the organization
Align marketing and sales goals / activities Maximize marketing campaign response and effectiveness Establish a method for defining marketing benchmarks and goals
Segment and profile customers Conduct customer surveys Analyze sales force effectiveness Define campaign and promotion analysis metrics
Real-time analytics data collection Business Intelligence (BI) reporting and analytics tools Campaign management software tools Marketing consulting services Customer segmentation tools
Measuring Marketing Performance: The BI Roadmap to Information Nirvana Page 8
© 2007 Aberdeen Group. Telephone: 617 723 7890
Pressures Actions Capabilities Enablers Regularly merge / purge leads and contacts for added efficiency Integrate market analysis into campaign creation process
Embedded analytics within CRM tools BI dashboards, scorecards and / or auto-alert tools Customer data modeling software MS Excel as primary tool Static printed reports
Source: Aberdeen Group, October 2007
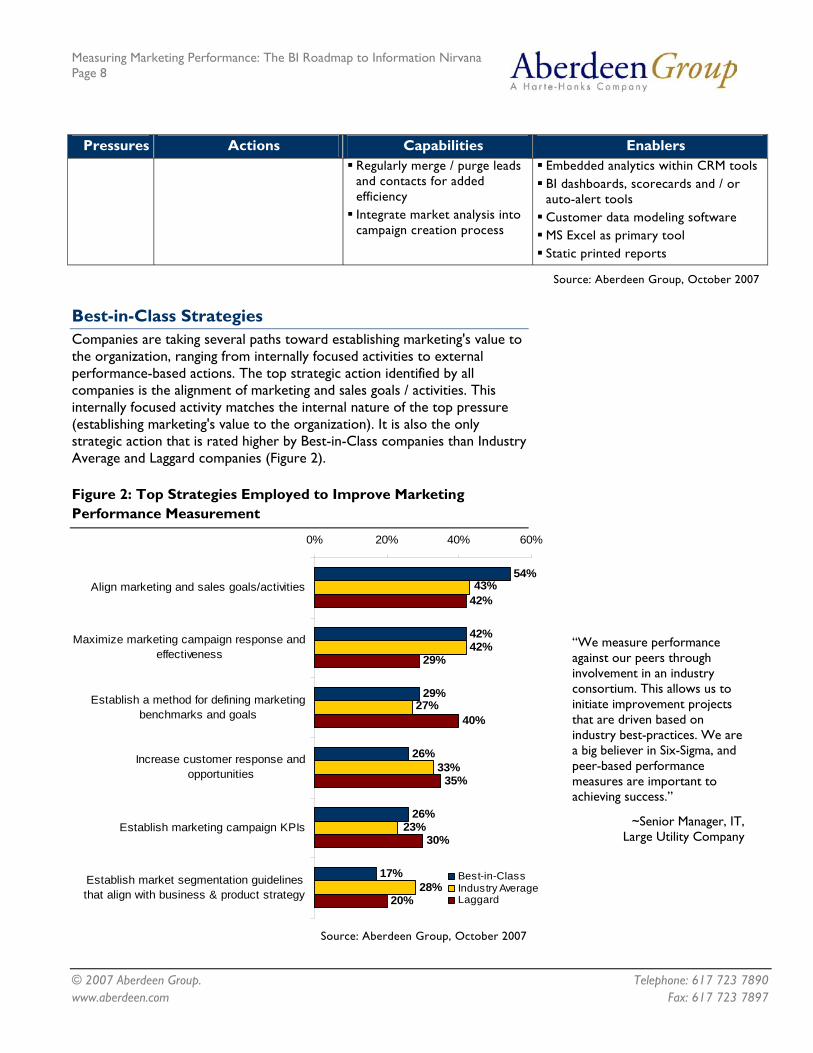
Best-in-Class Strategies Companies are taking several paths toward establishing marketing's value to the organization, ranging from internally focused activities to external performance-based actions. The top strategic action identified by all companies is the alignment of marketing and sales goals / activities. This internally focused activity matches the internal nature of the top pressure (establishing marketing's value to the organization). It is also the only strategic action that is rated higher by Best-in-Class companies than Industry Average and Laggard companies (Figure 2).
Figure 2: Top Strategies Employed to Improve Marketing Performance Measurement
17%28%
42%
29%
40%
35%
30%
20%
54%
42%
29%
26%
26%
43%
42%
27%
33%
23%
0% 20% 40% 60%
Align marketing and sales goals/activities
Maximize marketing campaign response andeffectiveness
Establish a method for defining marketingbenchmarks and goals
Increase customer response andopportunities
Establish marketing campaign KPIs
Establish market segmentation guidelinesthat align with business & product strategy
Best-in-ClassIndustry AverageLaggard
Source: Aberdeen Group, October 2007
“We measure performance against our peers through involvement in an industry consortium. This allows us to initiate improvement projects that are driven based on industry best-practices. We are a big believer in Six-Sigma, and peer-based performance measures are important to achieving success.”
~Senior Manager, IT, Large Utility Company
www.aberdeen.com Fax: 617 723 7897
Measuring Marketing Performance: The BI Roadmap to Information Nirvana Page 9
© 2007 Aberdeen Group. Telephone: 617 723 7890 www.aberdeen.com Fax: 617 723 7897
There is agreement among all respondents on the top strategic action, but a divergence of views on the rest of the top strategies reported. Laggard companies seem to be in greater need of establishing a process or method for defining goals than Best-in-Class and Industry Average organizations. This would suggest a greater need for basic education, something that is supported by the large number of Laggard companies (75%) reporting that they do not measure key marketing performance metrics.
Aberdeen Insights - Strategy Typically, companies take a very CRM-centric view of marketing performance, and fail to address the measurement of strategic and product-oriented activities. One of the Best-in-Class survey respondents described a process that includes analysis of data across a wide variety of activities, not just campaign response or advertising pull (see the detailed Case Study in Chapter Two of this report).
True alignment between marketing and sales goals / activities occurs when marketing and sales professionals can collaborate together to understand customers' needs, segmentation, and buying patterns, combined with an analysis of sales force effectiveness. The speed at which a marketing group can obtain performance information has a lot to do with its ability to affect sales goals. Sixty-one percent (61%) of Best-in-Class companies have experienced an improvement in time-to-information as compared to 32% of Industry Average, and 14% of Laggard companies.
In the next chapter, we will see what the top performers are doing to achieve these gains.
Measuring Marketing Performance: The BI Roadmap to Information Nirvana Page 10
© 2007 Aberdeen Group. Telephone: 617 723 7890
Chapter Two: Benchmarking Requirements for Success
Integration of all types of marketing performance data enhances an organizations ability to measure performance, and improve future activity. This is not always confined to future marketing campaign activity, but also drives marketing messages, product development and positioning, and strategic marketing spend decisions.
Take, for example, the case of a small medical device manufacturer that has recently merged with a large industry player.
Case Study - Large Medical Device Manufacturer In the medical device marketplace, a poor decision can result in the loss of millions of dollars and thousands of work hours. To merely measure results of marketing activity is not enough. As stated by a senior product engineering executive, "Prior to merging with [our much larger parent] we were primarily investigating tactical data about our marketing results. We did not have the bandwidth, resources, or savvy to perform the type of analysis we do today. This not to say that we couldn't have done it, we just didn't prioritize it like we are now."
Fast Facts
√ 45% of Best-in-Class companies obtain marketing performance information within the hour or less from actual business activity; compared to 34% of Industry Average and 15% of Laggard organizations
√ 31% of CMOs still rely on MS Excel and / or static reporting for access to marketing performance measurement information
After the merger, a wealth of new upstream marketing performance measurement capabilities - measurement of information that affects marketing performance prior to any tactical marketing activity taking place - has become accessible. The marketing teams involved, from product marketing / development to field marketing management, are taking full advantage.
In addition to measurement of marketing response and advertising effectiveness, the company is also focusing on customer intelligence. This has encompassed several activities around profiling and surveying their customers - the physicians who influence and make decisions about the medical procedures that drive utilization of medical devices that the company sells. The data collected ranges across several specific areas where marketers are seeking new understanding:
• Medical treatment trend analysis - to determine the growth rates of conditions and diagnoses that drive procedure orders utilizing the medical device products.
• Medical research findings - to determine the most common and recommended procedure and treatment plans for related diagnoses that drive utilization of the medical device products.
• Physician education and awareness surveys - to determine the level of awareness and knowledge in the marketplace for use of the medical device products.
www.aberdeen.com Fax: 617 723 7897
Measuring Marketing Performance: The BI Roadmap to Information Nirvana Page 11
© 2007 Aberdeen Group. Telephone: 617 723 7890 www.aberdeen.com Fax: 617 723 7897
Case Study - Large Medical Device Manufacturer • Customer segmentation analysis - to determine the correct
messaging for influencers (physicians) and purchasers (finance, chief of medicine).
Prior to the launch of a marketing campaign, performance metrics are determined based on collection of the aforementioned data, and combined with correlation to prior activity. The results of the new capabilities are clear. "We now are able to develop products and market them more effectively, with higher predictability, than ever before. The marketing activities after the launch tend to focus more on refinement, and not so much on re-inventing the campaign. This is a more efficient approach, and reduces the risk involved with such high up-front investments," said the senior product engineering executive.
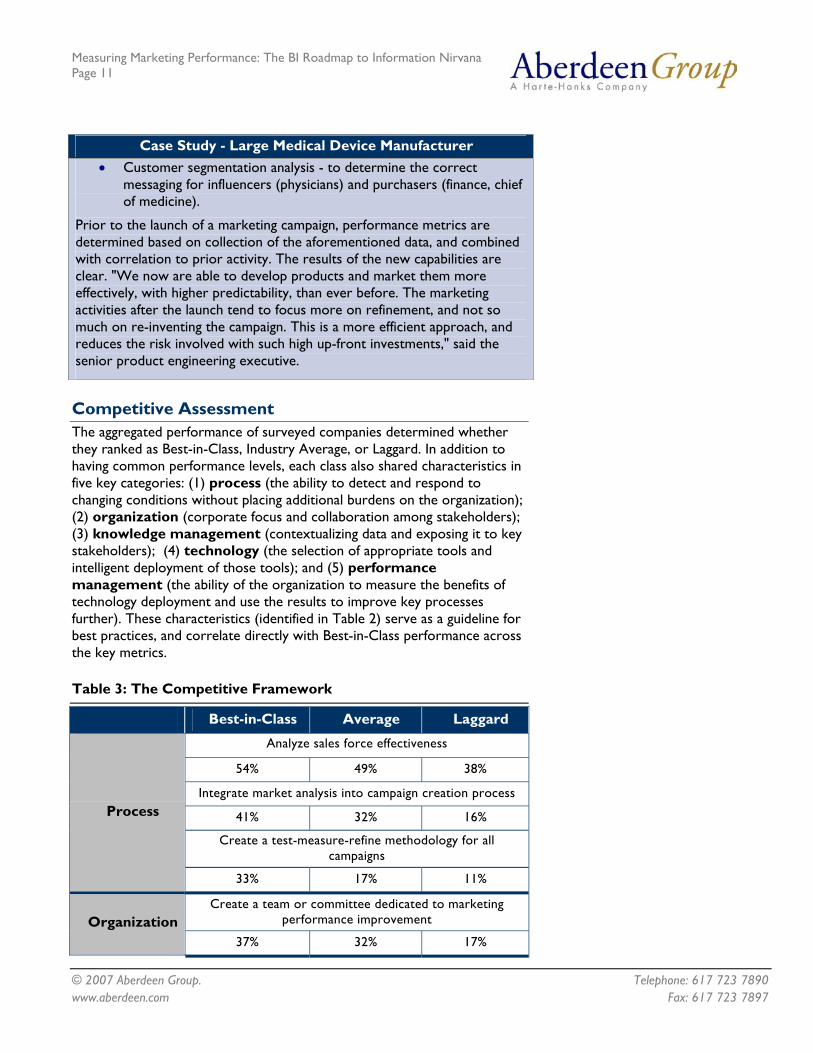
Competitive Assessment The aggregated performance of surveyed companies determined whether they ranked as Best-in-Class, Industry Average, or Laggard. In addition to having common performance levels, each class also shared characteristics in five key categories: (1) process (the ability to detect and respond to changing conditions without placing additional burdens on the organization); (2) organization (corporate focus and collaboration among stakeholders); (3) knowledge management (contextualizing data and exposing it to key stakeholders); (4) technology (the selection of appropriate tools and intelligent deployment of those tools); and (5) performance management (the ability of the organization to measure the benefits of technology deployment and use the results to improve key processes further). These characteristics (identified in Table 2) serve as a guideline for best practices, and correlate directly with Best-in-Class performance across the key metrics.
Table 3: The Competitive Framework
Best-in-Class Average Laggard
Analyze sales force effectiveness
54% 49% 38%
Integrate market analysis into campaign creation process
41% 32% 16%
Create a test-measure-refine methodology for all campaigns
Process
33% 17% 11%
Create a team or committee dedicated to marketing performance improvement Organization
37% 32% 17%
Measuring Marketing Performance: The BI Roadmap to Information Nirvana Page 12
© 2007 Aberdeen Group. Telephone: 617 723 7890 www.aberdeen.com Fax: 617 723 7897
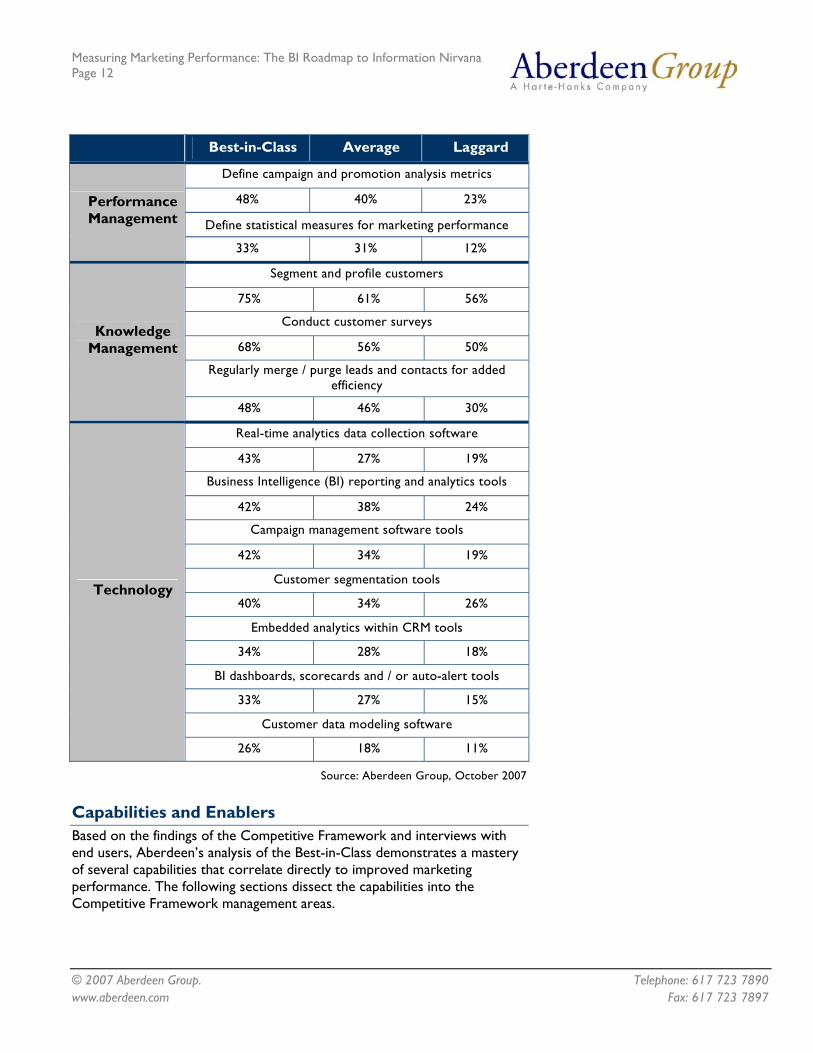
Best-in-Class Average Laggard
Define campaign and promotion analysis metrics
48% 40% 23%
Define statistical measures for marketing performance
Performance Management
33% 31% 12%
Segment and profile customers
75% 61% 56%
Conduct customer surveys
68% 56% 50%
Regularly merge / purge leads and contacts for added efficiency
Knowledge Management
48% 46% 30%
Real-time analytics data collection software
43% 27% 19%
Business Intelligence (BI) reporting and analytics tools
42% 38% 24%
Campaign management software tools
42% 34% 19%
Customer segmentation tools
40% 34% 26%
Embedded analytics within CRM tools
34% 28% 18%
BI dashboards, scorecards and / or auto-alert tools
33% 27% 15%
Customer data modeling software
Technology
26% 18% 11%
Source: Aberdeen Group, October 2007
Capabilities and Enablers Based on the findings of the Competitive Framework and interviews with end users, Aberdeen’s analysis of the Best-in-Class demonstrates a mastery of several capabilities that correlate directly to improved marketing performance. The following sections dissect the capabilities into the Competitive Framework management areas.
Measuring Marketing Performance: The BI Roadmap to Information Nirvana Page 13
© 2007 Aberdeen Group. Telephone: 617 723 7890
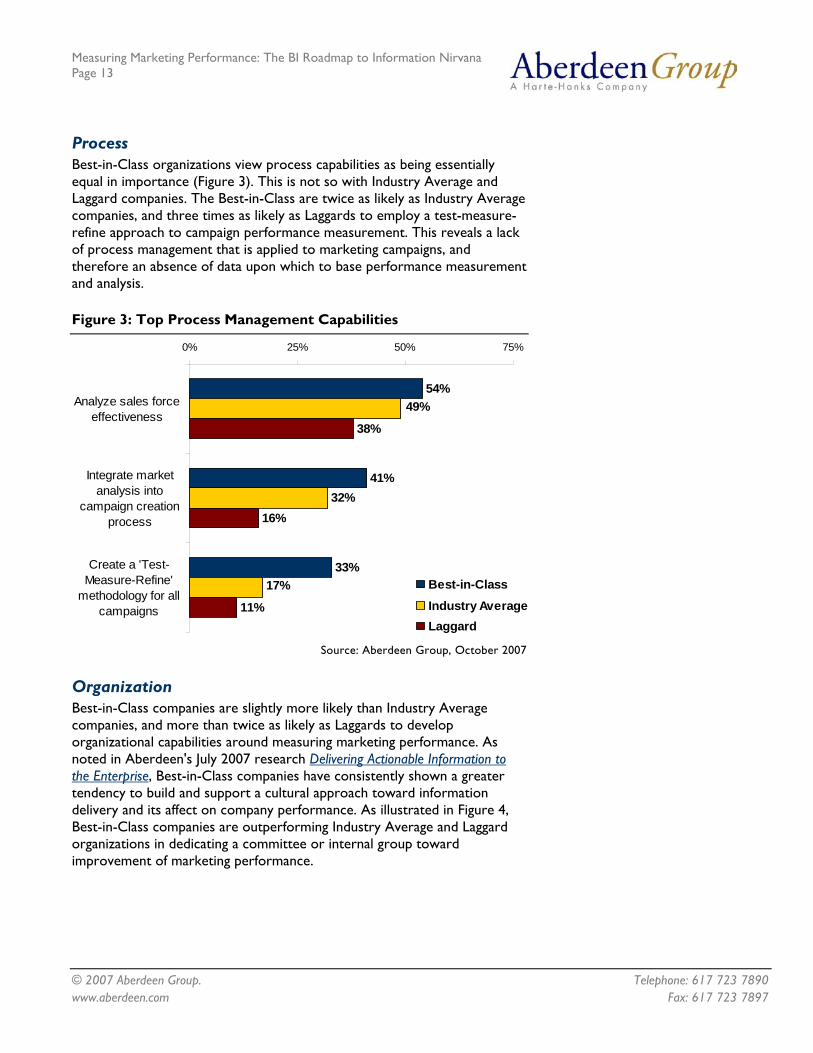
Process Best-in-Class organizations view process capabilities as being essentially equal in importance (Figure 3). This is not so with Industry Average and Laggard companies. The Best-in-Class are twice as likely as Industry Average companies, and three times as likely as Laggards to employ a test-measure-refine approach to campaign performance measurement. This reveals a lack of process management that is applied to marketing campaigns, and therefore an absence of data upon which to base performance measurement and analysis.
Figure 3: Top Process Management Capabilities
38%
16%
11%
54%
41%
33%
49%
32%
17%
0% 25% 50% 75%
Analyze sales forceeffectiveness
Integrate marketanalysis into
campaign creationprocess
Create a 'Test-Measure-Refine'
methodology for allcampaigns
Best-in-Class
Industry AverageLaggard
Source: Aberdeen Group, October 2007
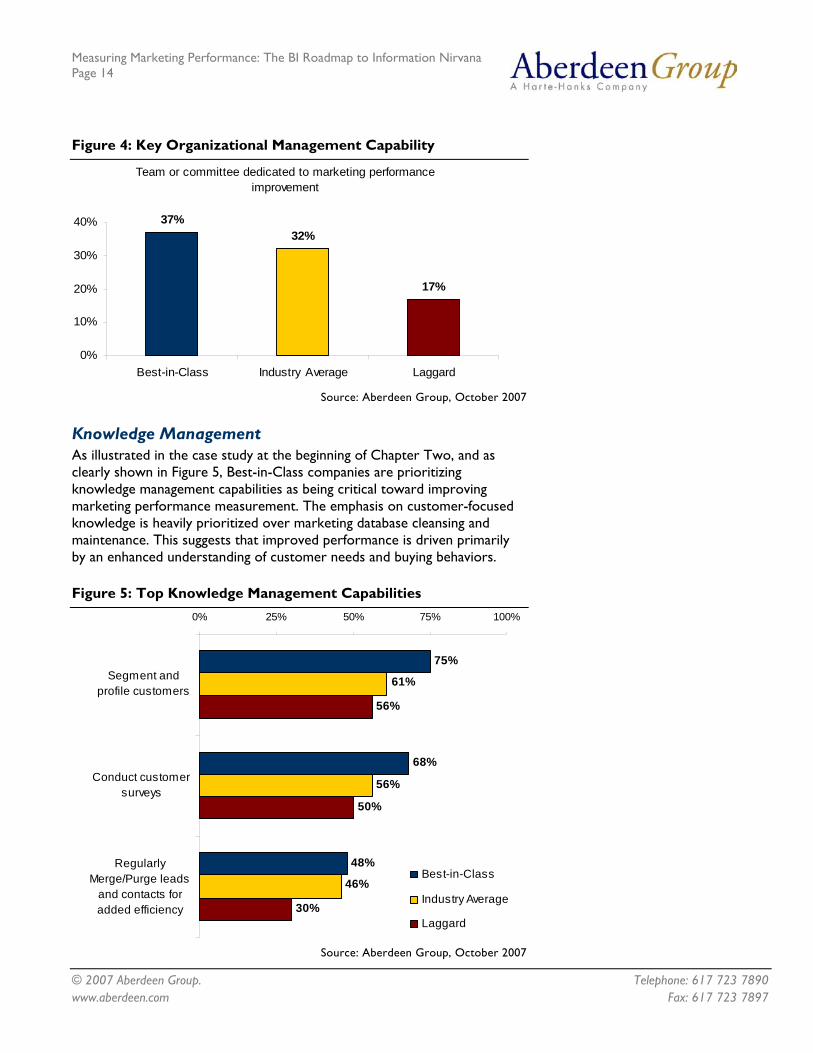
Organization Best-in-Class companies are slightly more likely than Industry Average companies, and more than twice as likely as Laggards to develop organizational capabilities around measuring marketing performance. As noted in Aberdeen's July 2007 research Delivering Actionable Information to the Enterprise, Best-in-Class companies have consistently shown a greater tendency to build and support a cultural approach toward information delivery and its affect on company performance. As illustrated in Figure 4, Best-in-Class companies are outperforming Industry Average and Laggard organizations in dedicating a committee or internal group toward improvement of marketing performance.
www.aberdeen.com Fax: 617 723 7897
Measuring Marketing Performance: The BI Roadmap to Information Nirvana Page 14
© 2007 Aberdeen Group. Telephone: 617 723 7890
Figure 4: Key Organizational Management Capability
Team or committee dedicated to marketing performance improvement
37%32%
17%
0%
10%
20%
30%
40%
Best-in-Class Industry Average Laggard Source: Aberdeen Group, October 2007
Knowledge Management As illustrated in the case study at the beginning of Chapter Two, and as clearly shown in Figure 5, Best-in-Class companies are prioritizing knowledge management capabilities as being critical toward improving marketing performance measurement. The emphasis on customer-focused knowledge is heavily prioritized over marketing database cleansing and maintenance. This suggests that improved performance is driven primarily by an enhanced understanding of customer needs and buying behaviors.
Figure 5: Top Knowledge Management Capabilities
56%
50%
30%
75%
68%
48%
61%
56%
46%
0% 25% 50% 75% 100%
Segment andprofile customers
Conduct customersurveys
RegularlyMerge/Purge leads
and contacts foradded efficiency
Best-in-Class
Industry Average
Laggard
Source: Aberdeen Group, October 2007
www.aberdeen.com Fax: 617 723 7897
Measuring Marketing Performance: The BI Roadmap to Information Nirvana Page 15
© 2007 Aberdeen Group. Telephone: 617 723 7890
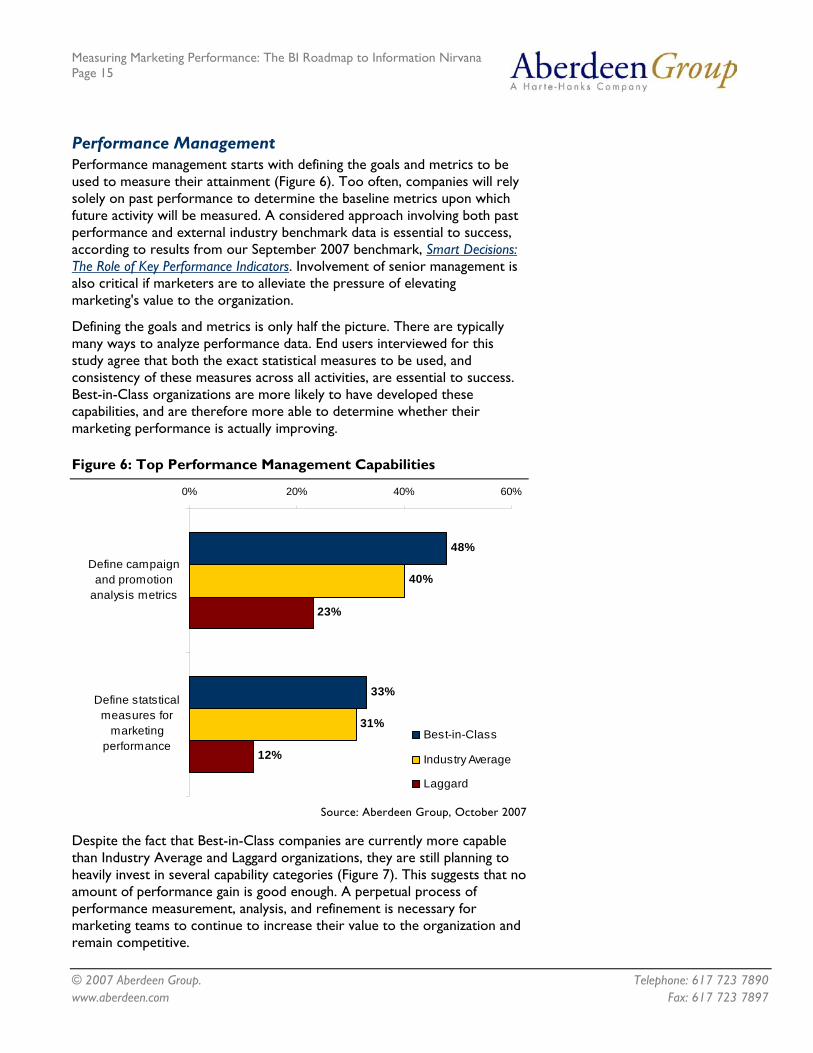
Performance Management Performance management starts with defining the goals and metrics to be used to measure their attainment (Figure 6). Too often, companies will rely solely on past performance to determine the baseline metrics upon which future activity will be measured. A considered approach involving both past performance and external industry benchmark data is essential to success, according to results from our September 2007 benchmark, Smart Decisions: The Role of Key Performance Indicators. Involvement of senior management is also critical if marketers are to alleviate the pressure of elevating marketing's value to the organization.
Defining the goals and metrics is only half the picture. There are typically many ways to analyze performance data. End users interviewed for this study agree that both the exact statistical measures to be used, and consistency of these measures across all activities, are essential to success. Best-in-Class organizations are more likely to have developed these capabilities, and are therefore more able to determine whether their marketing performance is actually improving.
Figure 6: Top Performance Management Capabilities
23%
12%
48%
33%
40%
31%
0% 20% 40% 60%
Define campaignand promotion
analysis metrics
Define statsticalmeasures for
marketingperformance
Best-in-Class
Industry Average
Laggard
Source: Aberdeen Group, October 2007
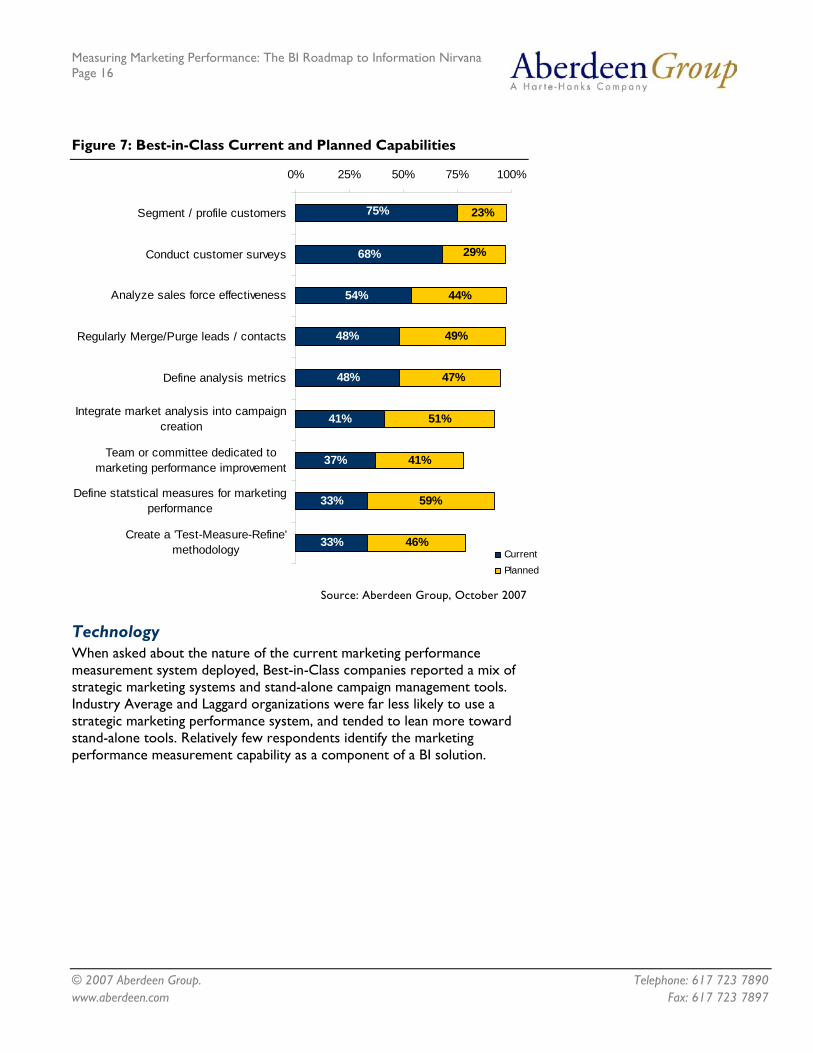
Despite the fact that Best-in-Class companies are currently more capable than Industry Average and Laggard organizations, they are still planning to heavily invest in several capability categories (Figure 7). This suggests that no amount of performance gain is good enough. A perpetual process of performance measurement, analysis, and refinement is necessary for marketing teams to continue to increase their value to the organization and remain competitive.
www.aberdeen.com Fax: 617 723 7897
Measuring Marketing Performance: The BI Roadmap to Information Nirvana Page 16
© 2007 Aberdeen Group. Telephone: 617 723 7890
Figure 7: Best-in-Class Current and Planned Capabilities
41%
37%
33%
33%
51%
41%
59%
46%
75%
68%
54%
48%
48%
23%
29%
44%
49%
47%
0% 25% 50% 75% 100%
Segment / profile customers
Conduct customer surveys
Analyze sales force effectiveness
Regularly Merge/Purge leads / contacts
Define analysis metrics
Integrate market analysis into campaigncreation
Team or committee dedicated tomarketing performance improvement
Define statstical measures for marketingperformance
Create a 'Test-Measure-Refine'methodology Current
Planned
Source: Aberdeen Group, October 2007
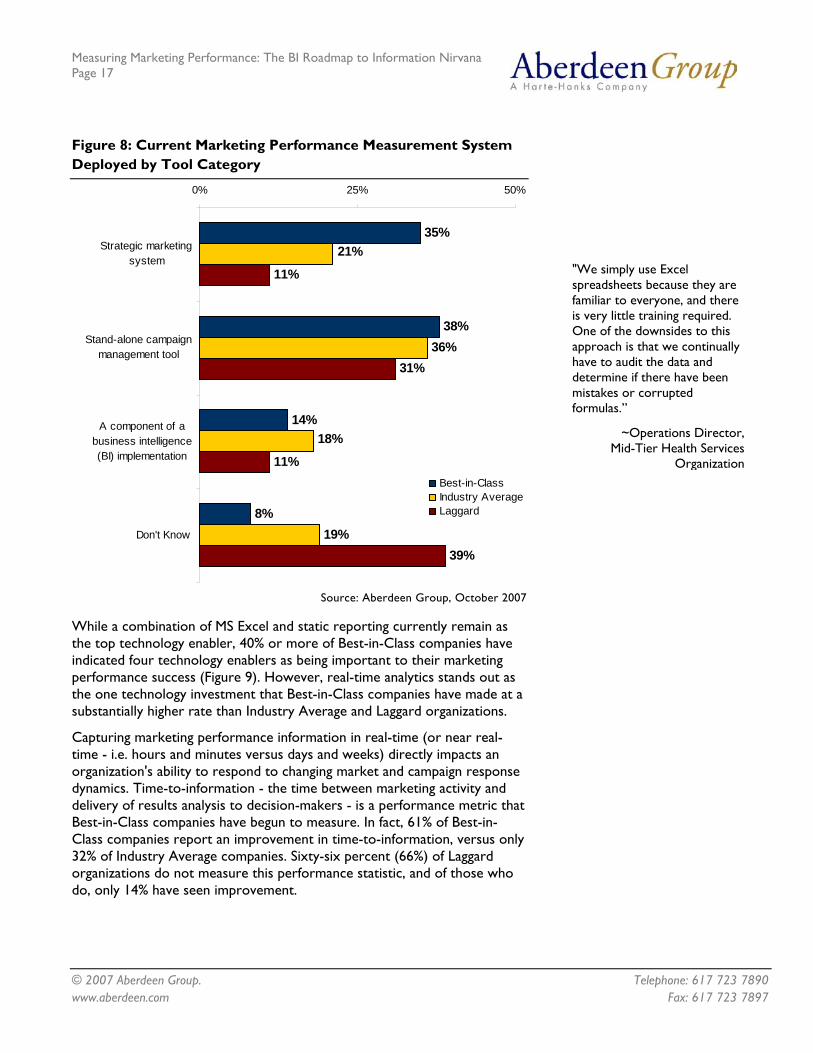
Technology When asked about the nature of the current marketing performance measurement system deployed, Best-in-Class companies reported a mix of strategic marketing systems and stand-alone campaign management tools. Industry Average and Laggard organizations were far less likely to use a strategic marketing performance system, and tended to lean more toward stand-alone tools. Relatively few respondents identify the marketing performance measurement capability as a component of a BI solution.
www.aberdeen.com Fax: 617 723 7897
Measuring Marketing Performance: The BI Roadmap to Information Nirvana Page 17
© 2007 Aberdeen Group. Telephone: 617 723 7890
Figure 8: Current Marketing Performance Measurement System Deployed by Tool Category
11%
31%
11%
39%
8%
14%
38%
35%
19%
18%
36%
21%
0% 25% 50%
Strategic marketingsystem
Stand-alone campaignmanagement tool
A component of abusiness intelligence(BI) implementation
Don't Know
Best-in-ClassIndustry AverageLaggard
"We simply use Excel spreadsheets because they are familiar to everyone, and there is very little training required. One of the downsides to this approach is that we continually have to audit the data and determine if there have been mistakes or corrupted formulas.”
~Operations Director, Mid-Tier Health Services
Organization
Source: Aberdeen Group, October 2007
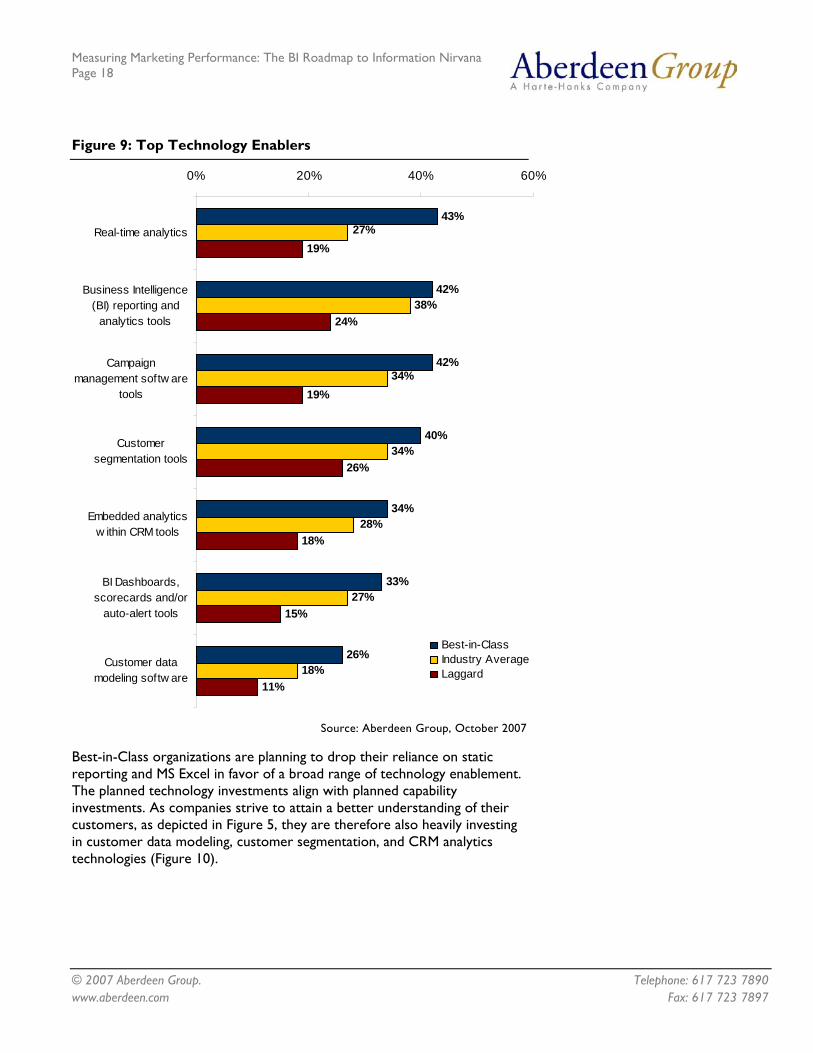
While a combination of MS Excel and static reporting currently remain as the top technology enabler, 40% or more of Best-in-Class companies have indicated four technology enablers as being important to their marketing performance success (Figure 9). However, real-time analytics stands out as the one technology investment that Best-in-Class companies have made at a substantially higher rate than Industry Average and Laggard organizations.
Capturing marketing performance information in real-time (or near real-time - i.e. hours and minutes versus days and weeks) directly impacts an organization's ability to respond to changing market and campaign response dynamics. Time-to-information - the time between marketing activity and delivery of results analysis to decision-makers - is a performance metric that Best-in-Class companies have begun to measure. In fact, 61% of Best-in-Class companies report an improvement in time-to-information, versus only 32% of Industry Average companies. Sixty-six percent (66%) of Laggard organizations do not measure this performance statistic, and of those who do, only 14% have seen improvement.
www.aberdeen.com Fax: 617 723 7897
Measuring Marketing Performance: The BI Roadmap to Information Nirvana Page 18
© 2007 Aberdeen Group. Telephone: 617 723 7890
Figure 9: Top Technology Enablers
33%
26%
27%
18%
19%
24%
19%
26%
18%
15%
11%
43%
42%
42%
40%
34%
27%
38%
34%
34%
28%
0% 20% 40% 60%
Real-time analytics
Business Intelligence(BI) reporting and
analytics tools
Campaignmanagement softw are
tools
Customersegmentation tools
Embedded analyticsw ithin CRM tools
BI Dashboards,scorecards and/or
auto-alert tools
Customer datamodeling softw are
Best-in-ClassIndustry AverageLaggard
Source: Aberdeen Group, October 2007
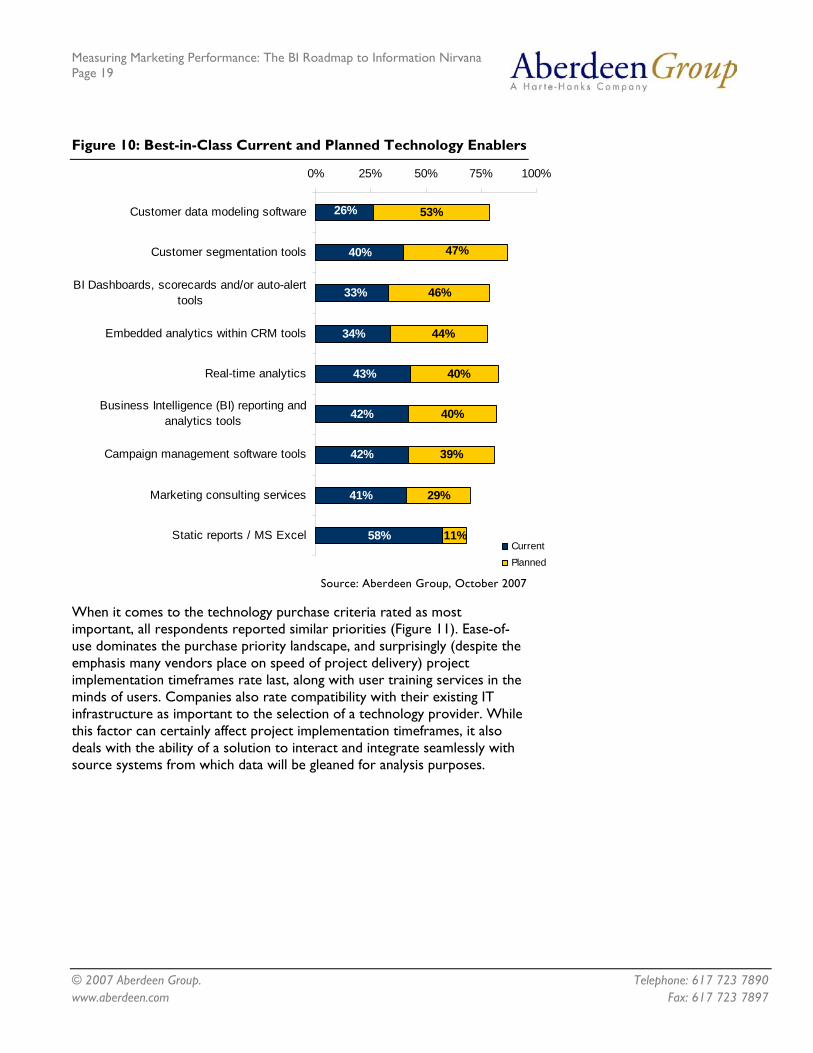
Best-in-Class organizations are planning to drop their reliance on static reporting and MS Excel in favor of a broad range of technology enablement. The planned technology investments align with planned capability investments. As companies strive to attain a better understanding of their customers, as depicted in Figure 5, they are therefore also heavily investing in customer data modeling, customer segmentation, and CRM analytics technologies (Figure 10).
www.aberdeen.com Fax: 617 723 7897
Measuring Marketing Performance: The BI Roadmap to Information Nirvana Page 19
© 2007 Aberdeen Group. Telephone: 617 723 7890
Figure 10: Best-in-Class Current and Planned Technology Enablers
42%
42%
41%
58%
40%
39%
29%
11%
26%
40%
33%
34%
43%
53%
47%
46%
44%
40%
0% 25% 50% 75% 100%
Customer data modeling software
Customer segmentation tools
BI Dashboards, scorecards and/or auto-alerttools
Embedded analytics within CRM tools
Real-time analytics
Business Intelligence (BI) reporting andanalytics tools
Campaign management software tools
Marketing consulting services
Static reports / MS ExcelCurrentPlanned
Source: Aberdeen Group, October 2007
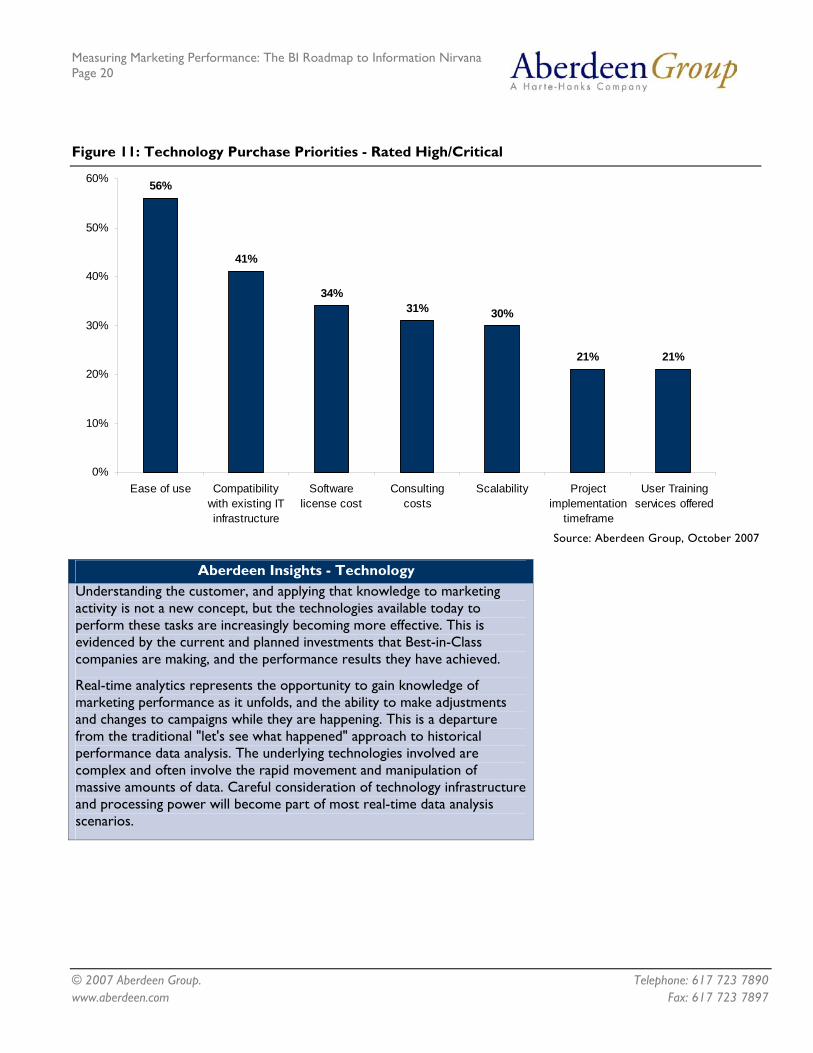
When it comes to the technology purchase criteria rated as most important, all respondents reported similar priorities (Figure 11). Ease-of-use dominates the purchase priority landscape, and surprisingly (despite the emphasis many vendors place on speed of project delivery) project implementation timeframes rate last, along with user training services in the minds of users. Companies also rate compatibility with their existing IT infrastructure as important to the selection of a technology provider. While this factor can certainly affect project implementation timeframes, it also deals with the ability of a solution to interact and integrate seamlessly with source systems from which data will be gleaned for analysis purposes.
www.aberdeen.com Fax: 617 723 7897
Measuring Marketing Performance: The BI Roadmap to Information Nirvana Page 20
© 2007 Aberdeen Group. Telephone: 617 723 7890
Figure 11: Technology Purchase Priorities - Rated High/Critical
56%
41%
34%31% 30%
21% 21%
0%
10%
20%
30%
40%
50%
60%
Ease of use Compatibilitywith existing ITinfrastructure
Softwarelicense cost
Consultingcosts
Scalability Projectimplementation
timeframe
User Trainingservices offered
Source: Aberdeen Group, October 2007
Aberdeen Insights - Technology Understanding the customer, and applying that knowledge to marketing activity is not a new concept, but the technologies available today to perform these tasks are increasingly becoming more effective. This is evidenced by the current and planned investments that Best-in-Class companies are making, and the performance results they have achieved.
Real-time analytics represents the opportunity to gain knowledge of marketing performance as it unfolds, and the ability to make adjustments and changes to campaigns while they are happening. This is a departure from the traditional "let's see what happened" approach to historical performance data analysis. The underlying technologies involved are complex and often involve the rapid movement and manipulation of massive amounts of data. Careful consideration of technology infrastructure and processing power will become part of most real-time data analysis scenarios.
www.aberdeen.com Fax: 617 723 7897
Measuring Marketing Performance: The BI Roadmap to Information Nirvana Page 21
© 2007 Aberdeen Group. Telephone: 617 723 7890
Chapter Three: Required Actions
Fast Facts
√ 43% of Best-in-Class companies report that their development budget for marketing analytics capability is 5% or more of their total IT budget, compared to 30% of Industry Average companies and 16% of Laggards
√ 31% of Best-in-Class companies have reported a 6% or higher growth in their annual marketing analytics budget, compared to 25% of Industry Average companies and 13% of Laggards
Whether a company is trying to improve its measurement of marketing performance from Laggard to Industry Average, or Industry Average to Best-in-Class, the following actions will help spur necessary improvements:
Laggard Steps to Success Establishing marketing's value to the organization is by far the top pressure Laggard organizations are feeling. Aberdeen research has shown that there are three definite actions that laggards can take to alleviate this challenge:
• Focus on the alignment of sales goals with marketing activities. This is often an area where organizations fall down. While the strategies - and the strategists who create them - are sound, the ability to execute is lacking. This disconnect is common, as reported by several companies interviewed by Aberdeen throughout the research process. While this is the top strategy reported by Laggard companies, more than half are not taking this direction. Determine if your company really has the resources to execute on current strategies. If not, consider investment in the necessary resources, or revision of current strategies to reflect current capabilities.
• Investigate the effectiveness of campaign response. While the percentage or raw number of responses may be increasing - ask whether they are the right targets. What are the capabilities for measuring the quality of responses? Laggard companies differed greatly from the Best-in-Class and Industry Average: the ability to maximize response once it comes in is reflected directly in the performance metrics that determine Best-in-Class status.
• Integrate a culture of analytical and statistical measurement into marketing activities at the outset. Laggards reported very low levels of organizational activity, and have not established solid measurement techniques such as "test-measure-refine" or the definition of statistical measures. Best-in-Class organizations are doing this, and often at three times the rate of Laggard companies.
Industry Average Steps to Success Industry Average companies rate "accountability - proof of results for the justification of next year's marketing budget" as the top pressure driving the need for improved marketing performance measurement. The following actions can alleviate this challenge:
• Establish marketing goals and KPIs up-front. It is difficult to manage what you don't measure, and 75% of Industry Average companies do not rate this step as a top strategic action. As marketing activities unfold, and managers seek to show positive results to justify the following period's budget, an accurate set of corporate
www.aberdeen.com Fax: 617 723 7897
Measuring Marketing Performance: The BI Roadmap to Information Nirvana Page 22
© 2007 Aberdeen Group. Telephone: 617 723 7890
performance expectations will become critical. If the measures have not been established up-front, the task of justifying future spend becomes far more difficult.
• Consider moving away from stand-alone marketing campaign management systems, and more towards strategic marketing solutions. This approach encompasses a broader set of information, and enables a greater alignment of strategic goals, and all of the activities that marketing employs to affect performance. If performance measurement is solely a component of a BI solution, this may also not be the best path to take.
Best-in-Class Steps to Success While Best-in-Class companies have achieved significant performance increases, there are still opportunities to improve and innovate:
• Focus additional effort on defining statistical measures for ascertaining marketing performance. Only 33% of Best-in-Class companies rate this as a top capability, leaving two-thirds with an opportunity for improvement. Advanced methods include regression and predictive analysis to assist with elevating efficiencies through greater understanding of response tendencies and improved capabilities with risk aversion.
• Be aware of the difference between vendor hype and Best-in-Class purchase priorities. Ease-of-use is clearly the most important aspect of any marketing performance measurement solution. Vendors will often attempt to highlight their own major strength as being the most important consideration. Often times the discussion revolves around implementation timeframes and enterprise scalability. While these can be important issues, they tend to inject fear and doubt into the process, and do not address end-user needs.
Aberdeen Insights - Summary The act of measuring marketing performance is not merely a process of collecting response data and measuring its level in comparison to previous activity. Best-in-Class organizations have shown it to be more to do with closing the gap between marketing strategy and execution of marketing programs and campaigns. Marketing departments are clearly struggling to justify their value to the organization. This is often caused by a lack of hard evidence that marketing spend is being effectively deployed. The old saying goes: half of marketing investment is effective - we just don't know which half. To justify marketing's value, many Best-in-Class companies have begun to look toward the development of new capabilities to implement strategic actions targeted at closing the information gap around performance measurement. The more that marketing organizations can develop Best-in-Class capabilities, and leverage technologies and services that enable them, the faster information nirvana can be achieved.
www.aberdeen.com Fax: 617 723 7897
Measuring Marketing Performance: The BI Roadmap to Information Nirvana Page 23
© 2007 Aberdeen Group. Telephone: 617 723 7890
Appendix A: Research Methodology
Between August and September 2007, Aberdeen examined the use, the experiences, and the intentions of more than 420 enterprises using marketing performance measurement technologies in a diverse set of enterprises.
Study Focus
Responding executives completed an online survey that included questions designed to determine the following:
√ The degree to which marketing performance measurement is deployed and the financial and operational implications of the technology
√ The existence and effectiveness of existing marketing performance measurement capabilities
√ Current and planned use of technologies and services that enable marketing performance measurement
√ The benefits, if any, that have been derived from marketing performance measurement initiatives
Aberdeen supplemented this online survey effort with telephone interviews with select survey respondents, gathering additional information on respondent strategies, experiences, and results.
Responding enterprises included the following:
• Job title / function: The research sample included respondents with the following job titles: marketing (47%); sales (13%); IT manager or staff (8%); finance (7%); and senior management (23%).
• Industry: The research sample included respondents from several industries. High technology (31%) and finance / banking (13%) were the largest segments of the sample.
• Geography: The majority of respondents (66%) were from North America. Remaining respondents were from Europe (18%) and the Asia-Pacific region (11%).
• Company size: Eighteen percent (18%) of respondents were from large enterprises (annual revenues above US $1 billion); 27% were from midsize enterprises (annual revenues between $50 million and $1 billion); and 55% of respondents were from small businesses (annual revenues of $50 million or less).
• Headcount: Forty-seven percent (47%) of respondents were from small companies (headcount between 1 and 99 employees); 26% were from midsize enterprises (headcount between 100 and 999 employees); and 27% of respondents were from large businesses (headcount greater than 1,000 employees).
Solution providers recognized as sponsors of this report were solicited after the fact and had no substantive influence on the direction of the research or resulting findings and published report. Their sponsorship has made it possible for Aberdeen Group to make these findings available to readers at no charge.
www.aberdeen.com Fax: 617 723 7897
Measuring Marketing Performance: The BI Roadmap to Information Nirvana Page 24
© 2007 Aberdeen Group. Telephone: 617 723 7890
Table 4: The PACE Framework Key
Overview Aberdeen applies a methodology to benchmark research that evaluates the business pressures, actions, capabilities, and enablers (PACE) that indicate corporate behavior in specific business processes. These terms are defined as follows: Pressures — external forces that impact an organization’s market position, competitiveness, or business operations (e.g., economic, political and regulatory, technology, changing customer preferences, competitive) Actions — the strategic approaches that an organization takes in response to industry pressures (e.g., align the corporate business model to leverage industry opportunities, such as product / service strategy, target markets, financial strategy, go-to-market, and sales strategy) Capabilities — the business process competencies required to execute corporate strategy (e.g., skilled people, brand, market positioning, viable products / services, ecosystem partners, financing) Enablers — the key functionality of technology solutions required to support the organization’s enabling business practices (e.g., development platform, applications, network connectivity, user interface, training and support, partner interfaces, data cleansing, and management)
Source: Aberdeen Group, October 2007
Table 5: The Competitive Framework Key
Overview
www.aberdeen.com Fax: 617 723 7897
The Aberdeen Competitive Framework defines enterprises as falling into one of the following three levels of practices and performance: Best-in-Class (20%) — Practices that are the best currently being employed and are significantly superior to the Industry Average, and result in the top industry performance. Industry Average (50%) — Practices that represent the average or norm, and result in average industry performance. Laggards (30%) — Practices that are significantly behind the average of the industry, and result in below average performance.
In the following categories: Process — What is the scope of process standardization? What is the efficiency and effectiveness of this process? Organization — How is your company currently organized to manage and optimize this particular process? Knowledge — What visibility do you have into key data and intelligence required to manage this process? Technology — What level of automation have you used to support this process? How is this automation integrated and aligned? Performance — What do you measure? How frequently? What’s your actual performance?
Source: Aberdeen Group, October 2007
Table 6: The Relationship Between PACE and the Competitive Framework
PACE and the Competitive Framework – How They Interact Aberdeen research indicates that companies that identify the most impactful pressures and take the most transformational and effective actions are most likely to achieve superior performance. The level of competitive performance that a company achieves is strongly determined by the PACE choices that they make and how well they execute those decisions.
Source: Aberdeen Group, October 2007
Measuring Marketing Performance: The BI Roadmap to Information Nirvana Page 25
© 2007 Aberdeen Group. Telephone: 617 723 7890 www.aberdeen.com Fax: 617 723 7897
Appendix B: Related Aberdeen Research
Related Aberdeen research that forms a companion or reference to this report include:
• Is the BI Market a Target for ERP Vendors? May, 2007
• Business Intelligence for All May, 2007
• “On-Demand” Is Not Far Behind BI on the Technology Wish List June, 2007
• Data Management 2.0: Making Sense of Unstructured Data July 2007
• Delivering Actionable Information to the Enterprise: Does On-Demand Solve the Skill Set Shortage? July 2007
• On-Demand BI: Not Just for SMB August 2007
• Serving the Underserved: Is On-Demand BI the Answer? August 2007
• Enterprise BI: Comparing the BI Giants September 2007
• Smart Decisions: The Role of Key Performance Indicators September, 2007
Information on these and any other Aberdeen publications can be found at www.Aberdeen.com.
Author: David Hatch, Research Director, Business Intelligence, [email protected]
Founded in 1988, Aberdeen Group is the technology- driven research destination of choice for the global business executive. Aberdeen Group has 400,000 research members in over 36 countries around the world that both participate in and direct the most comprehensive technology-driven value chain research in the market. Through its continued fact-based research, benchmarking, and actionable analysis, Aberdeen Group offers global business and technology executives a unique mix of actionable research, KPIs, tools, and services. This document is the result of primary research performed by Aberdeen Group. Aberdeen Group's methodologies provides for objective fact based research and represent the best analysis available at the time of publication. Unless otherwise noted, the entire contents of this publication are copyrighted by Aberdeen Group, Inc. and may not be reproduced, distributed, archived, or transmitted in any form or by any means without prior written consent by Aberdeen Group, Inc.
As a Harte-Hanks Company, Aberdeen plays a key role of putting content in context for the global direct and targeted marketing company. Aberdeen's analytical and independent view of the "customer optimization" process of Harte-Hanks (Information – Opportunity – Insight – Engagement – Interaction) extends the client value and accentuates the strategic role Harte-Hanks brings to the market. For additional information, visit Aberdeen http://www.aberdeen.com or call (617) 723-7890, or to learn more about Harte-Hanks, call (800) 456-9748 or go to http://www.harte-hanks.com
091707a