measuring offshorability: a survey approach - princeton.edu · alternative measures of...
TRANSCRIPT
Alternative Measures of Offshorability: A Survey Approach
by
Alan S. Blinder, Princeton University Alan B. Krueger, Princeton University
CEPS Working Paper No. 190
August 2009
Acknowledgments: A preliminary version of this paper was presented at the Princeton Data Improvement Initiative conference, October 3-4, 2008. We gratefully acknowledge extraordinary help from Ed Freeland and the staff of Princeton’s Survey Research Center, Jeff Kerwin and the staff of Westat, and our fine research assistant, Armando Asuncion-Cruz. We are also grateful for financial support from Princeton’s Center for Economic Policy Studies and Industrial Relations Section.

1
This paper reports on a pilot study of the use of conventional household survey
methods to measure something unconventional: what we call “offshorability,” defined as
the ability to perform one’s work duties (for the same employer and customers) from
abroad. Notice that offshorability is a characteristic of a person’s job, not of the person
himself. We see this research as important for two main reasons.
First, one of us has argued previously (Blinder (2006, 2009a)) that offshoring is
potentially a very important labor market phenomenon in the United States and
elsewhere, perhaps eventually amounting to a third Industrial Revolution. In the first
Industrial Revolution, the share of the U.S. workforce engaged in agriculture declined by
over 80 percentage points. In the second Industrial Revolution, which is still in progress,
the share of American workers employed in manufacturing has declined by almost 25
percentage points so far, with most of the migration going to the service sector. The
estimates presented here, like those of Blinder (2009b), suggest that the share of U.S.
workers performing what Blinder (2006) called “impersonal service” jobs (defined
precisely below) might shrink significantly while the share performing “personal service”
jobs rises.
Second, while readers must judge for themselves, we deem the pilot study to have
been successful—by several criteria that we will explain later. So we hope our survey
methods will be replicated, improved upon, and eventually incorporated into some
regular government survey, such as the Current Population Survey (CPS). Doing so
would enable the U.S. government to track this important phenomenon over time.1
The plan of the paper is as follows: Section 1 defines offshorability in more detail,
expands upon why we believe that measuring it is important, and reviews some previous
1 And perhaps also to look backward historically by applying the methodology to old survey records.

2
attempts to do so. (There are only a few.) Section 2 describes the survey questions we
designed as part of an original, multi-purpose labor force survey.2
One key question for us is: Do these three alternative survey methods lead to similar
or different results? Section 3 summarizes our findings, both in terms of technical
indicators of survey quality (e.g., response rates, reliability, etc.) and of substantive
findings (e.g., how many jobs are estimated to be offshorable?). To us, the two types of
results are equally important—at least until the survey methodology is well established.
In Sections 4 and 5, we report on some simple econometric exercises using the survey
data. For example, what are the most important determinants of offshorability? And what
effects, if any, does offshorability have on wages? Finally, Section 6 is a short summary.
The survey provides
multiple ways to assess the offshorability of a given job, and we focus on three. One asks
respondents directly about the difficulty of having their work performed by someone in a
remote location. In the second, we use respondents’ answers to a series of questions about
the nature of their work to classify jobs by their offshorability ourselves. The third relies
on professional coders to decide how offshorable each job is, based on the worker’s
description of his or her job tasks.
1. What is “offshorability” and why does it matter?
Offshoring refers to the movement of home-country jobs to another country—
whether or not those jobs go to another company. Thus General Electric offshores jobs
when it moves a factory to China, and JP Morgan Chase offshores jobs when it does
security analysis at its offices in India instead of in New York. Since the two are often
2 The data generated by this survey are also used in several other studies in the Princeton Data Improvement Initiative (PDII).

3
conflated, offshoring needs to be distinguished from outsourcing, which refers to moving
jobs out of the company, regardless of whether those jobs leave the country. In neither of
the two preceding examples are jobs outsourced. But Citigroup outsources (but does not
offshore) jobs when it hires another U.S. company to run a credit-card call center for it in
South Dakota, and Goldman Sachs outsources jobs when it hires a New York City
janitorial firm to clean its offices. Of course, sometimes jobs are both outsourced and
offshored, as when IBM moves its call center to India and hires Wipro to run it.
Offshoring, which is an observable action,3 must also be distinguished from
offshorability, which is a job characteristic. We call a job “offshorable” if its nature—
e.g., what must be done and where—allows the work to be moved overseas in principle,
even if that movement has not actually occurred. So, for example, we know that all textile
manufacturing jobs in the United States are offshorable even though some of them are
still here. (Most, however, have moved offshore.) By the same token, virtually all
American call-center jobs are offshorable. But performing surgery and driving a taxicab
are not.4
In some jobs, offshorability is clear and unambiguous—as in the preceding examples
of call-center operators (easily offshorable) and taxi drivers (impossible to offshore). But
in other cases, the degree of offshorability is less clear. Think, for example, about
accounting, filing documents, watch repair, and paralegal work. The degrees of
offshorability of positions like these are matters of subjective judgment. And therein lies
the measurement challenge, for one person’s judgments may not correspond to another’s.
3 At least in principle. In practice, it can be difficult. For example, if Mattel opens a toy factory in China to export back to the United States, but does not close a factory in the U.S., are the jobs in China offshored? 4 Immigrants or guest workers can move to the U.S. to do non-offshorable jobs. But then those jobs are not offshored. Offshoring refers to the location of economic activity (like GDP), not the nationality of the worker (like GNP).

4
One of the central questions of this paper is: Can these judgments be made with a
modicum of consistency and validity?
Economists typically shy away from such subjective judgments; we prefer “hard
data” instead. But data users often forget that much of the official government data that
we use so routinely reflect subjective judgments—not by economists, but by survey
respondents and the people who code their responses. In the CPS occupational data, for
example, respondents have not self-categorized themselves into one of the (roughly) 800
Standard Occupation Codes (SOC). If they did so, they would probably do it poorly.
Instead, a trained coder assigns each respondent’s job to an SOC based mainly on the
answers to these two questions:
What kind of work do you do, that is, what is your occupation?
What are your usual activities or duties at this job?
In neither case do respondents pick from a pre-set list. Rather, they answer free form,
in their own words. To give readers an idea of what the raw survey data look like, here
are three verbatim examples culled from our survey:
What kind of work do you do, that is, what is your occupation?
What are your usual activities or duties at this job?
“inn keeper” “guest services, housekeeping, reservations, marketing, etc.”
“pastor” “preach, teaching, visiting home/hospital counseling”
“work in the lobby” “clean tables, clean seats and mop the bathroom floors”
Based on such information, trained coders in Indiana decided on the occupation code for
each respondent. As we explain in detail in the next section, one of our methods for
coding offshorability follows this procedure exactly. In fact, whether or not professional

5
coders can classify jobs according to their degree of offshorability correctly and
consistently are among the most critical questions for our study. As will be seen, we
think the answer is yes. A related question is whether we can develop a reliable mapping
from occupational information to offshorability. If so, the BLS or the Census Bureau
would be able to track offshorability over time by going back to old CPS and Census
data.5
But why take on such a hazardous task, involving so many subjective judgments, in
the first place? Because we believe the answers are potentially important to education
policy, trade policy, and labor-market policies, to name just three.
6
5 One major qualification, of course, is that the upward march of technology is probably making more and more jobs offshorable over time.
For public policy
purposes, it probably does not matter much whether the share of American jobs that are
offshorable is 20% or 30%. That much imprecision in measurement would not affect the
plausible policy responses in any substantial way. But we believe that both the
economically appropriate and the politically feasible policy responses to offshoring
would be fundamentally different depending on whether, say, the share of the American
workforce holding jobs deemed to be offshorable is 2%, 25%, or 75%. In the 2% case, we
should probably ignore offshoring as a detail of little consequence. In the 75% case, we
should perhaps be looking for radical solutions to the manifold problems caused by
massive job dislocations. Our estimates, like those of Blinder (2009b), are closer to the
25% mark—which, we believe, calls for certain marginal (and some not so marginal)
policy adjustments, but certainly not for panic. But this paper is about measurement, not
policy. So we leave policy implications for elsewhere and concentrate on the data.
6 For much more on policy implications, see Blinder (2006, 2009a).
6
We are not the first to attempt to estimate how many U.S. jobs are potentially
offshorable. Blinder (2009b) used information about job content in the O*NET data base
to assign a two-digit ordinal offshorability index to each of the (roughly) 800 SOC codes.
For example, data keypunchers were rated as 100, bookkeepers were rated 84, factory
workers were (around) 68, stock clerks were 34, and child care workers were 0. Once all
the occupations were so rated, Blinder (2009b) drew the line between offshorable and
non-offshorable jobs in a variety of places. His “conservative,” “moderate,” and
“aggressive” definitions placed 22.2%, 25.6%, and 29.0% of all U.S. jobs, respectively,
in the offshorable category. But using only occupation-level data misses any within-
occupation variability in the degree of offshorability—and there is probably plenty. As
mentioned earlier, the natural unit of observation for measuring offshorability is the job,
not the individual. However, there may be a great deal of heterogeneity within certain
occupation codes. For example, some secretarial and clerking jobs are clearly
offshorable while others are not. We seek to overcome that difficulty here by using
worker-level data.7
Other studies have obtained a variety of different estimates. For example, the
McKinsey Global Institute (2005) used detailed consulting-style analysis of eight
“representative sectors” in rich countries around the world to estimate that only about
11% of worldwide (not just U.S.) private-sector service employment might potentially be
offshored to developing countries within about the next five years. Presumably a larger
portion of manufacturing jobs is offshorable. Furthermore, McKinsey’s five-year time
frame seems much too short to us; and U.S. jobs are probably more vulnerable to
7 Blinder (2009b) dealt with this problem by arbitrarily dividing occupations like “secretary” into sub-occupations with different degrees of offshorability. This involved a lot of guesswork.
7
offshoring than, say German or French jobs, because there are so many more English-
speaking (than German- or French-speaking) workers in, e.g., India. Bardhan and Kroll
(2003) estimated that about 11% of all U.S. jobs are offshorable. But they explicitly
restricted themselves to “occupations where at least some [offshore] outsourcing has
already taken place or is being planned” (p. 6). Since service-sector offshoring was in its
infancy then (and probably still is), their self-imposed purview seems far too limited. Van
Welsum and Vickery (2005) based their estimates of offshorability in OECD countries on
the intensity of ICT use by industry. Their estimate for the U.S. was about 20% of total
employment. Finally, Jensen and Kletzer (2006) used geographical concentration within
the United States to estimate how “tradable” each occupation is. They then estimated that
38% of U.S. workers are in tradable, and therefore offshorable, occupations. Thus the
range of pre-existing estimates runs from11% to 38%—which is quite wide.
Finally, we should note that our distinction between jobs that are or are not
offshorable is conceptually distinct from, though related to, Autor, Levy, and Murnane’s
(2003) well-known distinction between jobs that are or are not sufficiently rule-based to
be performed by a computer/robot. On the surface, it seems plausible that, other things
equal, jobs that can be broken down into simple, routinizable tasks are easier to offshore
than jobs requiring complex thinking, judgment, and human interaction. However, a wide
variety of complex tasks that involve high levels of skill and human judgment can also be
offshored via telecommunication devices as simple as telephones, fax machines, and the
Internet. Think, for example, of statistical analysis, computer programming, manuscript
editing, and security analysis, to name just a few. We believe that Blinder’s (2006)
distinction between personal and impersonal services—which we elaborate on in the next

8
section—is far more germane to the offshoring issue than is the question of
routinizability. That said, the two criteria should overlap, and we examine that overlap
below.
2. The Surveys
The present authors, along with other scholars and the staff of Princeton University’s
Survey Research Center, worked with Westat, a leading statistical survey research
organization to develop a multi-purpose questionnaire for the Princeton Data
Improvement Initiative (PDII). Westat was selected for the project, in part, because of its
wealth of experience working with the Census Bureau. We began with the relevant
questions from the CPS and added additional questions on the feasibility of performing
respondents’ work remotely, job tasks, career experience, etc. Westat then administered
the random digit dialing (RDD) survey, coded the responses, and tabulated the results.8
According to Blinder (2009b), the offshorability of a particular job depends on two
principal criteria:
In this paper, we focus on the portions of the survey that were designed to estimate
offshorability, making only minor reference to other aspects of the survey.
1. whether the job must be done at a particular U.S. location (examples: selling
food at a sports arena, building a house);
2. whether the work can be done at a remote (presumably foreign) location and the
work product—whether a good or a service—delivered to the end user with
little or no loss of quality.
8 For the questionnaire and a description of the survey design, see: www.krueger.princeton.edu/PDIIMAIN.htm.

9
The second criterion is clearly a continuum rather than a yes-or-no variable, so some jobs
are more offshorable than others—which is why Blinder (2009b) created a numerical
index.
For example, virtually all manufactured goods can be made abroad, put in a box, and
transported to the United States. Within the service sector, the work of a keypuncher, call
center operator, or computer code writer is approximately as useful to the end user if the
work is performed next door, in Bangor, or in Bangalore. Blinder (2006) labeled jobs like
these impersonal services, and noted that they are easily offshorable. At the other
extreme, some service-sector jobs such as brain surgeon, taxi driver, and day care
worker—which Blinder (2006) labeled personal services—are completely impossible to
offshore. In between sits a vast array of service jobs that are less offshorable than writing
computer code but more offshorable than performing surgery. College teaching may be
one such job, or might become one as the technology improves.
Our first research question is whether trained coders—such as the people who
classify occupations in the CPS—can understand this conceptual distinction and apply it
in a consistent way to actual survey responses of the sort displayed earlier, which are
sometimes messy.
A pre-existing survey
As an initial step, Westat staff went back to a restricted-use version of the 2003
National Assessment of Adult Literacy (NAAL)—a survey of over 18,000 respondents.
They drew a stratified random sample of 3,000 observations and re-examined the answers
to the three questions that coders used then to decide on a respondent’s occupation and
industry—questions that are very similar to the two CPS questions shown earlier:

10
For what kind of business or industry do you work? What is your occupation, that is, what is your job called?
What are the most important activities or duties at this job?
Based on the answers, coders were asked to classify each respondent’s job on the
following five-point offshorability scale that we developed with Westat explicitly for this
purpose:
1: not offshorable 2: offshorable only with considerable difficulties and/or loss of quality 3: mixed or neutral 4: offshorable, though with some difficulties or loss of quality (that can be
overcome) 5: easily offshorable with only minor (or no) difficulties or loss of quality
In the instructions, coders were told that the following job characteristics push a job
toward the low end of this five-point scale, that is, toward “not offshorable”:
• Need for face-to-face interaction with customers or suppliers • Delivering/transporting products or materials that cannot be transported
electronically (e.g., mail, meals, fruits and vegetables) • Public speaking • Requires “cultural sensitivity” (e.g., newscaster, sports broadcaster) • Providing supervision, training or motivation to others working in the U.S. • Physical presence at site (or sites) in U.S. is required • Maintaining or repairing fixed structures that are in the U.S. (e.g., roofs,
plumbing, gardens, yards) • Maintaining or repairing large objects (e.g., cars, boats, washing machines)
As some examples of jobs that are not offshorable (coded 1), we used mail deliverer,
carpenter, waiter, farmer, and surgeon.
At the other end of the spectrum, coders were instructed that the following
characteristics push a job toward the high end of the offshorability scale, that is, toward
“easily offshorable”:

11
• Extensive use of computers/email • Processing information/data entry • Talking on the telephone • Analyzing data • Assembling or packaging a product
Some examples we used of jobs that should be coded as 5s were computer programmer,
telemarketer, proofreader, and reservation clerk. Finally, coders were instructed to score
any job that involves a mixed set of offshorable and non-offshorable characteristics as
“mixed or neutral” (3 on the scale above).
Westat selected four coders who had no previous experience with SOC coding, and
conducted a one-day training session to familiarize them with the SOC codes, the concept
of offshorability, and the five-point scale just explained. In fact, Westat personnel
reported to us that much more of their training was devoted to understanding the 800
SOC codes than to the five offshorability codes. In the training, coders examined raw
data from the three NAAL occupational questions shown above, and discussed the SOCs
and offshorability codes that should be applied with Westat personal. Westat had, in turn,
discussed these same principles extensively with us, including reviewing many concrete
examples to make sure we were “on the same page.”
After the training session, each of the four coders was given 750 randomly-selected
cases on which to work. They were asked to assign an SOC and an offshorability code
(using the five-point scale displayed above) to each. During their first week of work,
supervisors provided especially close oversight and feedback to the coders regarding the
accuracy of their assignments; and throughout the job, a supervisor was always available
to answer questions and provide guidance as needed.

12
The next—and important—step was to examine the inter-coder reliability of the
assigned codes. About 10% of each coder’s cases were randomly selected to be coded
again by another coder. Of these 298 cases, the two coders agreed on the assigned
offshorability score in 226 cases, or 76%—even though they had no previous experience
with even the presumably more routine task of occupational coding. It seems virtually
certain to us (and to Westat) that experienced coders would have agreed even more. This
strikes us as a high degree of inter-coder agreement; after all, coders do have to make
subjective judgments. Furthermore, and important to our purpose, coders declared
themselves unable to decide on the degree of offshorability in a mere 0.5% of cases, a
negligible proportion. Finally, in cases in which the two coders disagreed, Westat
supervisors adjudicated the disputes. As it turned out, they sided with the first coder in
93% of the cases, suggesting that even cross-checking every coding decision would have
made little difference.
Each of these survey findings bolstered our confidence in the procedure and
emboldened us to take the next step: creating a de novo survey aimed specifically at
measuring offshorability. For comparison with results shown later, the 2,985 NAAL
cases wound up being coded for offshorability as follows:
1: not offshorable………………………….. 71.9% 2: offshorable with considerable difficulties.. 4.8% 3: mixed……………………………………. 6.2% 4: offshorable with some difficulties………. 5.3% 5: easily offshorable……………………….. 11.8%.
Thus the most restrictive definition of offshorability would encompass 17.1% of
employment (responses 4 and 5) while the most expansive definition would cover 28.1%
(all responses except 1).

13
New Survey Results: Externally-coded and Self-reported Offshorability
The PDII survey was a random-digit dialing (RDD) survey of 2,513 labor force
participants age 18 and older, conducted between June 5 and July 20, 2008. Although
Westat made as many as 15 phone calls to sampled households to elicit a response, the
response rate was only 17.9% , which is hardly unusual in RDD surveying. Sample
weights were developed to make the sample representative of the population in terms of
sex, age, race, Hispanic ethnicity, education, employment status, geographical region,
and other demographic variables; all the results shown in this paper are based on
weighted data. Most important for our purposes, the PDII survey included the CPS
occupation and industry questions, and Westat’s coders applied the same procedures they
used for the NAAL data to provide an external assessment of the offshorability of each
respondent’s job.
An externally-coded measure
When the methods described above for utilizing the standard industry and occupation
questions in the NAAL data were used by professional coders to rate the offshorability of
each survey respondent’s job, the results were:
1: not offshorable…………………………… 68.4% 2: offshorable with considerable difficulty …...8.3% 3: mixed or neutral…………………………….6.3% 4: offshorable with some difficulty……………6.2% 5: offshorable with minor or no difficulty……10.9%
If we arbitrarily divide the “mixed or neutral” response equally between “offshorable”
and “not offshorable,” we would conclude that 20.3% of jobs are potentially offshorable.9
9 Stunningly, this is exactly what we would get from the NAAL data summarized above.
But looking forward to the superior technology that will be available in the future, as
14
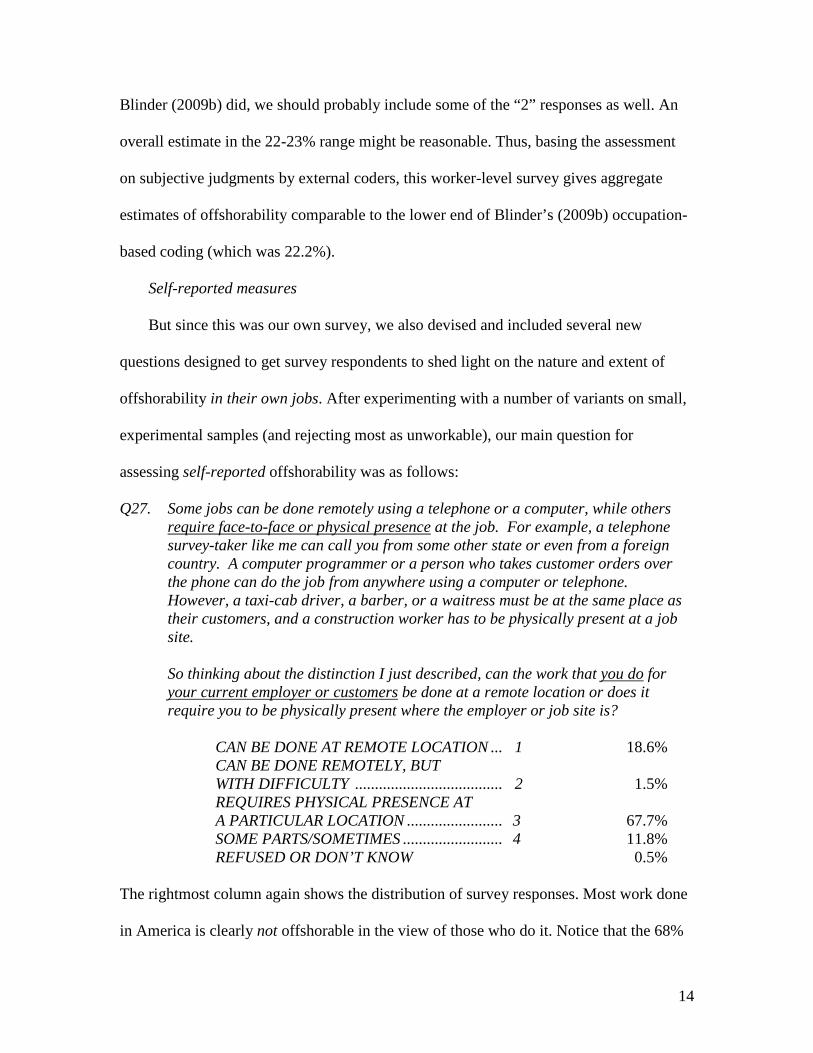
Blinder (2009b) did, we should probably include some of the “2” responses as well. An
overall estimate in the 22-23% range might be reasonable. Thus, basing the assessment
on subjective judgments by external coders, this worker-level survey gives aggregate
estimates of offshorability comparable to the lower end of Blinder’s (2009b) occupation-
based coding (which was 22.2%).
Self-reported measures
But since this was our own survey, we also devised and included several new
questions designed to get survey respondents to shed light on the nature and extent of
offshorability in their own jobs. After experimenting with a number of variants on small,
experimental samples (and rejecting most as unworkable), our main question for
assessing self-reported offshorability was as follows:
Q27. Some jobs can be done remotely using a telephone or a computer, while others require face-to-face or physical presence
at the job. For example, a telephone survey-taker like me can call you from some other state or even from a foreign country. A computer programmer or a person who takes customer orders over the phone can do the job from anywhere using a computer or telephone. However, a taxi-cab driver, a barber, or a waitress must be at the same place as their customers, and a construction worker has to be physically present at a job site.
So thinking about the distinction I just described, can the work that you do for your current employer or customers
be done at a remote location or does it require you to be physically present where the employer or job site is?
CAN BE DONE AT REMOTE LOCATION ... 1 18.6% CAN BE DONE REMOTELY, BUT WITH DIFFICULTY ..................................... 2 1.5% REQUIRES PHYSICAL PRESENCE AT A PARTICULAR LOCATION ........................ 3 67.7% SOME PARTS/SOMETIMES ......................... 4 11.8% REFUSED OR DON’T KNOW 0.5% The rightmost column again shows the distribution of survey responses. Most work done
in America is clearly not offshorable in the view of those who do it. Notice that the 68%

15
of (self-reported) jobs that “require physical presence” (ignoring the “refused” and “don’t
know” responses) is virtually identical to the 68.4% of jobs that are “not offshorable”
according to external coders.10
Several other features of these results are notable. First, the fraction of respondents
who either could not or would not answer the question was negligible—which is very
good news for the question as worded. Second, if we simply count the 1s as offshorable,
the 3s as not-offshorable, and split the 2s and the 4s on a 50-50 basis, we would conclude
that 25.3% of all jobs are offshorable—which is remarkably similar to Blinder’s (2009b)
“moderate” estimate.
11
To examine the credibility of the responses to Q27, Westat asked a random sample
of 197 respondents a free-form question regarding why they said their job can be done
remotely or why it requires their physical presence—depending on how they answered
Q27. The answers to these follow-up questions give us some basis for believing that
most of the respondents correctly understood what we were after. Based on a laborious
case-by-case reading of the data file, the free-form explanations seemed inconsistent with
the responses to the offshorability question (Q27) in 11.7% of the cases.
If we employ a much more demanding definition, counting only
the 1s as offshorable, we would get an estimate of 18.7%, which is slightly below
Blinder’s most “conservative” estimate. But this definition seems far too restrictive.
12
10 While the aggregates are almost identical, the compositions of the two groups are not. For example, among the jobs that external coders classify as “not offshorable,” individual jobholders report that their physical presence is required in 77.4% (not 100%) of the cases. Conversely, of the cases in which individuals report that physical presence is required, only 77.7% (not 100%) were classified as “not offshorable” by the external coders. More on this later.
This subjective
11 In making this and similar tabulations, we always omit the “refused” and “don’t know” responses. 12 An example of an inconsistent response is an individual who replied that his work required his physical presence “because it comes through the computer queues that are on a mainframe at the job location.” From the other perspective, a questionable response was someone who said that his job could be performed remotely and offered as an explanation that he “has to be at the house of residence.”

16
“error rate” was about the same for jobs that respondents said could be done remotely
(10.8%) and jobs that require physical presence (11.9%). These results give us reason for
cautious optimism. Misclassification errors look modest, though certainly not negligible.
More important, they also seem to be random, that is, not correlated with offshorability.
Still, if as many as 11.7% of respondents might misclassify themselves, Q27 might not be
the ideal question.
So another, related set of offshorability questions was asked of every respondent,
starting with:
Q29. To what extent does the work you do on your main job involve face-to-face contact with people other than your co-workers or supervisors?
Would you say a lot, a moderate amount, a little, or none at all?
A LOT ............................................................. 1 52.6% A MODERATE AMOUNT.............................. 2 17.0% A LITTLE ....................................................... 3 18.0% NONE AT ALL ............................................... 4 12.4% REF OR DK 0.0%
Here the number of refusals and “don’t know” responses is essentially zero—just two out
of 2513 survey respondents. Ordinary people obviously can cope with this question
without difficulty.
Notice that the wording of Q27 put the emphasis on the ability (or lack thereof) to do
a job from a remote location. By contrast, Q29 emphasizes the frequency of face-to-face
contact on the job with someone other than one’s co-workers and superiors; it does not
even ask respondents whether their job could be done from a remote location. Thus,
while related, the two job characteristics described in Q27 and Q29 are conceptually
distinct.
17
Yet each is an important hallmark of whether or not a job is offshorable. Thus
answers of “a lot” or “a moderate amount” to Q29—which together comprise almost 70%
of total employment—would seem to indicate that these respondents are not in highly-
offshorable jobs. Some (perhaps many) of the people answering “a little” face-to-face
contact (18%) might be in jobs that are offshorable, albeit with some effort. And it is
tempting to classify most of the respondents saying “none” (12.4% of the sample) as
probably holding jobs that are easy to offshore. If we succumb to this temptation, and
split the “a little” responses (coded 3) evenly, we would conclude that 21.4% of all jobs
are offshorable.
But we can do much better than this. To dig deeper, the survey posed two follow-up
questions. First, consider the 12.4% of all respondents who reported in Q29 that none of
their work involves face-to-face contact with people other than fellow workers. Are all
those jobs easily offshorable? Surely not. Just think about air traffic controllers or janitors
who clean office buildings after hours. So we asked these respondents:
Q32. To what extent is it possible for you to do the work on your job without
being physically present? By that I mean could you do the work at a remote location and then deliver it by mail, by telephone, by sending it over the Internet, and so on. Would you say all of the work could be done that way, most of the work, a little of it, or none at all?
ALL OF THE WORK ..................................... 1 2.1% MOST OF THE WORK .................................. 2 1.9% A LITTLE OF THE WORK ............................ 3 1.2% NONE AT ALL ............................................... 4 7.2% REF OR DK 0.0%
[Not asked 87.6%]
Notice that this question asks respondents to think a bit beyond current practices—to
what could be done. While it recognizes the reality that many tasks are in fact executed
face-to-face today, it asks respondents to ponder whether this personal contact is really
18
necessary. Those who answer “none at all” to Q32, constituting 7.2% of the whole
sample (and thus 58% of the sub-sample), are telling us that none of their work could be
done remotely and transmitted to end users. These people are almost certainly in non-
offshorable jobs despite the dearth of face-to-face contact.
The others, amounting to 5.2% of the whole sample (or 42% of the Q32 subsample),
indicate at least some ability to deliver the work from a remote location. They were then
asked:
Q32a. If work like yours is done elsewhere and delivered from a remote location, by how much, if at all, do you think the quality would deteriorate?
A LOT .............................................................1 0.3% A MODERATE AMOUNT..............................2 0.8% A LITTLE .......................................................3 1.0% NONE AT ALL.............................................. 4 3.0% REF OR DK 0.1% [Not asked 94.8%] We classified those who answered either “a little” or “not at all” to this question, plus
half of those who answered “a moderate amount” (thus 4.4% of the overall sample), as
being in offshorable jobs. The other jobs are deemed not offshorable.13
Next, we turn to the 87.6% of the sample who did not answer “none at all” to Q29,
thereby indicating that at least some face-to-face contact with, say, customers or suppliers
is part of their jobs.
14
They were asked a follow-up question that closely tracks Q32
above:
13 Respondents to Q32a, and to the companion question Q31a below, were asked how such remote delivery would be accomplished. A stunning 71% responded that their work would be sent via a computer network, about 41% said by fax or telephone, 35% said their work would be sent by mail, and under 14% said it would go by truck or ship. (Note: Many respondents gave multiple responses.) 14 About 85% of these respondents reported face-to-face contact with customers, about 58% reported face-to-face contact with suppliers or contractors, and about 61% reported face-to-face contact with students or trainees. Again, multiple responses were common.

19
Q31. Now think about the work you do face-to-face with others. To what extent is it possible for you to do that work without
being physically present? By that I mean doing the work at a remote location and then delivering it by mail, by telephone, by sending it over the Internet, and so on. Would you say all of the work could be done that way, most of the work, a little of it, or none at all?
ALL OF THE WORK ..................................... 1 3.4% MOST OF THE WORK .................................. 2 12.6% A LITTLE OF THE WORK ............................ 3 28.2% NONE AT ALL ............................................... 4 43.1% REF OR DK 0.3%
[Not asked 12.4%]
As before, those who answered “none at all” to this question—constituting 43.2% of the
entire sample—were immediately classified as non-offshorable. The rest were asked this
follow-up question:
Q31a. If work like yours is done elsewhere rather than face-to-face, do you think the quality would deteriorate a lot, a moderate amount, a little, or none at all?
A LOT .............................................................1 17.3% A MODERATE AMOUNT..............................2 8.1% A LITTLE .......................................................3 9.1% NONE AT ALL.............................................. 4 9.9% REF OR DK 0.1% [Not asked 55.6%] If we again take the 3s, the 4s, and half the 2s as telling us that their jobs are potentially
offshorable, that group would constitute 23.1% of the entire sample.
Adding the two pieces together yields an estimate that 4.4% + 23.1% = 27.5% of the
jobs in the overall sample are offshorable, a number right in between Blinder’s (2009b)
“moderate” and “aggressive” estimates. Incidentally, this more complicated breakdown
of the data shows why it would be unwise to rely solely on the answers to Q29 (“how
much face-to-face contact…?”) to decide on offshorability. According to the calculations
just outlined, among respondents answering that their jobs involve no face-to-face contact
at all, only 34% wind up classified as offshorable—which is pretty far from 100%.

20
Meanwhile, among respondents answering that their jobs entail at least some face-to-face
contact, the percentage classified as offshorable is 26%—which, while lower, is pretty far
from zero.
However, the more complicated measure of offshorability just explained (based on
the answers to questions Q29, Q31, and Q32) and the simple self-reported measure of
offshorability discussed earlier (based on question Q27) do not correlate as highly as
might be hoped. For example, among respondents who say that their jobs require a lot of
face-to-face contact with people other than fellow workers, about 77% also say their job
cannot be done at a remote location (that is, they answer “3” to Q27)—which makes
sense. But about 9% of such people report that their jobs can be done at a remote location
(they answer “1” to Q27), which makes us wonder if they understood the question. At the
other end of the offshorability spectrum, among respondents who say that their jobs
require no face-to-face contact with people other than co-workers, only 36% report that
their jobs are easily done from a remote location.
There is both good news and bad news in these comparisons. The bad news, of
course, is that there appear to be some inconsistencies in the responses, which is hardly
unusual in survey work.15
We have now used self-reported information from jobholders to derive three
different estimates of the share of U.S. employment that is offshorable. They are 25.3%,
based on self-reporting via Q27; 21.4%, based on self-reporting via Q29 only (which we
The good news is that the three assessments of offshorability
each contain independent information not contained in the other. Given how little we
know about assessing offshorability, more information is perhaps welcome.
15 See, for example, Zaller (1992, Chapter 4). The unusual responses in this survey are not literally illogical. But they do make you wonder what kinds of jobs these people have.

21
are inclined to discount); and 27.5% based on supplementing Q29 with questions Q31
through Q32a, as just described. In addition, we noted earlier that external coders rate
about 23% of all jobs as offshorable. The average across all four estimates is 24.3%. And
if exclude the 21.4% figure, as we will do in what follows, the average rises to 25.3%.
More important, all four estimates are remarkably close, given the inherent imprecision in
each. They are also remarkably close to Blinder’s (2009b) range, which was 22.2% to
29.0% based on occupations, not on individual responses. As a robust stylized fact, about
one-quarter of U.S. jobs appear to be offshorable.
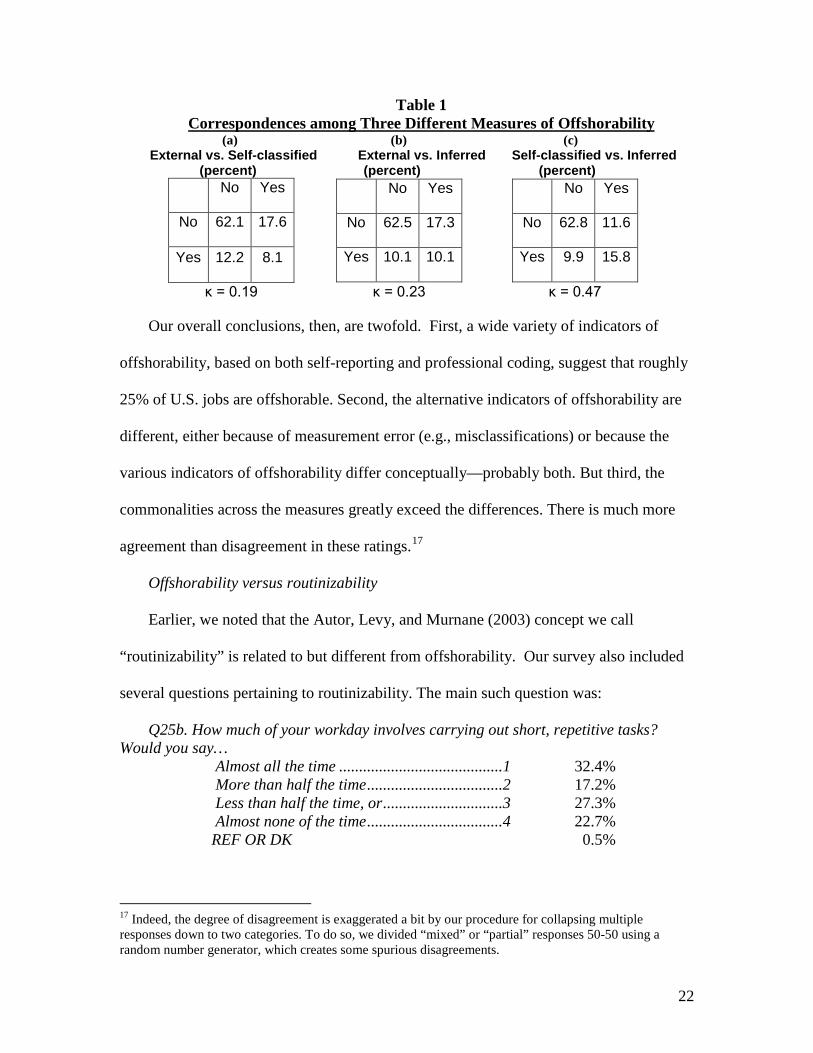
To facilitate comparisons among our three preferred measures of offshorability—
which we will henceforth refer to as “self-classified” (using Q27), “inferred” (from
responses to Q29 through Q32), and “externally-coded”—we compressed the responses
to the first and third measures into a two-point scale to make them directly comparable
with the second measure. In the three 2x2 contingency tables shown below, “Yes”
indicates that the respondent’s job is offshorable while “No” indicates that it is not. The
tables show that the percentage of cases in which two indicators of offshorability agree
ranges from 70.2% (externally coded versus self-classified) to 78.6% (self-classified
versus inferred from responses). The corresponding “kappa” coefficients range from 0.19
to 0.47.16
16 κ, which is analogous to a correlation coefficient, is probably unfamiliar to most economists. See Maxwell (1970) for an explanation. In the 2x2 case, denote the four elements of the contingency table (using decimal fractions) as:
a b c d
Then kappa is defined as κ = [(a+d) – Δ)]/[1 – Δ], where Δ = (a+c)(a+b) + (d+c)(d+b). It is clear from this formula that κ=1 when all data are on the diagonal (a+d=1, c=b=0), and that κ=0 when the data are equally distributed in the table (a=b=c=d=1/4
22
Table 1 Correspondences among Three Different Measures of Offshorability
(a) (b) (c)
External vs. Self-classified External vs. Inferred Self-classified vs. Inferred (percent) (percent) (percent)
No Yes No Yes
No 62.5 17.3
Yes 10.1 10.1
No Yes
No 62.8 11.6
Yes 9.9 15.8
No 62.1 17.6
Yes 12.2 8.1
κ = 0.19 κ = 0.23 κ = 0.47
Our overall conclusions, then, are twofold. First, a wide variety of indicators of
offshorability, based on both self-reporting and professional coding, suggest that roughly
25% of U.S. jobs are offshorable. Second, the alternative indicators of offshorability are
different, either because of measurement error (e.g., misclassifications) or because the
various indicators of offshorability differ conceptually—probably both. But third, the
commonalities across the measures greatly exceed the differences. There is much more
agreement than disagreement in these ratings.17
Offshorability versus routinizability
Earlier, we noted that the Autor, Levy, and Murnane (2003) concept we call
“routinizability” is related to but different from offshorability. Our survey also included
several questions pertaining to routinizability. The main such question was:
Q25b. How much of your workday involves carrying out short, repetitive tasks? Would you say… Almost all the time .........................................1 32.4% More than half the time ..................................2 17.2% Less than half the time, or ..............................3 27.3% Almost none of the time ..................................4 22.7%
REF OR DK 0.5%
17 Indeed, the degree of disagreement is exaggerated a bit by our procedure for collapsing multiple responses down to two categories. To do so, we divided “mixed” or “partial” responses 50-50 using a random number generator, which creates some spurious disagreements.
23
Clearly a low number on this scale indicates a high degree of routinizability, so that a
computer or robot might be able to do the job well. If you are looking for an estimate of
how many jobs have “high” versus “low” routinizability, the sample divides almost
exactly 50-50. On the other hand, if you are looking for an estimate of how many jobs
cannot be done by a computer to any significant extent, the estimate is a low 23%. While
this indicator of routinizability is clearly another imperfect measure, we at least expect to
find that more of the people answering 1 and 2 to this question (and thus in easily
routinizable jobs) are in offshorable jobs, as compared to the people answering 3 or 4
(and thus in jobs that are harder to routinize).
But we do not. In fact, according to the self-classified measure of offshorability
(from Q27), only 18.3% of the routinizable jobs are offshorable versus 32.2% of the non-
routinizable jobs. Similarly, if we use our inferred measure of offshorablility (from Q29-
Q32) instead, we find that 20.5% of routinizable jobs are offshorable versus 34.3% of
non-routinizable jobs. Finally, if we use external coders’ ratings of offshorability, there is
essentially no difference in offshorability between routinizable and non-routinizable jobs.
Thus, not only are the two criteria—routinizability and offshorability—conceptually
different, as we have emphasized, they are not even positively correlated. The latter is
certainly surprising.
Offshorability and occupational licensure
One way in which workers in particular occupations might seek to protect their
positions from the threat of offshoring is by requiring practitioners to obtain a
government license to do the work. For example, existing technology allows radiology to
24
be offshored rather easily, but licensure largely prevents it.18
We find clear support in the PDII data for the notion that licensure deters offshoring,
or at least offshorability as we measure it. According to the external coders, only 6.5% of
jobs for which a license is needed are offshorable, versus 24.3% of jobs for which no
license is needed. The other measures of offshorability agree, though with less dramatic
differences. Using self-classification to measure offshorability (Q27), 17.1% of licensed
jobs and 28.3% of unlicensed jobs are offshorable. Using our inferences from the answers
to Q29-Q32, the corresponding figures are 16.7% versus 31.1%. Thus, in all cases,
licensure and offshorability are negatively related, as expected.
Instead, while much
radiological work does get outsourced, it goes to cheaper domestic locations—say, to
Indiana rather than to India.
3. Measuring Offshorability
The survey results outlined in the preceding section yield four different--though not
independent--estimates of the fraction of U.S. jobs that are potentially offshorable. Of
these, we have focused on three: two based on self-reporting and the other based on
judgments by external coders. The four estimates span a reasonably narrow range, from
21.4% (which we think is too low) to 27.5%. Thus a number in the 24-25% range might
be a reasonable distillation of these disparate results. But even if we accept the entire
range, the four estimates are all very close in the policy-relevant sense mentioned in
Section 1: Each estimate represents a non-trivial minority of all jobs, roughly comparable
18 See Levy and Yu (2006).
25
to the shift from manufacturing to services between 1960 and now.19
But raw tabulations take us only so far. We would like to know, for example, what
types of jobs are most and least offshorable, and what types of people are most and least
likely to be in offshorable jobs.
In other words, the
shift toward service offshoring is a potentially dramatic labor market transformation.
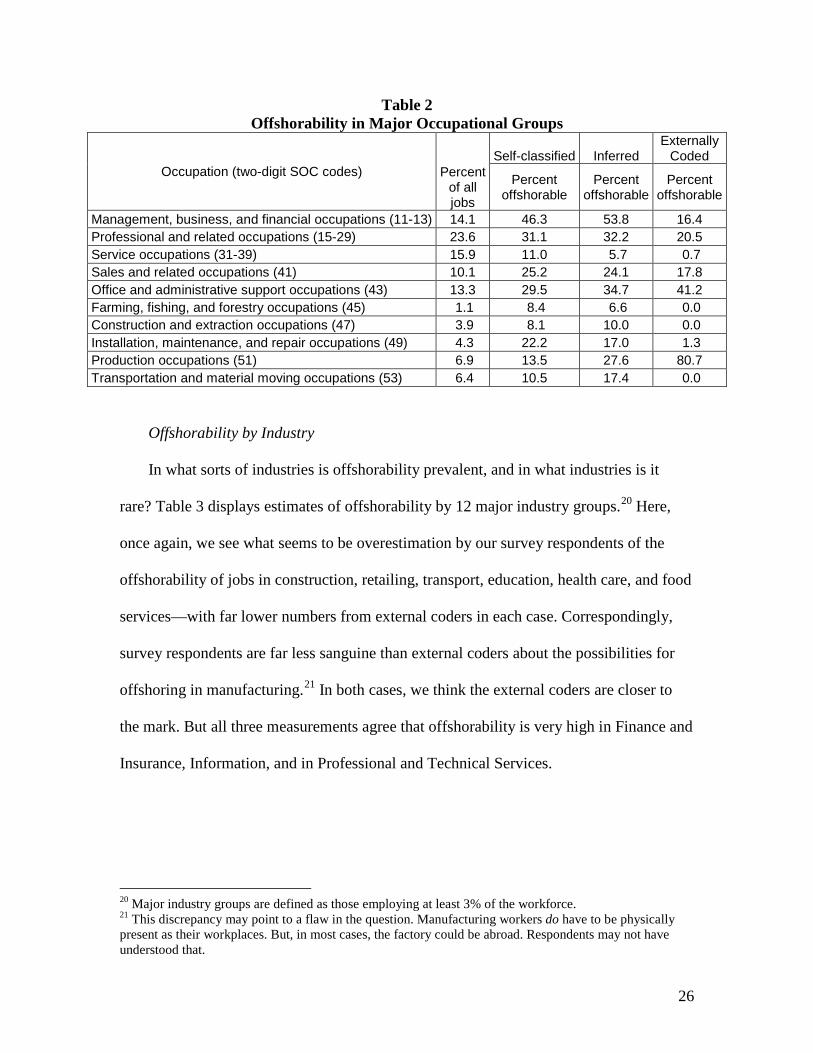
Offshorability by occupation
Table 2 reveals some sharp disagreements between our survey respondents and
Westat’s professional coders regarding the offshorability of different occupations. For
example, survey respondents rate about half of all “management, business, and financial”
occupations as offshorable, while coders rate only about one-sixth of them as offshorable.
On the other hand, Westat’s coders—following our instructions—rate 81% of
“production occupations” (which are mainly in manufacturing) as offshorable, versus
only about 20% from our respondents (averaging the two versions). Other large
discrepancies appear in “service occupations,” “farming, fishing and forestry,”
“construction,” and “installation, maintenance, and repair.” In each case, it seems to us,
the professional coders make the more reasonable judgments.
19 In 1960, 31.0% of payroll employees worked in the manufacturing sector. By 2008, this share was down to 9.8%.
26
Table 2 Offshorability in Major Occupational Groups
Occupation (two-digit SOC codes) Percent of all jobs
Self-classified Inferred Externally
Coded
Percent offshorable
Percent offshorable
Percent offshorable
Management, business, and financial occupations (11-13) 14.1 46.3 53.8 16.4 Professional and related occupations (15-29) 23.6 31.1 32.2 20.5 Service occupations (31-39) 15.9 11.0 5.7 0.7 Sales and related occupations (41) 10.1 25.2 24.1 17.8 Office and administrative support occupations (43) 13.3 29.5 34.7 41.2 Farming, fishing, and forestry occupations (45) 1.1 8.4 6.6 0.0 Construction and extraction occupations (47) 3.9 8.1 10.0 0.0 Installation, maintenance, and repair occupations (49) 4.3 22.2 17.0 1.3 Production occupations (51) 6.9 13.5 27.6 80.7 Transportation and material moving occupations (53) 6.4 10.5 17.4 0.0
Offshorability by Industry
In what sorts of industries is offshorability prevalent, and in what industries is it
rare? Table 3 displays estimates of offshorability by 12 major industry groups.20 Here,
once again, we see what seems to be overestimation by our survey respondents of the
offshorability of jobs in construction, retailing, transport, education, health care, and food
services—with far lower numbers from external coders in each case. Correspondingly,
survey respondents are far less sanguine than external coders about the possibilities for
offshoring in manufacturing.21
In both cases, we think the external coders are closer to
the mark. But all three measurements agree that offshorability is very high in Finance and
Insurance, Information, and in Professional and Technical Services.
20 Major industry groups are defined as those employing at least 3% of the workforce. 21 This discrepancy may point to a flaw in the question. Manufacturing workers do have to be physically present as their workplaces. But, in most cases, the factory could be abroad. Respondents may not have understood that.

27
Table 3 Offshorability by Industry
Offshorability by educational level
Disagreements are much smaller when it comes to appraising offshorability by
educational attainment. (See Table 4.) The survey respondents see offshorability as
(roughly) increasing as you move up the educational ladder. The external coders do, too,
but with one major discrepancy: They rate people with advanced degrees as in
substantially less offshorable jobs.
Table 4 Offshorability by Educational Level
Education Level Percent
of all respondents
Self-classified Inferred Externally Coded
Percent offshorable
Percent offshorable
Percent offshorable
No high school diploma 9.4 18.6 14.3 11.8 High School diploma or GED 30.2 17.3 19.8 19.3 Some college (no degree) 13.9 22.4 22.1 23.8 Vocational/Technical/Associate degree 11.4 22.9 22.8 17.1 Bachelor's degree 21.6 34.6 42.8 26.4 Advanced degree or professional school 13.5 37.0 38.5 16.9
Industry (NAICS) Percent
of all jobs
Self-classified Inferred Externally Coded
Percent offshorable
Percent offshorable
Percent offshorable
Construction (23) 5.2 12.8 23.5 10.4 Manufacturing (31) 12.0 27.3 32.6 50.3 Retail trade (44) 10.9 17.5 20.8 10.1 Transport and warehousing (48) 3.6 11.9 22.9 9.3 Information (51) 3.6 46.2 53.6 35.1 Finance and Insurance (52) 4.7 53.2 58.2 54.8 Prof, Sci, and Tech Services (54) 8.1 58.3 57.4 34.4 Admin, Sup, Waste Mgt, Remed Svcs (56) 3.3 23.0 20.0 27.8 Educational Svcs (61) 9.5 15.6 14.1 6.0 Health Care, Social Assistance (62) 13.0 17.4 19.8 8.5 Arts, Entertainment, Recreation (71) 3.2 15.3 21.9 16.0 Accommodation, Food Svcs (72) 6.4 9.7 3.4 0.47
28
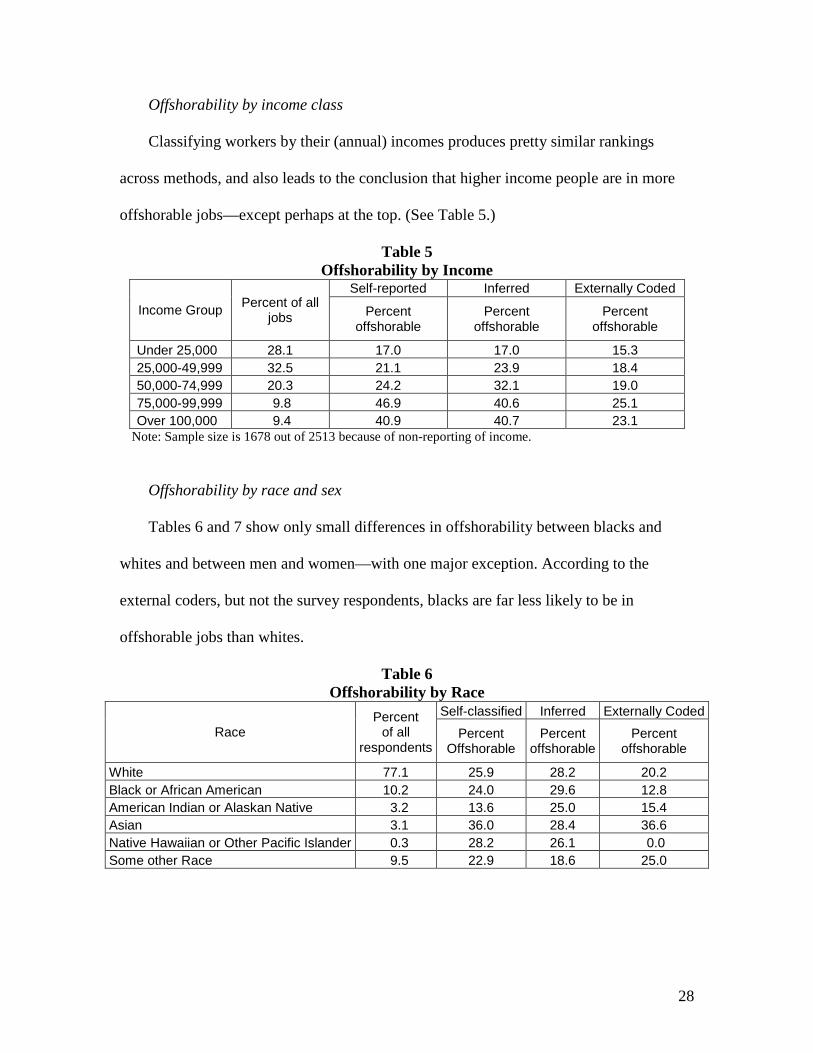
Offshorability by income class
Classifying workers by their (annual) incomes produces pretty similar rankings
across methods, and also leads to the conclusion that higher income people are in more
offshorable jobs—except perhaps at the top. (See Table 5.)
Table 5 Offshorability by Income
Income Group Percent of all jobs
Self-reported Inferred Externally Coded
Percent offshorable
Percent offshorable
Percent offshorable
Under 25,000 28.1 17.0 17.0 15.3 25,000-49,999 32.5 21.1 23.9 18.4 50,000-74,999 20.3 24.2 32.1 19.0 75,000-99,999 9.8 46.9 40.6 25.1 Over 100,000 9.4 40.9 40.7 23.1
Note: Sample size is 1678 out of 2513 because of non-reporting of income.
Offshorability by race and sex
Tables 6 and 7 show only small differences in offshorability between blacks and
whites and between men and women—with one major exception. According to the
external coders, but not the survey respondents, blacks are far less likely to be in
offshorable jobs than whites.
Table 6 Offshorability by Race
Race Percent
of all respondents
Self-classified Inferred Externally Coded
Percent Offshorable
Percent offshorable
Percent offshorable
White 77.1 25.9 28.2 20.2 Black or African American 10.2 24.0 29.6 12.8 American Indian or Alaskan Native 3.2 13.6 25.0 15.4 Asian 3.1 36.0 28.4 36.6 Native Hawaiian or Other Pacific Islander 0.3 28.2 26.1 0.0 Some other Race 9.5 22.9 18.6 25.0

29
Table 7
Offshorability by Gender
Gender Percent of all respondents
Self-classified Inferred Externally Coded
Percent offshorable
Percent offshorable
Percent offshorable
Male 53.6 25.2 28.9 19.3 Female 46.4 25.2 25.5 21.1
Offshorability by age
Table 8 shows that all three methods strongly agree that the two youngest age
groups—comprising 16- to 24-year-olds—are concentrated in the least offshorable jobs,
and they weakly agree that offshorability by age follows a roughly hill-shaped pattern.
But they disagree on where the peak of the hill comes. According to self-classification,
offshorability peaks at ages 35-44. Our inferred measure of offshorability puts the peak
coming at ages 25-35 instead. And Westat’s professional coders put the peak
offshorability age range at 45-54.
Table 8 Offshorability by Age
Age Group Percent of all respondents
Self-classified Inferred Externally Coded
Percent offshorable
Percent offshorable
Percent offshorable
16-19 5.5 13.8 12.6 6.4 20-24 7.7 12.8 11.2 12.8 25-34 21.7 27.0 36.8 20.3 35-44 22.0 29.8 27.1 21.0 45-54 26.0 27.2 30.0 24.2 55-64 13.0 24.2 24.1 19.8 65+ 4.1 19.6 21.8 21.4
Offshorability by geographical region
Finally, does the offshorability of U.S. jobs vary much by region? Table 9 shows that
the answer is no.
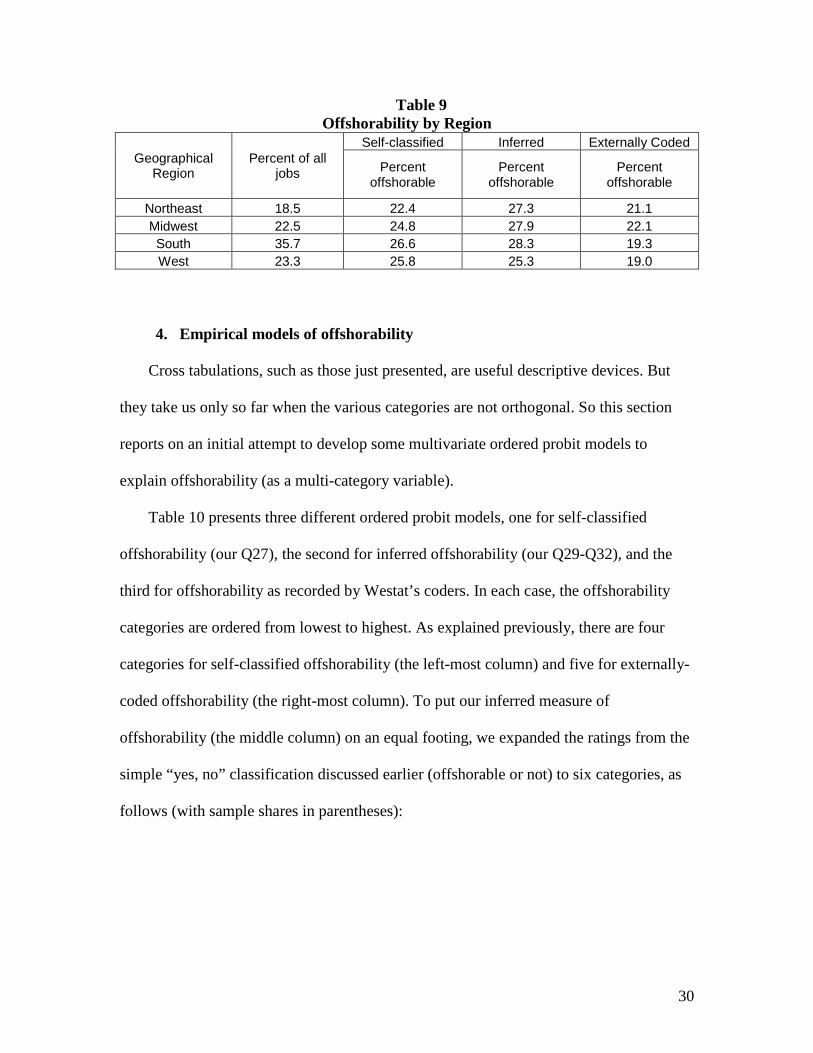
30
Table 9 Offshorability by Region
Geographical Region
Percent of all jobs
Self-classified Inferred Externally Coded
Percent offshorable
Percent offshorable
Percent offshorable
Northeast 18.5 22.4 27.3 21.1 Midwest 22.5 24.8 27.9 22.1 South 35.7 26.6 28.3 19.3 West 23.3 25.8 25.3 19.0
4. Empirical models of offshorability
Cross tabulations, such as those just presented, are useful descriptive devices. But
they take us only so far when the various categories are not orthogonal. So this section
reports on an initial attempt to develop some multivariate ordered probit models to
explain offshorability (as a multi-category variable).
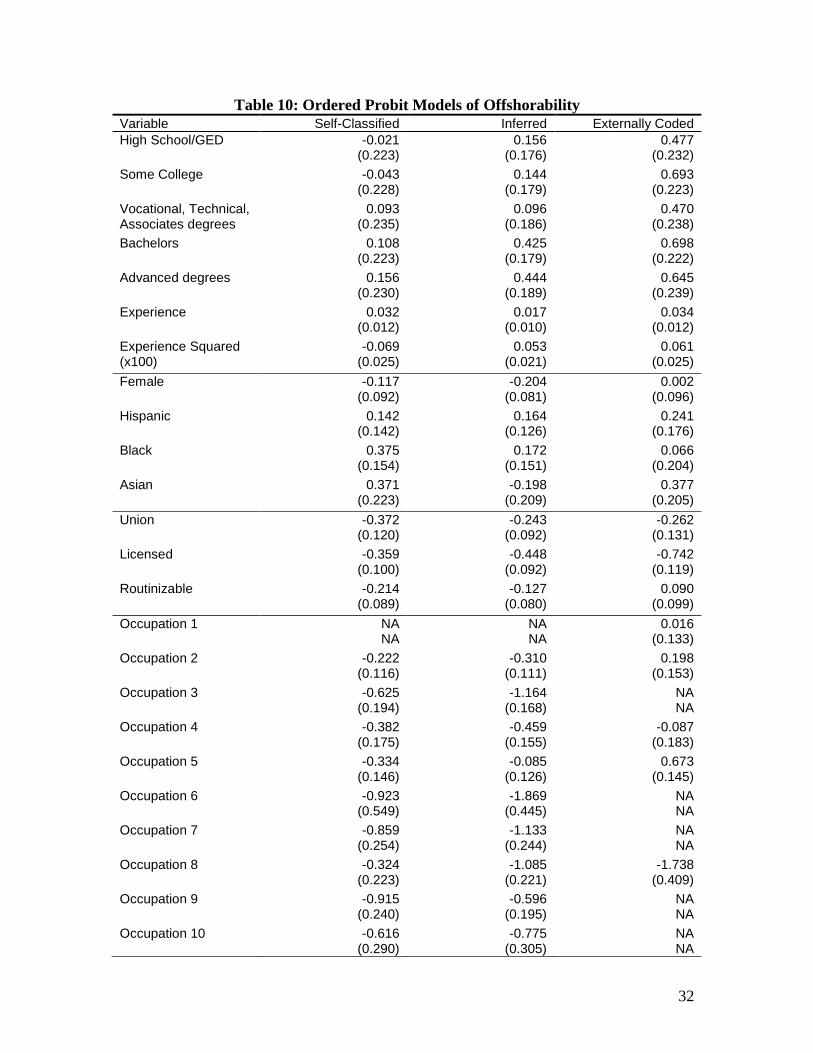
Table 10 presents three different ordered probit models, one for self-classified
offshorability (our Q27), the second for inferred offshorability (our Q29-Q32), and the
third for offshorability as recorded by Westat’s coders. In each case, the offshorability
categories are ordered from lowest to highest. As explained previously, there are four
categories for self-classified offshorability (the left-most column) and five for externally-
coded offshorability (the right-most column). To put our inferred measure of
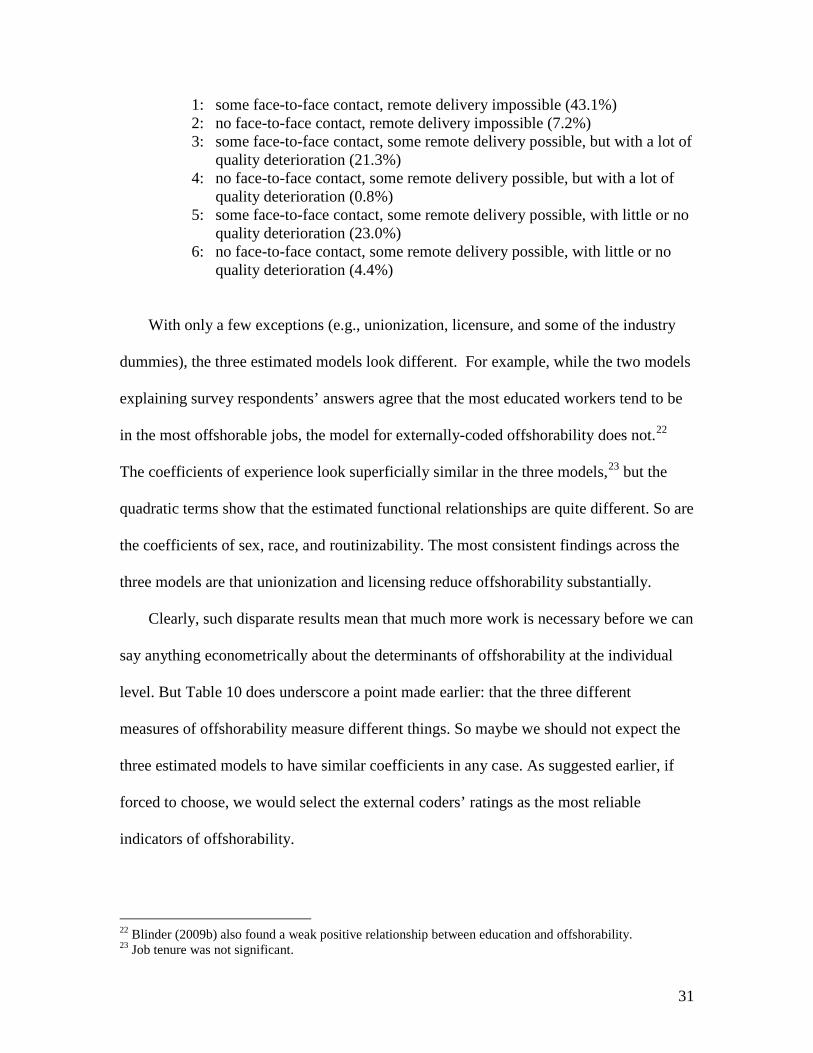
offshorability (the middle column) on an equal footing, we expanded the ratings from the
simple “yes, no” classification discussed earlier (offshorable or not) to six categories, as
follows (with sample shares in parentheses):
31
1: some face-to-face contact, remote delivery impossible (43.1%) 2: no face-to-face contact, remote delivery impossible (7.2%) 3: some face-to-face contact, some remote delivery possible, but with a lot of
quality deterioration (21.3%) 4: no face-to-face contact, some remote delivery possible, but with a lot of
quality deterioration (0.8%) 5: some face-to-face contact, some remote delivery possible, with little or no
quality deterioration (23.0%) 6: no face-to-face contact, some remote delivery possible, with little or no
quality deterioration (4.4%)
With only a few exceptions (e.g., unionization, licensure, and some of the industry
dummies), the three estimated models look different. For example, while the two models
explaining survey respondents’ answers agree that the most educated workers tend to be
in the most offshorable jobs, the model for externally-coded offshorability does not.22
The coefficients of experience look superficially similar in the three models,23
Clearly, such disparate results mean that much more work is necessary before we can
say anything econometrically about the determinants of offshorability at the individual
level. But Table 10 does underscore a point made earlier: that the three different
measures of offshorability measure different things. So maybe we should not expect the
three estimated models to have similar coefficients in any case. As suggested earlier, if
forced to choose, we would select the external coders’ ratings as the most reliable
indicators of offshorability.
but the
quadratic terms show that the estimated functional relationships are quite different. So are
the coefficients of sex, race, and routinizability. The most consistent findings across the
three models are that unionization and licensing reduce offshorability substantially.
22 Blinder (2009b) also found a weak positive relationship between education and offshorability. 23 Job tenure was not significant.
32
Table 10: Ordered Probit Models of Offshorability Variable Self-Classified Inferred Externally Coded High School/GED -0.021
(0.223) 0.156
(0.176) 0.477
(0.232) Some College -0.043
(0.228) 0.144
(0.179) 0.693
(0.223) Vocational, Technical, Associates degrees
0.093 (0.235)
0.096 (0.186)
0.470 (0.238)
Bachelors 0.108 (0.223)
0.425 (0.179)
0.698 (0.222)
Advanced degrees 0.156 (0.230)
0.444 (0.189)
0.645 (0.239)
Experience 0.032 (0.012)
0.017 (0.010)
0.034 (0.012)
Experience Squared (x100)
-0.069 (0.025)
0.053 (0.021)
0.061 (0.025)
Female -0.117 (0.092)
-0.204 (0.081)
0.002 (0.096)
Hispanic 0.142 (0.142)
0.164 (0.126)
0.241 (0.176)
Black 0.375 (0.154)
0.172 (0.151)
0.066 (0.204)
Asian 0.371 (0.223)
-0.198 (0.209)
0.377 (0.205)
Union -0.372 (0.120)
-0.243 (0.092)
-0.262 (0.131)
Licensed -0.359 (0.100)
-0.448 (0.092)
-0.742 (0.119)
Routinizable -0.214 (0.089)
-0.127 (0.080)
0.090 (0.099)
Occupation 1 NA NA
NA NA
0.016 (0.133)
Occupation 2 -0.222 (0.116)
-0.310 (0.111)
0.198 (0.153)
Occupation 3 -0.625 (0.194)
-1.164 (0.168)
NA NA
Occupation 4 -0.382 (0.175)
-0.459 (0.155)
-0.087 (0.183)
Occupation 5 -0.334 (0.146)
-0.085 (0.126)
0.673 (0.145)
Occupation 6 -0.923 (0.549)
-1.869 (0.445)
NA NA
Occupation 7 -0.859 (0.254)
-1.133 (0.244)
NA NA
Occupation 8 -0.324 (0.223)
-1.085 (0.221)
-1.738 (0.409)
Occupation 9 -0.915 (0.240)
-0.596 (0.195)
NA NA
Occupation 10 -0.616 (0.290)
-0.775 (0.305)
NA NA

33
Industry 31 0.112 (0.158)
0.012 (0.129)
1.112 (0.147)
Industry 44 -0.003 (0.200)
-0.276 (0.217)
-0.376 (0.186)
Industry 48 -0.480 (0.278)
-0.092 (0.240)
-0.224 (0.249)
Industry 51 0.440 (0.178)
0.497 (0.183)
0.622 (0.209)
Industry 52 0.520 (0.204)
0.465 (0.179)
0.927 (0.177)
Industry 54 0.632 (0.152)
0.354 (0.133)
0.524 (0.153)
Industry 56 0.135 (0.248)
-0.011 (0.200)
0.611 (0.202)
Industry 61 -0.347 (0.150)
-0.399 (0.134)
-0.599 (0.165)
Industry 62 -0.243 (0.147)
-0.302 (0.123)
-0.564 (0.157)
Industry 71 -0.091 (0.332)
-0.301 (0.352)
0.125 (0.478)
Industry 72 -0.056 (0.282)
-0.784 (0.240)
-1.616 (0.323)
Pseudo R Squared 0.113 0.129 0.190 Wald Chi-Square 240.92 460.98 524.03 Sample Size 1919 1917 1923 Note: Robust standard errors in parentheses. Sample is weighted by sample weights.
5. Empirical models of the effects of offshorability
We now turn from the determinants of offshorability to its effects. For example, do
more offshorable jobs pay lower wages, ceteris paribus? Are the people holding such
jobs experience subject to more frequent layoffs?
Offshorability and wages
Starting with wages, we present estimated coefficients (and standard errors) from
three standard log-wage equations in Table 11, adding a set of from three to five
offshorability dummies to each regression. In each case, the offshorability dummies are
ordered so that higher numbers connote greater offshorability, and the omitted category
is the least offshorable. In estimating these wage regressions, we dropped cases in which

34
respondents were unable to report a current wage because they were not currently
employed (roughly 8% of the sample).
In terms of the impact of offshorability on wages (top panel of the table), the results
across the three different measures are consistent only in one respect: With one trivial
(and insignificant) exception, they agree that the least offshorable jobs (the omitted
category) pay the lowest wages, ceteris paribus. This finding is surprising once you
realize that the regression controls for the usual determinants of wages—including
education, experience, unionization, job tenure, and even whether or not the job’s tasks
are mostly routine. By contrast Blinder (2009b), studying occupations rather than
individuals, found that the most offshorable occupations carried a sizable wage penalty.
Beyond that, however, the estimated effects of offshorability on wages, while mostly
statistically significant,24
24 The F-statistics for omitting the offshorability dummies are, respectively, 10.4, 14.7, and 8.1 in the three regressions.
display no consistent pattern across the three regression models.
Using self-classified offshorability, the most offshorable jobs are estimated to pay the
highest wages. With inferred offshorability, the dummies display an erratic up-down-up
pattern. And with externally-coded offshorability, the relationship is hill-shaped: The
highest wages are paid to workers in the three middle categories. Overall, there is no
clear “sign” to the effect of offshorability on wages.

35
Table 11: Log Wage Regressions Variable Self-Classified Inferred Externally Coded Offshorability – 2 -0.032
(0.095) 0.129
(0.060) 0.201
(0.055) Offshorability – 3 0.170
(0.050) 0.138
(0.043) 0.199
(0.069) Offshorability – 4 0.184
(0.044) 0.020
(0.099) 0.180
(0.054) Offshorability – 5 NA
NA 0.194
(0.046) 0.082
(0.058) Offshorability – 6 NA
NA 0.252
(0.111) NA NA
Education 0.063 (0.008)
0.061 (0.008)
0.064 (0.008)
Experience 0.023 (0.004)
0.023 (0.004)
0.023 (0.004)
Experience2 (x100)
-0.043 (0.008)
-0.042 (0.009)
-0.044 (0.008)
Job tenure 0.020 (0.006)
0.020 (0.006)
0.022 (0.005)
Job tenure2 (x100)
-0.022 (0.016)
-0.024 (0.017)
-0.028 (0.016)
Female -0.218 (0.035)
-0.214 (0.035)
-0.231 (0.035)
Hispanic -0.168 (0.058)
-0.174 (0.060)
-0.177 (0.058)
Black -0.126 (0.054)
-0.120 (0.057)
-0.111 (0.057)
Asian 0.250 (0.097)
0.264 (0.104)
0.226 (0.105)
West region 0.113 (0.038)
0.119 (0.039)
0.126 (0.039)
Union 0.052 (0.041)
0.052 (0.041)
0.044 (0.041)
Licensed 0.142 (0.034)
0.166 (0.035)
0.163 (0.036)
Routinizable -0.158 (0.041)
-0.165 (0.043)
-0.168 (0.041)
Widowed -0.244 (0.060)
-0.238 (0.055)
-0.235 (0.060)
Divorced -0.046 (0.048)
-0.048 (0.049)
-0.045 (0.049)
Separated -0.050 (0.164)
-0.025 (0.166)
-0.022 (0.160)
Never Married -0.062 (0.050)
-0.054 (0.051)
-0.050 (0.050)
Constant 1.852 (0.135)
1.826 (0.139)
1.834 (0.135)
R-Squared 0.432 0.431 0.428 RMSE 0.466 0.466 0.467 Sample Size 1336 1334 1336
Note: Robust standard errors in parentheses. Sample is weighted by sample weights.

36
Most of the remaining coefficients in Table 11 are unremarkable, extremely
consistent across specifications, and also insensitive to whether the offshoring dummies
are included or excluded (not shown in the table). Just a few aspects of these otherwise-
standard wage equations are worth noting:
Our survey gathered a direct measure of work experience, rather than relying on
the usual proxy based on age and schooling; and we used that measure in the
regressions reported in Table 11.
The survey also recorded each respondent’s tenure on his or her current job, which
gets independent estimated effects on wages that are similar in magnitude to those
of general experience.25
Routine jobs, as defined earlier, are estimated to pay about 16-17% lower wages
than non-routine jobs--a large effect, equivalent to almost three years more
schooling.
Licensed jobs are estimated to pay 14-16% higher wages than unlicensed jobs,
another large effect.26
Across the four main geographical regions, wages appear to be about 11-12%
higher in the West. The other three regions look about the same.
Offshorability and layoffs
Since offshorability is often associated with job insecurity, our final empirical
question is whether people in more offshorable jobs are more susceptible to layoffs. To
look into this issue, we developed a simple probit model using characteristics of both the
worker and the job to predict the answer to the following survey question: “Have you lost
25 Remember, however, that one more year of experience on the current job increments both “experience” and “job tenure” by one. So, roughly speaking, one year of experience on the present job is worth two years of previous experience. 26 Kleiner and Krueger (2008) also found that licensing has a strong positive effect on wages.
37
a job at any time in the last three years?” This question is admittedly imperfect, as
respondents may have changed jobs (and thus changed job characteristics) during the
three-year period. But short of collecting an entire three-year work history, it is the best
we can do. It also has the advantage of being comparable with studies of data from the
Displaced Workers Survey, which also cover three-year periods (cf. Farber (2009)).
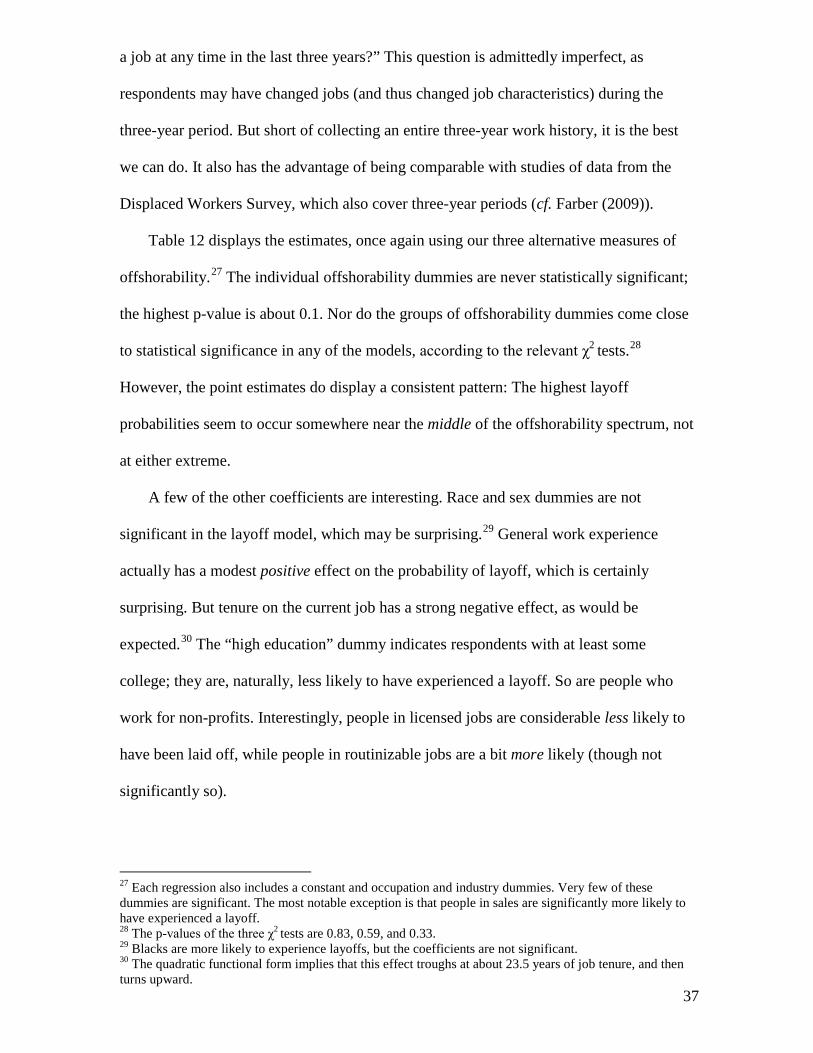
Table 12 displays the estimates, once again using our three alternative measures of
offshorability.27 The individual offshorability dummies are never statistically significant;
the highest p-value is about 0.1. Nor do the groups of offshorability dummies come close
to statistical significance in any of the models, according to the relevant χ2 tests.28
A few of the other coefficients are interesting. Race and sex dummies are not
significant in the layoff model, which may be surprising.
However, the point estimates do display a consistent pattern: The highest layoff
probabilities seem to occur somewhere near the middle of the offshorability spectrum, not
at either extreme.
29 General work experience
actually has a modest positive effect on the probability of layoff, which is certainly
surprising. But tenure on the current job has a strong negative effect, as would be
expected.30
The “high education” dummy indicates respondents with at least some
college; they are, naturally, less likely to have experienced a layoff. So are people who
work for non-profits. Interestingly, people in licensed jobs are considerable less likely to
have been laid off, while people in routinizable jobs are a bit more likely (though not
significantly so).
27 Each regression also includes a constant and occupation and industry dummies. Very few of these dummies are significant. The most notable exception is that people in sales are significantly more likely to have experienced a layoff. 28 The p-values of the three χ2
tests are 0.83, 0.59, and 0.33. 29 Blacks are more likely to experience layoffs, but the coefficients are not significant. 30 The quadratic functional form implies that this effect troughs at about 23.5 years of job tenure, and then turns upward.

38
Table 12: Probit Model of Layoffs
Variable Self-Classified Inferred Externally Coded Offshorability – 2 0.084
(0.520) -0.023
(0.226) 0.134
(0.214) Offshorability – 3 0.177
(0.193) 0.190
(0.168) 0.315
(0.231) Offshorability – 4 0.055
(0.142) 0.550
(0.440) 0.009
(0.216) Offshorability – 5 NA
NA 0.241
(0.174) -0.233
(0.231) Offshorability – 6 NA
NA -0.002
(0.268) NA NA
High Education -0.310 (0.113)
-0.324 (0.114)
-0.306 (0.112)
Experience 0.028 (0.015)
0.028 (0.015)
0.030 (0.015)
Experience Squared (x100)
-0.032 (0.032)
-0.030 (0.032)
-0.035 (0.032)
Tenure -0.236 (0.024)
-0.237 (0.025)
-0.236 (0.024)
Tenure Squared (x100)
0.502 (0.061)
0.506 (0.062)
0.501 (0.062)
Female -0.169 (0.130)
-0.134 (0.132)
-0.157 (0.130)
Hispanic -0.082 (0.174)
-0.084 (0.177)
-0.075 (0.172)
Black 0.168 (0.195)
0.168 (0.198)
0.183 (0.193)
Asian -0.564 (0.388)
-0.563 (0.388)
-0.554 (0.383)
Government -0.150 (0.189)
-0.163 (0.192)
-0.111 (0.190)
Non-Profit -0.360 (0.179)
-0.370 (0.183)
-0.358 (0.180)
Union 0.078 (0.162)
0.080 (0.161)
0.045 (0.156)
License -0.404 (0.150)
-0.384 (0.152)
-0.401 (0.152)
Routinizable 0.166 (0.125)
0.188 (0.123)
0.172 (0.122)
Constant -0.689 (0.319)
-0.828 (0.330)
-0.764 (0.313)
Pseudo R Squared 0.284 0.287 0.287 Wald Chi-Square 176.64 171.70 178.84 Sample Size 1904 1903 1908
As a quick summary of both Tables 11 and 12, we would say that offshorability has
pretty minor estimated effects on either wages or layoff probabilities.
39
6. Summary
We have examined several ways to use conventional survey techniques to assess the
offshorability of the jobs that American workers held in 2008. All of our measures agree
that roughly 25% of U.S. jobs are potentially offshorable. When reduced to binary
indicators of whether a person’s job is offshorable or not, our three preferred measures of
offshorability agree between 70% and 80% of the time. Furthermore, subject to a great
deal of uncertainty owing to the fact that there is no objective standard of comparison,31
In terms of empirical findings, offshorability appears to be particularly prevalent in
production work and in office and administrative jobs. By industry group, it is most
common in manufacturing, finance and insurance, information services, and professional
and technical services. More educated workers appear to hold somewhat more offshorable
jobs. But differences in offshorability by race, sex, age, and geographic region are all
minor. In estimated multivariate econometric models, offshorability does not appear to
have consistent systematic effects on either wages or the probability of layoff. When
offshorability is treated as the dependent variable, its econometric determinants are quite
sensitive to how offshorability is measured. However, union members and people in
licensed positions are always less likely to hold offshorable jobs; and, perhaps
surprisingly, routine work is no more likely to be offshorable than other work.
we judge that professional coders provide the most accurate assessments of offshorability.
This is very good news since it implies that, e.g., the Census Bureau could collect data on
offshorability on a routine basis without adding a single question to the CPS.
31 However, there is high inter-coder reliability.

40
References
Autor, David H., Frank Levy, and Richard J. Murnane. 2003. “The Skill Content of Recent Technological Change.” Quarterly Journal of Economics, 118 (4, November): 1279–1333.
Bardhan, Ashok D., and Cynthia Kroll. 2003. “The New Wave of Outsourcing.” Fisher Center for Real Estate & Urban Economics Working Paper 1103, University of California, Berkeley, Fall 2003.
Blinder, Alan S. 2006. “Offshoring: The Next Industrial Revolution?” Foreign Affairs, 85 (2, March/April): 113–128.
Blinder, Alan S., and Jagdish Bhagwati. 2009a. Offshoring of American Jobs: What Response from U.S. Economic Policy? Boston: MIT Press, forthcoming.
Blinder, Alan S. 2009b. “How Many U.S. Jobs Might Be Offshorable.” World Economics, 10 (2, April-June): 41–78.
Farber, Henry S. 2009. “Job Loss and the Decline in Job Security in the United States,” Forthcoming in Labor in the New Economy, ed. Katharine G. Abraham, James R. Spletzer, and Michael Harper. Chicago: University of Chicago Press. (Also Industrial Relations Section Working Paper 520, Princeton University, September 2007.)
Jensen, J. Bradford, and Lori G. Kletzer. 2006. “Tradable Services: Understanding the Scope and Impact of Services Offshoring.” In Brookings Trade Forum 2005: Offshoring White-Collar Work, ed. Lael Brainard, and Susan M. Collins, 75–134. Washington, D.C.: Brookings Institution Press.
Kleiner, Morris M., and Alan S. Krueger. 2008. “The Prevalence and Effects of Occupational Licensing.” Center for Economic Policy Studies Working Paper 174, Princeton University, August 2008. (Also NBER Working Paper 14308.)
Levy, Frank, and Kyoung-Hee Yu. 2006. “Offshoring of Professional Services: Radiology Services from India.” Unpublished, MIT, March 2006.
Maxwell, A.E. 1970. “Comparing the Classification of Subjects by Two Independent Judges.” British Journal of Psychiatry, 116: 651–655.
McKinsey Global Institute. 2005. The Emerging Global Labor Market, June 2005.
van Welsum, Desirée, and Graham Vickery. 2005. “Potential Offshoring of ICT-intensive Using Occupations.” DSTI Information Economy Working Paper 91, Organization for Economic Cooperation and Development (OECD), May 2005.
Zaller, John R. 1992. The Nature and Origins of Mass Opinion. Cambridge, U.K.: Cambridge University Press.