measuring organizational capital in the new economyftp.iza.org/dp1524.pdfmeasuring organizational...
TRANSCRIPT

IZA DP No. 1524
Measuring Organizational Capitalin the New Economy
Sandra E. BlackLisa M. Lynch
DI
SC
US
SI
ON
PA
PE
R S
ER
IE
S
Forschungsinstitutzur Zukunft der ArbeitInstitute for the Studyof Labor
March 2005

Measuring Organizational Capital in the
New Economy
Sandra E. Black UCLA, NBER and IZA Bonn
Lisa M. Lynch
Tufts University, NBER and IZA Bonn
Discussion Paper No. 1524
March 2005
IZA
P.O. Box 7240 53072 Bonn
Germany
Phone: +49-228-3894-0 Fax: +49-228-3894-180
Email: [email protected]
Any opinions expressed here are those of the author(s) and not those of the institute. Research disseminated by IZA may include views on policy, but the institute itself takes no institutional policy positions. The Institute for the Study of Labor (IZA) in Bonn is a local and virtual international research center and a place of communication between science, politics and business. IZA is an independent nonprofit company supported by Deutsche Post World Net. The center is associated with the University of Bonn and offers a stimulating research environment through its research networks, research support, and visitors and doctoral programs. IZA engages in (i) original and internationally competitive research in all fields of labor economics, (ii) development of policy concepts, and (iii) dissemination of research results and concepts to the interested public. IZA Discussion Papers often represent preliminary work and are circulated to encourage discussion. Citation of such a paper should account for its provisional character. A revised version may be available directly from the author.

IZA Discussion Paper No. 1524 March 2005
ABSTRACT
Measuring Organizational Capital in the New Economy∗
A growing body of literature over the past decade suggests that a firm’s organizational structure/capital can contribute in significant ways to the productive capacity of a firm. But, as with other intangible assets, there is no consensus definition of what this organizational capital is, how to measure it, or how to best quantify its contribution to output (either current or future). We try to address this gap in the literature by proposing a definition of organizational capital based on recent empirical work on the impact of organizational capital on firm productivity and workers’ wages. We then discuss in detail how organizational capital has been measured and the measurement issues that face those trying to understand the extent of organizational capital in an economy. JEL Classification: J2, D2 Keywords: human capital, productivity Corresponding author: Lisa M. Lynch The Fletcher School Tufts University Medford, MA 02155 USA Email: [email protected]
∗ This research was supported in part by the National Science Foundation Program on Innovation and Organizational Change. The research in this paper was conducted while the authors were Census Bureau Associates at the UCLA and Boston Research Data Centers. Research results and conclusions are those of the authors and do not necessarily indicate concurrence by the Bureau of the Census. This paper has been screened to ensure that no confidential data are revealed. The authors would like to thank Kathryn Shaw for her informative comments on an earlier draft of this chapter.

2
I. What is Organizational Capital?
A growing body of literature over the past decade suggests that a firm’s
organizational structure/capital can contribute in significant ways to the productive
capacity of a firm. But, as with other intangible assets, there is no consensus definition of
what this organizational capital is, how to measure it, or how to best quantify its
contribution to output (either current or future). Unlike physical capital, its value does
not appear on the balance sheet of a firm, and when firms undertake substantial
organizational change or re-engineering this is typically treated as “consumption” rather
than an increase in the assets of a firm. There is no “market” for organizational capital
that we could use to generate a book value for it, and, unlike general human capital, it is
not portable.
When considering the issue of measuring intangibles, a recent Brookings Task
Force chaired by Margaret Blair and Steven Wallman (2001) suggested that there are
three categories of intangible assets, each with more measurement problems than the next
– the easiest category exists for assets that can be owned and sold, the next category is for
those assets that can be controlled by the firm but not separated out and sold, and finally,
the category with the most difficult measurement issues contains assets that may not be
wholly controlled by the firm. Intangible assets such as copyrights, brand, and trade
names would be in the first category, the relatively easily addressed category of
measurement problems, since they can be bought and sold. However, the degree of
control the firm has over assets such the design of production processes, human capital,
relationship capital, and organizational capital varies along with the ability of the firm to

3
“sell” these assets. As a result, they are much more difficult to measure in the usual
accounting sense.
Before we can discuss how to improve the measurement of organizational capital,
we must first establish a working, albeit crude, definition of organizational capital.1 To
do this we have chosen to focus on some of the elements of organizational capital that
have been shown, in both theoretical and empirical studies, to be associated with higher
productivity for firms and/or higher wages for workers. This is not meant to be an
exhaustive list of all the elements of organizational capital but rather a starting point that
is representative and tractable.
We divide organizational capital into three broad components – workforce
training, employee voice, and work design (including the use of cross-functional
production processes). While we will discuss these categories separately, it is important
to note that there are important links and synergies between each of these categories that
contribute to the overall value of organizational capital within a firm.
Although training is usually thought of in the context of human capital, employer
provided training is an important component of workplace organization and
organizational capital. We assume, for the sake of simplicity, that education decisions
are primarily individual based and made independently from the employment
relationship. But workplace training is a joint decision undertaken by the worker and the
firm to invest in additional skills training after an employment relationship has begun.
1 For a different approach and definition of organization capital see Atkeson and Kehoe (2002). They conclude that nearly half of the output in manufacturing that is not accounted for by payments to labor and capital could be attributed to organization capital. They also conclude that the value of this organization capital is roughly 2/3rd the value of physical capital. They model the acquisition of organization capital as coming from endogenous learning-by doing so it is embodied in the firm and jointly produced with measured output. But their empirical treatment of organization capital is based on plant specific productivity and age rather than any actual workplace practices.

4
This workforce training, along with the education a worker brings to a job, raise the
productive capacity of a firm. Training demands of a firm are not limited to the
introduction of new technology; as new organizational structures such as team work are
put in place, this increases the need of workers to acquire additional training to help them
function in a more interactive group environment. At the same time, organizational
capital may interact with human capital and the ability of a firm to undertake
organizational change may be a function of the human capital of its workforce. Finally,
spillover effects even for “specific training” may be much larger depending on the
organizational structure of a firm in which these investments in human capital are made.
For all of these reasons, then, we include workforce training under our umbrella of
organizational capital.
The second component of organizational capital is employee voice. By this we
mean those organizational structures that give workers, especially non-managerial
workers, input into the decision-making associated with the design of the production
process and greater autonomy and discretion in the structure of their work. Traditional
forms of work organization are very task-specific; each production worker has a specific
task to complete, and once they learn how to accomplish the task, there is little
independent thought involved. However, newer forms of organization involve giving
employees, specifically lower level production workers, more input into the production
process and greater opportunities to improve efficiency. As employee voice increases,
firms are better able to tap into the knowledge of non-managerial workers.
There is a large continuum of practices associated with employee voice. It ranges
from the employee suggestion box in the lunch room, to employees being consulted

5
individually about their views, to individual job enrichment schemes, to employees being
consulted in groups, and finally, to self managed teams where production employees
work in a semi-autonomous setting. In addition, all of this can take place in the context
of unionization, which may serve to help or hinder this communication process. As
discussed by Malcomson (1983), agreements made between managers and workers may
not be legally enforceable so the presence of unions can address incentive compatibility
problems that may arise at the workplace. In addition, negotiations that management
undertakes with workers about the introduction of new workplace practices are less
expensive if the company only has to deal with union specialists rather than each
individual worker.
Our third component of organizational capital is work design, including the use of
cross-functional production processes that result in more flexible allocation and re-
allocation of labor in the firm. Examples of practices in this component include
reengineering efforts that may involve changing the occupational structure of the
workplace (including increasing the number of technical workers), the number of workers
per supervisor, the number of levels of management within the firm, the existence and
diffusion of job rotation, and job share arrangements. We also include in this component
methods by which firms monitor their practices relative to others such as benchmarking.
Some of the changes we see in work design are associated with the introduction and
diffusion of information technologies within the firm. For example, as new technologies
reduce the cost of lateral communication, we see firms using these technologies to
facilitate greater communication between and across workers, both managerial and non-
managerial. Monitoring technologies can also be used to reduce the number of

6
supervisors required in the production process. So there are possible complementarities
between this and other dimensions of organizational capital, as well as with investments
in physical capital.
While it is not a type of organizational capital per se, incentive based
compensation plays an important role in organizational capital. More generally, if we
observe wage premiums being paid in employment situations where there is a higher
level of organizational capital we might, in a very crude way, think of this premium as
another way to “price” the value of the asset we are calling organizational capital.
Employers will use wages and other forms of compensation to try to hold on to this
relational asset. In addition to the basic wage, employers can also pay workers by piece
rate, stock options, profit sharing, and bonuses related to achieving specific production
targets. These are all tools that firms have used to, in part, realign workers’ interests
towards those of shareholders. But when workers are asked to come forward with ideas
that would improve the production process but may also put their own jobs at risk, they
must be given an incentive to do this.
Putting a portion of compensation “at risk”, especially for non-managerial
employees, can have an important effect on the amount and type of relationship capital
that exists within a firm and can have a large effect on workers’ discretionary effort.
Recent work by Boning, Ichniowski, and Shaw (2001) has found strong evidence of
complementarity between employee voice and incentive pay. So while incentive based
pay is not organizational capital per se, it is an important glue that holds the
organizational capital together and keeps it within the firm. Therefore, in the remaining

7
discussion on measurement issues we will also include this dimension of workplace
practices.
Our three components are not an exhaustive list of possible elements of
organizational capital. For example, Kruse and Blasi (1998) identify employment
security and recruitment and selection systems as important components of what they
label high performance work practices. But as with compensation, employment security
and recruitment and selection systems are probably best thought of as “glue” rather than
organizational capital. The next section summarizes some of the empirical work on the
impact organizational capital has had on firms and workers.
II. The Importance of Organizational Capital in the New Economy: Empirical Evidence The importance of correctly measuring organizational capital stems from the
evidence on its impact along a number of dimensions -- labor productivity, wages, and
labor demand. In addition, there is evidence of links between organizational capital,
human capital, and physical capital, especially information and communication
technologies.
In terms of productivity, there is an extensive literature documenting the
relationship between organizational capital and firm performance.2 Examples of intra-
industry studies include work by Ichniowski, Shaw and Prennushi (1995), Arthur (1994),
Kelley (1994 and 1996), Bailey (1993), and Dunlop and Weil (1996). By examining
human resource practices associated with one specific production process it is possible to
greatly reduce problems of underlying heterogeneity of production processes. Most of
2 See Ichniowski and Shaw (2003) for a thorough review of this literature.

8
the intra-industry studies conclude that the adoption of a coherent system of new human
resource management practices such as flexible job definitions, cross-training, and work
teams, along with extensive reliance on incentive pay, results in substantially higher
levels of productivity than more traditional human resource management practices.
Another research strategy is to examine a more representative cross sectional
sample of firms to determine the impact of workplace practices on broader measures of
performance such as productivity or profitability. Examples this strategy include Black
and Lynch (2001, 2004), Bartel (1989), Bresnahan, Brynjolfsson, and Hitt (2002), Caroli
and Van Reenen (2001), Ichniowski (1990), Huselid (1995), Huselid and Becker (1996),
and Delaney and Huselid (1996). All of these studies have found a correlation between
human resource management systems and business performance as measured by labor
productivity, Tobin’s q, or present value gain in cash flow and firm market value. Many
of these have also found evidence of the existence of synergies among workplace
practices: the total impact is greater than the sum of the parts.3
Given that this volume is interested in measurement issues from the perspective of
the economy as a whole, is it possible to translate some of the micro based evidence on
the impact of organizational capital on labor productivity to the economy more generally?
In particular, since a large fraction of the output growth in manufacturing in the 1990s
was driven by increases in multifactor productivity, can any of this be potentially
attributed to organizational capital? In Black and Lynch (2004), we use our estimates of
3 The theoretical work of Milgrom and Roberts (1995) and Kandel and Lazear (1992), along with the empirical studies mentioned above, are important contributions in this area. Milgrom and Roberts argue that the impact of a system of human resource practices will be greater than the sum of its parts because of the synergistic effects of bundling practices together. Kandel and Lazear argue that introducing a profit sharing plan for all workers in a firm may have little or no impact on productivity unless it is linked with other practices that address the inherent free rider problem associated with corporate wide profit sharing plans.

9
the impact of workplace practices on labor productivity in manufacturing (done using
establishment level data) in a growth accounting framework in order to see, roughly, how
much of the overall growth in manufacturing during 1993-1995 our measures of
workplace innovation could account for. We present these calculations again in Table 1
along with the figures reported by the BLS over the same time period to “benchmark” our
findings with their numbers. As seen in this table, the sample of manufacturing
establishments that we used in our empirical work (the Educational Quality of the
Workforce, EQW, survey) experienced very similar output growth over the period 1993-
1996 as reported by the BLS for the country as a whole. The BLS reports that output
growth in manufacturing grew at a compound average annual growth rate of 4.2 percent
between 1993-1996. We find a rate of 4.7 percent using the EQW data over the same
period. The BLS reports that combined inputs (capital, labor and materials) grew 2.3
percent over this period and using the estimated coefficients from our empirical work
(Black and Lynch (2004)) as shares we find inputs grew at 3.2 percent for the EQW
sample. As a result, multifactor productivity grew 1.9 percent in the BLS reported
figures and 1.6 percent using EQW data.
As a rough approximation of the contribution of organizational capital, we use the
coefficients on the workplace practices that come from our micro level production
function estimation to calculate the impact of workplace innovation on multifactor
productivity. We find that they contributed 1.4 percentage points per year. In other
words, changes in organizational capital may have accounted for approximately 30
percent of output growth in manufacturing over the period 1993-1996, or 89 percent of
multifactor productivity. An important caveat is that many of the components of

10
workplace organization such as re-engineering reflect both technological as well as
organizational changes. Though the number seems high, we believe that this accounting
exercise indicates that measuring organizational capital can go some way in explaining
recent trends in multifactor productivity.
Given that it improves productivity, it is not surprising to find that organizational
capital also has an impact on workers, both in terms of their wages and in terms of skill
demand. Investments in organizational capital seem likely to benefit the workforce
because workers are unlikely to contribute in the manner these practices require unless
they are assured a share of the gains (Osterman (2000)). Organizational changes may
also require a higher level of human capital from individual workers since they need to
deal effectively with increased uncertainty and responsibility (see Osterman (1994) and
Lynch and Black (1998).) In terms of the empirical work on the impact of organizational
capital on wages, the evidence is mixed. Using data from a representative sample of
employers, Osterman (2000) finds no impact of work organization practices on wages of
either core workers or all workers over the period 1996-1997, and Cappelli and Cater
(2000) find no impact on wages of non-manufacturing workers. In contrast, both Black,
Lynch and Krivelyova (2004) and Cappelli and Neumark (2001) find that wages of
manufacturing workers increase when employers extend their usage of organizational
practices such as team work. Black, Lynch and Krivelyova (2004) also find that the
impact of organizational capital has the largest effect on the wages of supervisors,
production and sales/clerical workers in the manufacturing sector.
The March 2001 Industrial and Labor Relations Review is a special issue devoted
to the impact of technology and work organization on wage inequality at the industry

11
level. While not all studies in this volume were able to have access to data on
organizational capital, some studies in this volume, such as Hunter et. al., Batt, and
Bailey et. al., find a significant relationship between workplace organizational practices
and earnings.
While there has been less done on the impact of organizational capital on labor
demand, several recent studies have looked at this question. Theoretically, as discussed
by Kremer and Maskin (1996), Acemoglu (2000) and reviewed in the context of
organizational change and wage inequality by Aghion, Caroli and Garcia-Peñolosa
(1999), when technological and organizational change take place, skill homogeneity can
increase within firms. Therefore, if technical change and organizational change are
complementary activities, as argued in Bresnahan et. al. (2002), and since technical
progress tends to be skill-biased, it may be the case the organizational change would also
be skill-biased. Osterman (2000) finds that measures of organizational capital are
associated with a higher probability of layoffs, even within firms that have been
experiencing net gains in total employment. This is suggestive of the reallocation process
hypothesized in Kremer and Maskin and Acemoglu. Caroli and Van Reenen (2001) find
evidence for British and French firms that a variety of measures, consistent with our
definition of organizational capital, are associated with reduced demand for unskilled
workers in both countries.
While the focus of this paper is not on measuring information technology, several
researchers have found strong positive correlations between firms’ decisions to adopt
new technologies, especially information technology, and additional investment in
organizational capital. Bresnahan, Brynjolfsson and Hitt (2002) find evidence of strong

12
complementarity between several indicators of IT use, workplace organization and the
demand for skilled labor. The positive correlation between computers and workplace
practices is also shown in Lynch and Black (1998) and Caroli and Van Reenen (2001).
Finally, it is important to note that while we have divided our measure of organizational
capital into three components there is an extensive literature both theoretical and
empirical which suggests the existence of synergies in practices. For example, Athey and
Stern (1998) discuss how the existence of complementarity in workplace practices
implies that the adoption of one practice has externalities for adoption decisions about
other practices. In addition, if practices are adopted in clusters, then some combinations
of practices may occur only infrequently making it difficult, empirically, to precisely
estimate the impact of these practices on outcomes such as productivity.
III. How Has Organizational Capital Been Measured?
Data on organizational capital and related components such as compensation,
recruitment and selection methods, and employment security provisions have been
collected at three levels of aggregation. The first level of aggregation is case studies of
individual companies. One of the most famous examples is the 1983 Harvard Business
School case study of the Lincoln Electric Company by Norman Berg and Norman Fast
or, more recently, Ann Bartel’s 2000 study of a Canadian bank. The next level of
aggregation includes detailed intra-industry studies such as the work by Ichniowski,
Shaw and Prennushi (1997) on the integrated steel industry. One of the many benefits of
intra-industry data is the ability to examine organizational practices without the

13
confounding effect of different production processes and organizational structure that are
due to the production of different goods.
But the focus of this paper is to examine how more nationally representative
surveys of businesses have attempted to capture these measures of organizational capital.
This will help identify whether or not there are some measures of organizational capital
that might be relatively easy to add to nationally representative ongoing surveys of
businesses. This could be especially useful from a national incomes account perspective.
For this purpose we focus on micro employer surveys from the 1990s that measure the
components of organizational capital we believe have been shown to be the most
important in analyses of productivity, wages, and labor demand.
One of the earliest surveys of workplace practices to use these measures to study
their impact on labor productivity and Tobin’s q was Ichniowski (1990). He used data
on personnel policies and practices taken from a 1986 survey by Columbia University’s
Industrial Relations Research Center covering 495 Compustat II business lines. This was
a mailed survey of the Compustat sample with a ten percent response rate. Tables 2-4
summarize some of the questions used from this survey divided into the three
components of organizational capital we are looking at --- training, employee voice, and
work design. The training measure is a simple incidence of formal training. The
employee voice measure is primarily the right of workers to voice complaints under some
form of due process rather than any type of direct employee participation in decision
making within the firm. Finally, the measure of work design collapses a variety of
different work structures into one variable. In the empirical work done with these

14
measures, they are not introduced on their own but rather are collapsed into nine clusters
of practices.
Mark Huselid conducted two mailed surveys of U.S. firms in 1992 and 1994.
Surveys were mailed to 3,477 firms in 1992 and 3,847 firms in 1994, and employers were
asked about their organizational practices in the previous year. The sample was drawn
from the 12,000 publicly held firms listed in Compact Disclosure, a commercially
available data base containing annual 10-K reports. The overall response rate was twenty
eight percent in 1992 and twenty percent in 1994. In addition, there was a sub sample of
firms that responded to both surveys, allowing for longitudinal analysis of organizational
structure and performance outcomes of the firm. The survey included information on a
wide range of organizational practices (shown in table 2-4). The responses to these
questions were then factor analyzed to see their impact on Tobin’s q and the gross rate of
return on assets.
While Ichniowski and Huselid both focused their surveys on large business lines
or entire firms, Paul Osterman employed a slightly different strategy and focused on
individual establishments. He conducted two telephone surveys (rather than mail) in
1992 and 1997 to compile a nationally representative sample of U.S. establishments. By
directing the questions to establishments rather than corporate headquarters, he hoped to
obtain more accurate information about implementation of workplace practices. The
response rates to the surveys were 65% for 1992 (806 establishments) 58% for 1997 (683
establishments). The 1997 survey also contained a subsample of 462 establishments that
were also interviewed in 1992, thereby allowing for longitudinal analysis. The questions
on workplace practices were restricted, however, to “core” employees within the

15
establishment and covered the proportion of these type of workers in training, self-
managed work teams, job rotation, quality circles or off-line problem solving groups, and
Total Quality Management (see Tables 2-4 for more information on the types of
questions asked).
The Bureau of Labor Statistics (BLS) Survey of Employer Provided Training
(SEPT) was conducted in 1993. While the primary purpose of this survey was to collect
detailed information on employer training provided or financed by private nonagricultural
establishments, information on other organizational practices was also collected. Nearly
12,000 establishments were surveyed, with a response rate of 71.3% (7,895
establishments). In addition to extensive questions on types of training and training
practices, 5,987 establishments provided information on the organization of work. The
target respondent was first the training department, next the human resource department,
and finally, the office manager. Establishments were asked which if any of the following
six work organization practices were in existence in 1993: worker teams; total quality
management, quality circles; peer review of employee performance; employee
involvement in the firm’s technology and equipment purchase decisions; and job rotation.
(See Gittleman, Horrigan, and Joyce (1998) for more details as well as Tables 2-4.)
The dataset we have used for our own work on labor productivity, training and
wages (e.g. Black and Lynch (1996, 2001, 2004), Black, Lynch and Krivelyova (2004)
and Lynch and Black (1998)) comes from the EQW National Employers Survey
conducted in 1994 and 1997. The EQW National Employers Survey was first
administered by the U.S. Bureau of the Census as a telephone survey in August and
September 1994 to a nationally representative sample of more than 3,000 private

16
establishments with more than 20 employees. The survey represents a unique source of
information on how employers recruit workers, organize work, invest in physical capital,
and utilize education and training investments. The survey oversampled establishments
in the manufacturing sector and establishments with more than 100 employees. Public
sector employees, not-for-profit institutions, and corporate headquarters were excluded
from the sample. The target respondent in the manufacturing sector was the plant
manager and in the non-manufacturing sector was the local business site manager.
However, the survey was designed to allow for multiple respondents, so that information
could be obtained from establishments that kept financial information such as the book
value of capital or the cost of goods and materials used in production at a separate finance
office (typically at corporate headquarters for multi-establishment enterprises).
Computer Assisted Telephone Interviewing (CATI) was used to administer each survey,
which took approximately 28 minutes to complete.
The sampling frame for the survey was the Bureau of the Census SSEL file, one
of the most comprehensive and up-to-date listings of establishments in the United States.
By design, the survey allowed for a subset of establishments to be matched to the Census
Longitudinal Research Database (LRD) that includes longitudinal information for
manufacturing establishments only. The LRD, housed at the Center for Economic
Studies at the Bureau of the Census, was created by longitudinally linking the
establishment level data from the Bureau of the Census's Annual Survey of
Manufacturers (ASM). The LRD data include information on shipments, materials,
inventories, employment, expenditures on equipment and structures, book values of
equipment and structures, and energy use (for more information on the LRD see Davis

17
and Haltiwanger (1991)). Because we are able to match the LRD with the EQW-NES,
we have annual establishment level data on inputs and outputs of production for the
manufacturing employers in our survey. It is important to note that the LRD is basically
the universe of all manufacturing establishments with more than 250 employees but is
only a sub-sample of establishments with less than 250 employees.
The response rate for manufacturing establishments in the 1994 EQW National
Employers Survey was 66 percent (1621 establishments) and 60.6% (1324
establishments) for non-manufacturing establishments. These response rates are
substantially higher than most other voluntary establishment surveys. Probit analysis
(available from the authors upon request) of the characteristics of non-respondents
indicates that there was no significant pattern at the two digit industry level in the
likelihood of participating in the survey. The only businesses more likely not to
participate were manufacturing establishments with more than 1000 employees.
The telephone survey was repeated again in 1997 and the overall response rate
was 59% (4139 establishments). There was also a subsample of 766 establishments who
had been interviewed in 1994. The response rate of establishments in the longitudinal
sample was 74 percent. In both surveys, a wide range of questions were asked about
training and workplace practices. The training questions included not only incidence
measures of whether or not the establishment undertook any formal training of its
workers but also types of training (e.g. computer literacy, team work training, literacy
training), the proportion of workers trained by five occupational categories, and the
percentage of total labor costs that training expenditures represented. In terms of
employee voice, the survey included questions about the proportion of non-managerial

18
workers meeting regularly to discuss workplace issues, TQM, the proportion of workers
in self-managed teams, and union status. For work design, the surveys included
questions about the usage of benchmarking, the percentage of workers in job rotation, the
number of managerial layers, and whether or not the establishment had undergone any
reengineering efforts.
The last surveys we examine are those British and French datasets used by Caroli
and VanReenan (2001) for their work on workplace organization and skill demand. The
British data is from the British Workplace Industrial Relations Survey (WIRS), an
establishment level dataset that consists of a cross section of over 2000 British
establishments in 1984 and 1990. In 1984, there are a number of questions that relate to
organization change and in 1990 there is a limited follow-up that asks more basic
information. In both surveys, senior managers are asked whether there has been an
introduction of new plant, machinery, or equipment that includes new micro-electronic
technology; the introduction of new plant, machinery or equipment not including new
micro-electronic technologies, and whether there have been substantial changes in work
organization or working practices not involving new plant, machinery or equipment; a
positive response to the last question would indicate changes in organizational capital.
Caroli and Van Reenan attempted to verify that the change in organizational capital
indicated in the survey actually corresponded to changes in relevant workplace practices
by examining the 1984 data, in which managers were asked in more detail what the
change actually involved. In general, this change in work organization was associated
with increases in responsibility and is more likely to be associated with a widening range
of more interesting tasks performed by workers.

19
The corresponding French dataset is the REPONSE (Relations Professionnelles et
Negociations d’Entreprise) that was constructed with reference to the British WIRS.
They surveyed 2500 establishments, asking senior managers in 1992 about industrial
relations and organization in 1989-1992. This survey includes more detailed information
on workplace organization, including explicit questions on delayering (removing one or
more managerial levels), quality circles, and total quality management. (See Caroli and
VanReenan (2001) for more details on both the British and the French surveys.)
It is clear that there is no “one way” that has been used to conduct these surveys.
All of these surveys target different respondents, use a range of sampling frames, target
different levels of the firm (from the establishment to business lines to the firm as a
whole) for measures of organizational practices, utilize different methods to conduct the
survey (mailed or telephone), and have a range of response rates. The next section of the
paper summarizes some of measurement problems that arise from this range of strategies
to collect information on organizational capital.
IV. Measurement Issues
There are a number of issues regarding data collection for organizational capital;
however, many of these issues are not unique to organizational capital. One of the more
basic questions is what is the appropriate business unit to study when considering
organizational structure. Does each firm have a particular organizational structure, or is
it even deeper than that; does organizational structure vary within the firm across
establishments? Interestingly, there has been little focus on this question, with a variety
of studies using different units of observation. Bartel (1989) uses a data set in which the

20
business line is the unit of observation, Huselid (1995) and Huselid and Becker (1996)
use firm level data, while Black and Lynch (1996, 2001, 2004) use establishment level
data.
Once the appropriate unit of observation is determined, the next question becomes
who should be surveyed. Responses obtained from workers within a firm might be
different from those obtained from managers, which in turn may be different from
responses from human resource workers. In the training literature, there is evidence that
firms report that significantly more training is given by firms than is actually received by
workers when workers are queried (see for example Barron, Berger and Black (1997) and
Barron, Berger and Black (1999)). Generally, the literature to date has focused on
employer surveys under the assumption that employers have a better knowledge of the
workplace structure and training that is being implemented. In addition, recent data
collection efforts have focused on the human resource officer or training manager as the
target respondent for questions pertaining to organizational structure. For smaller firms,
this individual may be sufficiently knowledgeable to also answer questions on the
financial aspect of the firm. However, with larger firms and perhaps more detailed
surveys, as was the case in the EQW-NES, there may be multiple target respondents, with
the financial officer answering questions on investment and output and the human
resource officer answering questions on organizational structure.
Other issues that make organizational capital hard to measure deal with its
intangible nature. The ability to calculate the depreciation rate of intangible goods has
long eluded economists. High turnover could cause organizational capital to depreciate
very quickly, whereas strong firm attachment could slow depreciation.

21
When considering the best way to measure organizational capital, evidence
suggests that incidence of activities is not sufficient. It is crucial to know not only
whether or not practices were implemented, but also how these practices are diffused
both across employees/occupations and among employees within occupations. In
addition, how long the practices have been in effect and what the start-up costs were,
both direct in terms of dollars spent by the firm and indirect in terms of worker time are
also found to affect wages, productivity, and skill demand. Finally, how are these
practices being used together.
While the previous section of this paper summarized overall response rates to
surveys that asked questions about organizational practices, the overall response rates do
not reveal variations in response rates to specific types of questions included in these
surveys. Sometimes employers are confused by jargon that is unfamiliar to them, or are
concerned that answering a question may reveal proprietary information. Or employers
may simply have a difficult time coming up with an accurate answer in the context of a
short telephone or mailed survey. Therefore, it is important to understand which types of
questions employers have an easier time responding to. In order to understand the
efficacy of recent efforts to characterize workplace organization, it is useful to
“benchmark” our relative success of getting responses to measures of organizational
capital with more traditional questions of employer practices. Table 5 presents response
rates for what we generally consider to be standard production function variables, broken
down by manufacturing and non-manufacturing and then further broken down by firm
size, using our 1994 EQW-NES survey. As one can see, response rates vary significantly
across variables and firm size.

22
Interestingly, it is the larger establishments that have lower response rates; large
non-manufacturing firms have the lowest response rates across the board. Though this
may seem surprising, it may be the case that larger employers are more restricted in terms
of the information they are able to release without approval from corporate headquarters.
This limitation highlights the importance of allowing for multiple respondents in the
survey.
In terms of specific variables, information on materials used generates the highest
non-response rate, with only 59% of manufacturing firms and 45% of manufacturing
firms responding. Second is capital, with a slightly higher (64% manufacturing, 54%
non-manufacturing) response rate. Establishments seem most able or willing to respond
to questions about employment and the breakdown of the labor force, with response rates
in each occupation category of about 87 percent.
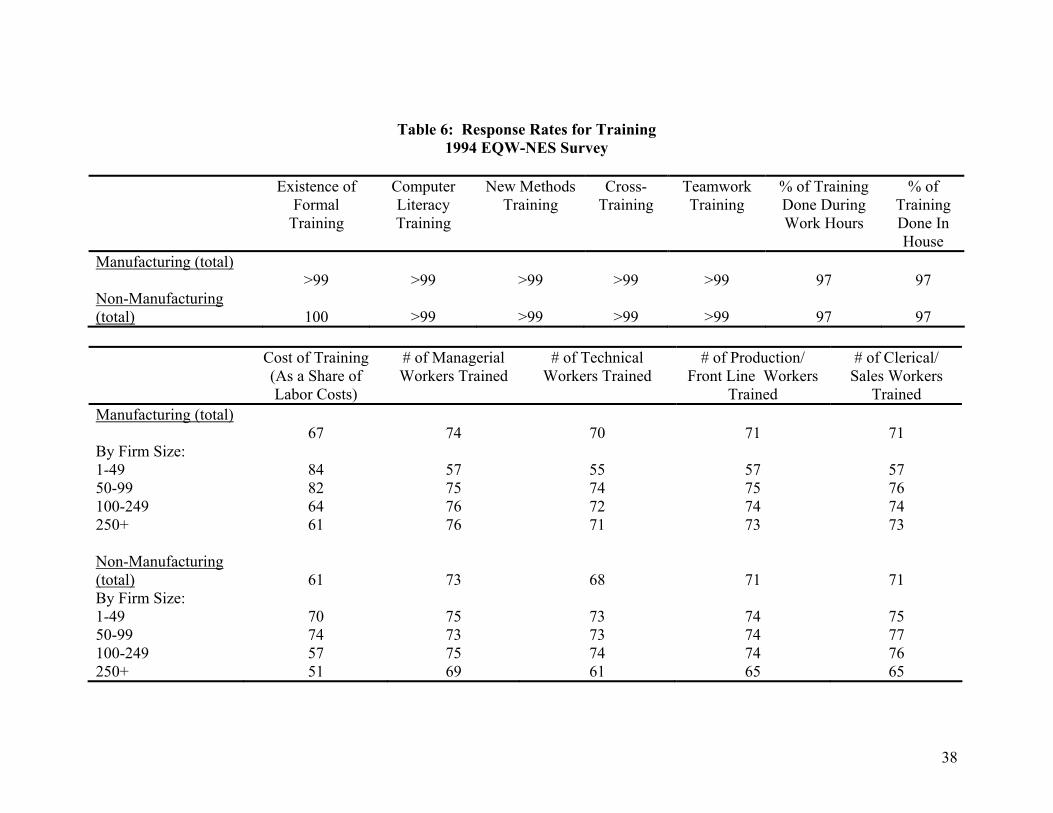
These response rates provide a benchmark with which one can consider response
rates for survey questions on organizational capital. Table 6 provides evidence on
response rates for questions regarding training. The top panel shows response rates for
types of training, measuring incidence alone. It is clear that these questions are relatively
easy for firms to answer, and these factors have been shown to be important factors in
production function estimation (Black and Lynch, 1996).
The bottom panel of Table 6 shows that, when one moves beyond the incidence of
training, response rates begin to fall. An important factor to measure is the cost of doing
training; however, response rates in column 1 suggest that firms, particularly large firms,
are not willing/able to answer these questions. In contrast, it is the larger firms in
manufacturing industries who seem best able to answer the number of workers trained by

23
occupation; the smallest firms have very low response rates. Among non-manufacturing
firms, the opposite is true, and response rates drop for the largest firms.
It is clear that, when training is measured along these dimensions, it is more
difficult to get information from the establishments. However, it is particularly important
to do so in order to build up some measure of the stock of additional human capital being
added to the firm (similar to new capital investment). And though it is more difficult to
obtain than simple incidence measures, response rates to these questions are still higher
than those for standard capital and materials measures.
Table 7 focuses on another aspect of organizational capital: employee voice.
Commonly used measures include the existence of a total quality management (TQM)
system, the percentage of production or frontline workers meeting in groups, and whether
or not an establishment is unionized. As Table 7 shows, response rates to all of these
questions are relatively high, averaging a bit more than 90%. These variables have
repeatedly been shown to have important impacts on wages as well as productivity.
Establishments also appear to be able to answer questions about the organization
of the workplace. As Table 8 shows, response rates for questions on the organization of
the workplace are high, both in manufacturing and non-manufacturing, large and small
establishments. Again, the high response rates are particularly important given that these
variables have also been shown to have an impact on productivity and wages in the
empirical work.
On the compensation side, there is a bit more variation in response rates (See
Table 9). Profit sharing appears to be relatively easy for firms to answer, with response
rates hovering around 90% in all occupations except technicians, which have slightly

24
lower response rates (particularly in non-manufacturing and small firms). However,
response rates drop significantly when one looks at wages. Again, technicians have the
lowest response rates among the occupations. Although response rates seem much lower,
it is important to note that they are still significantly higher than those for more
commonly collected variables such as capital and materials. As with the more commonly
collected variables from Table 5, response rates fall for larger firms.
Responses to questions, though necessary, is not sufficient. If all firms respond to
a question but there is no variation across firms, it is difficult to impossible to identify the
impact of that practice on establishment or worker outcomes. Given that we know which
questions firms are best willing or able to answer, it is next important to examine how
much variation there is in these practices, both across firms and over time. For example,
if all firms indicate that they have some informal training in place (incidence), we would
not be able to disentangle the effect of informal training on outcome measures.
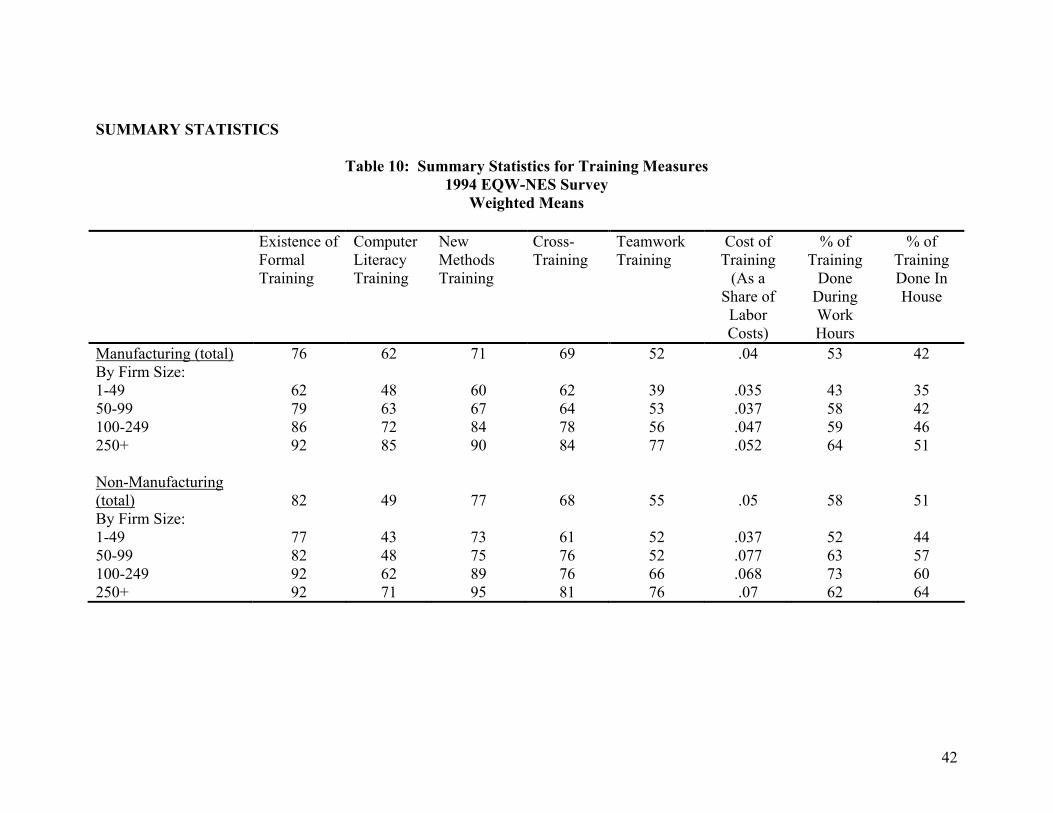
Tables 10 through 13 present weighted means for a variety of workplace practices
across manufacturing and non-manufacturing firms and by firm size. Table 10 shows the
incidence of different types of training and then the cost of training, the percentage of
training done during work hours, and the percentage of training done in-house. Among
types of training, smaller firms tend to do less training and there is consideration
variation across firm size (see Lynch and Black (1998) for a review). There is also
substantial variation across types of training, with fewer firms, on average providing
computer literacy training and more firms providing new methods training. There is also
substantial variation across the costs of training. Consistent with the idea that large firms
provide more training, training is a higher share of total labor costs for large firms, and

25
there is substantial variation both across firm size and between manufacturing and non-
manufacturing firms. Finally, there is substantial variation in the timing and location of
training, with small firms more likely to outsource and provide training outside of work
hours. These variables have also been shown to have an association with establishment
productivity (See Black and Lynch (1996)).
Table 11 shows that there is even more variation, relatively speaking, when one
looks at employee voice. Among manufacturing establishments, small establishments
show much less employee voice: they are less likely to have a system of Total Quality
Management (TQM), a lower percentage of production workers meet in groups, on
average, and they are less likely to be unionized. These numbers gradually increase as
establishment size grows. In non-manufacturing, the situation is somewhat different.
While many establishments have implemented a TQM system, the smaller establishments
are the ones that are most likely to have a larger share of non-managerial workers
meeting in groups. Although unionization numbers are low across the board in non-
manufacturing, it is not surprising that larger firms are much more likely to be unionized.
Among different measures of the organization of the workplace in Table 12, there
is far less variation in incidence and diffusion by establishment size. For manufacturing
establishments, there is little variation in the percentage of non-managerial workers
involved in rotation, with the number centered around 17%. The number of managerial
levels does increase as the establishment gets bigger, both in manufacturing and non-
manufacturing. Larger establishments are more likely to participate in benchmarking,
while smaller establishments are slightly more likely to allow jobsharing. There is little
relationship between establishment size and the availability of flextime (though non-

26
manufacturing establishments are more likely to have it as a whole) or the percentage of
non-managerial workers in self-managed teams.
Finally, as shown in Table 13, among measures of compensation, the story is the
same for both manufacturing and non-manufacturing establishments. There is little
relationship between establishment size and profit sharing for clerical/sales workers of
production/front line workers. However, larger establishments are more likely to offer
profit sharing for managerial and technical workers.
In addition to differences across types of establishments, there are also differences
over time. If one tries to identify the impact of organizational capital by focusing on
changes within establishments over time (in order to eliminate unobserved establishment
fixed characteristics), it is essential that there be significant variation over time. This
suggests that one should consider not only the questions asked but the frequency with
which establishments are surveyed. Table 14 examines the variation over time in a
number of workplace practices when we consider changes between 1994 and 1997 in the
matched panel of establishments in the EQW-NES. In this time period, there are a
number of similarities across manufacturing and non-manufacturing establishments.
Most establishments did not change their unionization status, with only approximately
15% becoming de-unionized during this time period and 1% unionizing. A significant
number of establishments increased the percentage of production workers meeting in
groups, while more establishments stopped the process of benchmarking than began. The
percentage of non-managerial workers involved in job rotation increased, an equal
percentage of establishments increased the number of managerial levels as decreased, and
there was an unambiguous increase in the diffusion of technology, with more

27
establishments increasing the percentage of managerial and non-managerial workers
using computers than decreasing.
It is important to note that, when considering changes over time, one is
particularly susceptible to issues of measurement error, particularly when focusing on
changes over a relatively short period of time. Surveying establishments too frequently
exacerbates this problem.
Finally, it is also important to consider optimal breakdown of worker categories.
While many datasets currently distinguish between production and non-production
workers (for example, the LRD), recent surveys have begun to explore the advantages of
finer worker categories. In the EQW-NES, workers are divided into supervisors,
managers, technical workers, production workers, and clerical workers. While the
distinctions may be less important for production function estimation, there may be
significant benefits to the finer level of detail when considering the impact of
organizational capital on wages and labor demand.
V. Final Recommendations
This paper has tried to identify three main elements of organizational capital that
have been shown to have a significant impact on productivity, wages and labor demand.
These three elements include training, employee voice and work design. While there
have been an increasing number of researchers who have attempted to measure these and
other dimensions of organizational capital for the purpose of documenting its impact on
the so called “New Economy,” these efforts have been uncoordinated and sporadic.

28
Part of the reason there has been no systematic attempt to measure workplace
practices over time has been a lack of consensus on what to measure, along with concerns
over the costs of measurement.
Our experience with training measures suggests that, while measuring the capital
stock is tough, measuring the stock of training is even tougher. Evidence suggests that it
may be too hard for firms to calculate a stock measure, and our best shot is to try to get at
new investment in training. But we are still left with questions such as: What is the
appropriate margin – any training, type of training, duration of training? How do we
think about depreciation?
The good news is that other measures of organizational practices, such as the
percentage of workers meeting on a regular basis, unionization, and various work design
elements, are much easier to obtain. Respondents have a clear idea of what is being
asked, these types of questions are not time consuming, there is currently substantial
variation in the data, and, importantly, they are associated with outcomes we care about.
Our final question deals with the frequency of measurement: how often should
you measure these elements of organizational capital. Our work suggests that this does
not need to be done on a monthly basis, or even quarterly basis. For training and
compensation information to be used for labor productivity analysis, an annual survey is
probably sufficient. For the other components of organizational capital such as employee
voice and work design, checking in every other year is likely more than enough, as these
practices do not change with high frequency.
To date, the literature has been clear: workplace organization matters. While
these findings have been consistent, the measures of organizational capital, the unit of

29
measurement, and the frequency of measurement have not been. Hopefully, careful
consideration of the issues and problems associated with the measurement of
organizational capital will help unify data collection efforts in the future, leaving us with
more systematic information on firms, including measures not only of physical capital
and human capital but also organizational capital as well.

30
References
Acemoglu, Daron. 2000. “Technological Change, Inequality and the Labor Market.” NBER working paper number 7800, July. Aghion, Phillipe, Caroli, Eve, and Garcia-Peñalosa, Carlos. 1999. "Inequality and Economic Growth: the Perspective of the New Growth Theories", Journal of Economic Literature, 37(3), pp. 1615-1660. Atkeson, Andrew and Patrick J. Kehoe. 2002. “Measuring Organization Capital”,
NBER working paper # 8722, January.
Arthur, Jeffrey. 1994. “Effects of Human Resource Systems on Manufacturing Performance and Turnover.” Academy of Management Journal vol. 37, pp.670- 87. Bailey, Thomas. 1993. “Organizational Innovation in the Apparel Industry.” Industrial Relations, vol. 32, pp. 30-48. Bailey, Thomas, Peter Berg, and Carola Sandy. 2001. “The Effect of High Performance
Work Practices on Employee Earnings in the Steel, Apparel, and Medical Electronics and Imaging Industries”, Industrial and Labor Relations Review, vol. 54(2), pp. 525-545.
Batt, Rose. 2001. “Explaining Wage Inequality in Telecommunications Services:
Customer Segmentation, Human Resource Practices, and Union Decline”, Industrial and Labor Relations Review, vol. 54(2), pp. 425-449.
Barron, J., M. Berger and D. Black. 1997. “How Well Do We Measure Training?”
Journal of Labor Economics, vol. 13(2), pp. 308-33.
Barron, J., M. Berger and D. Black. 1999. “The Use of Matched Employee-Employer Data as a Means of Assessing Data Reliability with Non-Classical Measurement Error.” In J. Haltiwanger, J. Lane, J. Spletzer, J.Theeuwes, and K. Troske (eds.), The Creation and Analysis of Linked Employer-Employee Data. New York: North Holland, P. 419-38.
Bartel, Ann. 1989. "Formal Employee Training Programs and Their Impact on Labor Productivity: Evidence from a Human Resource Survey.” NBER working paper # 3026. Blair, Margaret M. and Steven M.H. Wallman. 2001. Unseen Wealth: Report of the Brookings Task Force on Intangibles. Washington, D.C.: Brookings Institution Press. Black, Sandra and Lynch, Lisa M. 1996. "Human Capital Investments and Productivity",

31
American Economic Review, vol. 86(2) pp. 263-267. Black, Sandra E. and Lynch, Lisa M. 2001. "How to Compete: The Impact of Workplace Practices and Information Technology on Productivity", Review of Economics and Statistics, vol. 83(3), pp. 434-445. Black, Sandra E. and Lisa M. Lynch. 2004. “What’s Driving the New Economy: The Benefits of Workplace Innovation,” The Economic Journal, vol. 114, February, pp. F97-F116. Black, Sandra E., Lynch, Lisa M. and Krivelyova, Anya. 2004. “How Workers Fare When Employers Innovate”, Industrial Relations, vol. (43(1), pp. 44-66. Boning, Brent, Casey Ichniowski, and Kathryn Shaw. 2001. “Opportunity Counts: Teams and the Effectiveness of Production Incentives,” NBER working paper 8306, May. Bresnahan, Timothy F., Erik Brynjolfsson, and Lorin M. Hill. 2002. “Information
Technology, Workplace Organization, and the Demand for Skilled Labor: Firm- Level Evidence,” The Quarterly Journal of Economics, February, pp. 339-376.
Cappelli, Peter and William Carter. 2000. “Computer, Work Organization and Wage
Outcomes”, NBER working paper 7987, October. Cappelli, Peter and David Neumark. 2001. “Do "High-Performance" Work Practices
Improve Establishment-Level Outcomes?”, Industrial and Labor Relations Review, vol. 54(4), pp. 737-775.
Caroli, Eve and John Van Reenen. 2001. “Skill-Biased Organizational Change? Evidence from a Panel of British and French Establishments,” The Quarterly
Journal of Economics, vol. 116, pp 1449-1492. Delany, John and Huselid, Mark. 1996. “The Impact of Human Resource Management Practices on Perceptions of Performance in For-Profit and Nonprofit Organizations,” Academy of Management Journal, pp. 949-969. Dunlop, John and Weil, David. 1996. “Diffusion and Performance of Modular Production in the U.S. Apparel Industry,” Industrial Relations, vol. 35, July, pp.334-354. Hunter, Larry, W.,Annette Bernhardt, Katherine L. Hughes, and Eva Skuratowicz, 2001.
“It's Not Just the ATMs: Technology, Firm Strategies, Jobs, and Earnings in Retail Banking”, Industrial and Labor Relations Review, vol. 54(2), pp. 402-424.
Huselid, Mark A. 1995. "The Impact of Human Resource Management Practices on Turnover, Productivity, and Corporate Financial Performance." Academy of Management Journal, Vol. 38 No.3, pp. 635-672.

32
_________ and Brian E. Becker. 1996. "High Performance Work Systems and Firm Performance: Cross-Sectional Versus Panel Results." Industrial Relations, vol. 35, pp. 400-422. Ichniowski, Casey 1990. "Human Resource Management Systems and the Performance of U.S. Manufacturing Businesses." NBER Working Paper 3449, September. Ichniowski, Casey and Shaw, Kathryn. 2003. “Beyond Incentive Pay: Insiders’ Estimates of the Value of Complementary Human Resource Management Practices.” The Journal of Economic Perspectives, vol. 17(1), pp. 155-178. Ichniowski, Casey, Shaw, Kathryn, and Prennushi, Gabrielle. 1997. "The Effects of Human Resource Management Practices on Productivity.” American Economic Review, vol. 87(3), pp. 291-313. Kandel, E. and Edward Lazear. 1992. “Peer Pressure and Partnerships.” Journal of Political Economy. Vol. 100, pp. 801-817. Kelley, Maryellen. 1994. “Information Technology and Productivity: The Elusive Connection.” Management Science, vol. 40, pp. 1406-25. _____________. 1996. “Participative Bureaucracy and Productivity in the Machined Products Sector.” Industrial Relations, vol. 35, pp. 374-399. Kremer, Michael and Eric Maskin. 1996. “Wage Inequality and Segregation by Skill”,
NBER working paper. 5718, August. Kruse, Douglas and Joseph Blasi. 1998. “The New Employee/Employer Relationship”, mimeo prepared for the Aspen Institute Domestic Strategy group, August, Rutgers University. Lynch, Lisa M. and Black, Sandra E. 1998. Beyond the Incidence of Training : Evidence from A National Employers' Survey", Industrial and Labor Relations Review, vol. 52(1), pp. 64-81. Malcomson, James. 1983. “Trade Unions and Economic Efficiency,” The Economic Journal, vol. 93, pp. 50-65. Milgrom, P. and Roberts, J. 1995. “Complementarities and Fit: Strategy, structure and organizational change in manufacturing.” Journal of Accounting and Economics, vol. 19. Pp. 179-208. Osterman, Paul. 1994. “How Common is Workplace Transformation and Who Adopts It?” Industrial and Labor Relations Review, vol. 47(2), pp. 173-187.

33
Osterman, Paul. 2000. “Work Reorganization in an Era of Restructuring: Trends in Diffusion and Effects on Employee Welfare.” Industrial and Labor Relations Review, vol. 53(2), pp. 179-96.
Table 1: Compound Average Annual Rates of Growth in Output and the Contribution of Factor Inputs and Multifactor Productivity, Manufacturing (percent per year) 1993-1996 BLS Black and Lynch (2004) Output 4.2 4.7 Combined Inputs 2.3 3.2 (includes capital, labor and materials) Multifactor Productivity 1.9 1.6 Contribution of Workplace - 1.4 Practices Remaining Residual - 0.2 Source: Bureau of Labor Statistics, Multifactor Productivity Trends, 1998, released September 21, 2000 and authors’ own calculations from the EQW-NES first and second round cross sections with a 1% trim as presented in Black and Lynch (2004).

34
Table 2: Survey Questions on Training Survey Training Questions Asked Ichniowski 1990 Does your business have a formal employee training and development program? Huselid (1995) and How many hours of training per year are typically received by an experienced employee (someone Huselid and Becker (1996) employed more than one year)? Osterman (1994, 2000) Proportion of core employees who received different types of training (e.g. off-the job or cross training) Gittleman, Horrigan and Variety of training incidence measures including types of training offered (basic, workplace-related Joyce and job skills) along with reason for training (technology, skill specificity, seniority,retention) Black and Lynch (1996, Variety of training questions on incidence of formal and informal training programs; types of training 1998, 2001, 2004) offered including computer skills training, team work training, sales training, new methods training; proportion of workers trained by five occupational categories; the costs of training as a share of total labor costs; does training occur off the job. Caroli & Van Reneen (2001) In the past three years have you trained workers aiming at specialization or trained workers aiming at multiskilling? (French data)

35
Table 3: Survey Questions on Employee Voice
Survey Employee Voice Ichniowski 1990 Do you have any formal information sharing program with these groups of employees? Do you conduct attitude surveys among any of these groups of workers? Is there a formal grievance procedure or formal complaint resolution system? (All questions were asked separately for a business’s union and non-union production workers) Huselid (1995) and What proportion of the workforce are included in a formal information-sharing program (e.g. a Huselid and Becker (1996) newsletter)? What proportion of the workforce is regularly administered attitude surveys? What proportion of the workforce participate in Quality of Work Life (QWL), Quality Circles (QC), and/or labor management participation programs? Osterman (1994, 2000) Proportion of the establishment’s core employees involved in problem solving groups Proportion of the establishment’s core employees involved in teams Proportion of the establishment’s core employees involved in Total Quality Management Gittleman, Horrigan and Are there worker teams in the establishment Joyce Is there TQM? Are there Quality Circles? Is there employee involvement in the establishment’s technology and equipment purchase decisions? Black and Lynch (1996, Is there TQM? 2001, 2004) Proportion of non-managerial workers meeting regularly to discuss workplace issues Proportion of workers in self-managed teams Caroli & Van Reneen (2001)

36
Table 4: Survey Questions on Work Design Survey Work Design Ichniowski 1990 Does your organization use a formal job design program to integrate work content and the qualifications
required of employees to perform work? If yes what type of job design do you use? a. work simplification, b. job rotation, c. job enlargement d. job enrichment, e. other
Huselid (1995) and What proportion of the workforce hold jobs that have been included in a formal job analysis? Huselid and Becker (1996) Osterman (1994, 2000) Proportion of the core employees involved in job rotation Gittleman, Horrigan and Is there job rotation? Joyce Black and Lynch (1996, Variety of measures including benchmarking, reengineering, number of managerial levels, % of workers 2001, 2004) in job rotation, job sharing Caroli & Van Reneen (2001) Have you in the last three years made any substantial changes in work organization or working practices not involving new plant machinery or equipment that directly affected the jobs or working practices of the manual workforce – and then asked for non-manual workers? (for British est.) For any of the organizational methods I will mention, would you tell me whether it is already
implemented, in the process of being so, being considered or not even thought of in your establishment? (Included in this list is delayering, quality circles, and TQM – French data)

37
RESPONSE RATES
Table 5: Response Rates for Standard Production Function Variables 1994 EQW-NES
Total
Sales Capital Materials Percent
Managers Percent
Supervisors Percent
Production/ Frontline Workers
Percent Technical Workers
Percent Clerical/Sales
Workers
Manufacturing (total)
73 64 59 88 88 87 87 87
By Firm Size: 1-49 82 76 67 88 88 88 88 88 50-99 81 73 69 92 92 91 91 91 100-249 78 67 60 93 93 93 93 93 250+ 68 59 55 86 86 85 85 85 Non-Manufacturing (total)
62
54
45
88
88
86
87
86
By Firm Size: 1-49 65 60 50 92 92 91 91 91 50-99 71 63 56 93 93 93 93 93 100-249 59 51 47 89 89 88 88 89 250+ 58 47 36 82 81 79 79 79
38
Table 6: Response Rates for Training 1994 EQW-NES Survey
Existence of
Formal Training
Computer Literacy Training
New Methods Training
Cross-Training
Teamwork Training
% of Training Done During Work Hours
% of Training Done In House
Manufacturing (total) >99
>99
>99
>99
>99
97
97
Non-Manufacturing (total)
100
>99
>99
>99
>99
97
97
Cost of Training
(As a Share of Labor Costs)
# of Managerial Workers Trained
# of Technical Workers Trained
# of Production/ Front Line Workers
Trained
# of Clerical/ Sales Workers
Trained Manufacturing (total)
67
74
70
71
71 By Firm Size: 1-49 84 57 55 57 57 50-99 82 75 74 75 76 100-249 64 76 72 74 74 250+ 61 76 71 73 73 Non-Manufacturing (total)
61
73
68
71
71
By Firm Size: 1-49 70 75 73 74 75 50-99 74 73 73 74 77 100-249 57 75 74 74 76 250+ 51 69 61 65 65

39
Table 7: Response Rates for Employee Voice 1994 EQW-NES
TQM Percentage of Production Workers Meeting in Groups
Unionized
Manufacturing (total) 93 90 93 By Firm Size: 1-49 90 89 90 50-99 95 94 94 100-249 93 92 94 250+ 93 89 93 Non-Manufacturing (total)
92
87
92
By Firm Size: 1-49 92 91 93 50-99 93 92 92 100-249 93 90 92 250+ 91 81 90

40
Table 8: Response Rates for Workplace Organization Measures
1994 EQW-NES
% Non-Managerial
Workers Involved in Job
Rotation
# of Managerial
Levels
% Non-Managerial Workers in
Self-Managed Teams
Participate in Benchmarking
Flextime Allow Job-Sharing
Manufacturing (total) 90
92
91
92
93
93
By Firm Size: 1-49 87 91 88 90 91 91 50-99 93 92 94 95 95 95 100-249 93 92 93 94 94 93 250+ 90 92 91 92 93 93 Non-Manufacturing (total)
88
90
88
90
92
92
By Firm Size: 1-49 93 92 91 92 94 93 50-99 92 90 92 92 92 93 100-249 90 89 90 91 92 92 250+ 84 88 84 89 91 90

41
Table 9: Response Rates for Compensation Measures
1994 EQW-NES
Profit Sharing for Managerial
Workers
Profit Sharing for Supervisors
Profit Sharing
for Technical Workers
Profit Sharing for
Clerical/Sales Workers
Profit Sharing for Production/ Front Line Workers
Wages: Managerial
Workers
Wages: Supervisors
Wages: Technical Workers
Wages: Clerical/
Sales Workers
Wages: Production/ Front Line Workers
Manufacturing (total)
91
91
86
91
91
64
66
59
70
75
By Firm Size: 1-49 88 88 71 87 88 72 69 39 72 76 50-99 94 94 82 94 93 72 76 60 79 81 100-249 92 93 85 93 92 69 72 61 75 79 250+ 91 91 89 91 90 60 62 61 67 73 Non-Manufacturing (total)
90
88
77
88
87
66
60
42
66
61
By Firm Size: 1-49 90 87 76 89 88 71 87 76 89 62 50-99 90 89 69 87 87 76 67 40 72 69 100-249 90 89 75 89 89 67 64 43 70 68 250+ 89 88 83 88 85 56 54 47 62 53
42
SUMMARY STATISTICS
Table 10: Summary Statistics for Training Measures 1994 EQW-NES Survey
Weighted Means
Existence of Formal Training
Computer Literacy Training
New Methods Training
Cross-Training
Teamwork Training
Cost of Training
(As a Share of Labor Costs)
% of Training
Done During Work Hours
% of Training Done In House
Manufacturing (total) 76 62 71 69 52 .04 53 42 By Firm Size: 1-49 62 48 60 62 39 .035 43 35 50-99 79 63 67 64 53 .037 58 42 100-249 86 72 84 78 56 .047 59 46 250+ 92 85 90 84 77 .052 64 51 Non-Manufacturing (total)
82
49
77
68
55
.05
58
51
By Firm Size: 1-49 77 43 73 61 52 .037 52 44 50-99 82 48 75 76 52 .077 63 57 100-249 92 62 89 76 66 .068 73 60 250+ 92 71 95 81 76 .07 62 64

43
Table 11: Summary Statistics for Employee Voice Measures
1994 EQW-NES Weighted Means
TQM Percentage of Production
Workers Meeting in Groups Unionized
Manufacturing (total) 42 40 21 By Firm Size: 1-49 28 38 12 50-99 41 42 20 100-249 52 37 31 250+ 66 50 35 Non-Manufacturing (total)
36
56
11
By Firm Size: 1-49 33 62 8 50-99 36 55 8 100-249 38 44 18 250+ 52 41 24

44
Table 12: Summary Statistics for Workplace Organization Measures
1994 EQW-NES Weighted Means
% Non-Managerial
Workers Involved in Job
Rotation
# of Managerial
Levels
% Non-Managerial Workers in
Self-Managed Teams
Participate in Benchmarking
Flextime Allow Job-Sharing
Manufacturing (total) 17
2.0
12
24
25
23
By Firm Size: 1-49 20 1.6 12 14 29 30 50-99 14 2.0 12 19 20 20 100-249 16 2.3 11 35 22 18 250+ 18 2.7 15 43 28 18 Non-Manufacturing (total)
18
2.1
13
24
42
36
By Firm Size: 1-49 21 1.6 14 20 39 41 50-99 15 2.5 11 27 47 32 100-249 16 2.7 13 23 38 27 250+ 8 3.6 9 49 49 32

45
Table 13: Summary Statistics for Compensation Measures
1994 EQW-NES Weighted Means
Profit Sharing for Managerial Workers
Profit Sharing for Technical Workers
Profit Sharing for Clerical/ Sales Workers
Profit Sharing for Production/ Front Line
Workers Manufacturing (total)
66
49
55
49 By Firm Size: 1-49 61 44 51 52 50-99 65 53 56 51 100-249 71 48 55 39 250+ 75 58 52 52 Non-Manufacturing (total)
72
42
46
46
By Firm Size: 1-49 72 43 47 48 50-99 69 36 41 39 100-249 73 41 49 53 250+ 77 53 51 41

46
Table 14: Changes in Organizational Capital 1994 to 1997
Unweighted EQW-NES Data Unionized % of
Production Workers
Meeting in Groups
Participate in Benchmarking
% of Non-Managerial
Workers Involved in
Job Rotation
# of Managerial
Levels
% of Non-Managerial Workers in
Self-Managed
Teams
% of Non-Managerial
Workers Using
Computers
% of Managerial
Workers Using
Computers
Manufacturing
% Increased
1 37 10 33 35 26 39 40
% Stayed the Same
81 36 60 43 35 58 34 41
% Decreased
18 27 30 25 30 16 27 19
Non-Manufacturing
% Increased
1 41 7 26 39 19 49 36
% Stayed the Same
85 37 65 59 26 62 30 46
% Decreased
15 22 29 15 35 19 21 18