measuring outcomes for public service in the public...
TRANSCRIPT

Measuring Outcomes for Public ServiceUsers (MOPSU) in the public, privateand voluntary sectors
Joy Dobbs & Jenny Clark, NCVOSRA conference, 7 Dec 2010

Outline
Background and context
Challenges and approaches to measuringoutcomes/impact/value
MOPSU principles
MOPSU findings
What does this tell us?2

Background and context
Increasing focus on outcomes of public services• reliable information about public service performanceessential
• driver is better outcomes for service users & citizens• value for money even more important in era of austerity
Change in relationship between state & voluntarysector• public service delivery integral• increased volume of funding to the sector• Perceived barriers for voluntary sector
3

Growth in voluntary sector income andexpenditure, 2000/01 – 2007/08
Source NCVO Almanac 2010

Growth in government spending and statutoryincome to voluntary sector, 2000/01 – 2007/08( 2000/01 = 100)
90
100
110
120
130
140
150
160
2000/01 2001/02 2002/03 2003/04 2004/05 2005/06 2006/07 2007/08
Per
cent
age
chan
ge re
lativ
e to
200
1 le
vels
Total government spending
Statutory income to thevoluntary sector
Source NCVO Almanac 2010

Sub‐sectors receiving the most governmentincome
3
7
15
16
24
25
40
43
45
50
50
51
51
70
97
93
85
84
76
75
60
57
55
50
50
49
49
30
0% 20% 40% 60% 80% 100%
Grant‐making foundations
Research
Religion
Environment
International
Culture and recreation
Development
Health
Umbrella bodies
Housing
Social services
Law and advocacy
Education
Employment and training
Government sources
Other sources
Source NCVO Almanac 2010
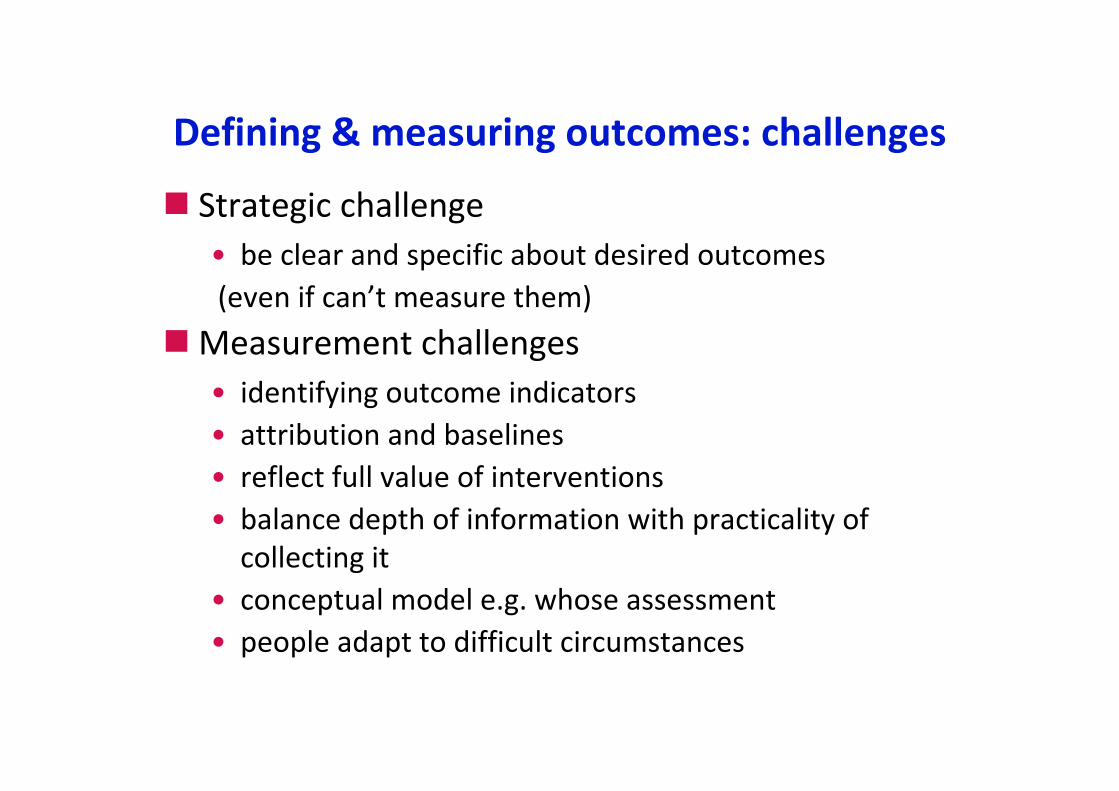
Defining & measuring outcomes: challenges
Strategic challenge• be clear and specific about desired outcomes (even if can’t measure them)
Measurement challenges• identifying outcome indicators• attribution and baselines• reflect full value of interventions• balance depth of information with practicality ofcollecting it
• conceptual model e.g. whose assessment• people adapt to difficult circumstances

Progress towards measurement of publicservice outcomesmore talked about than practisedmuch variation ‐ uneven pace of culture change,still different views within sectorSome good examples• National Outcomes Programme (CES)• Social Return on Investment (nef)• Outcomes Star (Triangle Consulting)• MOPSU Adult Social Care Outcomes Tool(ASCOT)
• Camden outcome‐based commissioning model• NPC well‐being tool for children

Measuring Outcomes for Public ServiceUsers project (MOPSU)
adult social care
• care homes
• daycare
early years education
volume & characteristics of services by vol. sector
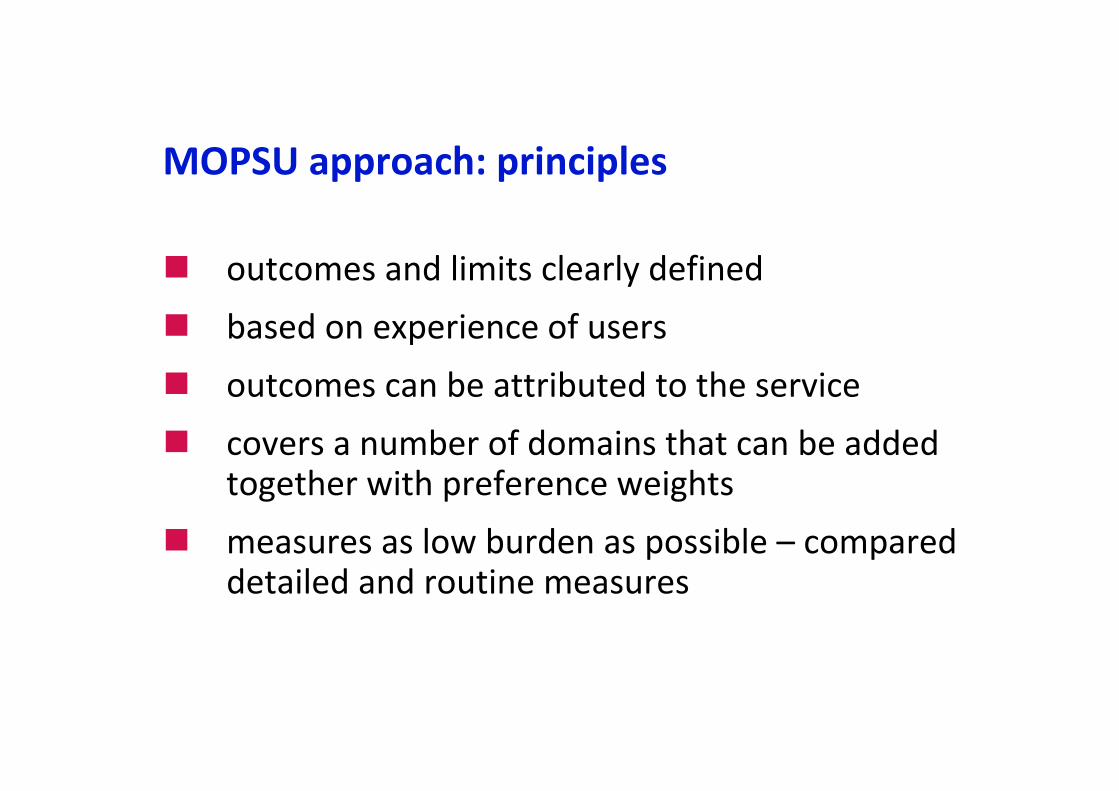
MOPSU approach: principles
outcomes and limits clearly defined
based on experience of users
outcomes can be attributed to the service
covers a number of domains that can be addedtogether with preference weights
measures as low burden as possible – compareddetailed and routine measures

MOPSU approach: adult social care
gain in social care related quality of life
7 domains e.g. personal care; control over daily living
outcome gain on each domain [‘capacity for benefit’]
n how are with current service, what it deliversn how would be without that service (hypothetical)n difference between ‘without service’ and ‘best possible’
service – the capacity for benefit, what the service could deliver
Outcome gain = A x C
add across domains (using preference‐based weighting)
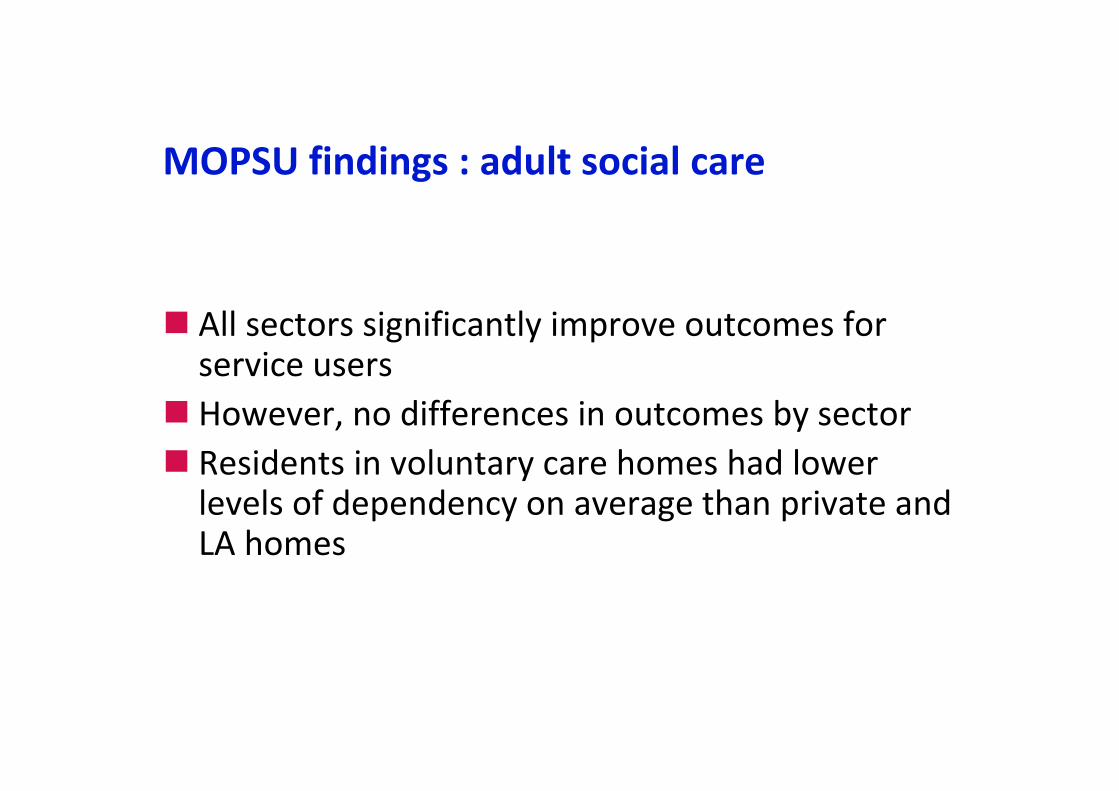
MOPSU findings : adult social care
All sectors significantly improve outcomes forservice usersHowever, no differences in outcomes by sectorResidents in voluntary care homes had lowerlevels of dependency on average than private andLA homes
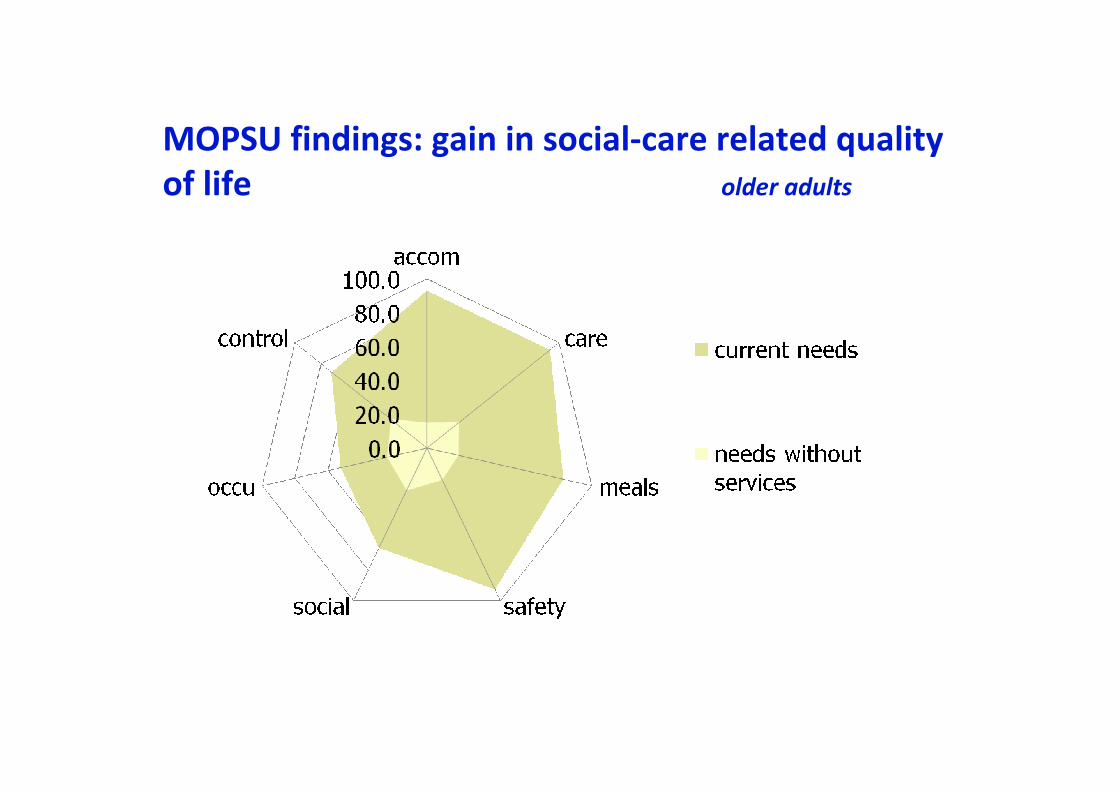
MOPSU findings: gain in social‐care related qualityof life older adults

MOPSU findings : variation by sectorin average outcome gain in social care related quality of life
0.22
0.26
0.30
0.83
0.82
0.86
0 0.2 0.4 0.6 0.8 1
Public
Private
Voluntary
Current SCRQOL
Expected SCRQOL

MOPSU findings : early years education
Outcomes are better for children who start earlyyears education before the age of 3No systematic difference overall betweenproviders by sector
Limited data on costs indicate that cost per childis comparable between sectors

MOPSU outcomes: early years

What does this tell us?
Voluntary sector & public services
• The voluntary sector does not achievebetter direct outcomes than those achievedby other sectors
• measures don’t capture full value
• does the similarity in outcomes betweensectors reflect more on the sectors, or oncommissioning?

What does this tell us?
Measuring outcomes• Need robust methods and datacollection
• can the MOPSU principles and approach be taken forward and applied to othersub‐sectors?
• can they help us to get more robust,consistent & comparable outcomemeasures?

Further information/contact
Websiteswww.ncvo‐vol.org.uk/mopsu
www.ncvo‐vol.org.uk/advice‐support/public‐service‐delivery/measuring‐impact
www.ons.gov.uk/about‐statistics/methodology‐and‐quality/measuring‐outcomes‐for‐public‐service‐users/mopsu‐reports‐and‐updates/Email:
joy.dobbs@ncvo‐vol.org.ukJenny.clark@ncvo‐vol.org.uk
19

Sources of statutory funding
Source NCVO Almanac 2010
