measuring performance, estimating most productive scale
TRANSCRIPT

HAL Id: hal-02274529https://hal.archives-ouvertes.fr/hal-02274529
Submitted on 30 Aug 2019
HAL is a multi-disciplinary open accessarchive for the deposit and dissemination of sci-entific research documents, whether they are pub-lished or not. The documents may come fromteaching and research institutions in France orabroad, or from public or private research centers.
L’archive ouverte pluridisciplinaire HAL, estdestinée au dépôt et à la diffusion de documentsscientifiques de niveau recherche, publiés ou non,émanant des établissements d’enseignement et derecherche français ou étrangers, des laboratoirespublics ou privés.
Measuring Performance, Estimating Most ProductiveScale Size, and Benchmarking of Hospitals Using DEA
Approach: A Case Study in IranPejman Peykani, Emran Mohammadi, Fatemeh Sadat Seyed Esmaeili
To cite this version:Pejman Peykani, Emran Mohammadi, Fatemeh Sadat Seyed Esmaeili. Measuring Performance, Es-timating Most Productive Scale Size, and Benchmarking of Hospitals Using DEA Approach: A CaseStudy in Iran. International Journal of Hospital Research, Iran University of Medical Sciences, 2018.�hal-02274529�

Measuring Performance, Estimating Most Productive Scale Size, and
Benchmarking of Hospitals Using DEA Approach: A Case Study in Iran
Pejman Peykani1, Emran Mohammadi1,*, Fatemeh Sadat Seyed Esmaeili2
1 School of Industrial Engineering, Iran University of Science and Technology, Tehran, Iran
2 Faculty of Mathematics, Science and Research Branch, Islamic Azad University, Tehran, Iran
Abstract
Background and Objectives: The goal of current study is to evaluate the performance of hospitals
and their departments. This manuscript aimed at estimation of the most productive scale size
(MPSS), returns to scale (RTS), and benchmarking for inefficient hospitals and their departments.
Methods: The radial and non-radial data envelopment analysis (DEA) approaches under variable
returns to scale (VRS) assumption are applied for performance assessment of hospitals. Also, the
MPSS model in DEA is employed to identify hospital with optimal scale size. Furthermore, the
benchmarking for inefficient decision making units (DMUs) is introduced using the slack based
measure (SBM) model.
Results: In this manuscript, the DEA approaches are implemented at macro and micro levels in
health care. At macro level, the performance of 15 Iranian hospitals is assessed and at micro level,
the performance of 15 departments of one hospital is evaluated. It should be noted that the number
of staff, the number of beds, location & infrastructures, and equipment & facilities were considered
as the input variables and number of patients and number of surgeries were selected as output
variables. According to the results, six hospitals at macro level and seven hospital departments at
micro level were efficient. As a result, these hospitals and departments can be considered as a
benchmark for other DMUs. Notably, only four hospitals at macro level and four hospital
departments at micro level have the most productive scale size.
Conclusions: The current study presents a functional pattern to managers at macro and micro
levels in health care systems to better planning for capacity development and resource saving.
Keywords: Hospital Performance Evaluation, Data Envelopment Analysis (DEA), Health Care,
Most Productive Scale Size (MPSS), Returns to Scale (RTS).

1. Introduction
Hospital is one of the most important parts in the health care network and the major share of
health care from gross domestic product (GDP) is spent in hospitals. In other words, hospitals as
one of the most important and largest providers of health care services, play a crucial role in health
economics. Therefore, measuring the performance and productivity of hospitals is mandatory.
Data envelopment analysis (DEA) is one of the applicable tools that can be applied to evaluate
the performance of hospitals.1-3 DEA is one of the most effective and powerful methods widely
used in many real-world applications.4-9 The initial idea of DEA approach was raised by Farrell10
and then developed by Charnes et al.11 and Banker et al.12 under constant returns to scale (CRS)
and variable returns to scale (VRS) assumptions, respectively.13 It should be noted that so far, DEA
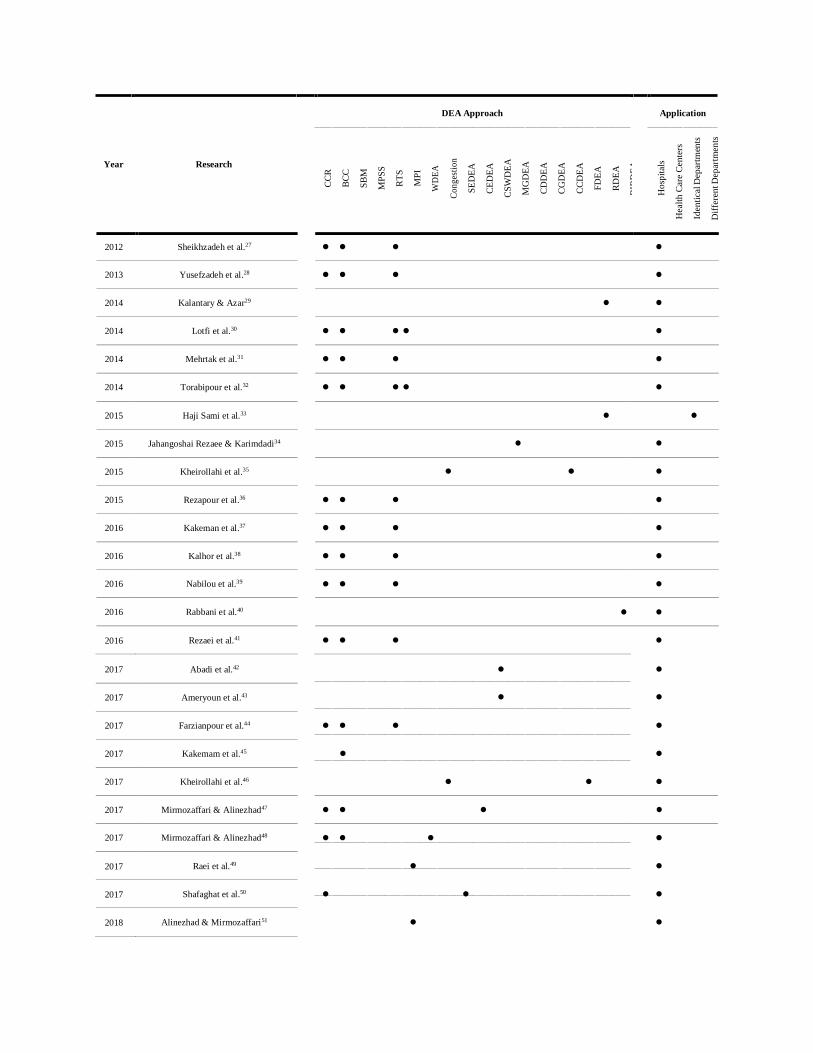
has been applied in many studies to assess the performance of Iranian hospitals.14-16 Table 1
summarizes the studies that applied DEA approach for performance assessment of hospitals and
health care centers in Iran:
Table 1: The Application of DEA in Iranian Hospitals and Health Care Centers: A Literature Review
DEA Approach Application
Year Research
⚫
⚫
⚫
⚫
⚫
⚫
⚫
⚫
⚫
⚫
CC
R
BC
C
SB
M
MP
SS
RT
S
MP
I
WD
EA
Co
ng
esti
on
SE
DE
A
CE
DE
A
CS
WD
EA
MG
DE
A
CD
DE
A
CG
DE
A
CC
DE
A
FD
EA
RD
EA
BIR
DE
A
Ho
spit
als
Hea
lth
Car
e C
ente
rs
Iden
tica
l D
epar
tmen
ts
Dif
fere
nt D
epar
tmen
ts
2007 Hajialiafzali et al.17
⚫ ⚫
2008 Hatam18
⚫
2010 Hatam et al.19
⚫ ⚫ ⚫ ⚫
2010 Jandaghi et al.20
⚫ ⚫
2011 Ketabi21
⚫ ⚫
2011 Shahhoseini et al.22
⚫ ⚫
2012 Ebrahimnejad23
⚫
2012 Ghotbuee et al.24
⚫
2012 Khani et al.25
⚫
2012 Marnani et al.26
⚫
DEA Approach Application
Year Research
2012 Sheikhzadeh et al.27
⚫ ⚫ ⚫ ⚫
2013 Yusefzadeh et al.28
⚫ ⚫ ⚫
⚫
2014 Kalantary & Azar29
⚫
⚫
2014 Lotfi et al.30
⚫ ⚫ ⚫ ⚫
⚫
2014 Mehrtak et al.31
⚫ ⚫ ⚫
⚫
2014 Torabipour et al.32
⚫ ⚫ ⚫ ⚫
⚫
2015 Haji Sami et al.33
⚫
⚫
2015 Jahangoshai Rezaee & Karimdadi34
⚫
⚫
2015 Kheirollahi et al.35
⚫ ⚫
⚫
2015 Rezapour et al.36
⚫ ⚫ ⚫
⚫
2016 Kakeman et al.37
⚫ ⚫ ⚫
⚫
2016 Kalhor et al.38
⚫ ⚫ ⚫
⚫
2016 Nabilou et al.39
⚫ ⚫ ⚫
⚫
2016 Rabbani et al.40
⚫
⚫
2016 Rezaei et al.41
⚫ ⚫ ⚫
⚫
CC
R
BC
C
SB
M
MP
SS
RT
S
MP
I
WD
EA
Co
ng
esti
on
SE
DE
A
CE
DE
A
CS
WD
EA
MG
DE
A
CD
DE
A
CG
DE
A
CC
DE
A
FD
EA
RD
EA
BIR
DE
A
Ho
spit
als
Hea
lth
Car
e C
ente
rs
Iden
tica
l D
epar
tmen
ts
Dif
fere
nt D
epar
tmen
ts
2017 Abadi et al.42
⚫ ⚫
2017 Ameryoun et al.43
⚫ ⚫
2017 Farzianpour et al.44
⚫ ⚫ ⚫ ⚫
2017 Kakemam et al.45
⚫ ⚫
2017 Kheirollahi et al.46
⚫ ⚫ ⚫
2017 Mirmozaffari & Alinezhad47
⚫ ⚫ ⚫
⚫
2017 Mirmozaffari & Alinezhad48
⚫ ⚫ ⚫ ⚫
2017 Raei et al.49
⚫ ⚫
2017 Shafaghat et al.50
⚫ ⚫ ⚫
2018 Alinezhad & Mirmozaffari51
⚫ ⚫

DEA Approach Application
Year Research
2018 Bahrami et al.52 ⚫ ⚫ ⚫ ⚫
2018 Hadipour et al.53
⚫
⚫
⚫
2018 Jahangoshai Rezaee et al.54
⚫
⚫
2018 Ketabi et al.55
⚫
⚫
⚫
2018 Kiani et al.56
⚫ ⚫ ⚫
⚫
2018 Omrani et al.57
⚫
⚫
2018 Pirani et al.58
⚫ ⚫ ⚫
⚫
2019 Hatefi & Haeri59
⚫
⚫
2019 Jahangoshai Rezaee et al.60
⚫
⚫
2019
Our Work
⚫ ⚫ ⚫ ⚫
⚫ ⚫
As it can be seen in Table 1, in the current research, the radial and non-radial DEA methods
as well as the most productive scale size (MPSS) model are applied in Iranian health care system
for performance assessment of hospital and their departments. Moreover, the input and output-
oriented slack based measure (SBM) models are employed for identifying input-excess, output-
shortfall, and reference-set for inefficient decision making units (DMUs). In other words, the main
purpose of this research is to explore causes of inefficiency of hospital and their departments by
applying different DEA models. In fact, this study is an applied research in Iran's health care
systems that can be used to provide more services or to improve the quality of hospital services by
managing the available resources.
The rest of this paper is organized as follows: The background of radial and non-radial DEA
models under both input and output orientations are explained in Section 2. The approach for
estimation of MPSS is proposed in Section 3. Then, the proposed DEA approaches of the current
study are implemented for a real case study of Iranian hospitals and the results are evaluated in
Section 4. Finally, managerial insights and conclusions of study as well as some directions for
future research are given in Section 5.
CC
R
BC
C
SB
M
MP
SS
RT
S
MP
I
WD
EA
Co
ng
esti
on
SE
DE
A
CE
DE
A
CS
WD
EA
MG
DE
A
CD
DE
A
CG
DE
A
CC
DE
A
FD
EA
RD
EA
BIR
DE
A
Ho
spit
als
Hea
lth
Car
e C
ente
rs
Iden
tica
l D
epar
tmen
ts
Dif
fere
nt D
epar
tmen
ts

2. Data Envelopment Analysis (DEA)
In this section, the background of DEA models based on radial and non-radial approaches are
introduced. Assume that there are n homogenous DMUs that each D M U j ( j = 1, ..., n ) uses m inputs
xij (i = 1,..., m ) to produce s outputs yrj ( r = 1,..., s ) and k is the index of DMU under evaluation.
2.1. Radial Approach
In radial approach, DEA calculates the maximum proportional reduction in all inputs under
input orientation (increment in all outputs under output orientation) to increase the efficiency of
DMU under evaluation. It should be noted that the BCC model is a popular radial DEA model
under variable returns to scale.12 The input and output-oriented BCC models are presented as
Models (1) and (2), respectively:
j =1,...,n
j=1
j 0,
j=1
j =1
(1)
j =1,...,n
j=1
j 0,
j =1
j =1
(2)

Note that in output-oriented BCC model presented in Model (2), the efficiency of DMU under
investigation is calculated by 1* .
2.2. Non-Radial Approach
In non-radial approach in contrast with radial approach, DEA model reduces inputs under
input orientation (increases outputs under output orientation) non-proportionally. In other words,
non-radial DEA model consider the input excesses and the output shortfalls using slack variables.61
The input and output-oriented SBM models are introduced as Models (3) and (4), respectively:
i =1,...,m
j =1,...,n
j=1
si 0,
j=1
j =1
(3) m i=1 xik
si
r =1,...,s
j =1,...,n
j=1
tr 0,
j=1
j =1
(4) s r=1 yrk
tr

It should be noted that the s and the t , respectively, represent the amount of ith input surplus i r
and rth output shortages. Also, the efficiency of DMU under evaluation based on output-oriented
SBM model that presented in Model (4), is calculated by 1 * .
3. Estimating Most Productive Scale Size (MPSS)
The type of returns to scale for each DMUs under VRS production possibility set (PPS) is a
very important issue.62 Because, the type of RTS presents the direction of rescaling needed for
improving the efficiency.
If the RTS of DMU is an increasing returns to scale (IRS), the expansion of the DMU under
investigation will be suggested. And if the RTS of DMU is a decreasing returns to scale (DRS),
contraction of DMU will be suggested. Finally, if the RTS of DMU is CRS, it is believed that the
DMU under investigation operates as the most productive scale size (MPSS). The concept of
MPSS has been introduced by Banker63 for the first time. Cooper et al.64 presented Model (5) for
estimating MPSS:
It should be stated that the DMU under evaluation is the MPSS, if and only if in the fractional
objective function * = 1 .65
, 0
j 0, j = 1, ..., n
j=1
j =1
j =1
(5)
Max =
4. Real Case Studies and Numerical Results
In this section, the implementation of DEA approach using real-world data at macro level
(hospitals) and micro level (departments of hospital) from Iranian health care system are presented.
Based on literature review66, and expert opinions, inputs and outputs of DEA approach are
selected. The input variables include the number of staff (doctors, nurses, and ancillary
personnels), the number of beds, location & infrastructures, and equipment & facilities. Also, the
output variables include number of patients and number of surgeries.
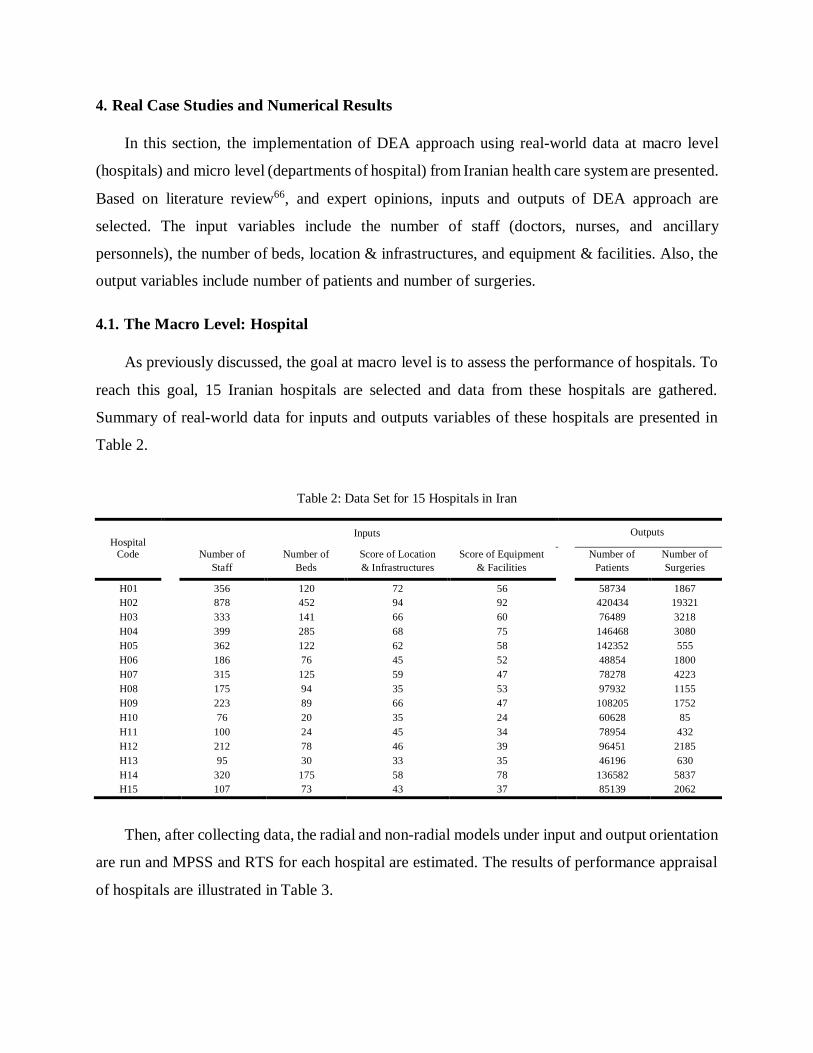
4.1. The Macro Level: Hospital
As previously discussed, the goal at macro level is to assess the performance of hospitals. To
reach this goal, 15 Iranian hospitals are selected and data from these hospitals are gathered.
Summary of real-world data for inputs and outputs variables of these hospitals are presented in
Table 2.
Table 2: Data Set for 15 Hospitals in Iran
Hospital
Inputs Outputs
Code Number of Number of Score of Location Score of Equipment Number of Number of
Staff Beds & Infrastructures & Facilities Patients Surgeries
H01 356 120 72 56 58734 1867
H02 878 452 94 92 420434 19321
H03 333 141 66 60 76489 3218
H04 399 285 68 75 146468 3080
H05 362 122 62 58 142352 555
H06 186 76 45 52 48854 1800
H07 315 125 59 47 78278 4223
H08 175 94 35 53 97932 1155
H09 223 89 66 47 108205 1752
H10 76 20 35 24 60628 85
H11 100 24 45 34 78954 432
H12 212 78 46 39 96451 2185
H13 95 30 33 35 46196 630
H14 320 175 58 78 136582 5837
H15 107 73 43 37 85139 2062
Then, after collecting data, the radial and non-radial models under input and output orientation
are run and MPSS and RTS for each hospital are estimated. The results of performance appraisal
of hospitals are illustrated in Table 3.

Table 3: The Results of Hospitals Evaluation
Hospital MPSS RTS Radial Non-Radial
As seen in Table 3, 4 hospitals including H02, H10, H11, and H15 are the MPSS. In addition
to these hospitals, H08 and H13 are also efficient. Finally, by applying input and output-oriented
SBM models, input-excess, output-shortfall, and reference-set for 9 inefficient hospitals are
proposed in Table 4:
Table 4: The Benchmarking for Hospitals
Hospital
Input-Oriented Output-Oriented
Input-Excess Reference-Set Output-Shortfall Reference-Set
Code
s1 s2 s3 s4 t1 t2
H01 205.70 59.98 31.53 25.70 H02, H10 96813.64 2801.79 H02, H11
H02 0.00 0.00 0.00 0.00 H02 0.00 0.00 H02
H03 126.38 50.64 21.39 24.92 H02, H10 95813.50 2377.58 H02, H11
H04 131.66 161.94 18.92 34.78 H02, H10 65656.91 5518.48 H02, H15
H05 103.84 3.88 13.60 18.55 H02, H10 14791.35 4202.05 H02, H11
H06 83.11 10.02 3.06 16.72 H10, H15 62145.78 820.57 H02, H10, H11
H07 66.48 12.07 11.31 8.37 H02, H10 80159.69 654.07 H02, H10, H11
H08 0.00 0.00 0.00 0.00 H08 0.00 0.00 H08
H09 56.36 28.34 16.80 8.03 H02, H11 22609.28 1548.66 H02, H11
H10 0.00 0.00 0.00 0.00 H10 0.00 0.00 H10
H11 0.00 0.00 0.00 0.00 H11 0.00 0.00 H11
H12 48.45 10.84 4.56 7.58 H02, H10 17367.40 537.61 H02, H10, H11
H13 0.00 0.00 0.00 0.00 H13 0.00 0.00 H13
H14 44.36 19.10 3.84 28.97 H02, H15 41000.70 905.60 H02, H11, H15
H15 0.00 0.00 0.00 0.00 H15 0.00 0.00 H15
Code * Yes No DRS CRS IRS
*
1
*
* 1
*
H01 2.54 ⚫ ⚫ 0.56 0.40 0.51 0.39
H02 1.00 ⚫ ⚫ 1.00 1.00 1.00 1.00
H03 1.84 ⚫ ⚫ 0.65 0.57 0.63 0.50
H04 1.49 ⚫ ⚫ 0.68 0.69 0.59 0.47
H05 1.16 ⚫ ⚫ 0.86 0.91 0.79 0.21
H06 1.73 ⚫ ⚫ 0.82 0.67 0.76 0.54
H07 1.27 ⚫ ⚫ 0.89 0.87 0.83 0.63
H08 1.03 ⚫ ⚫ 1.00 1.00 1.00 1.00
H09 1.32 ⚫ ⚫ 0.78 0.83 0.75 0.65
H10 1.00 ⚫ ⚫ 1.00 1.00 1.00 1.00
H11 1.00 ⚫ ⚫ 1.00 1.00 1.00 1.00
H12 1.19 ⚫ ⚫ 0.88 0.85 0.83 0.82
H13 1.41 ⚫ ⚫ 1.00 1.00 1.00 1.00
H14 1.19 ⚫ ⚫ 0.91 0.86 0.83 0.81
H15 1.00 ⚫ ⚫ 1.00 1.00 1.00 1.00

It is worth mentioning that the type of input and output variables is integer and the values that
presented in Table 4, should be approximated to the nearest integer value.
4.2. The Micro Level: Hospital Departments
In this subsection, the performance of hospital departments as a micro level is evaluated. For
this purpose, 15 departments of hospitals including intensive care unit (ICU), intensive care unit-
open heart (ICU-OH), neonatal intensive care unit (NICU), coronary care unit (CCU), post
coronary care unit (Post CCU), very important person (VIP), kidney transplant, head and neck
surgery, neurology and physical medicine, internal, orthopedics and urology, general surgery,
heart, pregnancy and maternity, and pediatric, are considered.
Then, data from these departments were gathered and the summary of real-world data are
introduced in Table 5:
Table 5: Data Set for 15 Departments of a Hospital in Iran
Department
Code
Number of
Staff
Number of
Beds
Inputs
Score of Location
& Infrastructures
Score of Equipment
& Facilities
Output
Number of
Patients
s
Number of
Surgeries
D01 31 26 82 63 2128 207
D02 21 11 67 48 656 138
D03 19 18 58 52 1024 12
D04 22 26 67 69 2714 472
D05 11 12 48 58 771 161
D06 14 29 63 39 1208 725
D07 15 27 64 48 725 518
D08 25 50 88 93 4313 3255
D09 30 38 70 59 1955 46
D10 25 34 64 73 1771 92
D11 54 78 88 96 5486 2921
D12 30 62 84 47 4669 1967
D13 37 60 93 94 4439 1794
D14 15 16 34 29 2887 92
D15 18 18 39 59 1116 115
Now, by employing the DEA models that were proposed in Models (1) to (4), the efficiency
score for each department are calculated. Additionally, type of RTS for each department as well
as MPSS are estimated. The results of performance assessment of hospitals are shown in Table 6:

Table 6: The Results of Evaluating the Hospital Departments
Department MPSS RTS Radial Non-Radial
According to Table 6, 4 departments including D08, D10, D11, and D14 are the MPSS. In
addition to these departments, D02, D05, and D06 are also efficient. Like the previous subsection,
using input and output-oriented SBM models, input-excess, output-shortfall, and reference-set for
8 inefficient departments are measured. The results of benchmarking for inefficient departments
are shown in Table 7:
Table 7: The Benchmarking for a Hospital Departments
Code * Yes No DRS CRS IRS
*
1
*
* 1
*
D01 2.01 ⚫ ⚫ 0.59 0.65 0.52 0.27
D02 2.38 ⚫ ⚫ 1.00 1.00 1.00 1.00
D03 3.17 ⚫ ⚫ 0.78 0.34 0.71 0.04
D04 1.42 ⚫ ⚫ 0.74 0.82 0.66 0.57
D05 2.22 ⚫ ⚫ 1.00 1.00 1.00 1.00
D06 1.93 ⚫ ⚫ 1.00 1.00 1.00 1.00
D07 3.23 ⚫ ⚫ 0.89 0.60 0.85 0.46
D08 1.00 ⚫ ⚫ 1.00 1.00 1.00 1.00
D09 2.95 ⚫ ⚫ 0.50 0.51 0.47 0.05
D10 2.71 ⚫ ⚫ 0.57 0.49 0.50 0.09
D11 1.00 ⚫ ⚫ 1.00 1.00 1.00 1.00
D12 1.00 ⚫ ⚫ 1.00 1.00 1.00 1.00
D13 1.32 ⚫ ⚫ 0.88 0.93 0.76 0.71
D14 1.00 ⚫ ⚫ 1.00 1.00 1.00 1.00
D15 2.63 ⚫ ⚫ 0.89 0.39 0.78 0.38
Input-Oriented Output-Oriented
Department Code Input-Excess Reference-Set Output-Shortfall
Reference-Set
s1 s2 s3 s4 t1 t2
D01 15.64 8.76 46.04 31.67 D08, D14 98.71 1088.33 D02, D08, D14
D02 0.00 0.00 0.00 0.00 D02 0.00 0.00 D02
D03 4.00 2.00 24.00 23.00 D14 717.35 565.97 D02, D05, D08
D04 5.80 5.92 26.51 32.31 D08, D14 0.00 700.10 D02, D08, D14
D05 0.00 0.00 0.00 0.00 D05 0.00 0.00 D05
D06 0.00 0.00 0.00 0.00 D06 0.00 0.00 D06
D07 0.00 7.93 18.63 1.57 D05, D08, D14 1624.15 38.28 D05, D08, D14
D08 0.00 0.00 0.00 0.00 D08 0.00 0.00 D08
D09 15.00 22.00 36.00 30.00 D14 1830.20 1692.61 D08, D12, D14
D10 10.00 18.00 30.00 44.00 D14 1735.80 1705.13 D05, D08, D14
D11 0.00 0.00 0.00 0.00 D11 0.00 0.00 D11
D12 0.00 0.00 0.00 0.00 D12 0.00 0.00 D12
D13 9.02 4.05 14.87 47.26 D08, D12, D14 292.71 1339.98 D08, D11, D12
D14 0.00 0.00 0.00 0.00 D14 0.00 0.00 D14
D15 2.93 1.75 4.61 29.53 D08, D14 1680.33 202.58 D05, D08, D14

As seen in Table 7, the results introduce a functional pattern for managers in health care
systems to better planning for capacity development and resource saving. Since in most cases, it is
easier for hospital managers to reduce inputs such as the number of staff than to increase outputs
such as the number of patients. Consequently, the input-oriented model is recommended.
5. Managerial Insights, Conclusions, and Future Research Directions
Performance appraisal of hospitals is one of the major concerns of managers. The reason for
this is the identification of hospitals with a desirable performance as a benchmark for inefficient
hospitals. Undoubtedly, DEA is one of the most powerful approaches that can be applied to
performance assessment, ranking and benchmarking in health care. In this research, the radial and
non-radial DEA models including BCC and SBM are implemented for a real case study in Iran to
assess the performance of hospitals and their departments. Also, the most productive scale size
and returns to scale are estimated for hospitals and their departments. Finally, input-excess, output-
shortfall, and reference-set for each of inefficient DMUs are proposed. For the future studies,
hybrid and novel multiple criteria decision making (MCDM) approaches can be employed for
performance appraisal of hospitals.67-69 Also, in cases where the number of hospitals is
considerable, clustering or grouping approach can be applied to categorize hospitals in different
groups so that in each group, there are at least one benchmark hospital and other related hospitals.
Moreover, uncertain DEA models such as fuzzy DEA, stochastic DEA, and robust DEA can be
applied for performance measurement of hospitals in the presence of data uncertainty and
ambiguity.70-74
Abbreviations
DEA: data envelopment analysis, DMU: decision making unit, MPSS: most productive scale
size, SBM: slack based measure, RTS: returns to scale, CRS: constant returns to scale, VRS:
variable returns to scale, IRS: increasing returns to scale, DRS: decreasing returns to scale, GDP:
gross domestic product, ICU: intensive care unit, ICU-OH: intensive care unit-open heart, NICU:
neonatal intensive care unit, CCU: coronary care unit, Post CCU: post coronary care unit, VIP:
very important person, MPI: Malmquist productivity index, PPS: production possibility set.
CCR: Charnes Cooper Rhodes, BCC: Banker Charnes Cooper, WDEA: window data
envelopment analysis, SEDEA: super efficiency data envelopment analysis, CEDEA: cross
efficiency data envelopment analysis, CSWDEA: common set of weights data envelopment
analysis, MGDEA: multi group data envelopment analysis, CDDEA: context dependent data
envelopment analysis, CGDEA: cooperative game data envelopment analysis, CCDEA: chance
constrained data envelopment analysis, FDEA: fuzzy data envelopment analysis, RDEA: robust
data envelopment analysis, BIRDEA: bootstrap interval robust data envelopment analysis,
MCDM: multiple criteria decision making.
Competing Interests
The authors declare no competing interests.
Authors’ Contributions
Pejman Peykani: Investigation, Conceptualization, Methodology, Literature Review, Data
Curation, Software, Validation, Writing - Original Draft. Emran Mohammadi: Supervision,
Formal Analysis, Investigation, Methodology, Validation, Writing - Review & Editing. Fatemeh
Sadat Seyed Esmaeili: Investigation, Methodology, Literature Review, Writing - Review &
Editing.
References
1. Aldalbahi AG, Juni MH, Rosliza AM, Ying LP, Ibrahim F. Methodological approach and
theoretical concept for measuring hospital technical efficiency. International Journal of Public
Health and Clinical Sciences. 2019;6(1):237-49.
2. Kohl S, Schoenfelder J, Fügener A, Brunner JO. The use of data envelopment analysis (DEA)
in healthcare with a focus on hospitals. Health Care Management Science. 2019;22(2):245-86.
3. Peykani P, Mohammadi E, Emrouznejad A, Pishvaee MS, Rostamy-Malkhalifeh M. Fuzzy
Data Envelopment Analysis: An Adjustable Approach. Expert Systems with Applications.
2019;136:439-452.
4. Peykani P, Mohammadi E. Interval network data envelopment analysis model for classification
of investment companies in the presence of uncertain data. Journal of Industrial and Systems
Engineering. 2018;11(Special issue: 14th International Industrial Engineering Conference):63-
72.

5. Peykani P, Mohammadi E. Window network data envelopment analysis: an application to
investment companies. International Journal of Industrial Mathematics. 2019.
6. Peykani P, Mohammadi E, Seyed Esmaeili FS. Stock evaluation under mixed uncertainties
using robust DEA model. Journal of Quality Engineering and Production Optimization. 2019.
7. Peykani P, Mohammadi E, Jabbarzadeh A, Jandaghian A. Utilizing robust data envelopment
analysis model for measuring efficiency of stock, a case study: Tehran Stock Exchange.
Journal of New Research in Mathematics. 2016;1(4):15-24.
8. Peykani P, Mohammadi E, Pishvaee MS, Rostamy-Malkhalifeh M, Jabbarzadeh A. A novel
fuzzy data envelopment analysis based on robust possibilistic programming: possibility,
necessity and credibility-based approaches. RAIRO-Operations Research. 2018;52(4):1445-
63.
9. Peykani P, Mohammadi E, Rostamy-Malkhalifeh M, Hosseinzadeh Lotfi F. Fuzzy data
envelopment analysis approach for ranking of stocks with an application to Tehran stock
exchange. Advances in Mathematical Finance and Applications. 2019;4(1):31-43.
10. Farrell MJ. The measurement of productive efficiency. Journal of the Royal Statistical Society.
Series A (General). 1957;120(3):253-290.
11. Charnes A, Cooper WW, Rhodes E. Measuring the efficiency of decision making units.
European Journal of Operational Research. 1978;2(6):429-44.
12. Banker RD, Charnes A, Cooper WW. Some models for estimating technical and scale
inefficiencies in data envelopment analysis. Management Science. 1984;30(9):1078-92.
13. Emrouznejad A, Yang GL. A survey and analysis of the first 40 years of scholarly literature in
DEA: 1978–2016. Socio-Economic Planning Sciences. 2018;61:4-8.
14. Bahadori M, Izadi AR, Ghardashi F, Ravangard R, Hosseini SM. The evaluation of hospital
performance in Iran: a systematic review article. Iranian Journal of Public Health.
2016;45(7):855.
15. Mahdiyan S, Dehghani A, Tafti AD, Pakdaman M, Askari R. Hospitals' efficiency in Iran: A
systematic review and meta-analysis. Journal of Education and Health Promotion.
2019;8(1):126.
16. Rezaei S, Hajizadeh M, Nouri B, Ahmadi S, Rezaeian S, Salimi Y, Karyani AK. Iranian
hospital efficiency: a systematic review and meta-analysis. International Journal of Health
Care Quality Assurance. 2019;32(2):385-97.
17. Hajialiafzali H, Moss JR, Mahmood MA. Efficiency measurement for hospitals owned by the
Iranian social security organisation. Journal of Medical Systems. 2007;31(3):166-72.
18. Hatam N. The role of data envelopment analysis (DEA) pattern in the efficiency of social
security hospitals in Iran. Iranian Red Crescent Medical Journal. 2008;10(3):208.
19. Hatam N, Moslehi S, Askarian M, Shokrpour N, Keshtkaran A, Abbasi M. The efficiency of
general public hospitals in Fars Province, Southern Iran. Iranian Red Crescent Medical Journal.
2010;12(2):138.
20. Jandaghi G, Matin HZ, Doremami M, Aghaziyarati M. Efficiency evaluation of Qom public
and private hospitals using data envelopment analysis. European Journal of Economics,
Finance and Administrative Sciences. 2010;22(2):83-91.
21. Ketabi S. Efficiency measurement of cardiac care units of Isfahan hospitals in Iran. Journal of
Medical Systems. 2011;35(2):143-50.
22. Shahhoseini R, Tofighi S, Jaafaripooyan E, Safiaryan R. Efficiency measurement in
developing countries: application of data envelopment analysis for Iranian hospitals. Health
Services Management Research. 2011;24(2):75-80.
23. Ebrahimnejad A. Cost efficiency measures with trapezoidal fuzzy numbers in data
envelopment analysis based on ranking functions: application in insurance organization and
hospital. International Journal of Fuzzy System Applications. 2012;2(3):51-68.
24. Ghotbuee A, Hemati M, Fateminezhad R. An empirical study based on BSC-DEA to measure
the relative efficiencies of different health care centers in province of Semnan, Iran.
Management Science Letters. 2012;2(7):2643-50.
25. Khani F, Naderi H, Zangeneh M, Fazeli E. Measuring the relative efficiency of Ilam hospitals
using data envelopment analysis. Management Science Letters. 2012;2(4):1189-94.
26. Marnani AB, Sadeghifar J, Pourmohammadi K, Mostafaie D, Abolhalaj M, Bastani P.
Performance assessment indicators: how DEA and Pabon Lasso describe Iranian hospitals’
performance. Health Med. 2012;6(3):791-6.
27. Sheikhzadeh Y, Roudsari AV, Vahidi RG, Emrouznejad A, Dastgiri S. Public and private
hospital services reform using data envelopment analysis to measure technical, scale,
allocative, and cost efficiencies. Health Promotion Perspectives. 2012;2(1):28.
28. Yusefzadeh H, Ghaderi H, Bagherzade R, Barouni M. The efficiency and budgeting of public
hospitals: Case study of Iran. Iranian Red Crescent Medical Journal. 2013;15(5):393.

29. Kalantary Z, Azar A. A robust data envelopment analysis model for ranking: A case of
hospitals of Tehran. Data Envelopment Analysis and Performance Measurement.
2014;Proceedings of the 11th International Conference of DEA:21-28.
30. Lotfi F, Kalhor R, Bastani P, Zadeh NS, Eslamian M, Dehghani MR, Kiaee MZ. Various
indicators for the assessment of hospitals' performance status: differences and similarities.
Iranian Red Crescent Medical Journal. 2014;16(4).
31. Mehrtak M, Yusefzadeh H, Jaafaripooyan E. Pabon Lasso and Data Envelopment Analysis: a
complementary approach to hospital performance measurement. Global Journal of Health
Science. 2014;6(4):107.
32. Torabipour A, Najarzadeh M, Mohammad AR, Farzianpour F, Ghasemzadeh R. Hospitals
productivity measurement using data envelopment analysis technique. Iranian Journal of
Public Health. 2014;43(11):1576.
33. Haji-Sami E, Ebrahimi Khameneh M, Rezaeisaray M, Esmaeili S. Robust DEA under discrete
uncertain data: An application for Iranian hospital emergency. 8th International Conference of
Iranian Operations Research Society, Iran. 2015.
34. Jahangoshai Rezaee M, Karimdadi A. Do geographical locations affect in hospitals
performance? A multi-group data envelopment analysis. Journal of Medical Systems.
2015;39(9):85.
35. Kheirollahi H, Matin BK, Mahboubi M, Alavijeh MM. Chance constrained input relaxation to
congestion in stochastic DEA. An application to Iranian hospitals. Global Journal of Health
Science. 2015;7(4):151.
36. Rezapour A, Azar FE, Zadeh NY, Roumiani Y, Faradonbeh SB. Technical efficiency and
resources allocation in university hospitals in Tehran, 2009-2012. Medical journal of the
Islamic Republic of Iran. 2015;29:266.
37. Kakeman E, Forushani AR, Dargahi H. Technical efficiency of hospitals in Tehran, Iran.
Iranian Journal of Public Health. 2016;45(4):494.
38. Kalhor R, Amini S, Sokhanvar M, Lotfi F, Sharifi M, Kakemam E. Factors affecting the
technical efficiency of general hospitals in Iran: data envelopment analysis. Journal of the
Egyptian Public Health Association. 2016;91(1):20-5.

39. Nabilou B, Yusefzadeh H, Rezapour A, Azar FE, Safi PS, Asiabar AS, Ahmadzadeh N. The
productivity and its barriers in public hospitals: case study of Iran. Medical journal of the
Islamic Republic of Iran. 2016;30:316.
40. Rabbani M, Heidari N, Farrokhi Asl H. A bootstrap interval robust data envelopment analysis
for estimate efficiency and ranking hospitals. Journal of Industrial Engineering and
Management Studies. 2016;3(2):107-22.
41. Rezaei S, Dopeykar N, Barouni M, Jafari M, Gharibi F. Do Hospitals Affiliated With the
Kurdistan University of Medical Sciences Perform Efficiently? Non-parametric Data
Envelopment Analysis. Hospital Practices and Research. 2016;1(4):135-40.
42. Abadi NY, Noori S, Haeri A. The use of resource allocation approach for hospitals based on
the initial efficiency by using data envelopment analysis. Journal of Health Management and
Informatics. 2017;4(4):101-6.
43. Ameryoun A, Najafi S, Nejati-Zarnaqi B, Khalilifar SO, Ajam M, Ansarimoghadam A. Factor
selection for service quality evaluation: a hospital case study. International Journal of Health
Care Quality Assurance. 2017;30(1):58-66.
44. Farzianpour F, Emami AH, Foroushani AR, Ghiasi A. Determining the technical efficiency of
hospitals in tabriz city using data envelopment analysis for 2013-2014. Global Journal of
Health Science. 2016;9(5):42.
45. Kakemam E, Dargahi H, Rahimi Forushani A. Association between managers’ competency
and technical efficiency in general hospitals in Iran. Journal of Patient Safety & Quality
Improvement. 2017;5(3):567-71.
46. Kheirollahi H, Hessari P, Charles V, Chawshini R. An input relaxation model for evaluating
congestion in fuzzy DEA. Croatian Operational Research Review. 2017;8(2):391-408.
47. Mirmozaffari M, Alinezhad A. Ranking of heart hospitals using cross-efficiency and two-stage
DEA. 7th International Conference on Computer and Knowledge Engineering. 2017;217-222.
48. Mirmozaffari M, Alinezhad A. Window analysis using two-stage DEA in heart hospitals.
International Conference on Innovation in Science, Engineering Computer and Technology,
UAE. 2017.
49. Raei B, Yousefi M, Rahmani K, Afshari S, Ameri H. Patterns of productivity changes in
hospitals by using Malmquist–DEA Index: a panel data analysis (2011–2016). Australasian
Medical Journal. 2017;10(10):856-64.
50. Shafaghat T, Hatam N, Rahimi Zarchi MK, Kavosi Z, Bayati M. Efficiency determination of
hospitals of Shiraz university of medical sciences using simple and super efficiency DEA
Models. International Journal of Hospital Research. 2017;6(3):55-68.
51. Alinezhad A, Mirmozaffari M. Malmquist productivity index using two-stage DEA model in
heart hospitals. Iranian Journal of Optimization. 2018;10(2):81-92.
52. Bahrami MA, Rafiei S, Abedi M, Askari R. Data envelopment analysis for estimating
efficiency of intensive care units: a case study in Iran. International Journal of Health Care
Quality Assurance. 2018;31(4):276-82.
53. Hadipour H, Kavoosi-Kalashami M, Salari A, Motamed MK. How efficient rural healthcare
centres work in Iran?. International Journal of Collaborative Research on Internal Medicine &
Public Health. 2018;10(1):747-59.
54. Jahangoshai Rezaee M, Yousefi S, Hayati J. A decision system using fuzzy cognitive map and
multi-group data envelopment analysis to estimate hospitals’ outputs level. Neural Computing
and Applications. 2018;29(3):761-77.
55. Ketabi S, Teymouri E, Ketabi M. Efficiency measurement of emergency departments in
Isfahan, Iran. International Journal of Process Management and Benchmarking.
2018;8(2):142-55.
56. Kiani MM, Mosavi Rigi SA, Karami H, Sepaseh F, Naghdi B, Shiravani M. Efficiency
evaluation of university hospitals in Bushehr province before and after the implementation of
the health system development plan. Evidence Based Health Policy, Management and
Economics. 2018;2(1):1-1.
57. Omrani H, Shafaat K, Emrouznejad A. An integrated fuzzy clustering cooperative game data
envelopment analysis model with application in hospital efficiency. Expert Systems with
Applications. 2018;114:615-28.
58. Pirani N, Zahiri M, Engali KA, Torabipour A. Hospital efficiency measurement before and
after health sector evolution plan in southwest of Iran: a DEA-Panel Data Study. Acta
Informatica Medica. 2018;26(2):106.
59. Hatefi SM, Haeri A. Evaluating hospital performance using an integrated balanced scorecard
and fuzzy data envelopment analysis. Journal of Health Management and Informatics.
2019;6(2):66-76.

60. Jahangoshai Rezaee M, Karimdadi A, Izadbakhsh H. Road map for progress and attractiveness
of Iranian hospitals by integrating self-organizing map and context-dependent DEA. Health
Care Management Science. 2019:1-27.
61. Tone K. A slacks-based measure of efficiency in data envelopment analysis. European Journal
of Operational Research. 2001;130(3):498-509.
62. Banker RD, Thrall RM. Estimation of returns to scale using data envelopment analysis.
European Journal of Operational Research. 1992;62(1):74-84.
63. Banker RD. Estimating most productive scale size using data envelopment analysis. European
Journal of Operational Research. 1984;17(1):35-44.
64. Cooper WW, Thompson RG, Thrall RM. Extensions and new developments in DEA. Annals
of Operations Research. 1996;66(1):1-45.
65. Jahanshahloo GR, Khodabakhshi M. Using input–output orientation model for determining
most productive scale size in DEA. Applied Mathematics and Computation. 2003;146(2-
3):849-55.
66. Azreena E, Juni MH, Rosliza AM. A systematic review of hospital inputs and outputs in
measuring technical efficiency using data envelopment analysis. International Journal of
Public Health and Clinical Sciences. 2018;5(1):17-35.
67. Torkzad A, Beheshtinia MA. Evaluating and prioritizing hospital service quality. International
Journal of Health Care Quality Assurance. 2019;32(2):332-46.
68. Sedady F, Beheshtinia MA. A novel MCDM model for prioritizing the renewable power
plants’ construction. Management of Environmental Quality: An International Journal.
2019;30(2):383-99.
69. Beheshtinia MA, Omidi S. A hybrid MCDM approach for performance evaluation in the
banking industry. Kybernetes. 2017;46(8):1386-407.
70. Cheraghi S, Hosseini-Motlagh SM, Ghatreh Samani M. Integrated planning for blood platelet
production: a robust optimization approach. Journal of Industrial and Systems Engineering.
2017;10(special issue on healthcare):55-80.
71. Ghatreh Samani MR, Hosseini-Motlagh SM, Ghannadpour SF. A multilateral perspective
towards blood network design in an uncertain environment: Methodology and implementation.
Computers & Industrial Engineering. 2019;130:450-71.

72. Ghatreh Samani M, Hosseini-Motlagh SM. A hybrid algorithm for a two-echelon location-
routing problem with simultaneous pickup and delivery under fuzzy demand. International
Journal of Transportation Engineering. 2017;5(1):59-85.
73. Hosseini-Motlagh SM, Ghatreh Samani MR, Cheraghi S. Robust and stable flexible blood
supply chain network design under motivational initiatives. Socio-Economic Planning
Sciences. 2019.
74. Hosseini-Motlagh SM, Ghatreh Samani MR, Homaei S. Blood supply chain management:
robust optimization, disruption risk, and blood group compatibility (a real-life case). Journal
of Ambient Intelligence and Humanized Computing. 2019:1-20.