measuring portfolio aigl nment
TRANSCRIPT

Portfolio Alignment Team | Measuring Portfolio Alignment
PortfolioAlignmentTeam
Measuring Portfolio Alignment Technical Considerations

Portfolio Alignment Team | Measuring Portfolio Alignment
What this report is:
The Portfolio Alignment Team (PAT) issued a report in 2020 titled Measuring Portfolio Alignment: Assessing the Position of Companies and Portfolios on the Path to Net Zero. This report provided a critical assessment of the strengths and trade-offs of the options available to measure the alignment of financial portfolios with climate goals.
The Task Force on Climate-related Financial Disclosures (Task Force or TCFD) conducted a public consultation from October 29, 2020, to January 28, 2021, to better understand the challenges and usefulness of forward-looking metrics for financial institutions. Responses to the consultation suggested that a few organizations are actively using forward-looking metrics, with more expecting them to be useful going forward. Furthermore, respondents indicated that more information would be helpful to address challenges related to methodologies and encourage standardization.
Given the continued interest in forward-looking metrics indicated by responses to its consultation, the Task Force requested the PAT develop a report outlining the PAT's views on portfolio alignment metrics and areas of further work as a resource for organizations interested in exploring portfolio alignment. The PAT has developed this technical report to identify (1) emerging best practice as it relates to building portfolio alignment tools and producing forward-looking measurements of financial portfolio alignment with the goals of the Paris Agreement, and (2) future research priorities where the field is not yet mature enough to identify best practice. This paper incorporates feedback received on its own public consultation, held June 7, 2021, to July 18, 2021, and expands on and supersedes the previous Portfolio Alignment Team report.
What this report is not:
This report is not a definitive guide to the optimal technical approach to portfolio alignment tool design. Given the limited time, analytical capacity, and provider/financial organization engagement available to the Portfolio Alignment Team during its production, the considerations and research priorities contained herein should be viewed as a first step toward promoting the widespread adoption of more consistent, robust, and decision-useful portfolio alignment approaches that will continue to evolve as the development and use of portfolio alignment tools mature. This report is not a product of the TCFD and does not provide additional recommendations or guidance under the Task Force’s disclosure framework.

Portfolio Alignment Team | Measuring Portfolio Alignment
Disclaimer
This report is the product of and reflects the collective work of the Portfolio Alignment Team. The views expressed in this report represent the consensus view of the working team; they do not necessarily, in all details, represent the individual views of the institutions that members of the Portfolio Alignment Team are affiliated with or the individuals that comprise the TCFD. The positions expressed in this report do not represent the views of any of the external organizations that were thanked for methodological or technical input.
About the Portfolio Alignment Team
The Portfolio Alignment Team was formed by the UN Special Envoy for Climate and Finance, Mark Carney, to respond to growing investor and lender interest in measuring portfolios’ relative alignment to the objectives of the Paris Agreement, and to advance industry efforts to promote widespread adoption of consistent, robust, and decision-useful approaches. This paper would not have been possible without the generous contributions of the analysts who lent their expertise and the organizations that made them available.
David Blood Senior Partner, Generation IM
Carter Powis Project Manager, Portfolio Alignment Team, McKinsey & Company
Portfolio Alignment Team
Dia Desai–HSBC
Dominic Tighe–COP26 Private Finance Hub
Ida Hempel–Generation IM
Jared Westheim–Goldman Sachs
Luc Oster-Pecqueur–McKinsey & Company
Nuria Fernandez–BBVA
Tanguy Séné–COP26 Private Finance Hub
William Anderson–Bank of America
Yuxi Suo–BlackRock Investment Management
The Portfolio Team Would Like to Acknowledge and Thank
Christopher Johnstone–Oliver Wyman
Linda-Eling Lee–MSCI
Nathan Faigle–MSCI
The Portfolio Team Would Like to Thank
McKinsey & Company for providing project management support and technical expertise throughout the production of this paper.
2DII, Arabesque, Barclays, Carbone4, CPR AM (Amundi Group), Lombard Odier, LSEG, MSCI, right. based on science, S&P Trucost, and SBTi for providing detailed information on their own portfolio alignment methodologies and technical input on select PAT questions.
III

Portfolio Alignment Team | Measuring Portfolio Alignment
Executive summary 1
Part A: What are portfolio alignment tools, why do they exist, and how can they be used? 14
1. Why does the financial system need simple, forward-looking metrics that measure how well financial portfolios align with the Paris Agreement goals? 15
2. What tools are available for providing this measurement? How and why would financial institutions choose one over the other? 17
3. How can portfolio alignment methods be used in various user contexts, and how do they fit in with existing net-zero/Paris-alignment guidance? 22
Part B: What makes a good portfolio alignment tool? 24
1. How do portfolio alignment tools work? 25
2. What does the Portfolio Alignment Team suggest regarding emerging best practice in designing portfolio alignment tools? 26
Judgement 1: What type of benchmark should be built? 26
Judgement 2: How should benchmark scenarios be selected? 31
Judgement 3: Should absolute emissions, production capacity, or emissions intensity units be used? 33
Judgement 4: What scope of emissions should be included? 38
Judgement 5: How should emissions baselines be quantified? 40
Judgement 6: How should forward-looking emissions be estimated? 44
Judgement 7: How should alignment be measured? 49
Judgement 8: How should alignment be expressed as a metric? 50
Judgement 9: How should counterparty-level scores be aggregated? 52
Part C: What is needed to build the enabling environment for the portfolio alignment tools? 58
1. Improve climate data and disclosures 60
2. Ensure scenarios are fit-for-purpose 66
3. Drive methodological convergence 69
Appendix 1: Best practice in regression analysis 72
Appendix 2: “Fair-share carbon budget” benchmark approach 74
Appendix 3: TCRE multipliers 76
Appendix 4: Emission target extrapolation approaches 77
Appendix 5: Glossary 78
Appendix 6: References 80
Contents
IV

Portfolio Alignment Team | Measuring Portfolio Alignment
Executive Summary
1 UN Framework Convention on Climate Change (UNFCCC), COP 26 and the Glasgow Financial Alliance for Net Zero (GFANZ), April 21, 2021.
Part A: What are portfolio alignment tools, why do they exist, and how can they be useful?
the transition progress of their counterparties, and in doing so, identify the engagement activities they must conduct to steer their portfolios toward Paris alignment.
In response to this need, a suite of models referred to as portfolio alignment tools have emerged. These tools are still in an early stage of development and face the challenges attendant with any new tool. The purpose of this paper is to lay out emerging best practice as it relates to the construction and use of these tools, in the hope it will advance industry thinking and promote more widespread adoption of consistent, robust, and decision-useful approaches.
Attaining some degree of common practice related to portfolio alignment is important not only to facilitate comparability and transparency within and across financial institutions, but also to provide clarity and consistency for non-financial institutions on how their behavior related to the net-zero transition may impact their interactions with banks, asset managers, asset owners, and insurance companies.
Consideration 1: The Portfolio Alignment Team suggests all financial institutions measure and disclose the alignment of their portfolios with the goals of the Paris Agreement and incorporate forward-looking metrics in their internal management processes.
1. Why does the financial system need simple, forward-looking metrics that measure how well financial portfolios align with the Paris Agreement goals?
Because warming is a function of cumulative emissions, resolving the climate crisis will require not only reducing emissions to net-zero, but also keeping total cumulative emissions within a defined carbon budget on route to zero.
At its heart, this is fundamentally a capital allocation problem. Achieving deep emissions reductions across the global economy will require large-scale turnover of installed capital stock (e.g., retiring assets that emit greenhouse gases, and investing in their replacement with new zero-emissions technology). The financial sector, therefore, has a critical role to play, helping to ensure capital flows toward activities needed for the net-zero transition and away from those detrimental to it.
In recognition of this fact, an increasing number of financial institutions have committed to aligning their lending or investing portfolios to the goals of the Paris Agreement, and in doing so, will reduce emissions to net-zero by midcentury. This is reflected, for example, by the launch of the Glasgow Financial Alliance for Net Zero (GFANZ) in April of this year.1
For financial institutions to achieve their climate ambitions and fulfill their critical role in the net-zero transition, however, they need a new set of forward-looking management tools to measure and evaluate
1
Portfolio Alignment Team | Measuring Portfolio Alignment
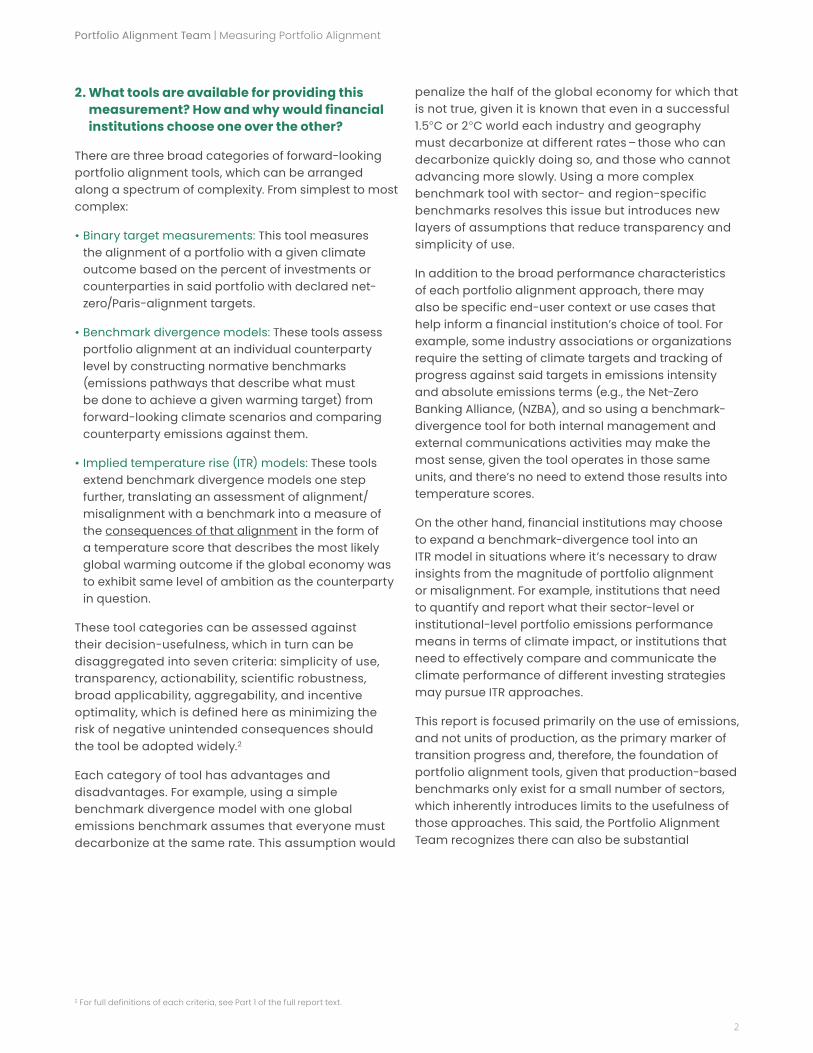
2. What tools are available for providing this measurement? How and why would financial institutions choose one over the other?
There are three broad categories of forward-looking portfolio alignment tools, which can be arranged along a spectrum of complexity. From simplest to most complex:
• Binary target measurements: This tool measures the alignment of a portfolio with a given climate outcome based on the percent of investments or counterparties in said portfolio with declared net-zero/Paris-alignment targets.
• Benchmark divergence models: These tools assess portfolio alignment at an individual counterparty level by constructing normative benchmarks (emissions pathways that describe what must be done to achieve a given warming target) from forward-looking climate scenarios and comparing counterparty emissions against them.
• Implied temperature rise (ITR) models: These tools extend benchmark divergence models one step further, translating an assessment of alignment/misalignment with a benchmark into a measure of the consequences of that alignment in the form of a temperature score that describes the most likely global warming outcome if the global economy was to exhibit same level of ambition as the counterparty in question.
These tool categories can be assessed against their decision-usefulness, which in turn can be disaggregated into seven criteria: simplicity of use, transparency, actionability, scientific robustness, broad applicability, aggregability, and incentive optimality, which is defined here as minimizing the risk of negative unintended consequences should the tool be adopted widely.2
Each category of tool has advantages and disadvantages. For example, using a simple benchmark divergence model with one global emissions benchmark assumes that everyone must decarbonize at the same rate. This assumption would
penalize the half of the global economy for which that is not true, given it is known that even in a successful 1.5°C or 2°C world each industry and geography must decarbonize at different rates – those who can decarbonize quickly doing so, and those who cannot advancing more slowly. Using a more complex benchmark tool with sector- and region-specific benchmarks resolves this issue but introduces new layers of assumptions that reduce transparency and simplicity of use.
In addition to the broad performance characteristics of each portfolio alignment approach, there may also be specific end-user context or use cases that help inform a financial institution’s choice of tool. For example, some industry associations or organizations require the setting of climate targets and tracking of progress against said targets in emissions intensity and absolute emissions terms (e.g., the Net-Zero Banking Alliance, (NZBA), and so using a benchmark-divergence tool for both internal management and external communications activities may make the most sense, given the tool operates in those same units, and there’s no need to extend those results into temperature scores.
On the other hand, financial institutions may choose to expand a benchmark-divergence tool into an ITR model in situations where it’s necessary to draw insights from the magnitude of portfolio alignment or misalignment. For example, institutions that need to quantify and report what their sector-level or institutional-level portfolio emissions performance means in terms of climate impact, or institutions that need to effectively compare and communicate the climate performance of different investing strategies may pursue ITR approaches.
This report is focused primarily on the use of emissions, and not units of production, as the primary marker of transition progress and, therefore, the foundation of portfolio alignment tools, given that production-based benchmarks only exist for a small number of sectors, which inherently introduces limits to the usefulness of those approaches. This said, the Portfolio Alignment Team recognizes there can also be substantial
2 For full definitions of each criteria, see Part 1 of the full report text.
2

Portfolio Alignment Team | Measuring Portfolio Alignment
benefits to using production-based approaches (see Judgement 3, p. 8), and that production-based alignment tools, therefore, have a role to play in portfolio alignment activities, particularly in data-poor environments.
As portfolio alignment tools continue to evolve and mature, it is inevitable that the use cases for different approaches will likewise continue to evolve. For this reason, it is the Portfolio Alignment Team’s suggestion that institutions use whichever portfolio alignment tool best suits their own individual context and capabilities.
Consideration 2: The Portfolio Alignment Team suggests institutions use whichever portfolio alignment tool best suits their institutional context and capabilities.
3. How can portfolio alignment methods be used in various user contexts, and how do they fit in with existing net-zero/Paris-alignment guidance?
Portfolio alignment tools have an important role to play in the target-setting process, in that they can provide input on what needs to be done in order to align a portfolio with the goals of the Paris Agreement in the intermediate term (e.g., on the way to net-zero), given its unique economic composition.
If portfolio alignment tools are not included as core inputs to the target-setting process, the tools lose their primary functionality, which is to help inform engagement and management decisions needed to achieve a given climate target (e.g., if a portfolio target is set using a single global benchmark, a portfolio alignment tool built using sector-level benchmarks, or even a global benchmark from a different climate scenario, will not be able to help a manager align their portfolio to that target).
Outside of target setting, forward-looking portfolio alignment tools can provide needed input into multiple different managerial processes for various financial institutions.
For example:
• Asset owners and managers: Portfolio alignment tools can inform the decisions needed to manage a portfolio toward a specific climate target. This could take the form of decisions about engagement (e.g., determine what expectations should be communicated to counterparties about how they behave in order to drive necessary real-economy changes), or decisions about portfolio allocation and optimization.
• Banks: Portfolio alignment tools can provide all the same functionality for lenders as for asset owners and managers while also contributing to the offering of equity- and debt-capital market services, and institutional-specific functions, such as internal capital allocation and limit setting, budgeting and internal charging, and product structuring (e.g., linked lending, covenants).
• Insurance companies: Portfolio alignment tools can provide the same functionality for insurance underwriters as for asset owners and managers, enabling them to align their underwriting decisions to a given climate goal.
• Central banks and supervisors: Central banks are responsible for managing large portfolios of assets relating to their monetary policy activity, management of reserves and other policy portfolios, as well as contingent holdings related to their role as “lender of last resort.” Furthermore, given that substantial numbers of financial institutions will be adopting and applying portfolio alignment tools in the near future, central banks and supervisors will need to be familiar with the tools and understand the systemic effects their use could have.
In addition to providing input into the setting of emissions targets (e.g., “We will reduce emissions by 30% by 2030”) and helping to inform the engagement and management decisions needed to achieve those targets, portfolio alignment tools can also provide input into the setting of temperature-based targets (e.g., “We will reduce our forward-looking ITR score from 3°C to 2°C by 2030”).
3

Portfolio Alignment Team | Measuring Portfolio Alignment
Temperature-based targets should be used to supplement emissions targets rather than replace them (as they are based on forecasts, not achieved emissions reductions), and portfolio alignment tools should be used as inputs to existing target-setting protocols, but should not supplant them.
Finally, it is important to note that portfolio alignment tools should not be used alone to try to quantify transition risk—quantifying transition risk is fundamentally an exploratory activity that is focused on investigating the full range of possible outcomes, whereas portfolio alignment is a normative and deterministic activity that focuses on a specific pathway to achieving a given outcome. Institutions should develop specialized tools to quantify transition risks to their businesses; for example, climate scenario analysis.
Consideration 3: The Portfolio Alignment Team suggests that portfolio alignment tools be developed and used alongside existing approaches to setting emissions reduction targets, so that they may effectively support the management and engagement decisions needed to achieve those targets.
Consideration 4: The Portfolio Alignment Team suggests portfolio alignment tools be used alongside other purpose-built tools for quantifying transition risks.
4

Portfolio Alignment Team | Measuring Portfolio Alignment
1. How do portfolio alignment tools work?
With the exception of binary target measurement, all portfolio alignment tools must follow three common steps. The first is translating scenario-based carbon budgets (associated with a given climate goal) into normative benchmarks. The second is assessing counterparty-level transition performance, and
Methodological Step Design Judgement
Step 1: Translating scenario-based carbon budgets into benchmarks
Judgement 1: What type of benchmark should be built?
Judgement 2: How should benchmark scenarios be selected?
Judgement 3: Should absolute emissions, production capacity, or emissions intensity units be used?
Step 2: Assessing counterparty-level alignment
Judgement 4: What scope of emissions should be included?
Judgement 5: How should emissions baselines be quantified?
Judgement 6: How should forward-looking emissions be estimated?
Judgement 7: How should alignment be measured?
Step 3: Assessing portfolio-level alignment
Judgement 8: How should alignment be expressed as a metric?
Judgement 9: How should counterparty-level scores be aggregated?
comparing those emissions to the benchmark. The third step is translating performance into counterparty-level scores, and aggregating them into a single portfolio-level score.
Across these three steps there are nine design judgements, detailed here:
Part B: What makes a good portfolio alignment tool?
5

Portfolio Alignment Team | Measuring Portfolio Alignment
2. What does the portfolio alignment team suggest regarding emerging best practice in designing portfolio alignment tools?
The Portfolio Alignment Team has developed considerations regarding emerging best practice against each of the nine design judgements. For an overview of those considerations, please see below. For further technical details on the rationale for specific considerations, please see the main body of this report.
Judgement 1: What type of benchmark should be built? There are two ways to extract a normative benchmark from climate scenarios. The first is to select the respective industry’s emissions pathway from a single scenario (referred to here as the “single-scenario benchmark” approach). The second is to develop a statistical function that describes the central tendency of a given industry’s emissions pathway across a wide range of different climate scenarios (referred to here as the “warming function” approach). Should portfolio alignment tools use single-scenario benchmarks or warming functions?
There are two ways to implement a benchmark (regardless of whether it is a single-scenario benchmark or warming function). The first is to create a convergence benchmark in which a counterparty’s emissions are measured against industry-average emissions level. The second is to create a rate-of-reduction benchmark in which each counterparty’s emissions are measured against industry-average rate of emissions reductions. There are also more advanced approaches that combine the two options together. Which should a portfolio alignment tool use?
Consideration 5: Both single-scenario benchmarks and warming-function approaches can be constructed such that they are technically viable, but the Portfolio Alignment Team suggests financial institutions use a single-scenario benchmark approach, as they are simpler to implement, easier to interpret, and more transparent with regard to assumptions and their effect on results.
Consideration 6: The Portfolio Alignment Team suggests financial institutions follow one of two single-scenario benchmark construction approaches. Institutions should either (a) follow the fair-share carbon budget approach for all sectors, or (b) prioritize convergence-based benchmarks for the sectors for which it is possible to extract such benchmarks from reference scenarios, and to use rate-of-reduction benchmarks for those sectors for which it is not.
6

Portfolio Alignment Team | Measuring Portfolio Alignment
Judgement 2: How should benchmark scenarios be selected? Financial institutions need to decide what scenario to base their portfolio alignment activities on. This choice of scenario is particularly important, as it needs to match individual institutional climate ambition and beliefs about the future in order for portfolio alignment tools to provide useful input on the engagement and transition activities needed to achieve said ambition. However, scenarios should also be chosen such that they are scientifically robust and non-preferential to any given institution or portfolio. Given these considerations, how should a financial institution go about selecting a scenario? Once an appropriate scenario has been selected, institutions also need to decide on the level of geographical and sectoral granularity to extract from that scenario when constructing benchmarks. For example, an institution could use a single-sector economy, global emissions pathway as a benchmark. Alternatively, it could disaggregate that benchmark into sub-sector and region-specific benchmarks. Which approach is preferable?
Consideration 7: The Portfolio Alignment Team suggests that financial institutions select a 1.5°C scenario that complies, at a minimum, with the scenario selection criteria set out by the Science Based Targets initiative (SBTi) in their document Foundations of Science-Based Target Setting.3 If an institution’s stated ambition is a warming target larger than 1.5°C, the SBTi criteria should still be applied to scenario choice. Additionally, the Portfolio Alignment Team recognizes that there may be additional or complimentary scenario selection criteria developed by industry organizations or associations (e.g., UN Environment Programme Finance Initiative (UNEP FI), the Net-Zero Asset Owner Alliance (NZAOA), the Net Zero Asset Managers Initiative (NZAMI), and the Net Zero Banking Alliance (NZBA)), which this consideration should not supersede.
3 SBTi, Foundations of Science-Based Target Setting, 2019.
Consideration 8: The Portfolio Alignment Team suggests financial institutions prioritize granular benchmarks where they meaningfully capture material differences in decarbonization feasibility across industries or regions. This will allow tools to increase the complexity with which they can accommodate necessarily differentiated rates of decarbonization into emissions benchmarks.
Consideration 9: The Portfolio Alignment Team suggests reference scenarios used for portfolio alignment activities be regularly updated to help minimize the risk that the benchmarks substantially underestimate the counterparty-level actions needed to achieve a given warming outcome.
7

Portfolio Alignment Team | Measuring Portfolio Alignment
Judgement 3: Should absolute emissions, production capacity, or emissions intensity units be used? There are three ways for a portfolio alignment tool to measure a given asset’s climate performance: through absolute emissions benchmarks, production capacity benchmarks (e.g., barrels of oil, watts of coal-fired electricity), or emissions intensity benchmarks, which can be defined as units of absolute emissions either per unit physical output (e.g., a barrel of oil) or per unit revenue/profit. Which approach is preferable?
Consideration 10: Methodologies can use absolute emissions, production capacity, or intensity-based approaches and remain scientifically robust, but the Portfolio Alignment Team suggests adhering to the following guidelines:
If financial institutions follow a fair-share carbon budget approach, they will necessarily need to use absolute emissions in combination with both physical and economic intensity.
If financial institutions choose to employ both convergence and rate-of-reduction benchmarks on a sector-by-sector availability basis, the Portfolio Alignment Team suggests they prioritize the use of physical emissions intensity for their convergence benchmarks, as convergence benchmarks cannot easily be constructed in absolute or production capacity terms (e.g., this requires complex estimation approaches to normalize benchmarks to counterparty level). Using either absolute or production units will disincentivize inorganic growth, which may be necessary for an efficient net-zero transition. Where physical emissions intensity is not available, financial institutions should revert to absolute-based rate-of-reduction benchmarks, to optimize scientific robustness and minimize the volatility inherent in economic intensity measurements.
If methodologies use a warming-function benchmark, the Portfolio Alignment Team also suggests they do so using physical emissions intensity where possible, for the same reasons.
The exception to these later two considerations comes when measuring the alignment of counterparties in the fossil fuel sectors. Standard emissions metrics do not appropriately reward the two key decarbonization strategies for these sectors—reducing output of hard-to-decarbonize products and diversifying into other sectors. There are two solutions to this problem: First, apply two separate benchmarks to generate a counterparty score, one assessing fossil fuel emissions against an absolute rate-of-reduction benchmark, , and the second assessing power-sector performance against an emissions-intensity convergence benchmark; or second, use a combined energy sector convergence benchmark measuring emissions intensity in units of energy or power (e.g., joules or watts), allowing for reduction in intensity through differentiation into renewables.
While the focus of this report is on emissions-based portfolio alignment approaches, the Portfolio Alignment Team recognizes that there are important use cases for production-based approaches when considering the sectors for which that is a valid measurement option.
Finally, it is important to note that these suggestions are not intended to contradict or supersede other climate reporting guidelines, including those in the TCFD guidance on Metrics, Targets, and Transition Plans—financial institutions can and should consider following the above suggestions when constructing portfolio alignment tools, and at the same time comply with additional reporting and disclosure requirements as appropriate.
8

Portfolio Alignment Team | Measuring Portfolio Alignment
Judgement 4: What scope of emissions should be included? When measuring the transition performance of a given counterparty, how should financial institutions draw boundaries of responsibility for emissions produced? Counterparties can be viewed as responsible for their Scope 1 (direct emissions), Scope 2 (indirect emissions), and/or Scope 3 emissions (value chain emissions).
Consideration 11: The Portfolio Alignment Team suggests financial institutions include Scope 3 emissions for the sectors for which they are most material and for which benchmarks can be easily extracted from existing scenarios (fossil fuels, mining, automotive). This deliberately differs from the PCAF/EU TEG Financed Emissions schedule, as the scenario benchmarks and counterparty data needed to accommodate the inclusion of Scope 3 emissions outside these boundaries do not yet exist.
Consideration 12: As better Scope 3 data and scenario benchmarks become available, the Portfolio Alignment Team suggests financial institutions consider expanding Scope 3 coverage to additional sectors as appropriate. As this process progresses, the Portfolio Alignment Team suggests financial institutions investigate the materiality of double counting that results and, if appropriate, develop methods to remove that double counting.
Judgement 5: How should emissions baselines be quantified? When quantifying present-day counterparty emissions, there are two primary design questions that need to be answered. First, what greenhouse gases (GHGs) should be quantified and in what terms? Second, how should that quantification be done—using self-reported emissions data or via external estimation methods?
4 Listed equity and corporate bonds, business loans and unlisted equity, project finance, commercial real estate, mortgages, and motor vehicle loans.
Consideration 13: The Portfolio Alignment Team suggests portfolio tools cover all seven GHGs mandated by the Kyoto Protocol. In the immediate term, gases may be aggregated using the GWP framework detailed by the GHG Protocol.
Consideration 14: In the medium term, the Portfolio Alignment Team suggests scenario developers work to build out individual benchmarks for methane in the sectors for which it forms a substantial proportion of GHG output (agriculture, fossil fuels, mining, waste management). This will allow financial institutions to measure methane separately from the other gases and avoid overstating its long-term warming impact in the way that the GWP framework does.
Consideration 15: When it comes to prioritizing sources for emissions data, the Portfolio Alignment Team suggests the PCAF Standard be followed for each of the six asset classes it covers.4 PCAF suggests prioritizing reported overestimated emissions data and estimating emissions data using activity levels as close as possible to the emissions drivers (i.e., based on physical rather than economic intensity). The Portfolio Alignment Team recognizes that data availability is currently poor, and estimated emissions may be needed to fill gaps when self-reported data is not available, particularly for Scope 3 emissions or diversified enterprises. When the PCAF Standard does not provide appropriate guidance, the Portfolio Alignment Team suggests following the GHG Protocol.
Consideration 16: The Portfolio Alignment Team suggests financial institutions take every effort to disclose transparently the data sources and methodologies used to estimate emissions. This may require them to engage with vendors when using externally estimated data.
9

Portfolio Alignment Team | Measuring Portfolio Alignment
Judgement 6: How should forward-looking emissions be estimated? When projecting forward-looking emissions of a given counterparty, portfolio alignment methods must resolve two design questions. The first is on what basis to project emissions (e.g., using historical data or targets). Assuming that a given tool will use both historical data and emissions targets to inform future projections, the second design question is what method to use to combine those data sources.
Consideration 17: The Portfolio Alignment Team suggests forward-looking projections not be based solely on stated targets, as that could incentivize good target-setting behavior but not actual emissions reduction in the real economy. Equally, the Portfolio Alignment Team suggests projections not be based solely on historical emissions or near-term CapEx plans, as the future policy and economic environment is likely to look very different from the past and present. Projections should incorporate multiple data sources. The weights between data sources should be based on a credibility analysis of short- and long-term targets (where they exist) given available technology and policy levers, and should be back-tested to improve fidelity over time.
Judgement 7: How should alignment be measured? Once future emissions of a given counterparty has been forecasted, portfolio alignment methods must decide whether to measure alignment against a given benchmark in cumulative terms (e.g., based on the divergence between counterparty and benchmark over time) or point-in-time terms (e.g., divergence between counterparty and benchmark at a given point in time). Which of those approaches is preferable?
5 TCRE: Transient climate response to cumulative carbon emissions—a multiplier that relates a given quantity of cumulative CO2 emissions directly to increase in global average temperature.
Consideration 18: The Portfolio Alignment Team suggests financial institutions calculate alignment or warming scores on a cumulative-emissions basis, in order to appropriately accommodate the physical relationship between cumulative emissions and warming outcomes.
Judgement 8: How should alignment be expressed as a metric? Having calculated a degree of alignment, portfolio alignment methods must then express that alignment using a metric. There are many different choices of available metrics, ranging from specific temperature scores, temperature ranges, percentage misalignment from a given scenario, etc. Is there an optimal metric choice? Additionally, if calculating a temperature score, what is the optimal approach to do so? This can be done either by interpolating counterparty performance between multiple temperature benchmarks or by calculating total carbon budget overshoot and applying a TCRE (transient climate response to cumulative carbon emissions) multiplier.5
Consideration 19: The Portfolio Alignment Team suggests financial institutions select whichever alignment metric is most informative for their specific institution and use case.
Consideration 20: If converting alignment into an implied temperature rise metric, the Portfolio Alignment Team suggests that, in the near term, financial institutions do so by converting alignment into absolute emissions terms, from which total carbon budget overshoot between today and the net-zero target date can be calculated and combined with a TCRE multiplier to derive temperature outcome. In the medium term, as internal consistency improves across available climate scenarios, financial institutions should consider moving to a multiple benchmark interpolation approach, which can avoid some of the technical issues inherent with application of a TCRE multiplier.
10

Portfolio Alignment Team | Measuring Portfolio Alignment
Judgement 9: How should counterparty-level scores be aggregated? In order to be able to inform decisions about portfolio management, counterparty-level alignment scores need to be aggregable from counterparty level up to portfolio or sub-portfolio level. This poses a design question: How should aggregation be done? Should counterparty-level scores be combined using an aggregated carbon budget approach, or a simple weighted average? What weighting scheme should these approaches employ? What disclosures, if any, should be made regarding the fidelity of, or changes to, these aggregated scores?
Consideration 21: The Portfolio Alignment Team suggests, if disclosing portfolio alignment information, financial institutions use an aggregated-budget approach in order to maximize the scientific robustness of their disclosures.
Consideration 22: The Portfolio Alignment Team suggests, if supporting internal capital allocation decisions, financial institutions may use a simple weighted average approach.
Consideration 23: The Portfolio Alignment Team suggests financial institutions disclose the proportion of their portfolio covered by a portfolio alignment score, and that they clearly label the aggregation methods applied, as each comes with their own use cases.
Consideration 24: The Portfolio Alignment Team suggests financial institutions include a statement in their portfolio alignment disclosures regarding uncertainties arising from the methodology, data, and scenario(s) employed.
Consideration 25: The Portfolio Alignment Team recognizes that methodology, data, and scenarios will improve over time, causing portfolio alignment scores to change. The team suggests financial institutions include a statement in their portfolio alignment disclosures attributing score changes to methodological, data, or scenario improvements as they occur.
11

Portfolio Alignment Team | Measuring Portfolio Alignment
6 Institut Louis Bachelier, et al., The Alignment Cookbook–A Technical Review of Methodologies Assessing a Portfolio’s Alignment with Low-carbon Trajectories or Temperature Goal, 2020.
In the context of this paper, the team relied on method provider questionnaires, consultation with experts, scientific research, emerging international standards, and logical analysis to make considerations on appropriate methods. These considerations were carefully calibrated to balance usability with scientific accuracy and focused on making considerations for which the advantages of specific design choices had a high burden of proof. However, these considerations and other, more detailed tool specifications in the future should ultimately be confirmed through open and transparent experimentation.
In addition to the experimentation needed to confirm best practice considerations, the Portfolio Alignment Team recognizes that, as of the time of writing, there are major gaps in the supporting climate data and analytics ecosystem that prevent investors from taking full advantage of portfolio alignment tools. The results of these gaps are reflected in other existing studies, including The Alignment Cookbook,6 which have found that variations in methods, data, and scenarios lead existing methods to uncorrelated alignment scores for the same portfolio.
As portfolio alignment tool adoption increases, these gaps could become barriers to effective portfolio alignment, expose financial institutions to greenwashing accusations, and cause investors to make incorrect assessments about the forward-looking trajectory of portfolios and individual investees/counterparties.
Institutions will not be able to resolve these gaps alone; instead, a coordinated effort is required to build an enabling environment by the full stakeholder community of data providers, financial institutions, nonprofits, non-financial institutions, and governments. Such an effort should comprise three broad pillars:
1. Improving corporate data and disclosures: Essential inputs into portfolio alignment measurement, including emissions, targets, and transition plans, remain limited across portfolio counterparties; financial institutions, non-financial institutions, and governments have a critical role to play in developing a disclosure environment that can successfully enable portfolio alignment assessments.
2. Ensuring fit-for-purpose scenarios: Financial institutions managing against net-zero targets remain limited to a relatively narrow set of appropriate benchmark scenarios not explicitly designed for this purpose; to be successful, appropriate net-zero scenarios for alignment benchmarking need to be funded through broader research efforts, and scenarios will need to be updated more frequently.
3. Driving methodological convergence: The impact of portfolio alignment methodology decisions remain limited in transparency; a more open, collaborative development of toolkits, with disclosure of adherence to the design considerations within this paper and reasons for divergence where appropriate, can help drive convergence through increased transparency and refining of agreed-upon best practice based on experimental evidence. It is important to note that while following and refining the considerations provided in this paper will help drive convergence, it will not eliminate the difference in scores between different methods, as variables like scenario choice and forecasting method will still introduce variance to final results.
In light of these challenges, the Portfolio Alignment Team proposes a series of necessary next steps that should be taken in order to facilitate the effective development and use of portfolio alignment tools.
Part C: What is needed to build the enabling environment for the portfolio alignment tools?
12

Portfolio Alignment Team | Measuring Portfolio Alignment
Suggested Next Steps:
Regulators and standard-setters should come together to drive increased global participation, convergence, and harmonization on core climate-related disclosures; these efforts should consider disclosure needs specifically for the portfolio alignment use case.
Nonprofits, international organizations (IOs), and financial institutions should work collaboratively to converge on emissions measurement and estimation standards and reporting expectations across alternative asset classes and geographies critical for alignment for which methodologies are not currently available.
Nonprofits, IOs, and financial institutions should work collaboratively on the advancement of tools and innovation to help counterparties provide scalable, actionable, and useful climate-related intelligence on their businesses necessary to improve accuracy and usefulness of portfolio alignment tools.
The global research community should collaborate with nonprofits, governments, and international organizations to identify appropriate, consensus design principles for climate scenarios and specifications for the development of new net-zero scenarios for use in portfolio alignment tools.
Necessary funding should be deployed for research on the development of a new generation of scenarios explicitly designed for the purposes of portfolio alignment.
Necessary funding and infrastructure should be deployed to ensure policy, technology, and emissions updates are adequately and accurately reflected in climate scenarios to ensure that net-zero benchmarks reflect the highest potential pathways for global decarbonization to meet 1.5°C goals
Consideration 26: To drive convergence, data and analytics providers should disclose their choices against the nine key judgements in this document and explain reasons for diverging from core considerations, as these will aid iteration and ultimately inform development of more refined standards.
13

Portfolio Alignment Team | Measuring Portfolio Alignment
Part A: What are portfolio alignment tools, why do they exist, and how can they be used?

Portfolio Alignment Team | Measuring Portfolio Alignment
1. Why does the financial system need simple, forward-looking metrics that measure how well financial portfolios align with the Paris Agreement goals?
Climate change poses a grave threat to society. As a result of large-scale human emission of greenhouse gases, temperatures are rising, pushing the planet out of the relatively stable and temperate state that has existed for the duration of organized human society.7 The international scientific community warns that to avoid the most catastrophic impacts of this process, warming needs to be kept well below a 2°C increase in global average temperatures, and that every effort should be pursued to keep warming below 1.5°C.8 These goals were formalized by the international community in 2015 with the signing of the Paris Agreement.
To achieve the goals of the Paris Agreement, the world needs to reach net-zero emissions of long-lived greenhouse gases by roughly midcentury, and must keep total cumulative emissions between now and then within an “allowable” carbon budget of ~1000 gigatons of carbon dioxide (GtCO2) for a 2°C target and ~400 GtCO2 for a 1.5°C target.9 Given that global emissions are currently over ~40 Gt a year, staying within budget will require very rapid reductions across the entire global economy.
Emissions reduction on this scale can only be achieved given a rapid turnover of the global-installed asset base, replacing technologies that emit greenhouse gasses with non-emissive technologies at scale. This transformation will require substantial capital investment. The greatest financing will be needed in the highest-emitting sectors, and thus a smooth transition to net-zero society will depend on capital flowing to decarbonization activities in these sectors. The finance community, thus, has an essential role to play in continuing to work with counterparties in emissive industries to ensure capital flows toward activities that are aligned with a transition to a 1.5°C future and is re-directed away from those that are not.
Understanding this responsibility, financial institutions are increasingly making public commitments to align their activities with the goals of the Paris Agreement or, more broadly, to reduce their “financed emissions” to net-zero by midcentury in a way that is consistent with the achievement of a 1.5°C target.10 This is reflected, for example, by the launch of the Glasgow Financial Alliance for Net Zero (GFANZ)11 in April 2021. These commitments represent a fundamental reshaping of the way that the financial system thinks about allocating capital, which, in turn, is creating a need for new quantitative tools and metrics to govern this process.
Specifically, it is critical that the tools and metrics financial institutions use to set climate targets and track progress against them are built to incentivize institutions to engage with counterparties and achieve targets by facilitating their transition, instead of by divesting. It is widely accepted that pursuing divestment will pose substantial problems to the net-zero transition, both on an individual institution level and financial system level, by driving emissive industries out of the regulated capital markets and responsible public ownership, and overinflating demand for already net-zero or post-transition counterparties. In other words, only through engagement can financial institutions ensure capital flows toward activities that are aligned with a transition to a 1.5°C future and is redirected away from those that are not. However, building a portfolio management tool that incentivizes engagement over divestment is difficult because it depends on three things:
1. Present-day emissions of a given counterparty cannot be assessed alone. They must be assessed relative to a forward-looking emissions pathway that demonstrates how emissions must evolve in order to achieve a given climate target. In other words, counterparties should be evaluated not
7 Intergovernmental Panel on Climate Change (IPCC), Climate Change 2014: Synthesis Report, 2014.8 IPCC, Special Report Global warming of 1.5°C, 2018.9 Rogelj, Forster, Kriegler, et al., “Estimating and tracking the remaining carbon budget for stringent climate targets,” 2019.10 Financed emissions are defined as GHG emissions associated with the lending and investment activities of financial institutions.11 UNFCCC, COP 26 and the Glasgow Financial Alliance for Net Zero (GFANZ), April 21, 2021.
15

Portfolio Alignment Team | Measuring Portfolio Alignment
decision-useful approaches. Attaining some degree of common practice related to portfolio alignment is important not only to facilitate comparability and transparency within and across financial institutions, but to provide clarity and consistency for counterparties on how their behavior related to the net-zero transition may impact their interactions with investors and lenders.
The rest of this paper is organized as follows: the remainder of section A investigates the various approaches to measuring portfolio alignment and how and why a financial organization may decide to use one over the other. Section B walks through the nine common design decisions that must be made when building a portfolio alignment tool, regardless of philosophical approach, and provides best-practice considerations for each. Section C concludes by examining some of the outstanding data and methodological challenges to widespread adoption and use of portfolio alignment tools.
Consideration 1: The Portfolio Alignment Team suggests all financial institutions measure and disclose the alignment of their portfolios with the goals of the Paris Agreement and incorporate forward-looking metrics in their internal management processes.
on their emissivity, but on their rate of transition. For example, a highly emissive counterparty in the fossil fuel sector should not be evaluated poorly given its high level of present-day emissions alone—those emissions must be considered relative to an appropriate 1.5°C emissions pathway. If said counterparty is reducing emissions (e.g., transitioning, at the appropriate rate year over year), they should be evaluated favorably, even though they are highly emissive in absolute terms.
2. Not every counterparty needs to, or is able to, decarbonize at the same rate in order to achieve the goals of the Paris Agreement. Financial institutions need to be able to accurately quantify and account for this in their transition assessments, which requires making assumptions about how the global carbon budget will be divided across geography and sector (because warming is a function of global cumulative emissions, not the emissions of any given actor or set of actors).
3. Projections of the future evolution of counterparty transition performance are necessary so that financial institutions can anticipate when and how specific counterparties are likely to diverge from the needed rate of transition, and engage proactively with them to help course-correct.
To address these needs, a diverse suite of tools known collectively as portfolio alignment tools have emerged. The purpose of this paper is to lay out emerging best practice as it relates to the construction and use of such portfolio alignment tools, in the hope it will advance industry thinking and promote more widespread adoption of consistent, robust, and
16

Portfolio Alignment Team | Measuring Portfolio Alignment
across the different sectors of the economy in order to comply with a given warming outcome under various socioeconomic conditions. In other words, a scenario offers one possible division of a global carbon budget across time, geography, and sector that would restrict warming to below 1.5°C, for example, given specific demographic and economic trends.
Thus, these scenarios can show us how a given industry or counterparty needs to act in order to align with a given warming outcome—providing that everyone else also follows the emissions pathways outlined in that specific scenario (see Box 1, p. 18).
Using these inputs—present-day data, projections, and scenario-based benchmarks—institutions have developed a range of tools to measure portfolio alignment with warming goals. These tools exist along a spectrum of complexity:
• The simplest tool is the binary measurement of whether a counterparty has made a net-zero/Paris-alignment commitment that is consistent with science and existing industry frameworks. The percentage of a given portfolio with such commitments is one way to measure total portfolio alignment.
• The second, more complex approach is a benchmark-divergence model. Benchmark-divergence models measure present-day performance and forward-looking forecasts of counterparty emissions against a reference pathway drawn from a climate scenario.
Complex benchmark-divergence models may use forward-looking climate scenarios to disaggregate the global carbon budget down to region- and sector-level benchmarks. This allows portfolio managers to measure alignment with a Paris-compliant future in a way that accounts for different decarbonization rates across sectors and regions.
Measuring how a given counterparty aligns with a specific warming outcome requires three kinds of information: (1) present-day data on counterparty emissions performance, (2) forward-looking projections of the emissions that a counterparty is likely to produce, and (3) a normative benchmark that describes the decarbonization pathway a given counterparty needs to follow to achieve a specified warming outcome, given assumptions about how the rest of the world is progressing on their own decarbonization trajectories.
For the first two requirements, present-day data and projections of future counterparty emissions, financial institutions can draw on a broad range of data. Forward-looking data, including declared CapEx plans and short- and long-term emissions targets or commitments, are important for projections because the future will look different from the present, and plans can shed light on how. Historical data, such as trends in CapEx and emissions, are important because plans do not always work out, and what happened in the past offers empirical evidence against which to judge the credibility of forward-looking ambition.
For the third requirement, normative benchmarks against which to compare projections, the tools available to us are forward-looking climate scenarios such as those contained in the International Institute for Applied Systems Analysis's (IIASA) Shared Socioeconomic Pathway (SSP) scenario database,12 or those offered by the International Energy Agency (IEA).13 These scenarios are created by public and private research centers using coupled climate-economy Integrated Assessment Models (IAMs), which attempt to solve for the most cost-optimal approach to achieving identified warming targets. Each scenario provides a specific pathway that sets out how emissions or production capacity might evolve
12 IIASA, SSP Database-Version 2.0. 13 IEA, World Energy Outlook 2020. 14 EU TEG Group, Interim Report on Climate Benchmarks and Benchmarks’ ESG Disclosures, June 2019.
2. What tools are available for providing this measurement? How and why would financial institutions choose one over the other?
17

Portfolio Alignment Team | Measuring Portfolio Alignment
• The third category of portfolio alignment tools is implied temperature rise (ITR) or degree-warming models. Given they are the newest form of portfolio alignment tool, there is still substantial misunderstanding surrounding what ITR models are and how they work. ITR models are identical in design to the more established benchmark-divergence approaches, except that they extend model output one level further by translating each counterparty’s benchmark alignment (or lack thereof) into a measurement of consequences in the form of a single temperature score. For example, a score of 2.5°C assigned to a given counterparty indicates that the counterparty is exceeding its fair share of the global carbon budget (its benchmark) and that if everyone exceeded their fair shares by a similar proportion, the world would end up with ~2.5°C of warming by the end of the century.
The best way to choose between tool classes, agnostic of user context, is to evaluate their decision-usefulness. This will depend on how well they integrate with and inform the more general decision-making processes employed by financial institutions. This can be represented as a set of criteria by saying that a tool is “decision-useful” if it is:
• simple to use–the tool should be simple and easy for institutions to use regardless of their size or available resources;
• transparent–the tool should provide easily communicable and usable outputs and be clear about where it makes simplifying assumptions and how those assumptions should be taken into account when interpreting results;
• science-based–the tool should be built upon the latest peer-reviewed science and be logically and analytically sound;
• broadly applicable–the tool should be equally applicable to all the different types of assets held across financial portfolios;
Box 1 Using forward-looking climate scenarios to create normative emissions benchmarks
Because the future is unknown, and because global warming is a function of total cumulative emissions over time, forward-looking scenarios are the only option for setting individual counterparty-level climate targets and building portfolio alignment tools. This poses two opposing problems:
On one hand, if every provider uses a different forward-looking scenario, even if they are aligned on a given target, there is no guarantee that their collective actions will result in the desired warming outcome. For example, the division of the global carbon budget across time, region, industry, and technology may differ so dramatically between separate 1.5°C scenarios that having some portion of the world follow one scenario and another portion follow a second scenario would mean that the cumulative impact of their collective behavior far exceeded the overall 1.5°C carbon budget.
On the other hand, if every preparer uses the same forward-looking scenario, it gives great influence over global capital flows to a single scenario developer. Given the uncertainties involved, this may be undesirable.
There is no simple resolution to these joint problems. Nonetheless, setting targets and measuring the alignment of financial portfolios against those targets are one of the many actions needed to achieve the goals of the Paris Agreement. It will be incumbent on the global economic community to continue to advance thinking on balancing these joint problems and in doing so improve our ability to manage global emissions in line with the goals of limiting future global warming. For guidance on how institutions can proceed thoughtfully in light of these uncertainties in the near term, see Judgement 2 (p. 7).
14 EU TEG Group, Interim Report on Climate Benchmarks and Benchmarks’ ESG Disclosures, June 2019.
18
Portfolio Alignment Team | Measuring Portfolio Alignment
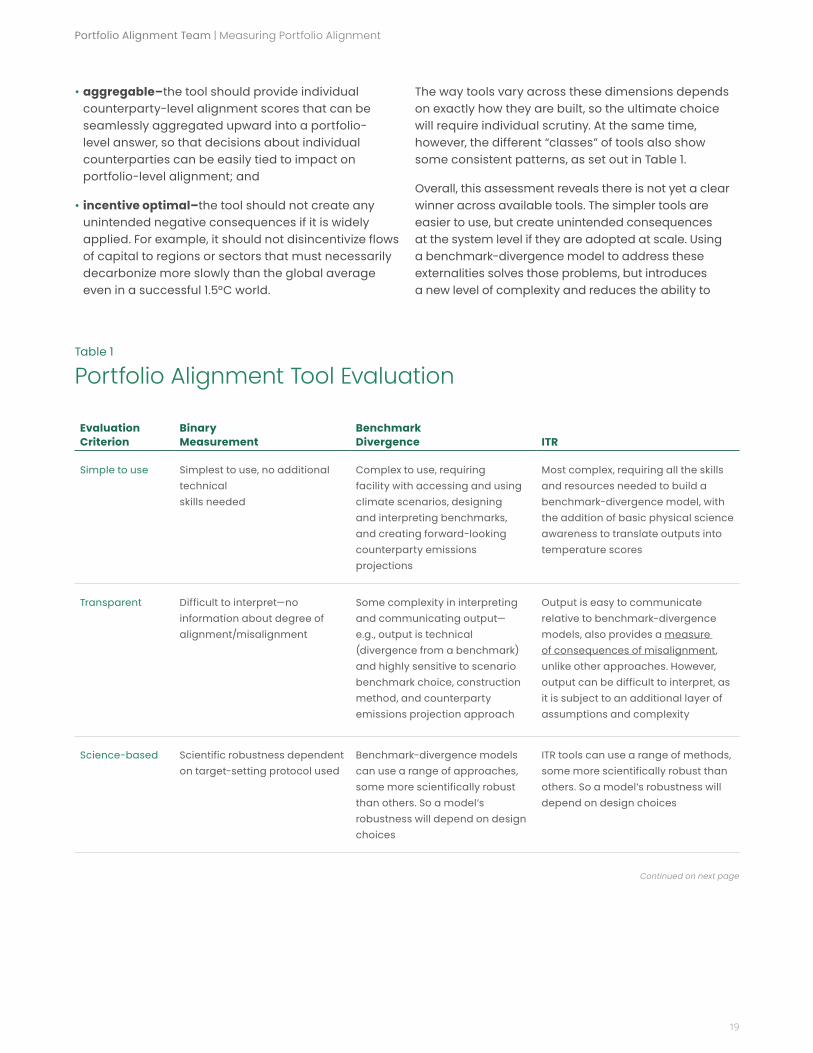
The way tools vary across these dimensions depends on exactly how they are built, so the ultimate choice will require individual scrutiny. At the same time, however, the different “classes” of tools also show some consistent patterns, as set out in Table 1.
Overall, this assessment reveals there is not yet a clear winner across available tools. The simpler tools are easier to use, but create unintended consequences at the system level if they are adopted at scale. Using a benchmark-divergence model to address these externalities solves those problems, but introduces a new level of complexity and reduces the ability to
• aggregable–the tool should provide individual counterparty-level alignment scores that can be seamlessly aggregated upward into a portfolio-level answer, so that decisions about individual counterparties can be easily tied to impact on portfolio-level alignment; and
• incentive optimal–the tool should not create any unintended negative consequences if it is widely applied. For example, it should not disincentivize flows of capital to regions or sectors that must necessarily decarbonize more slowly than the global average even in a successful 1.5°C world.
Evaluation Criterion
Binary Measurement
Benchmark Divergence ITR
Simple to use Simplest to use, no additional technical skills needed
Complex to use, requiring facility with accessing and using climate scenarios, designing and interpreting benchmarks, and creating forward-looking counterparty emissions projections
Most complex, requiring all the skills and resources needed to build a benchmark-divergence model, with the addition of basic physical science awareness to translate outputs into temperature scores
Transparent Difficult to interpret—no information about degree of alignment/misalignment
Some complexity in interpreting and communicating output— e.g., output is technical (divergence from a benchmark) and highly sensitive to scenario benchmark choice, construction method, and counterparty emissions projection approach
Output is easy to communicate relative to benchmark-divergence models, also provides a measure of consequences of misalignment, unlike other approaches. However, output can be difficult to interpret, as it is subject to an additional layer of assumptions and complexity
Science-based Scientific robustness dependent on target-setting protocol used
Benchmark-divergence models can use a range of approaches, some more scientifically robust than others. So a model’s robustness will depend on design choices
ITR tools can use a range of methods, some more scientifically robust than others. So a model’s robustness will depend on design choices
Table 1
Portfolio Alignment Tool Evaluation
Continued on next page
19

Portfolio Alignment Team | Measuring Portfolio Alignment
Broadly applicable
Binary target measurements can be applied to any asset type, but data restrictions exist (e.g., targets need to exist and be disclosed)
There are substantial restrictions on the data currently available for both benchmark generation and counterparty-emission baselining and projection
There are substantial restrictions on the data currently available for both benchmark generation and counterparty-emission baselining and projection
Aggregable Difficult to aggregate from counterparty level to portfolio level (e.g., no way to account for counterparties without targets)
The aggregability of results from a model depends on the methods it uses. The more detailed the benchmarks, the more difficult it becomes to aggregate scores to the portfolio level, as different counterparties are more likely to be evaluated using different units
By making temperature the common unit, results can be easily aggregated from counterparty level to portfolio level
Incentive optimal This approach bases its measurement entirely on forward-looking target data, and does not allow for evaluation or validation of progress based on or weighted by real-world emissions. Consequently, it risks misidentifying activities to which capital needs to flow
Simple benchmark-divergence models penalize portfolios that finance geographic regions or economic sectors that need to decarbonize more slowly than the world economy average. Adopting such a tool widely could limit the field of viable investment/lending strategies for actors that want to be Paris-aligned, and could increase the cost of capital for geographies or sectors that need to decarbonize more slowly than the global economy as a whole
Well-constructed, more complex models can address this issue (see Part B)
ITR models resolve the incentivization issues in binary-measurement and simple benchmark-divergence models. ITR models may, however, introduce other negative incentives, which should be addressed through careful design, just like complex benchmark-divergence models (see Part B)
Table 1 continued
20

Portfolio Alignment Team | Measuring Portfolio Alignment
This report is focused primarily on the use of emissions, and not units of production, as the primary marker of transition progress, and therefore the foundation of portfolio alignment tools, purely given that production-based benchmarks only exist for a small number of sectors, which inherently introduces limits to the usefulness of those approaches. This said, the Portfolio Alignment Team recognizes there can also be substantial benefits to using production-based approaches (see Judgement 3, p. 8), and that production-based alignment tools, therefore, have a role to play in portfolio alignment activities, particularly in data-poor environments.
As portfolio alignment tools continue to evolve and mature, it is inevitable that the use cases for different approaches will likewise continue to evolve. For this reason, it is the Portfolio Alignment Team’s suggestion that institutions use whichever portfolio alignment tool best suits their own individual context and capabilities.
Consideration 2: The Portfolio Alignment Team suggests institutions use whichever portfolio alignment tool best suits their institutional context and capabilities.
compare asset-level results or aggregate them up to a portfolio level. Theoretically, ITR tools, if constructed properly, will minimize externalities while also providing the full functionality needed in an ideal portfolio alignment tool—the creation of aggregable scores and the ability to measure consequences of misalignment. However, as demonstrated in The Alignment Cookbook,15 currently existing ITR tools are still developing and face challenges, which can compromise their decision-usefulness. As such, the benefits of the ITR approach may not be easily captured by financial institutions until these challenges are addressed and tool fidelity increases, and in the near term other approaches may prove preferable.
In addition to the broad performance characteristics of each portfolio alignment approach, there may also be specific end-user context or use cases that help inform a financial institution’s choice of tool. For example, some industry associations or organizations require the setting of climate targets and tracking of progress against said targets in emissions intensity and absolute emissions terms (e.g., the NZBA), and so using a benchmark-divergence tool for both internal management and external communications activities may make the most sense, given the tool operates in those same units, and there’s no need to extend those results into temperature scores.
On the other hand, financial institutions may choose to expand a benchmark-divergence tool into an ITR model in situations where it’s necessary to draw insights from the degree or alignment or misalignment of a portfolio; for example, institutions that need to quantify and report what their sector-level or institutional-level portfolio emissions performance means in terms of climate impact, or institutions that need to effectively compare and communicate the climate performance of different investing strategies.
15 Institut Louis Bachelier, et al., The Alignment Cookbook - A Technical Review of Methodologies Assessing a Portfolio’s Alignment with Low-carbon Trajectories or Temperature Goal, 2020.
21

Portfolio Alignment Team | Measuring Portfolio Alignment
must be done), the extent of institutional influence over the emissions of constituent assets (what can be done via engagement), the extent to which portfolio composition can be shifted (what can be done by capital allocation), and other institution-specific considerations (e.g., local policy environment).
In addition to informing the target-setting process, there are multiple other use cases for forward-looking portfolio alignment tools across a range of financial institutions:
• Asset owners and managers: Portfolio alignment tools can inform decisions about engagement (e.g., determine what expectations should be communicated to counterparties about how they behave in order to drive progress against targets) and portfolio allocation and optimization.
• Banks: Portfolio alignment tools can provide all the same functionality for lenders as for asset owners and managers while also contributing to the offering of equity- and debt-capital market services, and institutional-specific functions such as internal capital allocation and limit setting, budgeting and internal charging, and product structuring (e.g., linked lending, covenants).
• Insurance companies: Portfolio-alignment tools can provide the same functionality for insurance underwriters as for asset owners and managers, enabling them to align their underwriting decisions to a given climate goal.
• Central banks and supervisors: Central banks are responsible for managing large portfolios of assets relating to their monetary policy activity, management of reserves and other policy portfolios, as well as contingent holdings related to their role as “lender of last resort.” Furthermore, given that substantial numbers of financial institutions are considering adopting and applying portfolio alignment tools in the near future, central banks and supervisors will need to be familiar with the tools and understand the systemic effects their use could have. Countries that want to align their sovereign finance activities with a given climate goal could also apply these tools toward that endeavor.
Portfolio alignment tools have an important role to play in the target-setting process, in that they can provide input on what needs to be done in order to align a financial portfolio with the goals of the Paris Agreement in the intermediate term (e.g., on the way to net-zero), given its unique economic composition.
If portfolio alignment tools are not included as core inputs to the target-setting process, the tools lose their primary functionality, which is to track progress against portfolio-level targets and help inform the engagement and management decisions needed to achieve said targets. For example, if a portfolio target is set using a single global benchmark, a portfolio alignment tool built using sector-level benchmarks, or even a global benchmark from a different climate scenario, will not be able to help a manager align their portfolio to that target.
In addition to providing input into the setting of emissions targets (e.g., “We will reduce emissions by 30% by 2030”), portfolio alignment tools can also provide input into the setting of temperature-based targets (e.g., “We will reduce our forward-looking ITR score from 3°C to 2°C by 2030”). Temperature-based targets should be used to supplement emissions targets rather than replace them, as they are based on future projections and not achieved progress. Achieving a temperature-based target does not necessarily correspond to real-economy emissions reductions.
It is also important to note that portfolio alignment tools do not supplant, and in fact should complement, existing guidance on target setting, such as (but not limited to) the PAII Net-Zero Investment Framework, UNEP-FI Guidelines for Climate Target Setting for Banks, the NZOZA Investor Protocol, the CA100+ benchmark, and the SBTi Financial Sector Science-Based Targets Guidance.
In short, the purpose of portfolio alignment tools is to inform target setting and management decisions, given portfolio composition and beliefs about the future emissions performance of constituent counterparties. The purpose of target-setting approaches is to guide the setting of targets based on institutional context and capabilities (e.g., based on a unique portfolio benchmark (what the portfolio alignment tool says
3. How can portfolio-alignment methods be used in various user contexts, and how do they fit in with existing net-zero/Paris-alignment guidance?
22

Portfolio Alignment Team | Measuring Portfolio Alignment
16 TCFD, The Use of Scenario Analysis in Disclosure of Climate-Related Risks and Opportunities, June 2017.
Finally, it is important to note that portfolio alignment tools should not be used alone to quantify transition risk—quantifying transition risk is fundamentally an exploratory activity that is focused on investigating the extremes of what could plausibly occur, whereas portfolio alignment is a normative and deterministic activity that focuses on a specific pathway to achieving a given outcome. Institutions should develop specialized tools to supplement portfolio alignment scores when quantifying transition risks to their businesses, such as climate scenario analysis.16 Portfolio alignment tools will by design:
• only provide insight on a small proportion of the plausible scenario space and
• only provide information on one measurement of risk–e.g., scenario alignment–which ignores other, perhaps better, indicators of transition risk, including vulnerability, exposure to different policy levers, demand shifts, techno-economic pressures, and other contributors to license to operate.
Consideration 3: The Portfolio Alignment Team suggests that portfolio alignment tools be developed and used alongside existing approaches to setting emissions reduction targets, so that they may effectively support the management and engagement decisions needed to achieve those targets.
Consideration 4: The Portfolio Alignment Team suggests portfolio alignment tools be used alongside other purpose-built tools for quantifying transition risks.
23

Portfolio Alignment Team | Measuring Portfolio Alignment
Part B: What makes a good portfolio alignment tool?

Portfolio Alignment Team | Measuring Portfolio Alignment
All portfolio alignment methods involve three common conceptual steps: translating scenario-based carbon budgets into normative benchmarks, measuring counterparty emissions against these benchmarks, and aggregating counterparty-level scores into portfolio-level metrics.
• The first step, constructing a normative benchmark, involves selecting a forward-looking climate scenario that fits with a given climate goal, and extracting from it information on industry or region emissions that counterparty behavior can then be measured against.
• The second step, measuring counterparty transition progress, involves using a combination of forward-looking and historical data to project the likely emissions performance of a given counterparty over time, and then determining the extent to which that projection diverges from the normative benchmark.
• The third step, aggregating counterparty-level scores to a portfolio level, involves weighting counterparty scores according to their contribution to a given portfolio, and then aggregating those scores into a sub-portfolio (e.g., by sector) or overall portfolio score.
Moving through these three common conceptual steps, financial institutions must make a series of nine decisions that together define the design of the overall alignment tool. Differences in these key judgements are what differentiate the various portfolio alignment methods. While this paper does not identify the optimal choice for the nine judgements, it does provide considerations based on emerging best practice, which could serve as a starting point for the widespread adoption of more consistent, scientifically robust, and decision-useful approaches.
The three common conceptual steps and nine key judgements are summarized in Figure 1 and Table 2:
1. How do portfolio alignment tools work?
Figure 1
The Three Common Conceptual Steps to Portfolio Alignment
Step 1: Create a normative benchmark
Step 2: Measure counterparty performance
Step 3: Aggregate counterparty-level scores
Emis
sion
s
Year
Emis
sion
s
Year
25

Portfolio Alignment Team | Measuring Portfolio Alignment
required reductions on the y-axis of a graph over time on the x-axis. This pathway is associated with a single end-of-century warming outcome, for instance 1.5°C (Figure 1, p. 25). In some cases, multiple benchmarks may be plotted on a single set of axes in order to interpolate counterparty performance between multiple warming outcomes, instead of simply measuring divergence from one (see Judgement 8 for details).
A warming-function benchmark can be visualized as a set of points, each of which represents a single scenario, where the y-coordinate represents a temperature outcome, and the x-coordinate represents the value of a specific performance metric (emissions, for example) that is most closely correlated with that given outcome
Judgement 1: What type of benchmark should be built?
There are two ways to create a normative benchmark from a reference scenario. The first is to extract industry emissions or capacity pathways from a single scenario (referred to here as the “single-scenario benchmark”). The second is to construct a statistical function that describes the correlation between one or more emissions metrics and a given temperature outcome across multiple scenarios (referred to here as a “warming function”).
A single-scenario benchmark can be visualized as an emissions or production-capacity pathway that traces
2. What does the portfolio alignment team suggest regarding emerging best practice in designing portfolio alignment tools?
Table 2
Components of a Forward-Looking Portfolio Alignment Tool
Methodological Step Design Judgement
Step 1: Translating scenario-based carbon budgets into benchmarks
Judgement 1: What type of benchmark should be built?
Judgement 2: How should benchmark scenarios be selected?
Judgement 3: Should absolute emissions, production capacity, or emissions intensity units be used?
Step 2: Assessing counterparty-level alignment
Judgement 4: What scope of emissions should be included?
Judgement 5: How should emissions baselines be quantified?
Judgement 6: How should forward-looking emissions be estimated?
Judgement 7: How should alignment be measured?
Step 3: Assessing portfolio-level alignment
Judgement 8: How should alignment be expressed as a metric?
Judgement 9: How should counterparty-level scores be aggregated?
26

Portfolio Alignment Team | Measuring Portfolio Alignment
over a specified time period. A line of best fit is then drawn through the collection of scenarios, providing a description of the central tendency of the relationship between the emissions metric and different warming outcomes (Figures 2 and 3).
Most of the currently available portfolio alignment tools use single-scenario benchmarks, though a few providers are exploring the warming-function approach. Both approaches are technically viable and choosing either one over the other has both pros and cons.
Figure 2
A Single-Scenario Benchmark
Figure 3
A Warming-Function Benchmark
Benchmark
Scenarios
Acc
ount
ing
Uni
t (e
.g.,
emis
sion
s in
tens
ity)
Year
Benchmark
Counterparty
Misalignment
End-
of-C
entu
ry W
arm
ing
Out
com
e (°
C)
Accounting Unit (e.g., emissions intensity)
27

Portfolio Alignment Team | Measuring Portfolio Alignment
to engage at counterparty level, as it makes it more difficult to determine and communicate what a given counterparty must do to remain in alignment with a given score over time. Additionally:
• Scenarios are not random statistical samples, which potentially limits the use of some statistical models and data-dimension-reduction techniques (see Appendix 1 for details).
• Scenarios embed inconsistent assumptions and genetic dependencies into the approach, which can introduce new forms of selection bias that must be thoughtfully controlled for.
• Regression models may be susceptible to excessive linearization, which can lead to the models’ underestimating warming outcomes.
• Regression models calculate reduction rates over specific timeframes, which reflects an implicit assumption that timeframe changes are independent.
This is not to say that useful warming-function models cannot be built. A robustly constructed function should take into consideration at least some of the following techniques (see Appendix 1 for more details):
• Pre-model selection: This aims to avoid genetic and key assumption (e.g., CDR) inconsistency during model pre-selection.
• Segmentation: Time-segmenting models can eliminate linearization, but may introduce strong assumptions about timeframe independence.
• Nonlinear modeling: Nonlinear modeling functions can eliminate excessive linearization of time-series effects, but are more challenging to develop and maintain.
• Dynamic regression models: These eliminate the timeframe carryover.
• Data dimension reduction: This can make the regression modeling more efficient by using feature-extraction methods in the predictors, such as PCA regression.
The single-scenario-benchmark approach has the benefit of simplicity: It is easy to implement, easy to explain, and easy to understand. Furthermore, if all the benchmarks used by a portfolio alignment tool are drawn from a single scenario, the method is guaranteed to be internally consistent.
Additionally, the single-scenario-benchmark approach offers various “downstream benefits.” It preserves the analytical flexibility to use both intensity and absolute emissions across multiple steps in the process, and to aggregate emissions across counterparties in absolute terms in later stages of modeling. Finally, it is easier to incorporate Scope 3 emissions in a single-benchmark approach than in a warming function (see Judgements 4 and 9).
Using a single-scenario benchmark has a substantial drawback, however: It introduces the risk of selection bias through the choice of scenario, potentially anchoring portfolio-alignment approaches to a less conservative or robust benchmark. The simplest way to mitigate against this risk is for the portfolio-alignment community and governments, with the help of climate scientists and economists, to agree on a set of principles for conservative scenario selection (e.g., scenarios with a specific limit on carbon dioxide removal (CDR) assumptions, temperature overshoot assumptions—see Part C for more details).
The warming-function approach has the benefit of reducing (though not eliminating) selection bias by drawing on a wider range of scenarios to create a benchmark. It also allows users to tease out the independent effects of multiple variables on temperature score, instead of limiting the analysis to a single variable like “industry emissions intensity at time period X.”
However, this approach has substantial drawbacks. First, and most importantly, it is much more complex to implement, harder to explain and interpret, and more opaque in its assumptions and the sensitivity of final results to those assumptions. Second, unlike the single-scenario approach, building warming-function tools can require highly specialized technical knowledge (such as deep understanding of climate-scenario construction). The output of warming-function tools is also less useful for financial institutions who want
28
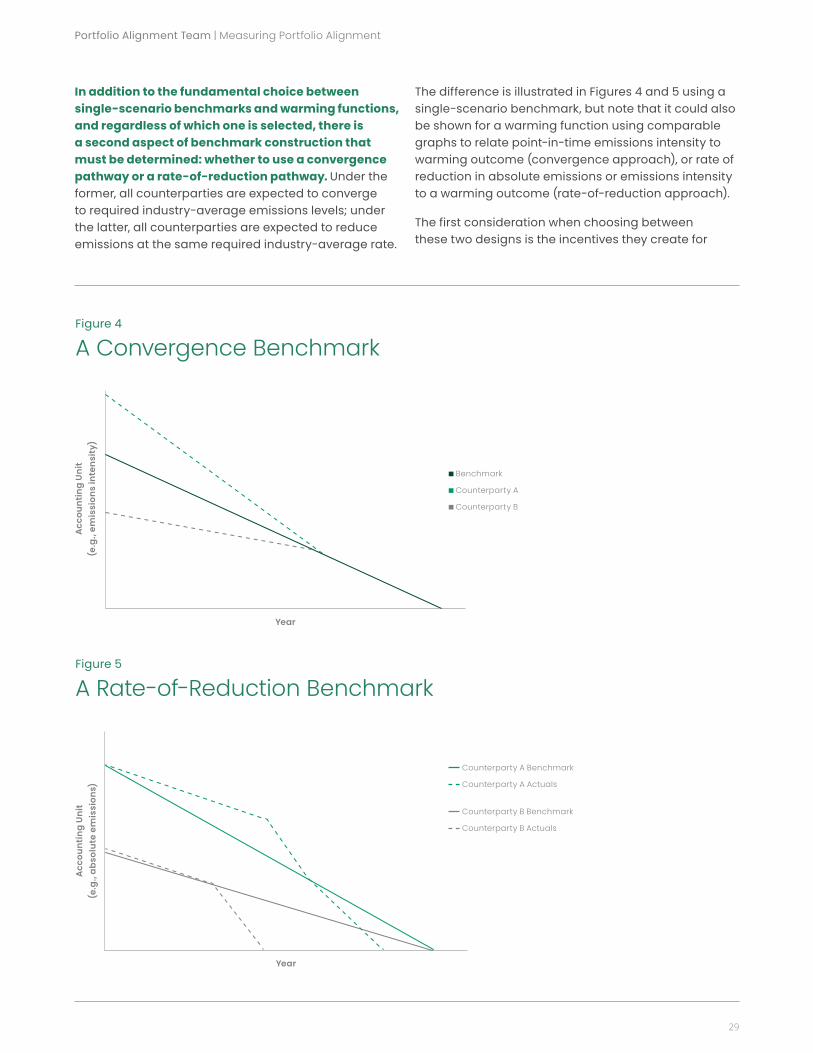
Portfolio Alignment Team | Measuring Portfolio Alignment
The difference is illustrated in Figures 4 and 5 using a single-scenario benchmark, but note that it could also be shown for a warming function using comparable graphs to relate point-in-time emissions intensity to warming outcome (convergence approach), or rate of reduction in absolute emissions or emissions intensity to a warming outcome (rate-of-reduction approach).
The first consideration when choosing between these two designs is the incentives they create for
In addition to the fundamental choice between single-scenario benchmarks and warming functions, and regardless of which one is selected, there is a second aspect of benchmark construction that must be determined: whether to use a convergence pathway or a rate-of-reduction pathway. Under the former, all counterparties are expected to converge to required industry-average emissions levels; under the latter, all counterparties are expected to reduce emissions at the same required industry-average rate.
Figure 4
A Convergence Benchmark
Figure 5
A Rate-of-Reduction Benchmark
Benchmark
Counterparty A
Counterparty B
Acc
ount
ing
Uni
t (e
.g.,
emis
sion
s in
tens
ity)
Year
Acc
ount
ing
Uni
t (e
.g.,
abso
lute
em
issi
ons)
Year
Counterparty A Benchmark
Counterparty A Actuals
Counterparty B Benchmark
Counterparty B Actuals
29

Portfolio Alignment Team | Measuring Portfolio Alignment
the counterparties being measured. Convergence approaches, for example, will penalize counterparties that are more carbon-intensive than their industry average, while reducing incentives for counterparties that are below average in their intensity to continue decarbonization. (That is, until the benchmark catches up to them.)
Rate-of-reduction approaches, on the other hand, introduce the expectation that all counterparties in a given industry reduce their emissions at the same rate. This means that counterparties that have already taken the most economically efficient decarbonization steps will be expected to achieve the same year-over-year reduction rates as less advanced firms that still have “low-hanging fruit” available to them. In other words, these approaches place a relatively heavier burden on high-performing counterparties (with regard to decarbonization), relative to poorly performing counterparties.
In light of these respective challenges, a third possible approach has emerged, which consists of combining the convergence and the rate-of-reduction approaches, and in doing so preserving the benefits and eliminating the challenges of both (see Figure 6). The fair-share carbon budget approach (further
outlined in Appendix 2) defines the average rate of reduction in emissions for an industry as a whole, but recognizes that individual counterparties will be better- or worse-performing than that average. Based on comparing the counterparty’s emissions intensity to its industry average, this approach creates a counterparty-specific rate-of-reduction benchmark for absolute emissions. This approach requires underperforming counterparties to reduce absolute emissions at a faster-than-average rate, while higher-performing counterparties can achieve alignment through a lower-than-average rate of reduction. To ensure companies are not penalized for inorganic growth, counterparty absolute emissions are adjusted for changes in market share when compared to the benchmark. The cost of this approach is the introduction of an additional layer of assumptions and complexity to a given portfolio alignment tool.
Selecting from these approaches also has important implications for choice of data (i.e., emissions intensity, absolute emissions, or production capacity, which are detailed in Judgement 3) and compatibility with forward-looking scenarios. For example, while in many cases using emissions intensity–based convergence pathways may be preferable, it may not be possible to extract an emissions intensity convergence pathway
Figure 6
A “Fair-Share Carbon Budget” Benchmark
Car
bon
Foo
tpri
nt
(201
5 in
dust
ry b
ench
mar
k=10
0)
Example: Counterparty X climate trajectory
Counterparty current trajectory This adjustment, which is similar to that of a convergence-based approach, ensures under-performing companies need to reduce faster-than-average to be aligned, while high-performing companies can be aligned with a lower rate of reduction.
Industry net-zero pathway This benchmark/pathway shows the rate of reduction that an average counterparty in the industry would need to achieve. It allows the model to track absolute emissions to ensure alignment with carbon budgets, while still acknowledging the relative under/overperformance of companies to date.Year
120
100
80
60
40
20
2015 2020 2025 2030 2035 2040 2045 2050
30

Portfolio Alignment Team | Measuring Portfolio Alignment
from available scenarios for sectors without commonly modeled homogenous units of production (e.g., barrels of oil or tons of steel).
Given the balance of these considerations, the Portfolio Alignment Team suggests that financial institutions follow one of two approaches. Either (a) the fair-share carbon budget approach should be applied for all sectors, trading a reduction in negative incentives for an increase in complexity, or (b) convergence-based pathways should be used for sectors where they may be constructed, and rate-of-reduction pathways for sectors where they may not, trading simplicity for negative incentives that differ across sectors.
Consideration 5: Both single-scenario benchmarks and warming-function approaches can be constructed such that they are technically viable, but the Portfolio Alignment Team suggests financial institutions use a single-scenario benchmark approach, as it is simpler to implement, easier to interpret, and more transparent with regard to assumptions and their effect on results.
Consideration 6: The Portfolio Alignment Team suggests financial institutions follow one of two single-scenario benchmark construction approaches. Institutions should follow either (a) the fair-share carbon budget approach for all sectors, or (b) convergence-based benchmarks for the sectors for which it is possible to extract such benchmarks from reference scenarios, and rate-of-reduction benchmarks for those sectors for which it is not.
Judgement 2: How should benchmark scenarios be selected?
Once a philosophical approach to building benchmarks has been decided upon, the next decision that financial institutions need to make is what reference scenario to use for building said benchmarks. Scenario choice is particularly important, as the selected scenario needs to match individual institutional climate ambition and beliefs about the future in order for portfolio alignment tools to provide useable input on the engagement and transition activities needed to achieve said ambition. That said, however, scenarios should also be chosen such that they are plausible, scientifically robust, and non-preferential to any given institution or portfolio.
In their 2019 paper Foundations of Science-Based Target Setting,17 SBTi lay out a set of principles that financial institutions can use to ensure that, in addition to matching their own ambition levels and beliefs about the future, the scenario they select for target setting and portfolio alignment activities are “plausible, responsible, objective, and consistent.” These include, for example, restricting scenario choice to “non-overshoot” scenarios, ruling out scenarios with a high level of dependance on negative emissions technology, and requiring an early peak emissions date. While not the definitive list of considerations to be made when selecting a scenario, the Portfolio Alignment Team suggests financial institutions consider following the SBTi principles as minimum acceptable criteria. Furthermore, the Portfolio Alignment Team recognizes that there are other industry organizations and associations with the remit to set standards regarding target setting and scenario choice (e.g., UNEP FI, the NZAOA, the NZAMI, the NZBA, among others)—the suggestion to comply with SBTi’s scenario-selection principles should be considered only insofar as it is complementary to other existing guidance or regulation that financial institutions are beholden to.
17 SBTi, Foundations of Science-Based Target Setting, 2019.
31

Portfolio Alignment Team | Measuring Portfolio Alignment
More granular benchmarks address this negative unintended consequence, but introduce several new problems, such as:
• They complicate the modeling process for scenario developers.
• They can introduce new equity concerns around scenario choice, particularly if the granularity increases in a geographic dimension.
• They shorten the time before scenarios need to be updated to remain accurate. More finely detailed scenarios present more ways for benchmarks to diverge from real-world outcomes—in other words, the more specific a scenario, the more opportunities there are for it to be wrong.
It is important to note here that, whatever their granularity, reference scenarios must be updated relatively frequently if they are to remain useful for portfolio alignment. As a simple example, under a 2°C scenario, there is a remaining carbon budget of around 1,000 GtCO2, which we are consuming at a rate of around 40 GtCO2 per year.18 So in five years’ time, if we have not reduced global emissions, we will have consumed about 20% of our remaining carbon budget. This would mean that if you create a forward-looking benchmark at the end of that five-year period using a scenario developed today, it will underestimate the actions necessary to restrict warming to 2°C by up to 20%.
Having selected a desired scenario, the next decision that needs to be made is at what level of detail benchmarks will be extracted from that scenario. Benchmarks can vary in granularity across both geography and economic sector, which has important implications for the incentives they create for the counterparties measured against them.
High-level benchmarks, drawn in broad strokes (e.g., across large industry groups or wide geographies), have many advantages:
• Scenarios are relatively similar at the macro level, and so the real-world differences that will result from each portfolio manager using a different reference scenario are minimized.
• The given reference scenario or scenarios will diverge more slowly from real-world outcomes, prolonging the time before they must be updated to remain accurate, as the more specific your scenario, the more ways it can diverge from the real world over time.
The problem with high-level benchmarks is that they penalize sub-sectors and countries that must decarbonize more slowly than the global/regional/industry average, even in a successful 1.5°C scenario, either because of geopolitical factors or technological feasibility. In this case, these countries or sub-sectors will be awarded unfairly high warming scores, increasing their cost of capital and driving capital flows away from them and toward advanced economies and sectors that can reduce emissions faster than the respective average. This is a critical flaw, as the sectors and regions that are today most constrained in their ability to rapidly decarbonize are those that have the greatest need for capital investment to achieve their climate goals.
18 Rogelj, Forster, Kriegler, et al., “Estimating and tracking the remaining carbon budget for stringent climate targets,” 2019.
32

Portfolio Alignment Team | Measuring Portfolio Alignment
19 SBTi, Foundations of Science-Based Target Setting, 2019.
Consideration 7: The Portfolio Alignment Team suggests that financial institutions select a 1.5°C scenario that complies, at a minimum, with the scenario selection criteria set out by the Science Based Targets initiative (SBTi) in their document Foundations of Science-Based Target Setting.19 If an institution’s stated ambition is a warming target larger than 1.5°C, the SBTi criteria should still be applied to scenario choice. Additionally, the Portfolio Alignment Team recognizes that there may be additional or complimentary scenario selection criteria developed by industry organizations or associations, (e.g., UN Environment Programme Finance Initiative (UNEP FI), the Net-Zero Asset Owner Alliance (NZAOA), the Net Zero Asset Managers Initiative (NZAMI), and the Net-Zero Banking Alliance (NZBA)), which this consideration should not supersede.
Consideration 8: The Portfolio Alignment Team suggests financial institutions prioritize granular benchmarks where they meaningfully capture material differences in decarbonization feasibility across industries or regions. This will allow tools to increase the complexity with which they can accommodate necessarily differentiated rates of decarbonization into emissions benchmarks.
Consideration 9: The Portfolio Alignment Team suggests reference scenarios used for portfolio alignment activities be regularly updated to help minimize the risk that the benchmarks substantially underestimate the counterparty-level actions needed to achieve a given warming outcome.
Judgement 3: Should absolute emissions, production capacity, or emissions intensity units be used?
Once decided on an overall approach to constructing a normative benchmark and its level of granularity, the next decision is the units in which to measure emissions. This is an important choice as different units will motivate different types of transition activities and come with individual data-availability challenges and implications for subsequent design decisions.
There are three options for choice of units: absolute emissions (usually measured in units of weight (e.g., tons of CO2), production or production capacity (e.g., barrels of oil produced, number of vehicles sold, or watts of electricity generated), or emissions intensity (units of absolute emissions per unit of output, defined either as units of production or economic units (e.g., revenue).
This choice of units occurs at two points in the process of portfolio alignment:
• The first is when defining the benchmark: What units is it expressed in? For example, counterparty emissions measured in units of emissions intensity can be assessed against a convergence benchmark that prescribes industry-average emissions intensity.
• The second is the choice of units used to translate a counterparty’s alignment with the benchmark into an alignment metric. Alignment metrics can be derived in terms of either emissions intensity, units of production, or absolute emissions. The choice will, in turn, dictate whether these same units are used in aggregating counterparty-level warming scores to the portfolio level. This will be addressed further in Judgements 8 and 9.
Of the two, the first choice matters most, as the units used to measure alignment against a benchmark will have direct implications for the incentives communicated to counterparties. The second choice is more of an inward-facing accounting concern, with limited implications for counterparties (it does not, for example, affect what a given counterparty needs to do to align to its benchmark, whereas the units used for that benchmark do).
33

Portfolio Alignment Team | Measuring Portfolio Alignment
will be double what was prescribed by the reference scenario. It is important to note that emissions intensity can be expressed as either physical or economic intensity. Using physical intensity metrics has many benefits, including a stronger link to counterparty production decisions and less exposure to volatile economic indicators. Asset managers may therefore find them helpful for engaging counterparties on the specific drivers of emissions. However, in some sectors or activities it is not possible to define a consistent, homogeneous production unit. Economic intensity can be used more broadly, bearing in mind that it introduces substantial volatility and may be difficult to extract from forward-looking scenarios during benchmark construction.
If a financial institution is pursuing a fair-share carbon budget approach, laid out in Judgement 1, it must necessarily employ both absolute emissions and physical and economic emissions-intensity units in the construction of its hybrid benchmark. As previously discussed, doing so helps combine the benefits, and compensate for the shortcomings, of all involved approaches. If a financial institution is pursuing a simpler combination of convergence and rate-of-reduction benchmarks based on sector-by-sector benchmark availability, a choice will need to be made between the use of absolute emissions and the various forms of emissions intensity. In general, physical intensity units are the optimal choice for converge-based benchmarks, as they avoid the volatility associated with economic intensity units and the need to perform market share corrections for growing or shrinking companies measured in absolute terms. Absolute emissions, on the other hand, are the optimal choice for rate-of-reduction benchmarks, as in general these benchmarks will be relied upon for sectors where intensity benchmarks cannot be easily constructed.
Now consider a methodology that constructs a warming function as in Judgement 1. Warming functions are practically limited to the use of emissions intensity for their benchmark construction. Using absolute emissions or production capacity would require us to extend benchmark normalization methods down to counterparty-level emissions across all the scenarios
There are pros and cons to each of the three possible choices, and no type of unit is universally appropriate:
Absolute emissions measurements preserve a direct link to the carbon budget, meaning they are unlikely to over- or underestimate warming impact due to the presence of intermediate variables, and therefore provide the most direct measurement of climate impact. However, measuring counterparty performance in absolute terms can disincentivize important transition activities, such as inorganic growth or expansion into net-zero technology separate from decarbonization activities, unless the portfolio alignment method in question includes specific adjustment mechanisms to compensate for these phenomena.
Production capacity methods can often produce higher fidelity data than other estimation methods when self-reported data is not available. Additionally, production capacity approaches can help strengthen the link between measured transition progress and the business decisions that drive emissions changes in the real economy. However, these approaches face a similar challenge to those based on absolute emissions: penalizing specific transition activities including inorganic growth. Furthermore, using production capacity can obscure significant variation in the efficiency of different firms’ production processes—two auto manufacturers, for example, may produce similar volumes of cars but have very different emissions profiles. Finally, and most importantly, capacity is only applicable to a subset of sectors for which the unit of production can be clearly defined, which poses inherent limits to the usefulness of these approaches.
Emissions-intensity benchmarks do not disincentivize key transition activities in the same way as absolute or production-based units, however they can over- or underestimate warming if the projections of sector GDP or physical output used as a denominator are not kept up-to-date. For example, if an entire industry matches its emissions-intensity benchmark, but the benchmark scenario assumes only half of the output actually being produced (say an electricity-generation benchmark assumes 50GW of electricity output, but the sector actually generates 100GW), then the industry’s total emissions
34

Portfolio Alignment Team | Measuring Portfolio Alignment
included in the benchmark, which would add unwieldy layers of assumptions, complexity, and workload. Thus, across both approaches to constructing normative benchmarks, the Portfolio Alignment Team suggests the use of emissions intensity (Figure 7).
Fossil fuel counterparties such as oil and gas firms and coal producers require additional consideration if financial institutions are following an intensity-based convergence approach, because standard emissions metrics will not properly reflect the way these firms decarbonize. First, one of the main ways
Figure 7
Absolute Emissions, Production, or Emission Intensity Units? (1/2)
Recommended for homogeneous sectors, viable for all sectorsA counterparty’s fair-share carbon budget can be derived for all companies, ideally using production levels for homogenous sectors (vs. economic levels for other sectors)
Recommended for homogeneous sectorsA counterparty’s intensity can be benchmarked against sector’s intensity trajectory
Possible but will lack precision. Counterparty is indexed between intensity band (i.e., “2°C band,” “3°C band”)
Viable for all sectorsIf a counterparty-specific benchmark can be established, but will penalize companies that are growing
Recommended. Convert exceedance of intensity benchmark into absolute to derive precise score (need more space to exp)
2020 2025 2030 2035 2040 2045 2050
16
14
12
10
8
6
4
2
Tonn
es
Single Benchmark
2020 2025 2030 2035 2040 2045 2050
16
14
12
10
8
6
4
2
Fair share market approach Intensity
Intensity
Absolute
Absolute
Type
of b
ench
mar
kBe
nchm
ark
unit
sTr
ansl
atio
n to
war
min
g sc
ore
2020 2025 2030 2035 2040 2045 2050
16
14
12
10
8
6
4
2
Tonn
es
2020 2025 2030 2035 2040 2045 2050
16
14
12
10
8
6
4
2
Tonn
es/$
2020 2025 2030 2035 2040 2045 2050
16
14
12
10
8
6
4
2
Tonn
es/$
2020 2025 2030 2035 2040 2045 2050
16
14
12
10
8
6
4
2
Tonn
es
35

Portfolio Alignment Team | Measuring Portfolio Alignment
There are two possible solutions to this:
• One is to measure the alignment of fossil fuel counterparties using two separate benchmarks, the first assessing their fossil fuel activity in terms of absolute emissions, and the second measuring their power generation or other sector activity in terms of emissions intensity. The total counterparty score would then be an aggregation between the two scores, following guidance in Judgement 9. For further guidance on how to deal with other examples of diversified counterparties, see Judgement 9.
these sectors will decarbonize is by reducing output of hard-to-decarbonize products. If progress is measured solely in terms of emissions intensity, these counterparties will not receive credit for doing this. Emissions-intensity metrics will only credit them for decarbonizing their production processes or switching to non-combustion customers. At the same time, neither absolute emissions nor a production-based measure of emissions intensity will incentivize fossil fuel majors to diversify into greener lines of business such as renewables production, which is the second and perhaps more important way the industry will decarbonize.
Figure 8
Absolute Emissions, Production, or Emission Intensity Units? (2/2)
RecommendedA firm’s intensity can be benchmarked against sector’s intensity path to identify score
Penalizes entities that have made progress and distorts companies with inorganic growth
Type
of b
ench
mar
kBe
nchm
ark
unit
sTr
ansl
atio
n to
war
min
g sc
ore
Warming Function
36
-9 -8 -7 -6 -5 -4 -3 -2 -1 0
6
5
4
3
2
1
Intensity Absolute/Production
Tonn
es/$
% C
hang
e
No translation required
-9 -8 -7 -6 -5 -4 -3 -2 -1 0
6
5
4
3
2
1
-9 -8 -7 -6 -5 -4 -3 -2 -1 0
6
5
4
3
2
1

Portfolio Alignment Team | Measuring Portfolio Alignment
• Alternatively, fossil fuel counterparties can be assessed against a broader intensity benchmark created using all power and energy counterparties (including oil, gas, coal, biofuels, hydrogen, solar, and wind)—for which production can be measured in units of energy. This would provide fossil fuel counterparties and other energy firms with an incentive to transition their businesses, while also rewarding efforts to decarbonize and reduce reliance on fossil fuels. This approach also accommodates businesses that are already partially diversified. It is important to note that this does not mean utility counterparties that do not have a fossil-fuel business should also be measured against a benchmark that includes fossil fuel emissions—utilities should continue to be measured against their own benchmark.
Consideration 10: Methodologies can use absolute emissions, production capacity, or intensity-based approaches and remain scientifically robust, but the Portfolio Alignment Team suggests adhering to the following guidelines:
If financial institutions follow a fair-share carbon budget approach, they will necessarily need to use absolute emissions in combination with both physical and economic intensity.
If financial institutions choose to employ both convergence and rate-of-reduction benchmarks on a sector-by-sector availability basis, the Portfolio Alignment Team suggests they prioritize the use of physical emissions intensity for their convergence benchmarks, as convergence benchmarks cannot easily be constructed in absolute or production capacity terms (e.g., this requires complex estimation approaches to normalize benchmarks to counterparty level). Using either absolute or production units will disincentivize inorganic growth, which may be necessary for an efficient net-zero transition. Where physical emissions intensity is not available, financial institutions should revert to absolute-based rate-of-reduction benchmarks, to optimize scientific robustness and minimize the volatility inherent in economic intensity measurements.
If methodologies use a warming-function benchmark, the Portfolio Alignment Team also suggests they do so using physical emissions intensity where possible, for the same reasons.
The exception to these later two considerations comes when measuring the alignment of counterparties in the fossil fuel sectors. Standard emissions metrics do not appropriately reward the two key decarbonization strategies for these sectors—reducing output of hard-to-decarbonize products and diversifying into other sectors. There are two solutions to this problem: First, apply two separate benchmarks to generate a counterparty score, one assessing fossil fuel emissions against an absolute rate-of-reduction benchmark, and the second assessing power-sector performance against an emissions-intensity convergence benchmark; or second, use a combined energy sector convergence benchmark measuring emissions intensity in units of energy or power (e.g., joules or watts), allowing for reduction in intensity through differentiation into renewables.
While the focus of this report is on emissions-based portfolio alignment approaches, the Portfolio Alignment Team recognizes that there are important use cases for production-based approaches when considering the sectors for which that is a valid measurement option.
Finally, it is important to note that these suggestions are not intended to contradict or supersede other climate reporting guidelines, including those in the TCFD guidance on Metrics, Targets, and Transition Plans—financial institutions can and should consider following the above suggestions when constructing portfolio alignment tools, and at the same time complying with additional reporting and disclosure requirements as appropriate.
37

Portfolio Alignment Team | Measuring Portfolio Alignment
Evaluating Scope 3 emissions for a counterparty is important to accelerating the transition of a whole economy, as counterparties bear partial responsibility for creating emissions upstream or downstream of their own operations. Assessing warming potential based only on Scope 1 and 2 emissions systematically underestimates many firms’ contribution to overall warming and does not sufficiently incentivize either the firms or their investors toward net-zero.
There remain numerous technical challenges in integrating Scope 3 emissions. First and foremost, there is limited data and only nascent resources available to incorporate Scope 3 emissions in portfolio alignment methods. As of March 2020, MSCI estimates that only 18% or so of counterparties in its MSCI ACWI IMI reported Scope 3 emissions.22 Counterparties are also highly inconsistent in which of the 15 categories of Scope 3 emissions they report against, often because of challenges in primary data acquisition (see Part C for more details).
Furthermore, comprehensive sector benchmarks reflecting Scope 3 have yet to be established for many sectors. To avoid overestimating portfolio warming, further work is also required to construct standard benchmark scenarios that incorporate Scope 3, which require complex modeling of economic flows.
Over time, the availability and transparency associated with Scope 3 methods will improve. The EU guidance on Climate Transition Benchmarks and EU Paris-Aligned Benchmarks lays out a timeline against which firms are required to report Scope 3, starting with energy and mining firms in 2020 and transportation, construction, buildings, and industrial firms two years later.23
20 GHG Protocol, Required Greenhouse Gases in Inventories: Accounting and Reporting Standard Amendment, February 2013.21 Goldman Sachs Global Investment Research. Also see Portfolio Alignment Team, Measuring Portfolio Alignment, November 2020. 22 MSCI, “Scope 3 Carbon Emissions: Seeing the Full Picture,” September 17, 2020. 23 European Commission, Directorate-General for Financial Stability, Financial Services and Capital Markets Union, “EU Climate
Transition Benchmarks and EU Paris-aligned Benchmarks,” July 17, 2020.
Judgement 4: What scope of emissions should be included?
The emissions associated with a counterparty can be generated directly by their owned or controlled assets (Scope 1), from the generation of their purchased energy (Scope 2), and from elsewhere in their upstream and downstream activities (Scope 3).20 Estimating counterparty-level portfolio alignment requires taking a position on what scope of emissions a given counterparty is responsible for. The choice of whether to include Scope 3 (and if so, under which conditions and adjustments) has significant implications for portfolio alignment estimates.
Assessing Scope 3 emissions is important because achieving net-zero emissions will require transforming the behavior of both producers and consumers of high-emissions products, as well as all parties they engage across their value chains.
The current convention of reporting and assessing degree warming based on just Scopes 1 and 2 creates perverse incentives, often penalizing only one party among multiple contributors to emissions-intensive goods and services. For instance, if only Scopes 1 and 2 are examined, counterparties that consume fossil fuels are penalized, but the counterparties that produce those fuels are not. In fact, for counterparties in sectors such as fossil fuels, mining, and auto production, over 80% of their emissions come from the use of their products and therefore count as Scope 3.21
Additionally, many carbon-intensive Scope 3 products are consumed directly by consumer households, meaning that failing to include Scope 3 emissions results in emissions leakage from portfolio alignment frameworks (emissions exist for whom no one is assigned responsibility).
38

Portfolio Alignment Team | Measuring Portfolio Alignment
However, given that benchmarks are constructed using forward-looking scenarios, the magnitude of double counting in benchmarks and in counterparty emissions data will never be the same. This poses a problem, as different degrees of double counting will affect not just the absolute magnitude of emissions, but also the proportional relationship between emissions and benchmark.
As such, portfolio alignment methods should investigate the magnitude of double counting and, if that magnitude is material, pursue ways to reduce double counting and so derive more accurate alignment measurements. For more details on why double counting may cause issues in portfolio alignment method design, see Judgement 9.
Consideration 11: The Portfolio Alignment Team suggests financial institutions include Scope 3 emissions for the sectors for which they are most material and for which benchmarks can be easily extracted from existing scenarios (fossil fuels, mining, automotive). This deliberately differs from the PCAF/EU TEG Financed Emissions schedule, as the scenario benchmarks and counterparty data needed to accommodate the inclusion of Scope 3 emissions outside these boundaries do not yet exist.
Consideration 12: As better Scope 3 data and scenario benchmarks become available, the Portfolio Alignment Team suggests financial institutions consider expanding Scope 3 coverage to additional sectors as appropriate. As this process progresses, the Portfolio Alignment Team suggests financial institutions investigate the materiality of double counting that results and, if appropriate, develop methods to remove that double counting.
Given the constraints on where Scope 3 can be practically included today, it is important to prioritize those sectors for which Scope 3 is most material.
Including Scope 3 for all counterparties and sectors would be ideal, but availability of data and of sector-specific benchmarks makes this impractical in the near term. Instead, Scope 3 should be included for the sectors with the greatest exposure, including auto manufacturers, fossil fuels, and mining. Focusing on these specific sectors to start with will begin the process of developing further sector benchmarks and emissions estimates in a targeted manner.
Alternatively, methodology providers may opt to include Scope 3 for counterparties for which Scope 3 is material; CDP-WWF, for instance, includes Scope 3 for counterparties for which Scope 3 exceeds 40% of the total carbon footprint. The disadvantage of this approach is that counterparties within a given sector will be included in a piecemeal manner, requiring the creation of benchmarks that include and exclude Scope 3 for the same industry, and potentially skewing the comparability of alignment results for counterparties that are just over and just under that threshold.
Including Scope 3 emissions in portfolio alignment models introduces concerns about double counting emissions. Double counting can arise at a counterparty level when there is misalignment on boundaries of responsibility between a counterparty emissions baseline and the benchmark against which it is being measured. It can also arise when attempting to aggregate counterparty-level scores to a portfolio level across two counterparties with overlapping scopes.
Theoretically, so long as Scope 3 emissions are included in both the benchmark against which a firm is assessed, and in a firm’s own emissions data, then these will “cancel out” and double counting will not affect portfolio alignment scores at the counterparty or portfolio level (in other words, what is important to alignment is the proportional relationship between emissions and benchmark, not the absolute magnitude).
39

Portfolio Alignment Team | Measuring Portfolio Alignment
Judgement 5: How should emissions baselines be quantified?
To calculate a portfolio alignment metric, financial institutions need to be able to quantify the present-day emissions of the counterparties included in their investment or lending portfolios. This measurement will be referred to as an “emissions baseline.”
There is a growing consensus on what emissions data, and on which gases, should be included in this emissions baseline, what sources should be used to provide that data, how sources should be prioritized, and what approach should be taken to fill gaps in the data.
On the issue of different types of greenhouse gases, there are seven gases mandated under the Kyoto Protocol as causing climate change and included in national inventories under the United Nations Framework Convention on Climate Change (UNFCCC): carbon dioxide (CO2), methane (CH4), nitrous oxide (N2O), hydrofluorocarbons (HFCs), perfluorocarbons (PFCs), sulphur hexafluoride (SF), and nitrogen trifluoride (NF3).24 In an ideal world, portfolio alignment tools should cover them all. This also aligns with the standard issued by the Partnership for Carbon Accounting Financials (PCAF).25
The standard approach to reporting emissions across gases is to convert them into a common unit of tonnes-of-CO2-equivalent, using the GWP framework laid out by the GHG Protocol. It is important here to note that the GWP framework treats all gases as long-lived pollutants (i.e., gases that persist in the atmosphere for many hundreds of years, like CO2). The approach therefore overestimates the long-term warming impact of short-lived gases like methane, which, unlike long-lived pollutants, do not accumulate in the atmosphere unless the rate of emissions is stable or growing.26 (In other words, if methane emissions are declining year over year, atmospheric concentrations are also declining, whereas if CO2 emissions are declining, atmospheric concentrations will continue to rise.)
Therefore, the use of benchmarks that combine all gases into “CO2-equivalent” metrics do not accurately reflect the climate impact of a sector’s total gas emissions, in particular for methane-heavy sectors. For warming estimates to be more scientifically accurate, scenario benchmarks would need to be developed to allow such sectors to measure their methane emissions separately. However, in the intermediate term, while the tools needed to do so do not yet exist, the Portfolio Alignment Team suggests it is preferable that methane emissions continue to be mixed with other gases as is standard practice today.
As to whether portfolio alignment methods should use self-reported emissions data or external estimates, the Portfolio Alignment Team suggests following the guidance of PCAF. The PCAF Standard27 provides a general data-quality scoring table on a 1–5 scale (from least to most certain) and suggests using the highest-quality data available.
PCAF does not promote any particular source or vendor, but suggests that financial institutions report the weighted data-quality score of the emissions data they use, providing separate scores for Scope 3 emissions and for Scopes 1 and 2 emissions. PCAF also provides considerations for navigating potential data-quality gaps for all asset classes (e.g., for reporting in 2020, a financial organization may use 2019 financial data alongside 2018, or whatever is the most recent available, emissions data).28
PCAF also states that financial institutions should report carbon removal and may report avoided emissions, but in both cases should do so separately from Scopes 1, 2, and 3 emissions.29 Avoided emissions should not be included as contributions toward net-zero or other emissions reduction commitments.
24 GHG Protocol, Required Greenhouse Gases in Inventories: Accounting and Reporting Standard Amendment, February 2013. 25 PCAF, The Global GHG Accounting and Reporting Standard for the Financial Industry, November 18, 2020. 26 Allen, Shine, Fuglestvedt, et al., “A solution to the misrepresentations of CO2-equivalent emissions of short-lived climate pollutants
under ambitious mitigation,” June 4, 2018.27 PCAF, The Global GHG Accounting and Reporting Standard for the Financial Industry, November 18, 2020, p. 40. 28 Ibid.29 Ibid., “Avoided emissions and emissions removals,” p. 101.
40

Portfolio Alignment Team | Measuring Portfolio Alignment
Across asset classes, the Portfolio Alignment Team agrees with PCAF’s suggestion to prioritize reported emissions over estimated emissions data and within estimated emissions data to prioritize those based on activity levels as close as possible to the emissions drivers (typically those based on physical rather than economic intensity). The reason for this is that determining accurate emissions numbers requires being as close to their source as possible, so that you can take account of individual factors such as location, efficiency, and yield that would otherwise get lost in industry-average estimates. Counterparties are themselves best placed to measure and provide this data. Hence, self-reported emissions data is generally more desirable than external estimates.
Equally, when evaluating how robust an external estimate is, the closer to GHG-producing assets the analysis was conducted, the fewer generalizations and sector averages it needed to employ. This is why physical data related to climate performance—how much energy a counterparty consumes or how many units of production it manufactures—is more meaningful than that derived from financial factors. The latter introduces greater margins of error through differences in economic factors unrelated to GHG emissions, from product pricing and revenue to a counterparty’s capital structure and depreciation policy.
When emissions are estimated based on physical activity, energy consumption is a more robust basis than units of production, as it is a verifiable number from which GHGs can be easily modeled, especially if it includes a breakdown by energy source or power providers. Emissions based on units of production rely on sector averages, which ignore the counterparty-specific energy mix and efficiency. And units of capacity of production introduce the possibility of yet further margins of error with the use of average-utilization factors.
Data-source quality is specific to each asset class and PCAF currently ranks emissions data sources according to its scoring system for six asset classes (listed equity and corporate bonds,30 business loans and unlisted equity,31 project finance,32 commercial real estate,33 mortgages,34 and motor vehicle loans35). It may in due course extend its guidance to further asset classes, such as private equity that refers to investment funds, green bonds, sovereign bonds, loans for securitization, exchange traded funds, derivatives, and capital markets underwriting.36
For counterparty financing (e.g., for listed equity and corporate bonds, business loans and unlisted equity, project finance), PCAF ranks emissions data sources as follows: reported emissions (verified, unverified), estimated emissions based on physical activity (energy consumption, production), and estimated emissions based on economic activity (revenue, asset, asset turnover ratio).
For asset classes for which more emissions may need to be estimated (e.g., in the context of commercial or residential real estate financing and motor vehicle loans), PCAF provides a detailed ranking of activity-level data sources that may be used, prioritizing those closest to the emissive assets themselves.
Overall, the Portfolio Alignment Team agrees with the logic of having a ranking of emissions data sources, which incentivizes counterparty disclosures and ensures that data gaps and quality concerns do not block the development of portfolio alignment methodologies.
30 Ibid., “General description of the data quality score table for listed equity and corporate bonds,” p. 54.31 Ibid., “General description of the data quality score table for business loans and unlisted equity,” p. 65.32 Ibid., “General description of the data quality score table for project finance,” p. 73.33 Ibid., “General description of the data quality score table for CRE,” p. 81.34 Ibid., “General description of the data quality score table for mortgages,” p. 87.35 Ibid., “General description of the data quality score table for motor vehicle loans,” p. 94.36 Ibid., “How to choose the right asset class method?” p. 44.
41

Portfolio Alignment Team | Measuring Portfolio Alignment
• The unreliability of directly reported Scope 3 emissions when prioritizing them over estimated emissions data. For Scope 3, a lack of normalization across counterparties causes difficulties in identifying which specific emissions categories are included in disclosures. For example, a fossil fuel counterparty may only report its Scope 3 emissions from business travel, and other categories such as the use of sales proceeds may need to be estimated. As a result, financial institutions and data providers have found it much more reliable to estimate Scope 3 use of proceeds emissions directly through product sales (e.g., cars, barrels of oil equivalents) than by using reported information. For sectors in which they must rely heavily on estimated emissions, financial institutions are encouraged to be transparent about the way they recalculate emissions and coordinate with each other to make numbers comparable.
• The question of how to define organizational boundaries when calculating counterparty emissions data. For example, should the financial organization consider emissions based on equity boundaries, based on operational control boundaries, or based on financial control boundaries? Further investigation is needed in this area.
For certain segments, when counterparties do not report emissions, applying the PCAF Standard to estimate emissions may not be straightforward. In specific sectors for which no clear comparable physical or economic intensity factors can be found, counterparties may be benchmarked against peers chosen as being particularly comparable.
For guidance on topics not yet covered by the PCAF Standard, financial institutions should refer to the GHG Protocol. The PCAF Standard, which is a portfolio-footprinting methodology, has been built on top of the GHG Protocol,37 which is a corporate-footprinting methodology, to clarify its reporting framework for financial institutions and answer the question of attribution. The PCAF Standard has been reviewed by the GHG Protocol and conforms with the requirements set forth in the Corporate Value Chain (Scope 3) Accounting and Reporting Standard for Category 15 investment activities. PCAF does not supplant the GHG Protocol in any way. For example, for corporate footprinting, particularly when seeking to re-estimate counterparty emissions (e.g., for Scope 3, Category 11 “use of sold products”), the GHG Protocol remains the relevant standard.
To close gaps that are not answered by the PCAF Standard or the GHG Protocol, financial institutions should work with existing standards bodies, including the GHG Protocol and PCAF, to extend coverage. The Portfolio Alignment Team recognizes that in the interim those gaps are likely to be barriers to portfolio alignment application, so this should be seen as a priority in the development of approaches. Meanwhile, financial institutions should be encouraged to be transparent about the share of their financing not covered in their portfolio alignment metric due to limitations in their methodology.
Some examples of the gaps that may arise in coverage, for which more guidance is needed, include:
• How to address asset classes mentioned but not yet covered by the PCAF Standard (e.g., sovereigns), or not mentioned by PCAF (e.g., deposits and credit cards).
37 GHG Protocol, A Corporate Accounting and Reporting Standard, March 2004.
42

Portfolio Alignment Team | Measuring Portfolio Alignment
of reported emissions may require analysts to look elsewhere for information about the activity driving those emissions, and again, this can create additional data gaps.
One further option for filling data gaps is to use client questionnaires. This, however, introduces new quality and response rate issues, and is not encouraged, as data collection should be orchestrated as much as possible with the industry to avoid counterparties answering multiple questionnaires with different formats.
Consideration 13: The Portfolio Alignment Team suggests portfolio tools cover all seven GHGs mandated by the Kyoto Protocol. In the immediate term, gases may be aggregated using the GWP framework detailed by the GHG Protocol.
Consideration 14: In the medium term, the Portfolio Alignment Team suggests scenario developers work to build out individual benchmarks for methane in the sectors for which it forms a substantial proportion of GHG output (agriculture, fossil fuels, mining, waste management). This will allow financial institutions to measure methane separately from the other gases and avoid overstating its long-term warming impact in the way that the GWP framework does.
To follow PCAF’s suggestion38 to disclose weighted quality scores for the data they use, financial institutions will need data providers to be transparent about how datasets are created, considering that vendors themselves may use a combination of data reported and estimated in multiple ways. Also, in sectors for which emissions data are poorly reported and estimation is widely used, the Portfolio Alignment Team suggests that financial institutions and vendors disclose the hypotheses and approaches behind their estimations so that datasets can be meaningfully compared.
PCAF currently prioritizes estimation methods based on physical intensity over those based on economic intensity. But there is a range of emerging estimation methods that incorporate both types of intensity into advanced analytics models, and these may sometimes be preferable. For example, several vendors have developed next generation statistical methods such as multivariate regressions or gradient-boosted trees (GBTs) to estimate emissions, taking into account financial and non-financial data. Other programs are pursuing third-party verification and estimation using remote sensing. In particular, Bloomberg has shown that its GBT method can outperform in prediction over using financial or ESG-only “scaling” methods evaluated by PCAF. Data-quality standards may need to be updated to account for improved performance of new estimation methods.
A data limitation not addressed by PCAF is that reported emissions may not always be granular enough, as counterparties often report at the group level and without any regional breakdown. This can make them unsuitable for comparing diversified counterparties with various sectoral benchmarks. An approach taken by some financial institutions is to break down reported emissions using sector-average emissions intensities and to allocate shares of the group’s absolute emissions to each segment.
Another aspect of estimated emissions is that they may easily be linked with the activities that drive them (e.g., number of products sold), which creates more options for extrapolating future emissions, and allows more precise discussions with counterparties. Use
38 PCAF, The Global GHG Accounting and Reporting Standard for the Financial Industry, November 18, 2020, p. 103.
43

Portfolio Alignment Team | Measuring Portfolio Alignment
39 Listed equity and corporate bonds, business loans and unlisted equity, project finance, commercial real estate, mortgages, and motor vehicle loans.
Judgement 6: How should forward-looking emissions be estimated?
Projections are central to portfolio alignment activities because climate change is a function of cumulative emissions behavior, and it is very unlikely that counterparty emissions today will appropriately represent their future emissions trajectory. A decision-useful portfolio alignment tool helps build understanding of what a counterparty is likely to do given the technology and policy levers available to them, and in doing so helps inform necessary management and engagement decisions. None of this is possible without a projection of future emissions.
There is no single best way to project emissions, as it depends on what you want to evaluate. Should performance be evaluated in relation to targets, to past data, or to something else altogether? In a world where all counterparties had disclosed targets and financial institutions could guarantee that those targets would be achieved, forward-looking projections would require only target data as inputs. However, that is not the world we live in. Many counterparties have not yet set targets, those targets may not be sufficient, and those that have sufficient targets may not necessarily achieve them if they are not also feasible. So, other input is needed. When a target does exist, evidence is needed to help financial institutions quantify how credible it is, and when a counterparty does not have a target, data is needed to help assess what it is likely to do.
There are six types of data financial institutions may use as evidence in developing forward-looking projections, shown in Table 3 (p. 45).
Consideration 15: When it comes to prioritizing sources for emissions data, the Portfolio Alignment Team suggests the PCAF Standard be followed for each of the six asset classes it covers.39 PCAF suggests prioritizing reported overestimated emissions data and estimating emissions data using activity levels as close as possible to the emissions drivers (i.e., based on physical rather than economic intensity). The Portfolio Alignment Team recognizes that data availability is currently poor, and estimated emissions may be needed to fill gaps when self-reported data is not available, particularly for Scope 3 emissions or diversified enterprises. When the PCAF Standard does not provide appropriate guidance, the Portfolio Alignment Team suggests following the GHG Protocol.
Consideration 16: The Portfolio Alignment Team suggests financial institutions take every effort to disclose transparently the data sources and methodologies used to estimate emissions. This may require them to engage with vendors when using externally estimated data.
44

Portfolio Alignment Team | Measuring Portfolio Alignment
Table 3
Projection Data Types
Data Category Data Type Pros ( + ) Cons ( - )
Neutral Current emissions, held constant
Simple to communicate Would penalize counterparties setting targets and making progress, and disincentivize others from taking actions
Backward-looking
Historical emissions trend
Extrapolate emissions from past trends
Rewards tangible past actions
Past emissions may not accurately describe future emissions, in particular for transitioning counterparties, evolving regulations, and where pressure to transition is mounting
Historical trends in production/capacity
Extrapolate activity levels (e.g., capacity, production, energy consumption) from past trends, apply average factors to recalculate emissions
Rewards tangible past actions
Limited sector coverage (power, fossil fuels, mining, automotive, shipping, and aviation)
Might penalize counterparties where data is not available
Recalculated emissions may not match emissions baseline used
Forward-looking Short-term plans for production/capacity
Extrapolate activity levels (e.g., capacity, production, energy consumption) from tangible short-term evidence (e.g., production plans, capacity expansion plans, technology road maps, commercial bids), apply average factors to recalculate emissions
Incentivizes concrete transition planning
Same as above
Limited projection time-frame (e.g., less than five years), unless linked to a longer-time-horizon target
Continued on next page
45

Portfolio Alignment Team | Measuring Portfolio Alignment
Regardless of which approach is chosen, all require some form of weighting method to indicate the relative importance of the different data sources used. The Portfolio Alignment Team suggests using a combined quantitative and qualitative assessment to do so, involving the following elements where available:
• external validation of targets (e.g., SBTi, TPI)
• target duration: Short-term targets are seen as more tangible and easier to achieve than long-term commitments. This may overlap with external validation as short-term targets are the primary type of externally validated targets
• any history of missed or overachieved targets: This may indicate a counterparty’s ability to achieve future targets
• progress toward previously announced targets (is the counterparty currently overperforming or underperforming?). Both past emissions before the plan was set and emissions since then may be worth looking at
As much as possible, backward-looking and forward-looking data should be combined, not used independently. Historical trends are not a good proxy for future trends and targets cannot be relied on to be accurate, so emissions projections should not be based on solely one or the other.
There are three main ways to undertake this combining of the available data, shown in Table 4 (p. 47). These methods can be used individually or themselves be combined. For example, you could feed outputs from a regression model into a post-calculation temperature score aggregation, or use analysts’ projections to adjust the outputs of a regression model.
Considering the pros and cons of different data-projection methods, financial institutions are encouraged to choose whichever they find the most appropriate, and to be transparent about the assumptions they make. One way to choose the most appropriate approach is to run sensitivity analyses. Approaches can also be validated by back-testing the results against past data, when available.
Forward-looking continued
Short-term emissions targets
Interpolation of emissions data taking a target’s start date, target year, and respective emissions baselines
Incentivizes short-term target setting
Short-term settings are seen as more credible than long-term ones and may be externally verified (e.g., by SBTi)
Extrapolating progress toward a target is not straightforward: It is unlikely to be linear and there are many ways to do it
Future progress may depend on many variables
Some targets are more credible than others, and assessing this credibility opens up room for interpretation
Long-term emissions targets
Interpolation of emissions data taking a target’s start date, target year, and respective emissions baselines
Incentivizes long-term climate announcements (e.g., zero commitments)
Same as above
Long-term commitments cannot easily be externally validated, which may make them less credible
Can be seen as less credible unless linked to shorter-time-horizon targets
46

Portfolio Alignment Team | Measuring Portfolio Alignment
Table 4
Methods for Constructing a Forward-Looking Projection
Method Pros ( + ) Cons ( - )
Use of a linear-trend or regression model
Predictive algorithms that specify a forward-looking emissions pathway based on historical emissions and/or forward-looking announcements
Capable of incorporating multiple variables (e.g., emissions, emissions intensities, physical and economic activity levels)
Prediction models may be back-tested
Object, transparent, and well established
Difficult to capture highly nonlinear plans (e.g., after no reductions, counterparty has in-flight funded plans to build a hydrogen DRI plant that comes online in 2028 and may reduce footprint by 20%)
Makes strong assumption that future will look like the past
May bring room for interpretation in the way regression model is built
Post-calculation temperature score aggregation
Simple benchmarking is done on emissions pathways, targets, and capacity to yield alignment scores against these variables; post-calculation, alignment scores are weighted and aggregated into a single score
Capable of capturing nonlinear dynamics by incorporating benchmarks using multiple pathways
Weighting and benchmarking methods are transparent for users
Counterparty engagement on underlying causes of poor portfolio alignment is clear
Does not resolve best method for forward estimation of emissions pathways
Weightings are difficult, though not impossible, to statistically validate
Analyst projections
Analyst builds emissions projections that take into account quantitative and qualitative factors such as target credibility, capacity plans, business strategy, and investments
Accounts for highly nonlinear trends. Accommodates qualitative judgement of counterparty plans, past behavior, and management awareness, as well as information gleaned during engagement processes
Judgement is commonly used in other areas of financial management
May seem arbitrary to reporting counterparties
Can yield inconsistent projections/judgements for a single counterparty
47

Portfolio Alignment Team | Measuring Portfolio Alignment
weight targets relative to backward-looking elements, how to conduct linear interpolation, how to account for progress), and evaluate feasibility in light of the current and forecasted technology and policy landscapes.
The Portfolio Alignment Team recognizes that all these elements are a priority area for future research. In the near term, financial institutions should be encouraged to disclose the assumptions they have made in deriving emissions projections, alongside the degree-warming result, and which timeframes they are using. The timeframe is important because a portfolio alignment score calculated using a five-year carbon budget overshoot projection has very different implications than one based on a 30-year projection, as near-term alignment scores assume that near-term alignment behavior will continue for the foreseeable future, which may not be the case.
Last, methodologies should take into account future guidance on the role of financing external carbon reductions or removals (e.g., paid for via “offset” or carbon credits) in estimating future emissions. Currently there is no consensus on this issue, and several organizations are developing considerations. The GHG Protocol only suggests that counterparties should strive to achieve reduction targets entirely from reductions within the target boundary, and that offsets should be based on credible accounting standards.40
Consideration 17: The Portfolio Alignment Team suggests forward-looking projections not be based solely on stated targets, as that could incentivize good target-setting behavior but not actual emissions reduction in the real economy. Equally, the Portfolio Alignment Team suggests projections not be based solely on historical emissions or near-term CapEx plans, as the future policy and economic environment is likely to look very different from the past and present. Projections should incorporate multiple data sources. The weights between data sources should be based on a credibility analysis of short- and long-term targets (where they exist) given available technology and policy levers, and should be back-tested to improve fidelity over time.
• whether the counterparty has developed a detailed transition plan or strategy based on available technology and policy levers
• level of management awareness (e.g., the number of board meetings dedicated to climate, any climate link to management incentives, board-level oversight of transition plans)
• other qualitative elements (e.g., recent news, CEO announcements, M&A)
• short-term CapEx plans: If these are available, they may be prioritized in the first several years of the projection, and be seen as a primary or the most credible source
If targets are not available, organizations may use analyst projections of decarbonization feasibility based on available technology and policy levers to guide the weighting of available data sources.
There are, however, important analytical limitations and challenges when making long-range projections. Short-term trends may not necessarily extrapolate into the long term, and transition pathways may not be linear. In particular, when using regression models, there is no “optimal” forecasting/prediction window. The prediction errors are an exponential function, so the farther one forecasts, the greater the uncertainty in the estimate.
Another important caveat is that portfolio alignment metrics may use a limited forecasting timeframe to derive a percentage carbon-budget under/overshoot and extrapolate it to a longer period to calculate the long-term implied temperature rise. The important margin of error that this kind of hypothesis introduces needs to be balanced against the uncertainties of extending the forecasting timeframe.
Improving forecasts of emissions data will take further work. The Portfolio Alignment Team encourage analysts and institutions to develop standards to assess how credible a firm’s targets are (e.g., a logical way to rank different types of targets), as well as to account for targets and progress toward those targets. Analyst estimates of emissions have the potential to play a similar role to their earnings estimates in their financial assessment. Institutions also need ways to judge projected counterparty emissions (e.g., how to
40 GHG Protocol, Corporate Value Chain (Scope 3) Accounting and Reporting Standard, September 2011.
48

Portfolio Alignment Team | Measuring Portfolio Alignment
Therefore, the Portfolio Alignment Team suggests it is preferable that all alignment assessments be conducted in cumulative terms, in order to prevent a situation in which a counterparty is seen as being aligned with Paris outcomes purely because it has reached the emissions level prescribed by its industry benchmark. Counterparties that exceed their given industry benchmark at any point in time will be misaligned with the associated temperature goal unless they are able to reduce emissions below the benchmark in the future and thereby keep the cumulative area under their emissions trajectory the same as the area under the industry benchmark (Figure 9).
There are two methodological variants for which this approach could cause problems. The first is those that use warming functions, and the second is those that use production or capacity-based units. Approaches using warming functions could conduct cumulative assessments if the suggestion to use emissions intensity is relaxed and absolute-emission warming functions are created and normalized to counterparty level. As previously mentioned, the technical complexities of such a process may preclude this approach, and as such warming-function approaches may not be capable of conducting cumulative assessment.
Judgement 7: How should alignment be measured?
Having constructed a benchmark and projected counterparty emissions for assessment against that benchmark, the next design decision is how to conduct this assessment. There are two options. The first is to conduct a point-in-time assessment, and the second is a cumulative assessment.
Point-in-time assessments quantify a counterparty’s alignment in terms of its emissions relative to the respective benchmark at a given point in time. (For example, in 2030, Counterparty X’s emissions will be 20% higher than the industry benchmark.) Cumulative assessments quantify alignment in terms of emissions relative to the respective benchmark across the full period of interest. (For example, between now and 2030, Counterparty X’s emissions will cumulatively be 50% higher than the benchmark over that time.)
When deciding between these two approaches, it is important to note that climate change is primarily a function of cumulative emissions of long-lived GHGs, meaning that it is not possible to directly relate a point-in-time assessment of a particular emissions level to a warming outcome. What matters to warming is the cumulative behavior of emissions between the present day and the point at which net-zero emissions are reached.
Figure 9
A Paris-Aligned Emissions Trajectory
Acc
ount
ing
Uni
t (e
.g.,
abso
lute
em
issi
ons)
Year
Benchmark
Counterparty A
Misalignment
49

Portfolio Alignment Team | Measuring Portfolio Alignment
Production or capacity-based approaches cannot directly provide a meaningful cumulative alignment measurement. However, they could conduct cumulative assessment by multiplying production levels with emissions-intensity estimates (e.g., if measuring GW of coal generation capacity, this can be converted to an emissions estimate by multiplying by a utilization estimate and measure of emissions per GWh). This is preferable to using point-in-time assessment, as misalignment in production or capacity levels over time are likely to lead to misalignment in emissions terms, and therefore a point-in-time assessment cannot provide an accurate view as to impact on alignment with the goals of the Paris Agreement.
For further details on how this suggestion applies to benchmarks constructed in emissions intensity terms, please see Judgement 8.
Consideration 18: The Portfolio Alignment Team suggests financial institutions calculate alignment or warming scores on a cumulative-emissions basis, in order to appropriately accommodate the physical relationship between cumulative emissions and warming outcomes.
Judgement 8: How should alignment be expressed as a metric?
Assuming a given portfolio alignment tool has established its normative benchmark, projected counterparty emissions, and decided on conducting a cumulative-alignment assessment, the next step is to translate that assessment into a forward-looking alignment metric. While not an exhaustive list, the two metrics covered here will be cumulative metrics: carbon budget overshoot and implied temperature rise.
Both approaches require translating benchmarks measured in terms of emissions intensity into absolute emissions. As noted in Judgement 3, this translation to absolute emissions does not change the incentives presented to counterparties, as the normative benchmarks against which their emissions are measured are still delineated in emissions intensity. So, counterparties can improve their alignment scores by changing the trajectory of their emissions intensity. The translation to absolute emissions is solely an internal accounting step that allows for the construction of more scientifically precise alignment metrics.
If you choose carbon budget overshoot as your alignment metric, the calculation is relatively straightforward. The industry benchmark and counterparty projections can both be multiplied through by the underlying scenario output projections to yield a counterparty-level cumulative carbon budget and cumulative emissions performance. The carbon budget overshoot is the ratio of those two figures.
If implied temperature rise is your alignment metric of choice, there are two potential approaches to deriving a temperature score from alignment data. The first is to follow the carbon budget overshoot approach described previously, and then to translate that overshoot into warming terms by making the explicit assumption that the rest of the world will exceed its carbon budget proportionally. This can be done by applying a TCRE multiplier. Please see Appendix 3 for the technical details on this approach.
The second approach to deriving a temperature score from alignment data is to follow the carbon budget overshoot approach described above, but to calculate the cumulative carbon budgets for multiple benchmarks — e.g., a carbon budget for a 2°C benchmark, and then a 3°C benchmark, and a 4°C benchmark. A temperature score can then be interpolated based on the proportional relationship between a given counterparty’s cumulative emissions and the various provided industry carbon budgets (see Figure 10, p. 51).
In an ideal world, the latter approach would be preferable, as using a TCRE multiplier to translate carbon budgets into warming outcomes is predicated on the implicit assumption that short-lived gas emissions will not change from what is prescribed by the benchmark. (Remember that the concept of a carbon budget only applies to long-lived gases, and must be generated with a set of assumptions about how much warming is being caused by short-lived gases at the point at which long-lived emissions reach net-zero.) This is unlikely to be true — in the real world if the Paris-aligned carbon dioxide budgets are exceeded, it is likely that methane emissions will also be larger than they need to be to limit warming to below 1.5°C or 2°C. As such, this approach likely slightly underestimates warming. Additionally, using the TCRE approach can result in proportionality issues in the resulting scores if budget overshoot assessments are done using different periods of time. For details on existing approaches to correct for this problem, again see Appendix 3.
50

Portfolio Alignment Team | Measuring Portfolio Alignment
On the other hand, using the multiple benchmark interpolation approach runs into the issue that the scenarios you select to generate the benchmarks need to be internally consistent for the method to work. If, for example, the 2°C scenario assumes Europe will lead the world in decarbonization, and the 3°C assumes that China will lead the world, the division of carbon budgets across industries and geographies will be so different between scenarios that interpolating a warming outcome based on a given counterparty’s position between the two will not be possible.
Finally, it is important to note that when selecting metrics, implied temperature warming metrics can provide some benefits that others do not: Specifically, they provide a direct link between counterparty or portfolio alignment and future climate warming outcomes, creating a common language that can be used when talking about differences between counterparty or portfolio alignment not only across different sectors, but also across time.
Consideration 19: The Portfolio Alignment Team suggests financial institutions select whichever alignment metric is most informative for their specific institution and use case.
Consideration 20: If converting alignment into an implied temperature rise metric, the Portfolio Alignment Team suggests that, in the near term, financial institutions do so by converting alignment into absolute emissions terms, from which total carbon budget overshoot between today and the net-zero target date can be calculated and combined with a TCRE multiplier to derive temperature outcome. In the medium term, as internal consistency improves across available climate scenarios, financial institutions should consider moving to a multiple benchmark interpolation approach, which can avoid some of the technical issues inherent with application of a TCRE multiplier.
Figure 10
TCRE Multiplier vs. Multiple Benchmark InterpolationTCRE multiplier approach Multiple benchmark interpolation approach
Apply counterparty overshoot to global 1.5°C carbon budget
Multiply by TCRE to translate to incremental temperature impact
Add current warming level
Calculate area under each temperature benchmark
Calculate area under counterparty curve
Interpolate score based on proportion of cumulative performance
Emis
sion
s
Year
Emis
sion
s
Year
51

Portfolio Alignment Team | Measuring Portfolio Alignment
Judgement 9: How should counterparty-level scores be aggregated?
Individual counterparty scores can be aggregated to provide information about how a portfolio is performing. Scores can be aggregated at multiple levels—financial product, asset class, geography, sector, or financial organization. A key condition for building a tool that facilitates aggregation to multiple levels is to have a continuous, universal alignment metric such as carbon budget overshoot or implied temperature rise.
There are two primary aggregation approaches, each of which provides financial institutions with different information: the aggregated-budget approach and the portfolio-weight approach.
Let us first consider the aggregated-budget approach. This approach can be divided into five steps. The first step in this approach is to quantify counterparty-level benchmark and emissions trajectories as described in the previous design judgements. The second step converts all counterparty-level emissions and benchmarks into absolute emissions terms. The third step is to calculate the portfolio “owned” portion for each counterparty’s emissions and benchmarks. The fourth step is to stack the portfolio “owned” portions of each counterparty’s emissions on one hand, and benchmarks on the other. Last, the fifth step is to compare the sum of “owned”
trajectories against the sum of “owned” benchmarks, and thus estimate the total carbon budget under-/overshoot of the portfolio or sub-portfolio grouping.
When it comes to calculating the portfolio “owned” portion for each counterparty, there are two main weighting schemes available. The first is straightforward: a simple sum (e.g., unweighted). The problem with this approach is that portfolio-level emissions will be dominated by counterparties that are particularly emissive, even if the level of financing provided to those counterparties is low. The second approach is more appropriate: weighting based on financed emissions (where financed emissions are defined as the proportion of total counterparty emissions equal to the ratio of financing provided to counterparty value. In other words, if you own 10% of a counterparty, you are allocated 10% of its benchmark (carbon budget) and 10% of its emissions across time). There are different ways to define counterparty value using this approach, detailed in Table 5.
A robust approach should use EVIC for listed equity, corporate bonds, and business loans. It is commonly used in the financial sector as a measure of a counterparty’s total value, is widely available and consistent with PCAF guidance, and provides an ownership view by including market valuation of equity. If the aggregation score covers a broader set of asset classes, the Portfolio Alignment Team suggests following PCAF guidance, which proposes
Table 5
Counterparty Value Definitions
“Owned Emissions” Counterparty Value Definitions Characteristics
Market capitalization measuresReflects ownership but subject to volatility of equity markets
Total assets and revenue measures Widely available through financial statements. But can be unstable from year to year in key transition sectors such as fossil fuels
Enterprise value including cash (EVIC)
Defined as the sum of the market capitalization of ordinary shares at fiscal year-end, the market capitalization of preferred shares at fiscal year-end, and the book values of total debt and minorities’ interest.
Stable (balance-sheet metric), widely available (financial statement), and provides a consistent view of ownership when aggregating across multiple asset classes
52

Portfolio Alignment Team | Measuring Portfolio Alignment
• Employing this method accurately thus becomes extremely difficult if a portfolio includes investments or counterparties with incomplete or no data.
• Nor is the aggregation method compatible with certain approaches to counterparty-level scoring. For instance, a warming-function approach prevents one from using a single benchmark to sum up emissions (see Judgement 1).
A second-best approach to meeting the objective of impact reporting is simply to weight counterparty-level alignment scores together by portfolio absolute “owned” emissions. In other words, instead of adding together owned emissions and owned benchmarks into a single benchmark and emission trajectory, this approach simply assigns a weight to the final alignment score of each investment/counterparty, based on what proportion of total portfolio-owned emissions it represents.
appropriate approaches for a wide range of asset classes (project finance, commercial real estate, mortgages, and motor vehicle loans).41
The primary benefit of the aggregated-budget approach is that it is based on the same physical science principles as the actual climate system: The warming caused by a given portfolio is a direct function of the cumulative overshoot or undershoot of its unique proportion of the global carbon budget. As a result, of all available aggregation methods, the aggregated-budget approach results in the most scientifically robust scores.
However, the aggregated-budget approach also faces significant limitations. Meeting the method’s objective of providing an accurate picture of financed emissions is highly dependent on the quality and availability of data: The method requires both counterparty and benchmark emissions data for all counterparties being aggregated.
41 This table is replicated from PCAF’s Global GHG Accounting & Reporting Standard for the Financial Industry, November 18, 2020.
Table 6
GHG Accounting Methodology by PCAF
Asset Class GHG Accounting Method
Listed equity and corporate bonds
Business loans and unlisted equity
Project finance
Commercial real estate
Mortgages
Motor vehicle loans
53

Portfolio Alignment Team | Measuring Portfolio Alignment
by counterparties’ scores by their current owned emissions approach, the portfolio score would be (8*2.7°C + 1*1.5°C)/(8 + 1) = 2.5°C, which is slightly higher than with the aggregated-budget approach.42
The second approach to aggregating scores is the portfolio-weight approach. (Note here the differentiation between the portfolio-weight approach and the portfolio-owned variation discussed in the preceding paragraphs.) This method calculates the portfolio-level score through weighting individual scores by the outstanding values held in the portfolio. It provides insight on the impact of capital-allocation decisions (through the respective value of each investment) rather than focusing on each individual investment’s contribution to emissions. This approach has several benefits:
• It is well-known in the financial sector, and makes it easy to replicate consistently a simple weighted average approach at various levels of aggregation (product, asset class, portfolio, entity-wide).
• Adding new investments or changing the set of holdings has a clear and transparent impact on the aggregated score. This approach is linear and combines only two variables: the value of investment and individual counterparty scores. By contrast, “owned emissions” approaches add analytical parameters (attribution factors) that make the calculation and interpretation of an aggregated score more difficult.
This portfolio-owned approach is less rigorous than the aggregated-budget approach, but it offers two important benefits: It can handle a lack of forward-looking counterparty data (although it does require a baseline for the financed emissions calculation), and it is compatible with the use of a warming function.
As shown in Table 7, this approach could lead to a different result from calculating a portfolio-level score using the aggregated-budget approach. In particular, it tends to overweight counterparties with high emissions. However, it is a directionally valid way to represent the aggregated climate impact of the portfolio.
To follow this approach, owned emissions should again be calculated as each counterparty’s emissions multiplied by an attribution factor, in line with PCAF guidance. This may make it a valid option when a counterparty’s owned current emissions are available but future cumulative emissions, or the respective benchmark, are not.
In this example, both Counterparty A’s and Counterparty B’s respective owned emissions and benchmarks owned emissions are available. Under the aggregated-budget approach, assuming a benchmark with a 1.5°C target and a remaining carbon budget of 580 GtCO2, and calculating the portfolio’s temperature applying the TCRE multiplier approach, the portfolio’s relative deviation to its benchmark would be 170/50, and its temperature score would be 2.4°C. Using the portfolio-owned score, weighting
Table 7
Portfolio Aggregation Approach Examples
Owned cumulative CO2e emissions (actual/benchmark)
Owned current CO2e emissions (actual)
Counterparty temperature score
Aggregated-budget approach score
Portfolio- owned approach score
Counterparty A (160/40) 8 2.7°C
2.4°C 2.5°C
Counterparty B (10/10) 1 1.5°C
42 This example assumes a benchmark with a 1.5°C implied temperature rise, and a global remaining carbon budget of 580 GtCO2, a TCRE of 0.000545°C of additional warming per Gt of CO2 emitted, and an additional non-CO2 warming of 0,01°C + CO2 implied temperature*0,225, following Judgement 8.
54

Portfolio Alignment Team | Measuring Portfolio Alignment
However, despite the outstanding amount in Counterparty A being only 10% of the portfolio value, it represents 94% (160/170) of this portfolio’s owned emissions.
If financial institutions use the aggregated-budget approach43 (summing the respective benchmarks and actual emissions of Counterparties A and B), the resulting carbon budget overshoot will be dominated by Counterparty A’s emissions, leading to a 3.4-fold (170/50) overshoot of the portfolio’s total carbon budget. This would result in a higher portfolio temperature score of 2.4°C (as described in the Table 9 example), which depicts more accurately the portfolio’s actual contribution to potential warming.
Regardless of which approach is chosen, there are various crosscutting issues facing all aggregation methods that have not yet been discussed. For example, for Judgement 5, the Portfolio Alignment Team's suggestion is that at counterparty-score level GHG gases can in the near term be mixed together using the GWP framework detailed by the GHG Protocol. Consistent with that, an appropriate approach for aggregating the emissions alignments of various types of GHG is to base each counterparty score entirely on the carbon dioxide equivalent for each GHG (this is derived by multiplying the weight of the gas by the associated GWP). If methane-specific benchmarks are derived in the future, this aggregation approach will need to change to accommodate them.
• The simplicity of the method means users can easily analyze and dissect the drivers of the aggregated score by any variable of interest (e.g., asset class, sector, region, product).
In addition, a portfolio-weight approach treats missing counterparty data more straightforwardly than a cumulative owned emissions under/overshoot temperature-measurement approach:
• Counterparties with missing data can simply be assigned a default temperature score. This provides a clear, unambiguous way to treat missing data, particularly for present-day baselines. It also considerably expands the scope of aggregation.
• A well-designed default-score framework can incentivize counterparties to take steps to improve their alignment score (e.g., setting targets, improving emissions disclosure).
• The approach would also be applicable when using a warming function.
However, these benefits come at the cost of sacrificing the scientific robustness of aggregated scores. For example, this approach will underestimate the climate impact of portfolios with small outstanding values in high-emitting counterparties.
Using the portfolio-weight approach, the portfolio temperature score is (0.9*1.5°C) + (0.1*2.7°C) = 1.6°C.
43 This example assumes a benchmark with a 1.5°C implied temperature rise, and a global remaining carbon budget of 580 GtCO2, a TCRE of 0.000545°C of additional warming per Gt of CO2 emitted, and an additional non-CO2 warming of 0,01°C + CO2 implied temperature*0,225, following Judgement 8.
Table 8
Portfolio Aggregation Approach Examples
FirmOutstanding amount
Portfolio-owned cumulative CO2 emissions (actual/benchmark)
Counterparty temperature score
Portfolio-weight approach
Aggregated-budget approach score
Counterparty A 10% (160/40) 2.7°C
1.6°C 2.4°C
Counterparty B 90% (10/10) 1.5°C
55

Portfolio Alignment Team | Measuring Portfolio Alignment
In addition, double counting within an individual portfolio may be limited in comparison with double counting throughout the whole economy. While a Counterparty A may supply some output to a Counterparty B in a given portfolio, it would also supply many other counterparties outside of the portfolio; therefore, only a fraction of the total economy-wide double-counted emissions would occur within the portfolio. Furthermore, if counterparties report emissions following the GHG Protocol’s guidance, there should be no double counting between parent counterparties and their subsidiaries.46 Removing double-counted emissions may, thus, be a limited concern in the context of calculating portfolio- level scores.
There might also be some arguments against removing double-counted emissions from a portfolio. By discounting emissions within the portfolio, there is a risk of underestimating the scale of the portfolio’s carbon exposure. Additionally, removing double-counted emissions could skew portfolio managers away from engaging with counterparties for which emissions have been reduced to account for double counting. For these counterparties, lower adjusted emissions mean they now have a lower impact on the resulting portfolio score.
Lastly, there is currently no consensus on methodologies to remove double-counted emissions. This could lead to sectoral bias (e.g., firms in sectors with high Scope 3 emissions may end up with a lower weight in the portfolio if double counting is removed from only Scope 3 emissions). Detailed supply chain mappings are required to attempt to address this issue comprehensively. Due to current challenges around Scope 3 data, such mappings may not be reliable. Another approach would be to calculate and apply “de-multiplication” factors on different segments, but this may lead to important approximations, especially given limitations in availability and quality of Scope 3 data. In all cases, removing double counting may come with risks of biased attribution decisions: There may be more than
As laid out in Judgement 4, the Portfolio Alignment Team suggests including all three scopes of emissions. Makers of portfolio alignment tools, therefore, need to consider what to do about double counting. Double counting may matter both at individual counterparty level and when aggregating (using, say, the aggregated-budget approach with a single temperature pathway). At individual counterparty level, a portfolio alignment metric compares a counterparty’s emissions to an emissions benchmark, and the amount of double counting is unlikely to be proportionate between the two. As such, counterparty emission trajectories that include double-counted emissions could potentially have an exaggerated over- or undershoot of their benchmarks.
Providers are already experimenting with approaches to quantifying double counting. The scale of double counting in the corporate world is estimated to be roughly 5x, according to estimates by MSCI,44 once both upstream and downstream Scope 3 emissions are included. This number may be calculated by comparing the sum of the emissions estimated for a set of counterparties to their actual global emissions, and comparing this ratio to the ratio of the sum of the values of the counterparties in the same set to the actual global “value” of the economy (for which financial assets are a reasonable proxy).
However, when aggregating a portfolio-level score, double counting is unlikely to be a material issue. First, a significant part of the double counting should already be included in the counterparties’ benchmarks and would, therefore, not affect significantly the degree of aggregated under-/overshoot.45 If double counting is removed, the error in the resulting alignment score would be based purely on the portion of the double counting that is not proportionally counted in both the portfolio’s emissions and the benchmark’s emissions. Removing double counting would only lead to a material shift in the portfolio score if it is systematically better- or worse-performing in the activities where double counting occurs compared to activities with no double counting of emissions.
44 MSCI, “Scope 3 Carbon Emissions: Seeing the Full Picture,” September 17, 2020.45 The GHG Protocol establishes that “counterparty’s scope 1, scope 2, and scope 3 emissions represent the total GHG emissions
related to counterparty activities” and that “[c]ompanies may find double counting within scope 3 to be acceptable for purposes of reporting scope 3 emissions to stakeholders...and tracking progress toward a scope 3 reduction target.” See GHG Protocol, Corporate Value Chain (Scope 3) Accounting and Reporting Standard, September 2011.
46 The GHG Protocol defines organizational boundaries through which “a counterparty selects an approach for consolidating GHG emissions and then consistently applies the selected approach to define those businesses and operations that constitute the counterparty for the purpose of accounting and reporting GHG emissions.” See GHG Protocol, A Corporate Accounting and Reporting Standard, March 2004.
56

Portfolio Alignment Team | Measuring Portfolio Alignment
will improve dramatically over the coming years. Improvements to any one of these portfolio alignment inputs will inevitably change both the resulting alignment scores and their associated uncertainties. Portfolio managers should consider quantifying and disclosing the uncertainties associated with their portfolio or sub-portfolio alignment scores, and attributing and disclosing changes to these quantities as the inputs they use to calculate scores improve or change themselves.
Consideration 21: The Portfolio Alignment Team suggests, if disclosing portfolio alignment information, financial institutions use an aggregated-budget approach in order to maximize the scientific robustness of their disclosures.
Consideration 22: The Portfolio Alignment Team suggests, if supporting internal capital allocation decisions, financial institutions may use a simple weighted average approach.
Consideration 23: The Portfolio Alignment Team suggests financial institutions disclose the proportion of their portfolio covered by portfolio alignment scores, and that they clearly label the aggregation methods applied, as each comes with their own use cases.
Consideration 24: The Portfolio Alignment Team suggests financial institutions include a statement in their portfolio alignment disclosures regarding uncertainties arising from the methodology, data, and scenario(s) employed.
Consideration 25: The Portfolio Alignment Team recognizes that methodology, data, and scenarios will improve over time, causing portfolio alignment scores to change. The team suggests financial institutions include a statement in their portfolio alignment disclosures attributing score changes to methodological, data, or scenario improvements as they occur.
one way to estimate and remove double counting within multiple counterparties, with consequently different impacts on the calculated scores.
In conclusion, more work is needed to accurately quantify the magnitude of double counting emissions as they apply to portfolio alignment activities, and therefore, the optimal strategy managing it. However, given multiple lines of evidence available today suggesting the magnitude is likely low, double counting should not be considered a barrier to financial institutions effectively applying portfolio alignment tools in the near term.
It is important to note that portfolio managers often lack data for certain counterparties (e.g., no targets or emissions disclosures), or the appropriate methodological tools to deal with specific asset classes (e.g., sovereigns) and will need to deal with this as they approach aggregation. They can do so in several ways depending on the goal of the aggregation:
• Assign penalty scores by default to counterparties with incomplete data (e.g., a 3°C+ warming score). This allows them to aggregate a score covering these counterparties and also creates an incentive for these counterparties to provide complete disclosures and set carbon reduction targets. This approach is not, however, compatible with the cumulative owned emissions aggregate approach, as it would undermine the methodology’s aim to represent a fair picture of aggregated “owned emissions.”
• Exclude counterparties or assets with incomplete data from calculations of an aggregation score. The portfolio manager should consider disclosing relevant information on the scope of exclusion, similar to the approach toward insufficient asset class coverage.
Finally, as discussed throughout this report, aggregated portfolio or sub-portfolio alignment scores will be subject to various sources of uncertainty arising from choice of methodology, data, and scenario. Furthermore, it is expected that methodologies, data availability, and scenario fidelity
57

Portfolio Alignment Team | Measuring Portfolio Alignment
Part C: What is needed to build the enabling environment for the portfolio alignment tools?

Portfolio Alignment Team | Measuring Portfolio Alignment
Unlocking the power of portfolio alignment tools will require development of a supportive data and analytics environment. Today, major gaps in the climate data and analytics ecosystem prevent users from taking full advantage of these tools. The results of these gaps are reflected in various studies of portfolio alignment tools, which have found that variations in methods, data, and scenarios lead to uncorrelated alignment scores for the same portfolio.
As portfolio alignment tool adoption increases, these gaps could become barriers to effective portfolio alignment, expose financial institutions to greenwashing accusations, and cause investors, lenders, and underwriters to make incorrect assessments about the forward-looking trajectory of portfolios and individual investees/counterparties.
Institutions will not be able to resolve these gaps alone; instead, a coordinated effort is required to build an enabling environment by the full stakeholder community of data providers, financial institutions, nonprofits, non-financial institutions, and governments.
This section details these gaps and identifies three primary actions the international community can pursue to help close them:
1. Improve corporate data and disclosures: Essential inputs into portfolio alignment measurement, including emissions, targets, and transition plans, remain limited across portfolio counterparties; financial institutions, non-financial institutions, and governments have a critical role to play in developing a disclosure environment that can successfully enable portfolio alignment assessments.
2. Ensure fit-for-purpose scenarios: Investors managing against net-zero targets remain limited to a relatively narrow set of appropriate benchmark scenarios not explicitly designed for this purpose; to be successful, appropriate net-zero scenarios for alignment benchmarking need to be funded through broader research efforts and scenarios will need to be updated more frequently.
3. Drive methodological convergence: The impact of portfolio alignment methodology decisions remain limited in transparency; more open, collaborative development of toolkits, with disclosure of the impact of methodological decisions, can help drive convergence through increased transparency. It is important to note, however, that while following and refining the considerations provided in this paper will help drive convergence, it will not eliminate the difference in scores between different methods, as variables like scenario choice and forecasting method will still introduce variance to final results.
59

Portfolio Alignment Team | Measuring Portfolio Alignment
temperature alignment scores may be incorrect or be forced to assume poor performance of non-reporting counterparties by relying on a penalizing “default score.”
Resolving this issue will require the collaboration of multiple stakeholders, including governments, non-financial institutions, and investors. For example, consider the current disclosures landscape.
With regard to emissions data, counterparties that report emissions information more often disclose Scope 1 and/or Scope 2 emissions, and only rarely their Scope 3 emissions, which creates additional challenges for data providers and financial institutions.
A number of sources of data are critical for successful portfolio alignment: As noted, emissions, targets, and production-related plans are all key elements in assessing the forward trajectory of counterparties. Despite ongoing efforts on voluntary disclosures and target setting, a small, albeit increasing, proportion of counterparties have disclosed their emissions footprints, few counterparties have disclosed targets, and investors have even more limited information on forward-looking decarbonization plans.
In the absence of information, investors must rely on estimates, which may vary in complexity and prevent accurate assessment of individual counterparty decarbonization progress; as a result,
1. Improve climate data and disclosures
Figure 11
Reported Data Remain Low
Source: MSCI ESG RESEARCH LLC; data as of April 30, 2021
10,000
8,000
6,000
4,000
2,000
8,806
1,080
3,349
1,9451,674
Constituents of MSCI ACWI IMI
Disclosed Scope 1 and/or Scope 2
Disclosed on any aspect of Scope 3
Disclosed on any aspect of Scope 3
Upstream
Disclosed on any aspect of Scope 3
Downstream
Tota
l Num
ber
of C
omp
anie
s
6060

Portfolio Alignment Team | Measuring Portfolio Alignment
With regard to counterparty emissions reductions targets, at present only a small proportion of counterparties have disclosed. When targets are disclosed, they vary significantly, including by target year, length of the emissions reductions period, scopes of emissions, type of metric (revenue intensity, activity-based intensity, or absolute), and sometimes by the boundaries of corporate activities covered. As a result, compiling consistent datasets on targets has proven to be a highly difficult challenge, creating a shortage in high-quality, high-coverage datasets in the market.
In addition to being rarely disclosed, Scope 3 emissions disclosures by counterparties are highly heterogeneous and often do not specify the categories of emissions covered, which causes substantial comparability issues. Figure 13 (p. 62) shows the share of counterparties in the MSCI ACWI IMI that have reported each of the 15 categories of Scope 3 upstream and downstream emissions, in accordance with the GHG Protocol. More counterparties have started to report their upstream emissions, focusing on business travel, than downstream emissions.
Counterparty indirect value chain emissions (Scope 3), as noted in this paper, can be useful for portfolio alignment benchmarking, particularly when they comprise a significant proportion of the counterparty’s
footprint. As demonstrated in Figure 12, for some counterparties, particular in the energy sector, Scope 3 emissions can make up >90% of total emissions.
Figure 12
Scope 3 Emissions Can Be Large for Some Sectors
Energy
Utilities
Consumer Discretionary
Materials
Industrials
Financials
Consumer Staples
Information Technology
Real Estate
Communication Services
Healthcare
Scope 3 Categories:1&2 3 4&9 5 6 7 8 10 11 12 13 14 15
100 50 60403020
Mt CO2 (average per sector)
61

Portfolio Alignment Team | Measuring Portfolio Alignment
Figure 13
Disclosed Scope 3 Emissions Data Is Difficult to Compare
Source: MSCI ESG RESEARCH LLC; data as of December 20, 2020
Counterparty Disclosure of Upstream S3 Emissions, by Category
Other (
upstream
)
Category
1
Purc
hased G
oods and Se
rvice
s
Category
2
Capital G
oods
Category
3
Fuel-
and Energ
y-Re
late
d Activi
ties
(not in
cluded in
Scope 1
or 2)
Category
4
Upstream
Transp
ortatio
n
and Dist
ributio
n
Category
6
Busin
ess T
rave
l
Category
8
Upstream
Lease
d Asset
s
Category
5
Waste
Genera
ted in
Opera
tions
Category
7
Employe
e Com
mutin
g
% o
f MSC
I AC
WI I
MI C
omp
anie
s
80%
100%
20%
60%
40%
Counterparty Disclosure of Upstream S3 Emissions, by Category
Categ
ory 9
Downstre
am Tr
ansp
ortatio
n
and D
istrib
ution
Categ
ory 10
Proce
ssin
g of S
olid Pr
oducts
Categ
ory 11
Use of
Solid
Product
s
Categ
ory 12
End-o
f-Life
Trea
tmen
t
of So
lid Pr
oducts
Categ
ory 14
Fran
chise
s
Categ
ory 13
Downstre
am Le
ased
Ass
ets
Categ
ory 15
Inve
stm
ents
Other
(downst
ream
)
% o
f MSC
I AC
WI I
MI C
omp
anie
s 80%
100%
20%
60%
40%
Disclosed Category self-declared as "relevant" by counterparty, but no data disclosed
No disclosed information available
Category self-declared "not relevant/applicable" by counterparty
62

Portfolio Alignment Team | Measuring Portfolio Alignment
Finally, disclosure rates differ across geographies, with emerging markets facing more limited pressure and more limited capacity to execute on climate disclosure. The compounding impacts of these dynamics mean that portfolios across particular asset classes and geographies are affected more heavily by data limitations that may decrease the utility of portfolio alignment tools.
There are several barriers that prevent complete and accurate use of disclosed data that need to be addressed. First, collecting data remains a challenging process for many counterparties, requiring specialized expertise. In particular, Scope 3 emissions data collection and/or estimation can be challenging especially for upstream sectors, requiring a focus on most material disclosures.
Second, although standards exist for target setting and disclosures, many counterparties still do not follow them and there are gaps or inconsistencies in guidelines resulting in inconsistent boundaries, timeframes, etc. In some cases, highlighted issues like incomplete Scope 3 disclosures or inconsistent targets still ride below the radar for many financial institutions and regulators while causing significant challenges with data normalization.
Third, freely disclosed data are currently either behind paywalls or scattered in sustainability reports. As a result, no true “reference” dataset on climate exists that investors and non-financial institutions can refer to as a common standard or source of truth. When reporting, non-financial institutions lack a single place where their disclosures can be accepted, parsed, and accessed centrally by investors; as a result, non-financial institutions often have to make corrections to data that have been separately scraped, normalized, and/or estimated by dozens of data providers.
Fourth, without a clear impact from missing or inconsistent disclosure across datasets, many non-financial institutions are uncertain about whether they benefit from the current situation, and confused about how information they disclose is likely to get used in a regulatory context. Investors have tried to respond with disclosure-related engagement initiatives, but have struggled to make rapid enough progress at scale to impact the voluntary landscape.
As the case example shows in Figure 14 (p. 64), normalizing targets in the current market context to achieve consistent counterparty comparisons can be a highly technical challenge. See Appendix 4 for more detail on how this affects portfolio alignment approaches.
With regard to capacity and production plans, few counterparties at present voluntarily disclose production plans, outside of regulated industries (e.g., utilities counterparties in the U.S. context). Without globally consistent regulatory action, lack of disclosure on production plans is understandable; capacity and production planning often represents competitive information that may be used unfairly across competitor counterparties or geographies in an uneven disclosure environment.
As a result of these limitations, capacity and production data remain highly reliant on analyst estimates, which often rest on heavy industry expertise. The result is that these datasets can be scattered across providers and analyst estimates variable and opaque, requiring substantial resources to collect and serve up to financial institutions for assessment of a counterparty’s forward-looking efforts to decarbonize.
Although data challenges impact all investors, disclosure rates can differ significantly across asset classes and geographies. One of the most pressing divides is between the private and public markets; private market data are much less widely available than in the public markets where shareholder pressure is replaced by a smaller subset of GP/LP requirements.
Other alternative asset classes, including derivatives, commodities, and project financings may have non-transparent footprints, which may require heavy use of estimation methodologies. Similarly, disclosure has proven sensitive to investor expectations; disclosure rates are higher for some hard-to-abate industries highly sensitive to investor climate disclosure demands (e.g., utilities) than in more progressive consumer goods or service industries that face lower demands on climate-related disclosures. Smaller counterparties also face higher barriers to disclosure given the cost relative to their size.
63

Portfolio Alignment Team | Measuring Portfolio Alignment
Figure 14
Counterparty Target Case Examples
Source: MSCI ESG RESEARCH LLC; data as of April 30, 2021. *Note: 100% includes 25% offsets and 75% reduction **Note: Assumes constant declining emission levels between 2023, 2036, and 2049 when coal plants are planned for decommission; under the alternative assumption that emissions stay constant until each coal plant is decommissioned, deviation from 2030 trajectory would be estimated at 23.1%.
Counterparty Targets Case Example A: APPLE INC
Counterparty Targets Case Example B: AGL Energy Ltd.
Comprehensiveness
Type Absolute Absolute + Intensity
Unit tCO2e tCO2e, tCO2e/MWh
Targeted Scopes Scopes 1, 2, and 3 Scopes 1 and 2
Targeted Scope 3 Categories All None
Percentage of Counterparty Footprint Covered by Target
100% 63%
Ambition
Target Year 2030 2049
Remaining Emissions Reduction 100%* 62.7%
Projected Reduction per Year, Normalized 9.1% 2.1%
Projected Emissions @ 2030 versus 2050-net-zero Trajectory
-64.9% 12.2%**
Projected Emissions @ 2050 versus 2050-net-zero Trajectory
0.0% 37.3%
Feasibility
Track Record of Meeting Historical Targets Met all previous targets No previous targets
Progress Toward Ongoing Targets On track with ongoing targetsOn track with some ongoing targets
Revenues from Climate Change Solutions (% of total)
0.0% 13.0%
Intention to Use Carbon Offsets Yes Yes
StrategyEngage suppliers, product design, carbon removal
Exit coal, more renewables, link executive compensation
From APPLE INC’s 2021 Environmental Progress Report
“We’ve set a goal to become carbon neutral across our entire footprint by 2030. We will get there by reducing our emissions by 75 percent compared to 2015, and then investing in carbon removal solutions for the remaining emissions.”
From AGL’s 2020 Annual Report
Net-zero by FY50 of “operated Scope 1 and 2” emissions; 34% “controlled renewable and battery capacity” by FY24 (currently 22.5%); 20% “revenue from green energy and carbon neutral products” by FY24 (currently 11.5%); Other targets for FY21 “consistent with the objectives of the Long Term Incentive plan” for controlled generation intensity, which sees it at 0.845 by FY24 (currently 0.93).
64

Portfolio Alignment Team | Measuring Portfolio Alignment
Finally, some data necessary for assessing alignment (e.g., capacity plans) have sensitivity if presented publicly. As a result, non-financial institutions that are asked to report this information to investors (e.g., bank lending) may need to provide disclosures through private channels, but infrastructure to do so at scale without overburdening counterparties to do so on a one-off basis is currently lacking.
To resolve many of these issues, regulators and standard-setting organizations should aim for convergence on disclosure standards and data infrastructure on climate.
Suggested Next Steps:
Regulators and standard-setters should come together to drive increased global participation, convergence, and harmonization on core climate-related disclosures; these efforts should consider disclosure needs specifically for the portfolio alignment use case.
Nonprofits, IOs, and financial institutions should work collaboratively to converge on emissions measurement and estimation standards and reporting expectations across alternative asset classes and geographies critical for alignment for which methodologies are not currently available.
Nonprofits, IOs, and financial institutions should work collaboratively on the advancement of tools and innovation to help counterparties provide scalable, actionable, and useful climate-related intelligence on their businesses necessary to improve accuracy and usefulness of portfolio alignment tools.
65

Portfolio Alignment Team | Measuring Portfolio Alignment
Carbon budgets, which are specified by scientific climate scenarios, ultimately form the backbone of portfolio alignment tools. In the temperature alignment context, the design and selection of these climate scenarios, however, are fundamental choices that inform the outcomes and scientific validity of portfolio alignment tools. Currently, a range of climate scenarios exist, produced by scientific modelers, financial regulators (NGFS), industry expert groups (e.g., IEA), and nonprofits (e.g., SBTi sector pathways). Despite the proliferation of these models, the global conversation on what makes a scenario suitable for net-zero benchmarking is still nascent.
This section explores some of the questions that need to be answered through further scientific and economic research, including:
• What might make a suitable scenario for net-zero benchmarking (e.g., against 1.5°C alignment)?
• How should the overall carbon budget be divided up in this scenario—and how should more granular benchmarks be derived?
• How often should these scenarios be updated and what are the outstanding requirements for doing so?
Scenario analysis is ultimately a “what-if” exercise and the climate transition scenarios used for portfolio alignment benchmarking are no different. These scenarios aim to identify a hypothetical set of starting and/or evolving conditions according to a simplified model of the workings of the global socioeconomic, energy, climate, and technology systems, and identify how different parameters evolve over time. Therefore, setting parameters for answering the right question at hand is critical; in this case, “How could and should counterparties across various sectors and in different geographies evolve to provide the greatest likelihood of achieving global goals of below 1.5°C warming?”
2. Ensure scenarios are fit-for-purpose
In most cases, the very idea of using a scenario as a normative benchmark for counterparty behavior is alien from how these scenarios were originally designed; many were established to test the impact of optimal policy packages and/or assess the distribution of economic burden; others were designed to identify the likely long-term evolution of energy system dynamics under various technology and policy regimes. As such, many current scenarios are not fit-for-purpose for the type of alignment for which they are currently being repurposed; and even if they could be used for this purpose, they have often not been optimized for it.
To develop better scenarios, climate modelers and financial institutions will need to collaborate to identify the appropriate subset and parameters of climate scenario models useful for alignment benchmarking. The goal of such an exercise would be two-fold: (1) to aid in appropriate selection of scenario design principles for net-zero benchmarking and (2) to help develop a new generation of climate scenarios that can better answer key questions about how rapidly sectors need to decarbonize to meet net-zero goals. Such design principles might include the following criteria:
• Use of carbon dioxide removal (CDR) technologies: CDR should be limited in climate scenarios given the current economics of deployment at scale. Limitations on CDR would ultimately lead to more aggressive sector decarbonization requirements.
• Timing and emissions budget: To comply with 1.5°C ambitions, scenarios should also ensure that the emissions budget is conservative, with caps on total emissions through the end of the century and peak emissions that limit the potential for overshoot; Short-Lived Climate Pollutants (SLCPs), which endure for short periods in the atmosphere but have high global warming potential, will also need to be specified to limit overshoot risk and minimize the economic burden of net-zero transitions.
66

Portfolio Alignment Team | Measuring Portfolio Alignment
The needs for scenario benchmarking are much more nuanced than high-level models: Significant differences exist within transportation as well as broad categories like industrials. Where more granular sector designations do not exist, alignment tool developers must make judgements on whether to adopt the high-level sector pathway for all sub-sectors or make judgements on how to divide the carbon budget into more granular categories.
The more granular the sub-division, the greater the uncertainty associated with the required rate of decarbonization, making the appropriate apportionment across sectors difficult to determine scientifically. Assumptions need to be made at an industry level as to the appropriate pace of decarbonization in apportioning the carbon budget, based on quite geographically and sectoral-specific technological and policy dynamics. Furthermore, the appropriate treatment of diversified holding counterparties, which may cross different industries, has challenged standard-setters and presents special technical difficulties.
These difficulties are compounded by adding scenario-based benchmarks for a broader set of Scope 3 activities that pull in a range of other granular industrial activity dependencies (upstream, downstream) and providing separate benchmarks at an industry level for specific gases like methane, which are easier to specify at a more aggregate economy level. Absent further funded and organized research on these topics, these alignment benchmarks will ultimately have significant but unknown uncertainty associated with them, and risk not reflecting, particularly in aggregate, realistic industry or policy dynamics across the global economy.
Each year on the road to net-zero matters and provides meaningful information on how likely we are to achieve global climate goals. In particular, the policy, technology, and emissions trajectory of the global economy is evolving at a relatively rapid pace, and each of these dynamics requires regular updating to be realistically reflected in alignment benchmarks. As a result, scenarios will need to be more frequently updated to ensure that the ultimate goal of ensuring below 1.5°C warming can still be achieved by the forward-looking pathways used as normative benchmarks. In particular, the following factors will need to be updated based at varying frequencies:
• Socioeconomic conditions: Transition scenarios are highly sensitive to the assumed socioeconomic state of the world; the current Shared Socioeconomic Pathway (SSP) framework provides various options for the world’s socioeconomic trajectory, and a conservative, but realistic socioeconomic system may be appropriate (such as that embodied by SSP 2) with corresponding population dynamics that accurately reflect best available growth projections.
• Policy: Ideally, the policy package implemented for modeling should accurately reflect the distributional impact of net-zero policy on sectors as reflected in currently stated ambitions and/or political economy assumptions; technological development and the economic feasibility of decarbonization across sectors will be highly sensitive to these policy assumptions.
• Fairness: Ultimately, scenario design should ensure that burdens are shared fairly and emerging/developed market dynamics are adequately reflected; decarbonization will be more challenging in the developing world and the burden of decarbonization and technology development in early years will need to fall more heavily on developed countries. Currently, unrealistic mechanisms for burden-sharing, like cross-border transfers, should likely be avoided or limited.
Transition scenarios are complex models of global economic dynamics; therefore, they often require simplification to accurately model central global trends. As a result, early transition scenario models in the scientific and economic community often focused on transition dynamics across one or two sectors; more recently a wider number of sector dynamics have been modeled with many scientific IAMs now covering the full economy divided into five or more sectors. The definition of these sectors, however, is not always easy to map to counterparties; they often have separate sector designations from widely accepted classification regimes.
67

Portfolio Alignment Team | Measuring Portfolio Alignment
Suggested Next Steps:
The global research community should collaborate with nonprofits, governments, and international organizations to identify appropriate, consensus design principles for climate scenarios and specifications for the development of new net-zero scenarios for use in portfolio alignment tools.
Necessary funding should be deployed for research on the development of a new generation of scenarios explicitly designed for the purposes of portfolio alignment activity.
Necessary funding and infrastructure should be deployed to ensure policy, technology, and emissions updates are adequately and accurately reflected in climate scenarios to ensure that net-zero benchmarks reflect the highest potential pathways for global decarbonization to meet 1.5°C goals.
• Emissions performance: As the race to zero commences, the world may lag or advance more rapidly on decarbonization than desired. For normative benchmarks to be effective, scenarios will need to be updated regularly (potentially annually or biannually) to accurately reflect the remaining emissions budget based on actual world performance. Ultimately, underperformance in one or a few years will lead to more aggressive decarbonization targets across sectors in the next and vice versa.
• Technological progress: Transition scenarios, and ultimately the feasibility of decarbonization across sectors, is highly sensitive to the cost of decarbonization technologies. In recent years, these costs have evolved rapidly and in sometimes unexpected ways. Scenarios will need to model out the most up-to-date, full range of costs and expected cost declines for critical decarbonization technologies (perhaps biannually). As new breakthroughs occur, scenarios should reflect information that may shift the sectoral pathways that are most feasible for reaching net-zero.
• Policies: As countries announce new commitments or implement specific policy packages, these will change the distributional impacts across sectors and ultimately the feasibility of development and deployment of decarbonization technologies. Scenarios may need to be updated to identify how policy changes might affect long-term evolution of technologies critical for decarbonization and the appropriate burden-sharing across the economy.
68

Portfolio Alignment Team | Measuring Portfolio Alignment
these benchmarks and whether warming functions have a tendency to be more or less conservative than appropriately selected single-scenario benchmarks.
• In Key Judgement 2, the Portfolio Alignment Team notes that more granular benchmarks are needed to ensure hard-to-abate industries are not penalized. As benchmarks become more granular, however, dividing up the carbon budget in an analytically rigorous manner becomes more difficult; dynamics around which sector in the economy should decarbonize first on an economic, technological feasibility, or political economy basis becomes ultimately more subjective based on how scenarios are optimized. Ultimately, within the bounds of this exercise, the Portfolio Alignment Team was not able to test how the creation of more granular sector benchmarks that divide the same carbon budget can affect the final outcome. Further research could be done to determine how much differences in granular sector benchmarks used in alignment tools can affect the overall alignment assessment.
• Key Judgement 6 suggests blending multiple inputs, including targets, capacity plans, and historical emissions, to identify the likely future trajectory of investment counterparties. Doing this work in a manner that maximizes accuracy will require a true mix of art and science using quantitative techniques for forecasting as well as incorporation of qualified counterparty analyst judgement. As a result, data providers and financial institutions will likely arrive at a multitude of opinions about the short- and long-term trajectories of portfolio counterparties. As these projections are made, accuracy will be critically important. The predictive power of projections could be assessed year over year through back-testing, and transparency from data providers on the historical performance of estimates by year will be of use in selecting and refining appropriate datasets. More work is needed to determine how counterparty behavior is evolving by sector and geography to determine the appropriate manner of making assessments over longer time horizons.
Through collaborative work with financial institutions, regulators, data providers, and the COP26 platform, this paper has made first steps in transparently assessing the trade-offs of methodological decisions relating to portfolio alignment tool design. Yet in many cases, the impact of these decisions, and the fine-grain specifications for building out portfolio alignment tools in practice, needs continued examination. Our view is that portfolio alignment tools are highly sophisticated but are still nascent and evolving. Furthermore, getting to the “right” answer for assessing the impact of portfolios on the climate is a properly multi-stakeholder problem—requiring the open collaboration of financial institutions, data providers, nonprofits, and the scientific community.
In the context of this paper, the team relied on data provider questionnaires, consultation with experts, scientific research, emerging international standards, and logical analysis to make considerations on appropriate methods. These considerations were carefully calibrated to balance usability with scientific accuracy and focused on making considerations for which the advantages of specific design choices had a high burden of proof. However, these considerations and other, more detailed tool specifications in the future should ultimately be confirmed through open and transparent experimentation investigating design choice impact on tool performance. Several key areas of uncertainty were surfaced during the writing of this report that warrant specific, targeted further investigation through analytical testing and experiments. This section highlights those areas.
• In Key Judgement 1, the Portfolio Alignment Team notes that both single-scenario benchmarks and warming-function methods are technically viable, but suggest single-scenario benchmarks on the basis of their being simpler to construct accurately and more transparent to users. The Portfolio Alignment Team has not, however, tested the principle of whether these methods can in fact produce equivalent outcomes, and to their knowledge, the work has not been done to prove out this equivalence. Warming functions, as noted, may experience difficulty capturing cumulative emissions, for example. Further research could be done to specify how material the differences are between
3. Drive methodological convergence
69

Portfolio Alignment Team | Measuring Portfolio Alignment
• In Key Judgement 9, the Portfolio Alignment Team notes that different portfolio aggregation methods can affect the outcome of portfolio alignment tools. The Portfolio Alignment Team was not able to definitively determine how much, in what direction, or in which investment cases differences across portfolio aggregation methods can impact a portfolio alignment score. Further research could be done to measure how aggregation methods influence portfolio alignment.
• There is not currently an available portfolio alignment tool that complies with all the design considerations made in this document. Working prototypes consistent with this report’s considerations will need to be developed to test for potential interdependencies or conflicts in practice.
Without continued convergence on methodology, temperature scoring methods will continue to be subject to a high degree of variation across data providers. Yet to drive convergence, less uncertainty and greater transparency about the impacts of methodological decisions is needed. Through transparency on outcomes, the Portfolio Alignment Team believes that greater convergence, and ultimately more standardized portfolio alignment disclosures, will be possible in a manner useful for investors and stakeholders.
Consideration 26: To drive convergence, data and analytics providers should disclose their choices against the nine key judgements in this document and explain reasons for diverging from core considerations, as these will aid iteration and ultimately inform development of more refined standards.
70

Portfolio Alignment Team | Measuring Portfolio Alignment
Appendices

Portfolio Alignment Team | Measuring Portfolio Alignment
Arguably, methods of regression are some of the most powerful statistical methods, and consequently, regression is one of the most widely used statistical methods. Regression allows the capturing of various relationships between variables of interest. These variables are often categorized or termed “response variables” and “predictor variables” (e.g., the relationship between temperature (a response) and industry emissions intensity (a predictor). Regression or regression analysis traces the conditional distribution of the response as a function of the predictors.
The functional relationship between response and predictors is often assumed linear, but nonlinear functions are used as well. Multiple regression posits one response as a function of many predictors.
The predictors are assumed known and nonrandom (i.e., fixed values). By implication, the response is treated as random, following an error distribution (often posited as a normal distribution). For example, a measured or calculated emissions intensity (a predictor) is fixed and the temperature (a response) is assumed random that follows a normal distribution. In more complex regression forms, the predictors may be random and not fixed.
A key parameter of regression is the so-called loading or slope parameter, which is interpreted as the rate of change in the average response variable when a predictor changes by one unit. For example, a one-unit change (e.g., a one-ton CO2 emissions per barrel of oil intensity change) leads of an average temperature change given by the slope parameter.
In the canonical regression specification, the predictor and responses are assumed (1) linearly related with (2) constant variance with (3) independent and normally distributed errors.
Assumptions (1) and (2) are the most important to adhere to. Violations of linearity will yield biased parameter estimates and wrong inferences (i.e., the science of inferring population characteristics from representative and random statistical samples). Violations of nonconstant variance may result in inefficient estimators and wrong inferences. Violations of (3) are not as severe, especially mild violations, with respect to statistical inferences.
Violations of the canonical assumptions are termed “model misspecifications.” Model misspecifications may lead to incorrect goodness-of-fit conclusions (e.g., high adjusted R^2, small confidence intervals) about model performance. It will also affect model selection methods (e.g., AIC, forward step variable selection).
These assumptions are quite strong and demanding on the structure of data. Regression diagnostics (i.e., examination of regression model fit) and corrective methods (e.g., weightings and transformations) substantially improve the inference and meaning of the regression model and its components.
Appendix 1: Best practice in regression analysis
72

Portfolio Alignment Team | Measuring Portfolio Alignment
• The assumption of linearity in the regressions is questionable at best, as reduction rates, intensities, and absolute emissions do not follow a linear pattern. For example, there may be substantial gains in reducing emissions early on, as emissions efficiencies are easier to identify, while efficiencies are more difficult/expensive to identify and implement as the transition effort matures.
• These may be modeled as nonlinear growth curves, but require care in implementation.
• Practitioners must also be careful about variable omissions, as this may affect the regression mean function, and the corresponding inference. For example, counterparty size (e.g., vertical or horizontal integration) influences temperature, and omitting this counterparty characteristic in the warming regression may lead to an association that underestimates or overestimates the relationship (e.g., slope parameter).
Regression Applications:
• In applications, regressing the temperature outcomes on emissions measures (e.g., absolute, or intensities, or relative reductions) establishes so-called warming function. The warming function is a mathematical relationship that translates emissions measures into temperature scores. This is often assumed linear in nature.
• The temperature outcomes are based on various scenarios, or pathways, which are climate science–based. They also include various socioeconomic variables. These are deterministic in nature (e.g., not statistical random samples). Thus, one of the basic assumptions of canonical linear regression is not met (e.g., the response is random, and typically follows a normal distribution). This misspecification leads to the wrong inference.
• The notion of emissions metrics and various scopes (e.g., Scope 1, Scope 2) not being a random statistical sample does not violate the assumptions of linear regression, as noted above.
References:
Anderson, William and Martin T. Wells. “Numerical Analysis in Least Squares Regression with an Application to the Abortion-Crime Debate.” Journal of Empirical Legal Studies 5(4): 647–681, 2008.
Bates, Douglas M. and Donald G. Watts. Nonlinear Regression Analysis and Its Applications. Wiley Series in Probability and Statistics, 1988.
Kutner, Michael H., Christopher J. Nachtsheim and John Neter. Applied Linear Regression Models, 4th Edition. McGraw-Hill/Irwin, 2004.
73

Portfolio Alignment Team | Measuring Portfolio Alignment
Appendix 2: “Fair-share carbon budget” benchmark approach
As mentioned in Judgement 3, convergence benchmarks must be formulated in emissions intensity terms, unless the industry-level absolute benchmark can be normalized to a counterparty level. One approach for doing so is shown in the chart: It derives a counterparty-specific absolute benchmark by comparing the ratio between the industry benchmark’s emissions intensity and the counterparty’s emissions intensity.
Objects definition Variables definition
Counterpary i Emissions of the counterparty i in the year Y
Segment benchmark (made of the universe of counterparties i)
Emissions of the benchmark i in the year Y
Counterparty-specific benchmark associated with the counterparty i and the segment benchmark B
Denominator of the counterparty i in the year Y (e.g., production, energy consumption, revenue)
YearDenominator of the benchmark i in the year Y (e.g., production, energy consumption, revenue)
Baseline yearEmissions intensity of the counterparty i in the year Y
Emissions intensity of the benchmark i in the year Y
In order to build a counterparty-specific benchmark in absolute terms, first, the industry benchmark and counterparty emissions intensities are compared in the baseline year 0, which are expressed as the ratio of their respective absolute emissions and denominators in year 0.
Then the counterparty-specific benchmark starting point in year 0 is built in absolute terms, starting at the counterparty’s absolute emissions in year 0, adjusted with the ratio of the benchmark’s emissions intensity with the counterparty’s emissions intensity in year 0.
74

Portfolio Alignment Team | Measuring Portfolio Alignment
Projecting over time, the counterparty-specific benchmark can then evolve following the same trend as the benchmark, which is equivalent to multiplying the counterparty-specific benchmark’s absolute emissions in year 0, with the segment benchmark’s absolute emissions in year Y, divided by the segment benchmark’s absolute emissions in year 0.
This formula can then be simplified:
Summing across all counterparties i in the universe of the benchmark B allows to check whether the sum of the counterparty-specific benchmarks’ absolute emissions equals the segment benchmark’s absolute emissions.
Considering that the segment benchmark is made of the universe of the counterparties i, the sum of the counterparties’ denominators is equal to the segment benchmark’s denominator in year 0.
Developing the previous formula confirms that the sum of the counterparty-specific benchmarks’ absolute emissions equals the segment benchmark’s absolute emissions. As a consequence, the segment carbon budget is respected when creating counterparty-specific benchmarks following this approach.
75

Portfolio Alignment Team | Measuring Portfolio Alignment
The transient climate response to cumulative carbon emissions (TCRE) is defined as the global mean surface temperature increase in response to a given quantity of cumulative anthropogenic carbon dioxide emissions. Quantifying this relationship is possible because surface warming is a linear function of cumulative emissions, given the magnitude of the logarithmic relationship between atmospheric CO2 and warming is approximately the same as the exponential relationship between human emissions and atmospheric concentration (due to the saturation of natural carbon sinks).47
Critically, the TCRE applies only to warming from carbon dioxide (or carbon dioxide equivalent quantities of long-lived gases), but does not apply to short-lived gases like methane, which must be accounted for separately.
Tactically, the TCRE allows a user to translate a given carbon budget overshoot into incremental temperature rise above and beyond the respective warming target. (Or, equally, subtract incremental warming from a given target if the world has emitted less than the allotted carbon budget.) When using the TCRE to derive counterparty- or portfolio-level warming scores, financial institutions must make the assumption that the rest of the world will exceed its respective proportion of the carbon budget by the same ratio as the entity in question. For example:
implied temperature rise score = (global historical emissions x TCRE + global remaining carbon budget x TCRE + global carbon budget overshoot x TCRE) + non-CO2 warming correction factor
The Intergovernmental Panel on Climate Change (IPCC) provides an estimate of TCRE values in its fifth assessment report which will shortly be updated with the release of the forthcoming sixth assessment report: 0.8°C – 2.5°C per 1,000 GtC, with a central tendency of 2°C per 1,000 GtC, or 2°C/3,670 GtCO2, yielding 0.000545°C per GtCO2.48 The IPCC also provides values for the relevant short-lived pollutant correction factors in its Special Report on Global Warming of 1.5°C.49
Appendix 3: TCRE multipliers
47 IPCC, Climate Change 2013: The Physical Science Basis, 2013.48 Ibid.49 Forster, Huppmann, Kriegler, et al., “Mitigation Pathways Compatible with 1.5°C in the Context of Sustainable
Development Supplementary Material.” In: Global Warming of 1.5°C. An IPCC Special Report on the impacts of global warming of 1.5°C above pre-industrial levels and related global greenhouse gas emission pathways, in the context of strengthening the global response to the threat of climate change, sustainable development, and efforts to eradicate poverty. Figure 2.SM.4, based on the linear regression relationship established between peak temperature relative to 2006–2015 and non-CO2 warming relative to 2006–2015 at the time of net-zero emissions performed over a set of 205 scenarios, 2018.
76

Portfolio Alignment Team | Measuring Portfolio Alignment
Counterparties may report targets in different ways, and may report more than one target. Targets may be set on a selection of gases without a breakdown provided, or may only apply to a portion of the business, with room for interpretation (e.g., if a counterparty reports only Scope 3 emissions from business travels, teams developing methods should not estimate the rest of the Scope 3 and apply the target to the whole Scope 3). Targets may also be based on other metrics than emissions (e.g., on the share of renewables in the electricity mix sources). Emissions targets may either be set in absolute or intensity terms, and while it may be possible to convert between absolute and intensity emissions, this would require assumptions on projecting future performance on physical or economic activity levels.
There is not one way to interpolate or extrapolate a given target. Many factors may determine the future progress toward alignment. Progress toward alignment is likely not linear; counterparties may make progress in steps. A counterparty may start with the “easiest” decarbonization levers, with more expensive levers left for future efforts. On the other hand, the more
an industry progresses toward alignment, the more likely levers are to go down the learning curve and to become available, scalable, or cost effective.
Even if one decided to interpolate or extrapolate a target linearly, there is not only one way to do so. In particular, there may be more than two data points to interpolate between the baseline, the target, and the recent performance reporting, as described in the figure. In particular, if a counterparty is progressing faster than the pace set by its target, it may be planning to set a new target soon and should not necessarily be “penalized” by its current target. If a counterparty is progressing more slowly than the pace set by its target, should it still be projected as if it were to converge to its target? An approach may be to consistently interpolate performance between last reported performance and target performance in all cases, and to weight this trend with other trends (as described in Judgement 6), potentially by comparing the historical pace and the pace to converge to the target, alongside other elements.
Appendix 4: Emission target extrapolation approaches
Example of Options to Interpolate or Extrapolate a Counterparty’s Performance Between a Baseline and a Target
Perf
orm
ance
Year
Baseline year
Baseline performance
Target performance
Last reported year
Target year
Reported performance
Pace to converge to the target
Pace set between the baseline and the target
Historical pace
77

Portfolio Alignment Team | Measuring Portfolio Alignment
BENCHMARK The term "benchmark" is used throughout this document to refer to a level or pathway of emissions over time that describes what would need to be true in order for a given actor’s actions to be aligned with a desired warming outcome. Benchmarks can be built at a global level (e.g., this is what global emissions need to do over time to limit warming to below 2°C), at an intermediate level (e.g., this is what a given sector’s emissions need to do over time to limit warming to below 2°C), or at an individual counterparty level.
CLIMATE-RELATED TARGET Is a specific level, threshold, or quantity of a metric that the organization wishes to meet over a defined time horizon in order to achieve the organization’s overall climate-related ambition and strategy.
CLIMATE SCENARIO Climate scenarios refer to a simplified and hypothetical mathematical description of a possible future evolution of the global coupled energy-economy system. A scenario could include variables that describe, for example, the future evolution of GDP of specific regions, countries, or industries, as well as the evolution of the different green house gas (GHG) emissions associated with said production. Climate scenarios can be used to inform risk analyses, where a group of scenarios are analyzed to determine a broad range of possible future outcomes, or to serve as normative guides (e.g., to build benchmarks), which help describe the specific actions that need to be taken in order to achieve a specific outcome.
COUNTERPARTY Throughout this document, the term “counterparty” is used to refer to any individual enterprise that can be owned, managed, lent to, insured, or otherwise provided financial services to by a financial organization.
CUMULATIVE EMISSIONS The propensity of greenhouse gases produced by human society are long-lived—this means they accumulate in the atmosphere over time. As a result, global warming is a function of cumulative emissions—that is, the amount of warming we experience will be determined by the sum of all long-lived GHG emissions released from the beginning of the industrial revolution (when we started emitting GHGs) to the moment net-zero emissions are reached. In other words, to stop warming at any level, we need to reduce emissions to net-zero, and the amount we emit before then determines how warm it gets.
EMISSIONS SCOPE The emissions produced by a given actor can be divided into three types or “scopes.” Scope 1 refers to all direct GHG emissions. Scope 2 refers to indirect GHG emissions from consumption of purchased electricity, heat, or steam. Scope 3 refers to other indirect emissions not covered in Scope 2 that occur in the value chain of the reporting counterparty, including both upstream and downstream emissions. Scope 3 emissions could include the extraction and production of purchased materials and fuels, transport-related activities in vehicles not owned or controlled by the reporting entity, electricity-related activities (e.g., transmission and distribution losses), outsourced activities, and waste disposal.
FINANCED EMISSIONS Financed emissions are the greenhouse gas emissions that are associated with a given loan or provision of financial services to a counterparty. For example, if a bank extends a loan to an oil and gas firm, and that firm produces a set amount of greenhouse gasses, the financed emissions of the bank will then include a fraction of its counterparty’s emissions (generally proportional to the ratio between loan size and total counterparty value (e.g., the percent of total financing provided by the bank).
Appendix 5: Glossary
78

Portfolio Alignment Team | Measuring Portfolio Alignment
PARIS-ALIGNED A counterparty can be referred to as “Paris-aligned” if they are reducing emissions in line with a benchmark or emissions pathway associated with a well-below 2°C climate scenario. For example, if a forward-looking climate scenario associated with 1.5°C states that emissions for a given counterparty must be reducing at 7% year over year between 2020 and 2025, and that counterparty is achieving an annual 7% reduction in emissions, it is Paris-aligned. Paris-aligned does not mean that net-zero emissions have been achieved, unless the assessment of alignment is taking place in the year that net-zero emissions need to occur according to the reference climate scenario.
PORTFOLIO ALIGNMENT Portfolio alignment refers to the action of assessing the net-zero transition progress of the individual counterparties that make up a given financial portfolio, and determining whether or not, at an aggregate level, that group of counterparties are collectively Paris-aligned. In other words, it is possible to construct a portfolio that contains both Paris-aligned and non-Paris-aligned counterparties, which, in aggregate, is Paris-aligned, as the respective magnitudes of alignment and misalignment balance out. Achieving and maintaining portfolio alignment is necessary for a financial institution to be compliant with the goals of the Paris Agreement.
PORTFOLIO ALIGNMENT TOOL A portfolio alignment tool is an analytical model that allows financial institutions to measure the alignment of their individual counterparties with the goals of the Paris Agreement, and determine whether or not they themselves are Paris-aligned at an aggregate portfolio level.
FORWARD-LOOKING METRIC Forward-looking metrics are created by using historical emissions to extrapolate or project future trends. These metrics are critical for the management of financed emissions targets, as they allow financial institutions to compare expected counterparty performance with a respective Paris-aligned benchmark, and in so doing identify the counterparties with which they need to engage in order to improve the alignment of their overall portfolio with the goals of the Paris alignment. For example, a counterparty that has a lower emissions profile than its peers today may not have sufficient future targets and capital plans to achieve Paris alignment, while an underperforming firm today may be taking the necessary action to reduce emissions going forward.
FINANCIAL ORGANIZATION This report uses the term "financial organization" to refer inclusively to banks, asset managers, asset owners, insurance companies, and central banks and supervisors. This is because these institutions are often both the preparers and users of portfolio alignment information. In some cases, these institutions may outsource the preparation of portfolio alignment information to external method providers, but for the purposes of readability those method providers will also be referred to under the blanket term “financial organization.”
NET-ZERO Net-zero refers to a state in which human-caused additions and removals of long-lived greenhouse gasses to and from the atmosphere are balanced. When net-zero is achieved the amount of greenhouse gasses in the atmosphere cease increasing, and so warming likewise stops.
PARIS AGREEMENT The Paris Agreement is a legally binding international treaty on climate change. It was adopted by 196 Parties at COP 21 in Paris, on December 12, 2015, and entered into force on November 4, 2016. The Agreement stipulates that the involved parties will take the necessary actions to limit further increases in global average temperatures to well below 2°C and ideally to below 1.5°C.
79

Portfolio Alignment Team | Measuring Portfolio Alignment
Allen, et al. “A solution to the misrepresentations of CO2-equivalent emissions of short-lived climate pollutants under ambitious mitigation.” June 4, 2018. https://www.nature.com/articles/s41612-018-0026-8.
European Commission, Directorate-General for Financial Stability, Financial Services and Capital Markets Union. “EU Climate Transition Benchmarks and EU Paris-aligned Benchmarks.” July 17, 2020. https://eur-lex.europa.eu/legal-content/EN/TXT/?uri=CELEX:32020R1818.
European Union Technical Expert Group on Sustainable Finance. Interim Report on Climate Benchmarks and Benchmarks’ ESG Disclosures. June 2019. https://ec.europa.eu/info/sites/default/files/business_economy_euro/banking_and_finance/documents/190618-sustainable-finance-teg-report-climate-benchmarks-and-disclosures_en.pdf.
Greenhouse Gas Protocol. Required Greenhouse Gases in Inventories: Accounting and Reporting Standard Amendment. February 2013. https://ghgprotocol.org/sites/default/files/standards_supporting/Required gases and GWP values_0.pdf.
Institut Louis Bachelier, et al. The Alignment Cookbook - A Technical Review of Methodologies Assessing a Portfolio’s Alignment with Low-carbon Trajectories or Temperature Goal. 2020. https://www.louisbachelier.org/wp-content/uploads/2020/10/cookbook.pdf.
Intergovernmental Panel on Climate Change (IPCC). Climate Change 2013: The Physical Science Basis. 2013. https://www.ipcc.ch/report/ar5/wg1.
IPCC. Climate Change 2014: Synthesis Report. 2014. https://www.ipcc.ch/report/ar5/syr.
IPCC. Special Report: Global Warming of 1.5°C. 2018. https://www.ipcc.ch/sr15.
MSCI. “Scope 3 Carbon Emissions: Seeing the Full Picture.” September 17. 2020. https://www.msci.com/www/blog-posts/scope-3-carbon-emissions-seeing/02092372761.
PCAF. The Global GHG Accounting and Reporting Standard for the Financial Industry. November 18. 2020. https://carbonaccountingfinancials.com/standard.
Portfolio Alignment Team. Measuring Portfolio Alignment. November 2020. https://www.tcfdhub.org/wp-content/uploads/2020/10/PAT-Report-20201109-Final.pdf.
Rogelj, et al. “Estimating and tracking the remaining carbon budget for stringent climate targets.” 2019. https://www.nature.com/articles/s41586-019-1368-z.
Task Force for Climate-related Financial Disclosures. The Use of Scenario Analysis in Disclosure of Climate-Related Risks and Opportunities. June 2017. https://assets.bbhub.io/company/sites/60/2021/03/FINAL-TCFD-Technical-Supplement-062917.pdf.
Appendix 6: References
80

Portfolio Alignment Team | Measuring Portfolio Alignment
For more information, please visit fsb-tcfd.org
Nothing in this document constitutes an offer or a solicitation of an offer to buy or sell a security or financial instrument or investment advice or recommendation of a security or financial instrument. The Task Force on Climate-related Financial Disclosures believes the information herein was obtained from reliable sources but does not guarantee its accuracy. Copyright 2021 The Task Force on Climate-related Financial Disclosures.