measuring rail station catchment areas in the greater dublin area … 1.pdf · measuring rail...
TRANSCRIPT

Proceedings of the
ITRN2012 29-30th August 2012 University of Ulster Harrison, O’Connor: GDA Rail Catchment Areas
MEASURING RAIL STATION CATCHMENT AREAS IN THE GREATER
DUBLIN AREA Mr. Oran Harrison BSc Spatial Planning Graduate DIT Mr. David O’Connor Lecturer DIT Abstract This paper sets out to study the relevance of techniques used in Irish planning to determine walking catchments of rail corridors and identify the implications of this for the planning system. Within Irish Planning the Euclidean method (a circle on a map) tends to be the most accepted means of determining a rail station’s walking catchment and assumes a walkable distance of 1km to all stations as set out in Department of Environment Heritage and Local Government (DoEHLG) guidelines, 2009. Research shows that there is limited literature available concerning the relevance of the method and the measurements used in Ireland. The study consists of a user survey being undertaken at 8 rail stations in Dublin, with stations on both a heavy rail and a light rail system, the Dart and Luas respectively .The bulk of the research consists of questionnaire and observational surveys being carried out at each station. Detailed analysis of results provided the following findings and conclusions:
• Different travel patterns appeared between people accessing heavy rail transit (HRT) and those accessing light rail transit (LRT);
• Walking catchments are significantly affected by the provision of other competing transit networks and the distance of a station relative to the urban centre;
• 1km is not an overriding walking distance that can be applied to every rail network; • The ArcGIS Network approach of mapping real walking catchments is a much more
effective method than the more commonly used Euclidean method. 1. Introduction Sustainable development is one of the main goals of modern planning worldwide. The Irish National Spatial Strategy 2002 (NSS) definition of sustainable development includes “maximising access to and encouraging use of public transport, cycling and walking”. Where the planning of rail corridors is complemented with higher housing densities and a mix of uses clustered around stations it leads to walkable, less car dependant neighbourhoods within a station’s catchment. But what is a rail station’s catchment and, as planners, how do we make the most of opportunities these catchments present for sustainable development? Irish planning traditionally uses 1km as the walkable catchment distance for HRT and LRT. This has three large effects on our planning system:
• To make best use of expensive pieces of infrastructure and to promote sustainable settlement patterns higher densities are encouraged by the Department of the Environment Community and Local Government (DoECLG) through planning guidelines published in “Sustainable Residential Development in Urban Areas” (2009).
• Under sections 48 and 49 of the Planning and Development Act (2000), supplementary development contributions (SDC’s) can be levied by Local Authorities (LA’s) on developments that will directly benefit from the provision of new or planned rail infrastructure. This is judged on whether the proposed development is within the future catchment of the rail infrastructure.
Harrison, O’Connor: GDA Rail Catchment Areas 29-30th August 2012 University of Ulster
Proceedings of the
ITRN2012
• The majority of people arrive at rail stations by foot and, if it is assumed that anyone
within 1km of a planned station is within its walkable catchment, the decision to build very expensive infrastructure in a certain location can be based on that premise, correctly or otherwise.
Now more than ever it is important that limited resources are invested for maximum benefit. With that in mind this paper is based upon research that seeks to investigate:
• What international practice is in relation to walking catchment areas for rail transport; • Whether 1km is a realistic distance people are willing to walk to rail stations; • The differences, if any, between light rail and heavy rail walking catchment areas; • If walking catchment distances change relative to distance from the urban centre/
choice of public transport; • Whether a circle on a map is the most relevant way of mapping catchment areas.
2.1 Literature Review - Rule of Thumb Many Irish transport and land use planners use a rule of thumb that states the majority of people are willing to walk 1km to rail services. This walking catchment is generally utilised by planners in Ireland as a circle, with a 1km radius, on a map centred on a rail station. There is very little documented research on the origins or relevance of this method in Ireland and yet this seemingly unproven rule of thumb is the basis for many planning policies in Ireland, DoEHLG [1]. A DTO report on travel demand management in Dublin city identifies the main obstacle to walkability that emerged as traffic, car parks, etc. in other words car related activities [2]. From the literature it is clear that if these and other obstacles are not addressed then people will continue to drive regardless of supposed catchment rules. Most planning systems internationally use a distance of 800m to measure a rail station’s walkable catchment area [3], with 90% of potential passengers ideally living or working within this distance. Ker and Ginn [3] show that a one size fits all catchment distance is irrelevant even within a single city as their results found that distances walked to suburban stations were shorter (800m) than those to inner urban stations(1km). There are also questions raised about the ridership bonus assigned to living near to a rail station. Is it due to proximity or the nature of people who decided to live there? People could likely move into an area to be close to a rail station so they may be inclined to walk even if they lived further away [4]. 2.2 Supplementary Development Contributions (SDC’s) Under Section 48 and 49 of the Planning and Development Act, 2000, SDC schemes are set up in order to facilitate a specific infrastructure project that will benefit developments on which the levy is imposed. These benefits include higher property values and also the allowance of higher densities within the project’s catchment area. Weinstein and Clower [5] showed property values within 400m of Dallas Rapid Area Transit rail stations were 15% higher than a control group of properties. The 2009 SDC [6] produced for the proposed Metro West rail line puts in context some of the topics being researched. The area for the scheme is based on a 1km walking catchment not from the stations but the entire corridor. When deciding the levy to be imposed on development the scheme implements a one size fits all charge on any development within the catchment regardless of walkability, as such a development 50m from the station with easy pedestrian access will pay the same per residential unit as a development 1km away with no direct walking access. Waters [7] notes that if levies are unfairly high they act as a disincentive towards development. However prior to this legislation significant costs were being imposed on Local Authorities to provide infrastructure and so SDCs are a necessary part of our planning system [8]. The sources fail to recognise the role a more detailed approach to walking catchment analysis could play in fairer more effective SDC schemes.

Proceedings of the
ITRN2012 29-30th August 2012 University of Ulster Harrison, O’Connor: GDA Rail Catchment Areas
2.3 Increased Densities If planned properly HRT and LRT hubs could support higher densities in turn offering a more viable alternative to the private car. At the same time, rail networks are generally regarded as needing a critical mass of population to remain operational and so higher densities are needed in rail catchment areas e.g. 60 u/hectare within an 800m radius is the minimum density recommended for a tram service in the UK [9]. In a similar vein of thought, Ireland’s planning guidelines in relation to sustainable residential development recommend that higher densities be promoted within existing or planned transport corridors leading to minimum net densities of 50 u/hectare being encouraged within 1km of a rail station and also maximum, as opposed to minimum, parking standards be applied [1]. Rudlin and Falk [10] claim that a density of 240 persons per hectare is required to support a tram service (roughly 100 u/hectare based on Irish household sizes). Mees [11] refutes this argument by pointing out that by this logic no suburban area of Europe could support a tram service; the Luas should not exist in Dublin. Mees [11] and Dittmar and Ohland [12] agree that where increased densities are located they should be within walking distance of transport hubs.. Barton et al. [13] point out that even if a rail station does not require high densities to be viable other facilities such as post offices require a population of roughly 5,000 to remain operational. According to Barton et al. [13] higher densities and a clustering of uses would shrink the catchment area required e.g. by increasing densities by 20 u/hectare the needed catchment area is decreased by 100m. Smaller catchment areas with a higher concentration of facilities would lead to a larger walking modal share.
2.4 Circles on a Map The Euclidean method of measuring a rail station’s catchment, a circle on a map, is widely discredited in most literature; the failure of it to allow for natural and manmade obstacles means a more detailed method is required for accurate results [14]. Landex and Hansen [14] recommend the Network Analyst approach of mapping the real walking routes along the street network to the station. They map the catchments for rail stations in Copenhagen using both methods to show how the Euclidean method’s inability to take rivers into consideration leads it to include areas with no actual access to the stations whereas the Network Analyst approach identifies these obstacles and makes the relevant changes to the catchment area. The Euclidean method can often have a detour factor built into it e.g. even if people are willing to walk 1km the circle will have a 800m radius to take account of obstacles. Once again however Landex and Hansen [14] point out that a one size fits all detour factor is not useful because as the urban grain of areas differ so would the detour times. Ker and Ginn [3] point out that even in areas of high pedestrian permeability, e.g. inner city neighbourhoods, circular walking catchments still only reach 60% efficiency which drops as low as 10% in poorly connected, often outer suburban, areas. Actual walking routes are rarely as direct as the Euclidean method assumes meaning that the actual catchment area is smaller than expected; if the actual walking route is a third longer than the Euclidean method uses then the actual catchment radius is 75% of the original assumption and the actual population could be 56% of that projected. Barton et al. [13] support the use of the Network Analyst approach to map the real routes travelled and as such better plan the location of public facilities including rail infrastructure. 2.5 Distance Relative to the Urban Centre The need to access public transport by another mode such as walking means that behaviour is affected by the different development patterns around stations. Cervero et al. [15] show that as the distance to the urban centre changes so do the walking catchment distances of rail stations and also the modal split used to arrive at stations. In suburban areas furthest from the city centre walking catchment distances were 3 to 4 times longer than inner urban areas and 8 to 10 times longer than the city centre itself. In suburban neighbourhoods the driving catchment was larger and the modal share for accessing the stations by car was highest. As the rail line got closer to the urban centre walking slowly became the dominant access mode even though the catchment area was shrinking. This is backed by O’Sullivan and Morrall [16] who noted that walking catchment areas shrunk at inner urban stations. However walking distances in the city centre rose again as people walked almost
Harrison, O’Connor: GDA Rail Catchment Areas 29-30th August 2012 University of Ulster
Proceedings of the
ITRN2012
irrespective of distance, so the home-to-station trip is most important in judging catchment areas. 2.6 Differences in Accessing LRT and HRT Outside of Ireland planning bodies generally use shorter walking distances for LRT than HRT e.g. The VicUrban Charter [17] uses an 800m catchment for HRT and 400m for LRT. The main difference in terms of access that became apparent is HRT’s grade separation from the road network and as such platforms must be entered through a station / turnstiles while LRT is not generally grade separated and so platforms are walk on accessible usually from any angle. This can greatly decrease a HRT station’s catchment. Landex and Hansen [14] demonstrate how a 200m long HRT station with an entrance at only one end could increase its walking catchment by 20% if a second entrance was added at the far end of the station. LRT catchments already have this extra 20%. 2.7 Conclusions of Literature Review The main issues raised from the review of relevant literature are:
• International practice is generally more detailed and much more research has been done than in relation to Irish transport catchment planning.
• The current Euclidean method could lead to increased densities in unsuitable locations and overcharging by LAs of developers in the form of inaccurate SDC schemes. Mapping true walking routes appears to be a more effective method.
• Literature has both confirmed and debunked the 1km walking catchment distance in many locations worldwide as such a more in-depth study is needed of the distances Irish people are willing to walk to access transport.
• There is evidence of changes to station access patterns as rail lines progress from outer suburban areas through inner suburban areas to the urban centre.
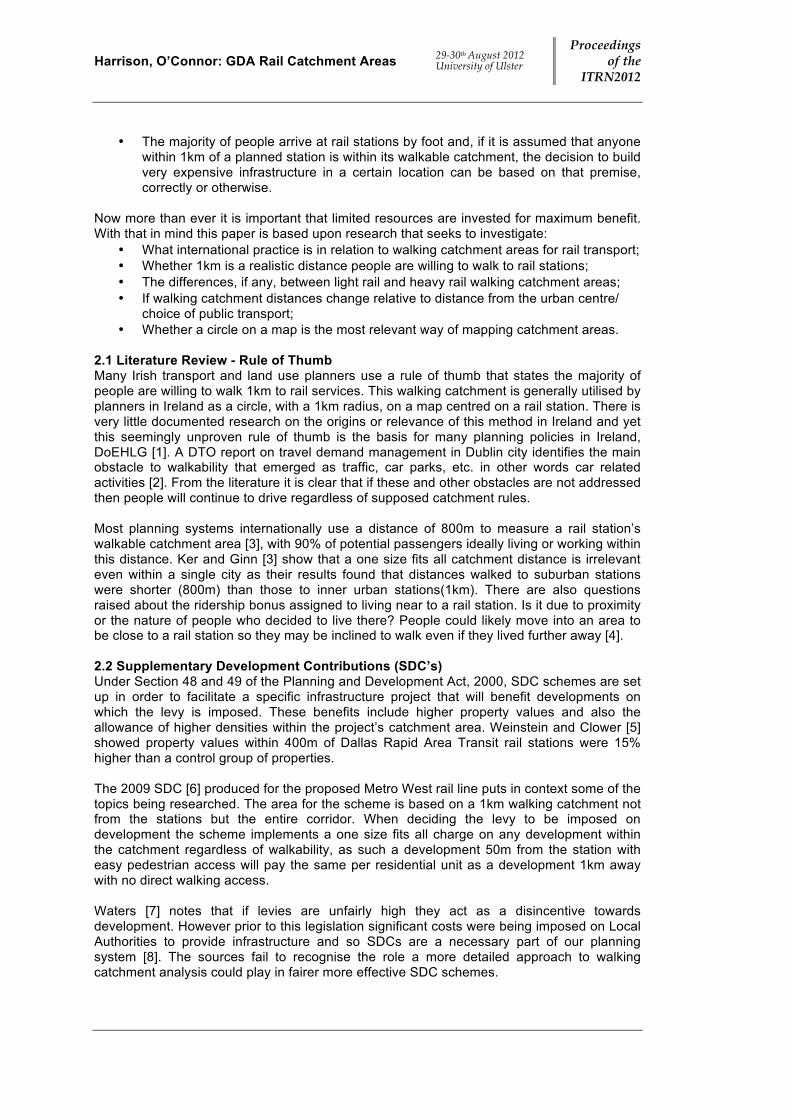
3.1 Methodology - Research Design The Luas Green Line LRT and Southside Dart HRT systems in Dublin were selected for comparison in order to test some of the above tendencies in an Irish urban environment. These networks were chosen as both are comparable, fixed line rail networks that run through similar socio-economic areas of South Dublin city. The Southside Dart line is connected to the national and commuter rail network while the Luas Green line is unconnected to other lines. The major differences are carrying capacity and frequency with the Dart being less frequent but having a higher carrying capacity than the Luas. These differences are typical of LRT and HRT. It was decided that four comparable stations on each line would be an appropriate sample. The city was split into four bands that were comparable in relation to distance from the city centre, urban grain, service provision and public transport availability. One station per rail system was selected in each band. Band 1 - Outer Suburbs: Dormitory areas over 8km from the city centre consisting of low density housing (roughly 30 u/hectare) with only basic shopping facilities nearby and limited competing public transport (each has only one bus route serving the city centre). Band 2 - Suburban Centre: Between 3-8km from the city centre with high density housing in the immediate vicinity (60 u/hectare) and a sizeable retail element serving the surrounding low density (35 u/hectare) neighbourhoods (e.g. Dundrum shopping centre near Balally). Served by multiple bus routes including at least one Quality Bus Corridor (QBC). Band 3 - Inner Suburbs: Within 3km of the city centre consisting of mature medium density housing (40 u/hectare) interspersed with apartment developments. Nearby small scale retail with multiple bus routes serving the city centre including at least one QBC. Band 4 - City Centre: Office districts in the city centre containing many large employers (e.g. Google) and high density apartment developments (60 u/hectare). Served by numerous bus routes and other rail services (e.g. both stations are within 1km of Wilton Place).
Proceedings of the
ITRN2012 29-30th August 2012 University of Ulster Harrison, O’Connor: GDA Rail Catchment Areas
3.2 Data Collection The primary form of data collection was through the use of questionnaire surveys responded to by 50 rail users at each station. Surveys in bands 1-3 were carried out at 8:00 at each station to capture the morning peak. The surveys in band 4 were carried out at 17:00 to capture the evening peak. Data therefore reflected how the public arrived at rail stations from both home and work. The survey collected the following data:
• How people arrived at the station; • How long it took people to get to the station; • Where they arrived from e.g. what road; • The maximum distance they would be willing to walk to the station; • Obstacles to their walk to the station; • Whether the proximity of the station influenced people’s decision to live nearby; • Which mode of public transport would they be willing to walk furthest to.
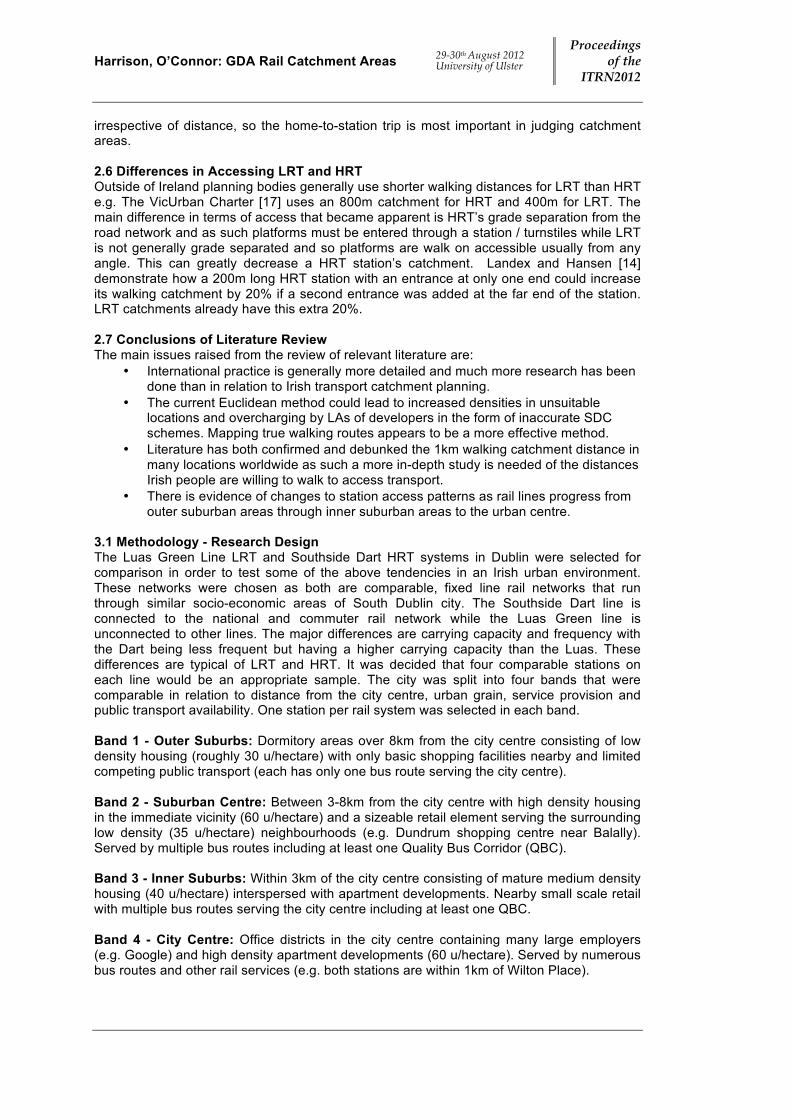
Observational surveys were made during station visits, providing information in relation to obstacles to pedestrian movement, local trip generators, whether shelter and seating provision is sufficient to deal with peak demand etc. 3.3 Data Analysis Tables of average walked distances were drawn up for each station. Once all surveys were completed, charts were drawn up to compare differences between the two corridors and the different patterns between the bands. For further analysis of data Ordnance Survey Ireland (OSI) street maps were used to map out 1km/500m circular buffer catchments and true walkable catchments and to map the distribution of walking trip origins. ArcGIS Network is a multi-functional application which in this case was used to calculate walking-line catchment areas through-out the given urban grain of each study area. 4.1 Results - Effectiveness of the Euclidean Method Figures 4.1 to 4.4 show the differences between the ArcGIS Network method and Euclidean method of measuring catchment areas. In Bands 1 and 2, particularly (outer and central suburban areas), poor urban grain restricted pedestrian access to the stations. This generally took the form of cul-de-sacs and walls/fences in between public spaces for often very little apparent reason.
Map 3.1: Distance Bands for Rail Lines in South Dublin Shankill
The Gallops
Dun Laoghaire
Mount Merrion
Balally
Ranelagh
Grand Canal Dock Harcourt Street

Harrison, O’Connor: GDA Rail Catchment Areas 29-30th August 2012 University of Ulster
Proceedings of the
ITRN2012
Figure 4.1: Ranelagh station catchment Figure 4.2: Grand Canal Dock station catchment
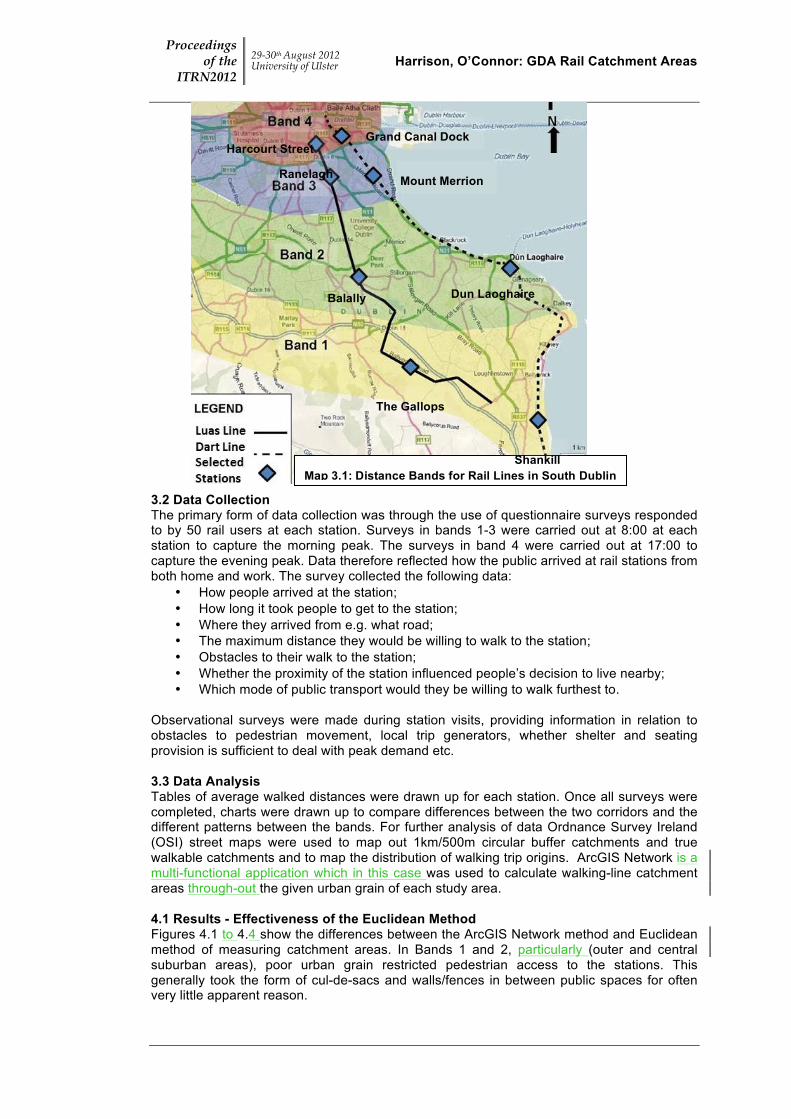
Figure 4.3: Balally station catchment Figure 4.4: Dun Laoghaire station catchment
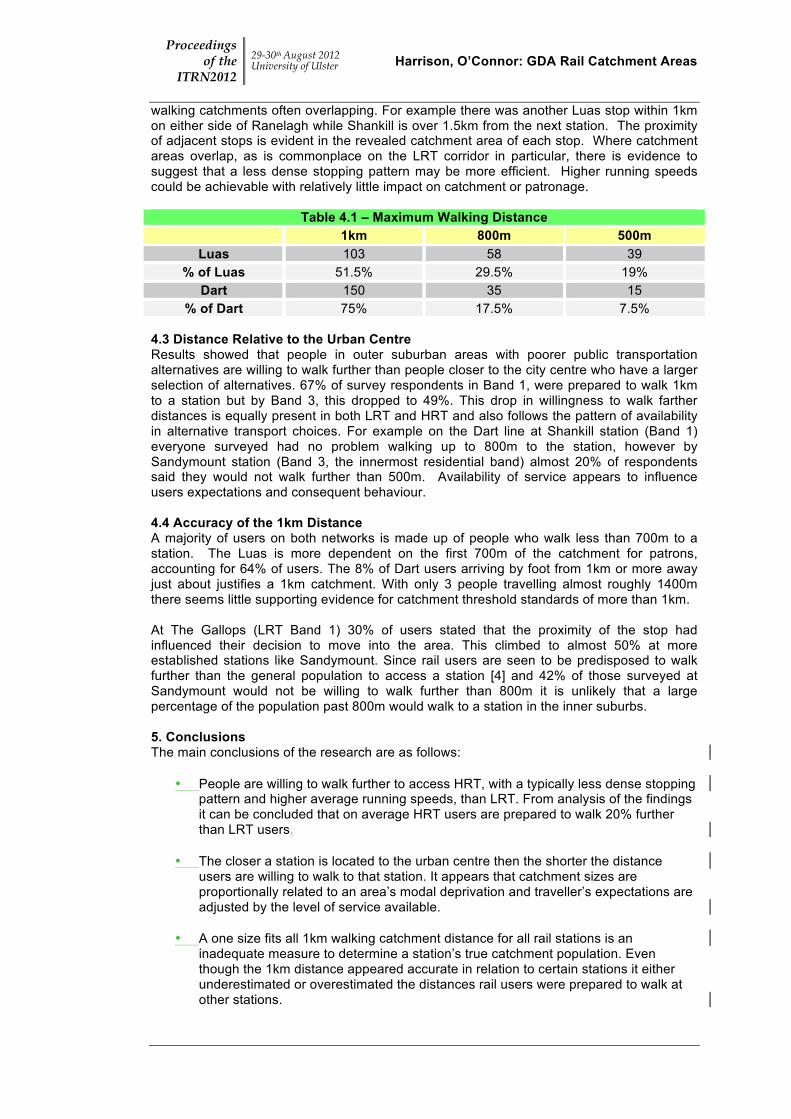
The Euclidean method of mapping catchments did not see this as affecting the walking catchment however the ArcGIS Network approach identified this obstacle and effects. Even in permeable street layouts drawing a circle on a map meant including areas that were proven not to be within the catchment by ArcGIS mapping (figures 4.1 and 4.2). 4.2 Heavy Rail vs. Light Rail Research indicated that people were willing to walk further to access HRT stations than LRT stations; 82% of those surveyed at Shankill were willing to walk 1km or more to the station whereas only 52% of people at The Gallops were willing to walk 1km to that station. This point is further illustrated in Table 4.1. Table 4.1 shows that half of Luas users would be willing to walk 1km to their stop compared to 75% of Dart users. The actual distance walked by pedestrian users of the Luas who answered the survey is also much shorter than that of Dart users. 78 people surveyed at Luas stops had walked less than 400m while only 43 Dart users had walked less than 400m. This can be attributed to Luas stops being situated closer together than Dart stations with
Walking Trip Origins
1km+
700m-1km
<700m
KEY
1km Radius
500m Radius
Rail Station
1km Walkable Catchment
500m Walkable Catchment
Rail Line
N
Proceedings of the
ITRN2012 29-30th August 2012 University of Ulster Harrison, O’Connor: GDA Rail Catchment Areas
walking catchments often overlapping. For example there was another Luas stop within 1km on either side of Ranelagh while Shankill is over 1.5km from the next station. The proximity of adjacent stops is evident in the revealed catchment area of each stop. Where catchment areas overlap, as is commonplace on the LRT corridor in particular, there is evidence to suggest that a less dense stopping pattern may be more efficient. Higher running speeds could be achievable with relatively little impact on catchment or patronage.
Table 4.1 – Maximum Walking Distance 1km 800m 500m
Luas 103 58 39 % of Luas 51.5% 29.5% 19%
Dart 150 35 15 % of Dart 75% 17.5% 7.5%
4.3 Distance Relative to the Urban Centre Results showed that people in outer suburban areas with poorer public transportation alternatives are willing to walk further than people closer to the city centre who have a larger selection of alternatives. 67% of survey respondents in Band 1, were prepared to walk 1km to a station but by Band 3, this dropped to 49%. This drop in willingness to walk farther distances is equally present in both LRT and HRT and also follows the pattern of availability in alternative transport choices. For example on the Dart line at Shankill station (Band 1) everyone surveyed had no problem walking up to 800m to the station, however by Sandymount station (Band 3, the innermost residential band) almost 20% of respondents said they would not walk further than 500m. Availability of service appears to influence users expectations and consequent behaviour. 4.4 Accuracy of the 1km Distance A majority of users on both networks is made up of people who walk less than 700m to a station. The Luas is more dependent on the first 700m of the catchment for patrons, accounting for 64% of users. The 8% of Dart users arriving by foot from 1km or more away just about justifies a 1km catchment. With only 3 people travelling almost roughly 1400m there seems little supporting evidence for catchment threshold standards of more than 1km. At The Gallops (LRT Band 1) 30% of users stated that the proximity of the stop had influenced their decision to move into the area. This climbed to almost 50% at more established stations like Sandymount. Since rail users are seen to be predisposed to walk further than the general population to access a station [4] and 42% of those surveyed at Sandymount would not be willing to walk further than 800m it is unlikely that a large percentage of the population past 800m would walk to a station in the inner suburbs. 5. Conclusions The main conclusions of the research are as follows:
• People are willing to walk further to access HRT, with a typically less dense stopping pattern and higher average running speeds, than LRT. From analysis of the findings it can be concluded that on average HRT users are prepared to walk 20% further than LRT users.
• The closer a station is located to the urban centre then the shorter the distance users are willing to walk to that station. It appears that catchment sizes are proportionally related to an area’s modal deprivation and traveller’s expectations are adjusted by the level of service available.
• A one size fits all 1km walking catchment distance for all rail stations is an inadequate measure to determine a station’s true catchment population. Even though the 1km distance appeared accurate in relation to certain stations it either underestimated or overestimated the distances rail users were prepared to walk at other stations.
Harrison, O’Connor: GDA Rail Catchment Areas 29-30th August 2012 University of Ulster
Proceedings of the
ITRN2012
• By mapping the real walking routes of pedestrians to a station’s entrance using the ArcGIS Network tool much more accurate information is produced on a station’s catchment than when using the Euclidean method.
6. Recommendations Arising from the conclusions of this research it is recommended that a more adaptive, system of measuring and mapping rail catchment areas is introduced as standard to Irish planning. Key towards achieving this proposed new system are: -
• The ArcGIS Network approach of mapping real walking routes to a station should be used instead of the Euclidean method of a circle on a map.
• There should be an inner and an outer catchment area as used by Landex and Hansen [14]. The first 500m would constitute the inner catchment and any further catchment would be the outer catchment. This would be used by planning authorities to grade development densities and SDC scheme charges accordingly.
• New, more specific, walkable catchment distances should be used based on the actual urban grain instead of the current generic 1km for all rail stations.
• In many cases, particularly on the LRT line, catchment areas overlap and eat into potential ridership. This suggests that thinner stopping patterns could potentially be designed in Irish transport networks leading to faster average running timers and greater operational efficiencies.
References [1] DoEHLG (2009), Sustainable Residential Development in Urban Areas. Brunswick Press. [2] Dublin Transportation Office (DTO) (2000), A Platform for Change. DTO, Dublin. [3] Ker I. & Ginn S. (2003), Myths and Realities in Walkable Catchments: The Case of Walking and Transit. ARRB Transport Research Ltd., Melbourne. [4] Cervero R. & Duncan M. (2008), Residential Self Selection and Rail Commuting: A Nested Logit Analysis. University of California Transportation Center, Berkeley, California. [5] Weinstein B. & Clower T. (1999), The Initial Economic Impacts of the DART LRT System. Center for Economic Development and Research, University of North Texas, Texas. [6] South Dublin County Council (2009), Metro West Supplementary Development Contribution Scheme. South Dublin County Council, Dublin. [7] DoEHLG (2008), Value for Money Review of the Strategic Non-National Roads Programme. Report Prepared by Waters E. Non-National Roads Section, DoEHLG, Dublin. [8] The National Economic and Social Council (2004), Housing in Ireland: Performance and Policy. The National Economic and Social Council, Dublin. [9] UK Local Government Management Board (1995), Planning Policy Guidance: Transport. UK Department for Communities and Local Government, London. [10] Rudlin D. & Falk N. (1999), Building the 21st Century Home: The Sustainable Urban Neighbourhood. Architectural Press, Oxford. [11] Mees P. (2000), A Very Public Solution. Transport in the Dispersed City. Melbourne University Press, Melbourne. [12] Dittmar H. & Ohland G. (2004), The New Transit Town: Best Practices in Transit-Oriented Development. Island Press, London. [13] Barton H., Grant M. & Guise R. (2003), Shaping Neighbourhoods: A Guide for Health, Sustainability and Vitality. Spon Press, London. [14] Landex A. & Hansen S. (2006), Examining the Potential Travellers in Catchment Areas for Public Transport. ESRI International User Conference 2006, San Diego. [15] Cervero R., Round A., Goldman T. & Wu K. (1995), Rail Access Modes and Catchment Areas for the BART System. University of California, Berkeley, California. [16] O’Sullivan S. & Morrall J. (1995), Walking Distances to and from Light Rail Transit Stations. Transportation Research Record, 1538, 19-26. [17] VicUrban (2006), Sustainability Charter 2006. Government of Victoria, Melbourne.