measuring refurbishment contractors’ service quality and ... papers/jssh vol... · data were...
TRANSCRIPT

ISSN: 0128-7702Pertanika J. Soc. Sci. & Hum. 20 (1): 107 - 120 (2012) © Universiti Putra Malaysia Press
Received: 23 April 2010Accepted: 3 September 2010*Corresponding Author
INTRODUCTIONManaging the refurbishment of buildings requires the involvement of typical stakeholders, such as building clients, users, designer, consultants, and the refurbishment contractor. Construction refurbishment has typically been viewed as a production process with the product being completed to upgrade the existing facility. In addition to providing this product, contractors also provide service (Maloney, 2002). Some of the refurbishment contractors’ responsibilities for building maintenance work are to repair
building defects and to upgrade facilities to meet the building clients’ or users’ expectations. Hence, work standards and demand for quality service in managing property have become increasingly important issues, specifically during maintenance and refurbishment work. Within this context are clients or end users, whose needs change over time and may not be satisfied by their existing premises. Clients or end users are those who actually work or live in, and thus, spend most of their time in the constructed facilities. It is essential that when building owners and refurbishment contractors
Measuring Refurbishment Contractors’ Service Quality and Client Satisfaction: A Case Study at Public Institutions of Higher Education
Sallehan Ismail1*, Mohamad Hamdan Othman1 and Sufian Che Amat2
1Department of Building,2Department of Architecture,
Faculty of Architecture, Planning & Surveying, Universiti Teknologi MARA, Seri Iskandar Campus,
32610 Seri Iskandar, Perak, Malaysia*E-mail: [email protected]
ABSTRACTThis study aimed to examine contractors’ service quality performance and to explore the relationship between service quality and client satisfaction when undertaking refurbishment projects for public institutions of higher learning in Malaysia. Data were collected through a structured questionnaire. The questionnaire was generated based on the five service quality determinants in SERVQUAL, namely, reliability, responsiveness, assurance, empathy, and tangibles. From the five determinants, thirty-two attributes which might affect project service quality in refurbishment projects were identified to ascertain clients’ service quality expectations. Out of the 150 questionnaires distributed to 20 public institutions of higher learning, only 74 were completed and returned, resulting in a response rate of 49%. The results indicated that the reliability factor was the most important variable of service quality and that clients at public institutions of higher learning had high expectations in terms of service quality from refurbishment contractors. The results also showed that the values of service quality scores were negative for all attributes and those contractors were not currently meeting their clients’ expectations in the refurbishment projects. Finally, the study revealed that the dimensions of empathy and assurance had significant effects on customer satisfaction.
Key word: Service quality, Satisfaction, Refurbishment, Contractor, SERVQUAL

Sallehan Ismail, Mohamad Hamdan Othman and Sufian Che Amat
108 Pertanika J. Soc. Sci. & Hum. Vol. 20 (1) 2012
maintain or refurbish their facilities, they deliver the service that meets the users’ requirements and satisfaction. Liu and Walker (1998) considered satisfaction as an attribute of success. Meanwhile, Torbica and Stroh (2001) believe that if end-users are satisfied, the project can be considered to have been successfully completed in the long run.
The current trend in the construction and refurbishment industry is now moving towards higher quality. As a result, contractors have been forced to upgrade the quality of their service (Hasegawa, 1988). With the rising expectations of the people, business transformation, and economic growth in Malaysia, there is growing awareness of the need among building owners, professionals, and the authorities to raise the standards in managing their properties. In fact, quality is now the cornerstone of competitive strategies for contractors seeking to widen and secure their client base (Pheng & Hong, 2005). Recently, many studies on product quality are conducted in the construction industry and they have influenced the growth of quality assurance systems in accordance with the ISO 9000 family of standards (e.g. Kam & Tang, 1997; Shammas-Toma et al., 1998; Landin, 2000).
Therefore, this research was carried out to determine the service quality from the perspectives of clients or clients’ representatives who had experience in managing refurbishment projects in public institutions of higher learning in Malaysia. Nowadays, Malaysia has a total of 20 public institutions of higher learning and some of these institutions are over 50 years old. At present, there are many development projects and refurbishment work which are implemented by these universities to upgrade the teaching facilities, campus living, and learning environment. The rising needs for these development and refurbishment projects provide the opportunities for contractors. Outsourcing has become one of the strategies used by the Facilities Management departments at public institutions of higher learning for maintenance purposes or work to get the best value for money, to maintain the service standard, and to increase efficiency. The increasing number of contractor
companies in the construction industry indicates that they are fiercely competing with one another to get projects, and one of the common strategies is by lowering their prices. According to the Construction Industry Development Board (2009), Malaysia’s construction industry consists of over 65,000 registered contractor firms. Thus, lower price currently dominates as the primary competitive advantage (Asahara, 1992), but this trend is not successful in the Malaysian construction industry since the NSTP reported in 2002 that the Ministry of Work had stopped awarding contracts to the lowest bidder. Consequently, this has compelled contractors to constantly think of new ways to gain a competitive edge. There is a possibility for a well-reputed contractor to develop more attractive services. Hence, service quality may be the main or only differentiating element in the eyes of clients, as it cannot be easily copied and duplicated.
Furthermore, in construction refurbishment, determining quality service dimensions and customer satisfaction in the market competition is important. The problem is to identify which of the quality service dimensions or attributes and customers’ perception of the construction refurbishment services contribute to the overall customer satisfaction levels. This is further complicated by the intangible nature of the services, and quality service is inherently more difficult to measure than product quality. Moreover, efforts in defining and measuring the attributes of customer quality service in refurbishment construction are not fully known.
This study aimed to: (1) identify the dimensions of service quality that should be provided by a contractor, (2) test whether refurbishment contractors provide good service quality to clients, and (3) examine the relationship between the service quality provided by the refurbishment contractors and client satisfaction while managing refurbishment projects at public institutions of higher learning. The results gathered from this study will be useful for refurbishment contractors to provide high quality service that meets or exceeds clients’ expectations and to fill in the gap which exists in

Measuring Refurbishment Contractors’ Service Quality and Client Satisfaction
109Pertanika J. Soc. Sci. & Hum. Vol. 20 (1) 2012
the service quality expected by clients and that which is currently provided by refurbishment contractors.
LITERATURE REVIEW“Service quality,” as perceived by customers, refers to the extent of discrepancy between customers’ expectations or desires and their perceptions (Zeithaml et al., 1990). ‘‘Expectations’’ are the desires and wants of customers (i.e. what they feel a service provider should offer them). ‘‘Perception’’ refers to the customers’ evaluation of the service provider. The key to ensure good service quality is meeting or exceeding what customers expect from the service (Zeithaml et al., 1990). The judgment of high or low service quality is dependent on how customers perceive the service performance in the context of what they have expected. Three underlying themes related to service quality are: (1) service quality is more difficult for the customers to evaluate than goods quality; (2) quality evaluations are not made solely on the outcome of a service, but also involve evaluations of the process of service delivery; and (3) service quality perceptions result from a comparison of customers’ expectations with the actual service performance (Zeithaml et al., 1990). Rust and Oliver (1994) mentioned that “effectively managing service quality requires a clear understanding of what service means to the customer.” From a customer’s perspective, a measure of service quality is usually referred to as customer satisfaction (Vincent et al., 2008). Hence, measuring customer satisfaction leads to identifying ways to improve customer service quality.
While it may be comparatively easy to identify adequate dimensions for a specific service, researchers have sought to identify whether there are generic dimensions of service quality that can be identified. In this regard, the five dimensions of service quality proposed by Parasuraman et al. (1988) have been considered as the most widely accepted dimensions of service quality in various settings. These are:
a. Tangibles refers to the physical facilities, equipment, and appearance of personnel
b. Reliability refers to the ability to pe r fo rm the p romised se rv ice dependably and accurately.
c. Responsiveness refers to the willingness to help customers and provide prompt service.
d. Assurance refers to the knowledge and courtesy of employees and their ability to inspire trust and confidence.
e. Empathy r e fe rs to the car ing , individualized attention the firm provides its customers.
Thus, to measure customer satisfaction using different dimensions of service quality, Parasuraman et al. (1988) developed a multiple-scale survey research instrument called SERQUAL. SERVQUAL has so far been used in several studies to measure service quality in the construction and refurbishment industry. Among other, Hoxley (1998) used SERVQUAL to determine the effects of fee tendering on the quality of consultancy services, and found that quality was perceived to be higher when clients pre-selected consultants carefully and when adequate weighting was given to the consultants’ abilities in the final selection process. He later found that fee tendering did not lead to a decline in clients’ perceptions of service quality.
Holm and Brochner (1997) studied the ultimate satisfaction in housing refurbishment and found a strong relationship between satisfaction and dissatisfaction with contractor reputations among the residents. They further stated that the commonly used definition of a service industry is being compatible with the characteristics of refurbishment projects.
Holm (2000) assessed the impacts of customer orientation in the refurbishment industry, and discovered that refurbishment contractors who ensured customer satisfaction would have better reputations and increased customer loyalty. In addition, he also found

Sallehan Ismail, Mohamad Hamdan Othman and Sufian Che Amat
110 Pertanika J. Soc. Sci. & Hum. Vol. 20 (1) 2012
that both product quality (i.e. the tangible repairs undertaken) and service quality (i.e., the intangibles) were cores to tenant satisfaction with housing refurbishments.
Siu et al . (2001) invest igated the determinants of service quality in the maintenance of mechanical and engineering services. They found that service providers overestimated the clients’ expectations of the quality of service to be provided. Moreover, the service performance of the current providers was generally below clients’ expectations. They concluded that service providers have, to some extent, lost touch with clients’ needs and expectations, and recommended that they work closer with their clients to better meet their expectations.
Arditi and Lee (2003) developed a method for measuring corporate service quality and project service quality of D&B firms. The methodology that they developed could be used by individual D&B firms or owners of D&B projects to assess the service quality of an individual D&B firm. In addition, this tool could also be used to rank D&B contractors relative to service quality.
Ling and Chong (2004) studied design-and-build contractors’ service quality in public projects in Singapore using five SERVQUAL dimensions, namely, reliability, responsiveness, assurance, empathy, and tangibles, with a total of 34 attributes to identify the D&B contractor service performance. The study found that D&B contractors did not meet the clients’ expectations in all the five dimensions of service quality. This also indicated that the D&B contractors were not giving clients the satisfaction that they hoped for.
While some of the previous studies have revealed that SERVQUAL can be used to assess the quality of contractors and consultants, industry surveys on contractors’ refurbishment project service quality are still lacking.
SCOPE OF THE STUDYThis study was carried out to elicit the service quality dimensions as well as to investigate the clients’ expectations and to assess the contractor service performance when
undertaking refurbishment projects. This study focused on the perspectives of clients or client representatives who have had experience in managing refurbishment projects at public institutions of higher learning. A total of twenty public institutions of higher learning in Malaysia were selected for this research study. The literature review in this thesis covered the principles of service quality and customer satisfaction, and these are applied in various services industries so as to improve perceived customer service quality. These principles were also employed in the context of construction refurbishment. Meanwhile, the concepts of service quality, customer satisfaction, service quality dimensions of customer quality, and the importance of these concepts in managing refurbishment construction projects have been defined in several studies.
The application of these principles focused on particular key elements attributable to successful quality based on the level of customer satisfaction. This relates to service that is typically provided by the contractor during the refurbishment process. The research was carried out using the analysis of data collected from the questionnaires. It is important to note that this research focused on any refurbishment projects, either the ones which had ben fully completed or in the process of construction refurbishment. The final stage of the study focused on the significance of clients’ expectation and satisfaction with the services and quality of work provided by the contractors during the refurbishment project.
RESEARCH METHODOLOGYA total of 150 questionnaires were sent out to the respondents through surface mail. The survey package comprised of a cover letter stating the objectives of the study, the questionnaire, and a self-addressed and stamped envelope. The population for this study consisted of the clients or client representatives who have had experiences in managing and procuring refurbishment projects in public institutions of higher learning. Overall, these institutions have
Measuring Refurbishment Contractors’ Service Quality and Client Satisfaction
111Pertanika J. Soc. Sci. & Hum. Vol. 20 (1) 2012
their own facilities management departments or asset management departments which are responsible for procuring and managing new development projects, operations, and maintenance works, including refurbishment. In these organisations, the Directors or Heads of Division were contacted via telephone and e-mail. They helped to identify all the officers who have handled or are in the process of managing refurbishment projects at their respective institution. From a total of 150 questionnaires distributed to 20 institutions, only 74 questionnaires were completed and returned, giving a rate of 49 percent.
The questionnaire was generated based on the five service quality determinants in
SERVQUAL (Parasuraman et al., 1988), namely reliability, responsiveness, assurance, empathy, and tangibles. From the five determinants, a total of 32 attributes which might affect project service quality in refurbishment projects were identified. The literature review revealed that the SERVQUAL has not been frequently used to assess contractors’ refurbishment project service quality, so all the attributes which had been developed to ascertain clients’ service quality expectations were based on previous study by Ling and Chong (2004). The authors found that the study was closely related to the contractors’ field. Note that some attributes of the questionnaire were modified in such a way to match the context of refurbishment undertaken
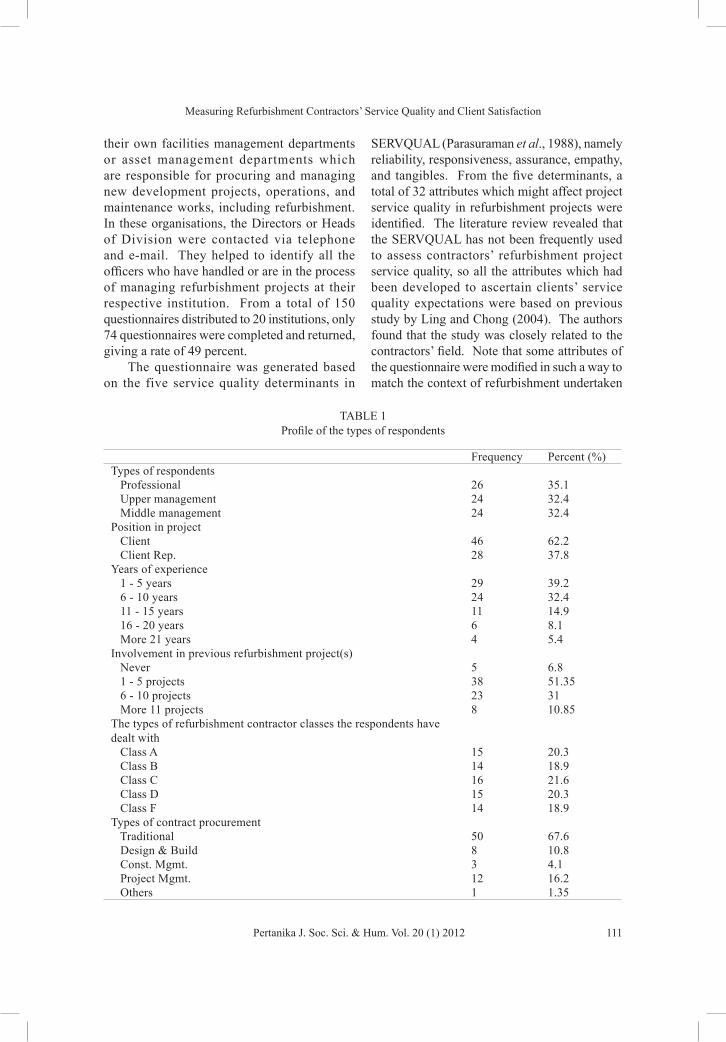
TABLE 1 Profile of the types of respondents
Frequency Percent (%)Types of respondents Professional 26 35.1 Upper management 24 32.4 Middle management 24 32.4Position in project Client 46 62.2 Client Rep. 28 37.8Years of experience 1 - 5 years 29 39.2 6 - 10 years 24 32.4 11 - 15 years 11 14.9 16 - 20 years 6 8.1 More 21 years 4 5.4Involvement in previous refurbishment project(s) Never 5 6.8 1 - 5 projects 38 51.35 6 - 10 projects 23 31 More 11 projects 8 10.85The types of refurbishment contractor classes the respondents have dealt with Class A 15 20.3 Class B 14 18.9 Class C 16 21.6 Class D 15 20.3 Class F 14 18.9Types of contract procurement Traditional 50 67.6 Design & Build 8 10.8 Const. Mgmt. 3 4.1 Project Mgmt. 12 16.2 Others 1 1.35

Sallehan Ismail, Mohamad Hamdan Othman and Sufian Che Amat
112 Pertanika J. Soc. Sci. & Hum. Vol. 20 (1) 2012
in the study. All the attributes were then tested in a pilot survey, and minor changes were made to the questionnaire.
The questionnaire was divided into 3 major sections, which included a guide to filling in the form, demographic profile (general information pertaining to the respondents and the organizations), and the final section containing the 32 statements. The respondents were requested to rate their expected levels of service (expectations) using the Likert scale ranging from 1 (not important) to 5 (very important). The respondents were also asked to rate the perceived levels of service quality (perceptions, after project completion) provided by the refurbishment contractors, also using the Likert scale ranging from 1 (not satisfied at all) to 5 (very satisfied). Finally, the respondents were requested to indicate the importance of the five Service Quality determinants by weighting each determinant out of a total of 100 points. After the final data for this study had been collected, measuring service quality performance in SERVQUAL was calculated using the formula given below. An overall weighted SQ score was calculated to take into account the relative importance of the various dimensions.
SQ score = Weighted Perception score - Weighted Expectation score (1)
where,
Weighted Expectation score = Expectation score x Importance weight (2)
Weighted Perception score = Perception score x Importance weightw (3)
According to Parasuraman et al. (1988), assessing the quali ty of service using SERVQUAL involves computing the difference between the ratings customers assigned to the paired expectation and the perception statements. Therefore, the perceived service quality was computed along the five determinants by subtracting the expectation scores from the perception scores. It is crucial to highlight that a negative Service Quality score (SQ score) indicates that the level of the contractor’s service
quality is below the clients’ expectations, while a positive service quality score means that the contractors have exceeded their clients’ expectations.
This formula is actually the same technique that was recommended by previous service quality researchers to measure service quality and customer satisfaction (e.g. Carman, 1990; McDougall & Levesque, 1992), whereby the SERVQUAL gap between customers’ expectations and perceptions were multiplied by how important customers rated each element of the service. SPSS (version 16.0) was used to compute and analyze the data. In addition, descriptive statistics was also carried out to identify the means and standard deviations of the service quality according to each of the demographic variables. Pair wise T-test analysis was used to compare the mean and variance score of the clients’ expectations and contractors’ achievement of the attributes, as perceived by the clients.
RESULTS AND DISCUSSION
Respondents’ Demographic ProfileThe findings identified the type of respondents as consisting of three groups, namely; (1) professionals (n = 26), (2) upper management (n = 24), and (3) middle management (n = 24). The results showed that majority of the respondents worked as clients in the refurbishment projects. Most of the respondents had 6-10 years of experience in the construction industry and had been involved with 1-5 refurbishments projects. Thus, it is concluded that the feedback of the respondents is noteworthy. The majority of the respondents had dealt with class C contractors, while most of them had used the traditional system in implementing the refurbishments projects.
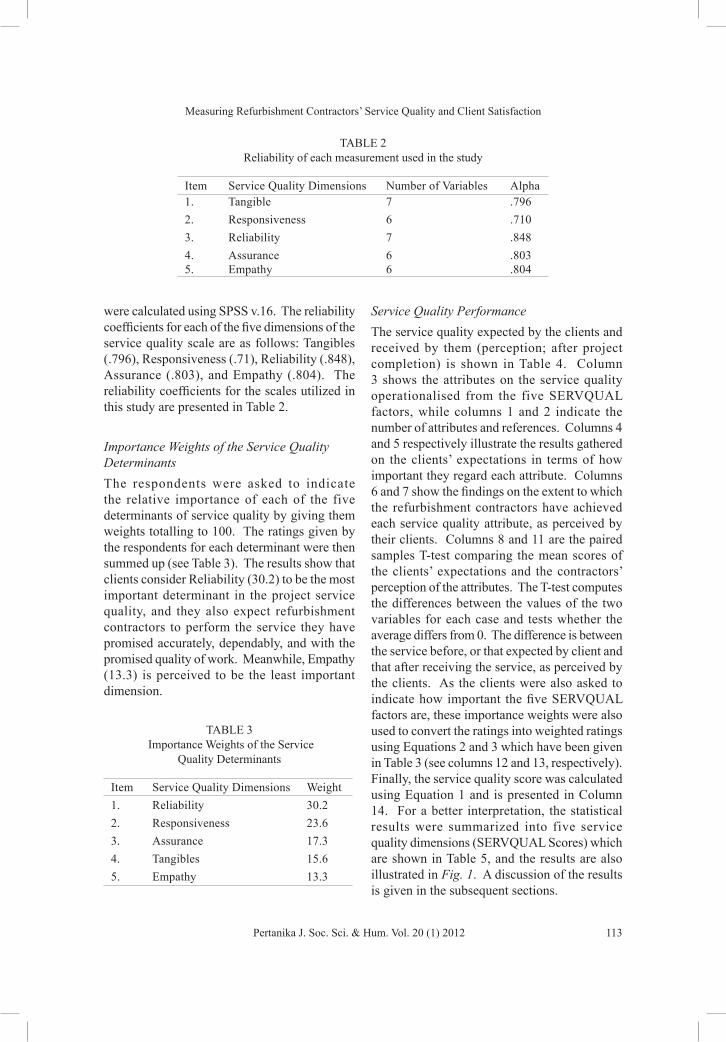
Analysis Reliability of the Survey InstrumentAccording to Nunnally and Berstein (1994), an internal consistency greater than .70 is reasonably reliable. After the gathering the final data for this study, the reliability coefficients
Measuring Refurbishment Contractors’ Service Quality and Client Satisfaction
113Pertanika J. Soc. Sci. & Hum. Vol. 20 (1) 2012
were calculated using SPSS v.16. The reliability coefficients for each of the five dimensions of the service quality scale are as follows: Tangibles (.796), Responsiveness (.71), Reliability (.848), Assurance (.803), and Empathy (.804). The reliability coefficients for the scales utilized in this study are presented in Table 2.
Importance Weights of the Service Quality DeterminantsThe respondents were asked to indicate the relative importance of each of the five determinants of service quality by giving them weights totalling to 100. The ratings given by the respondents for each determinant were then summed up (see Table 3). The results show that clients consider Reliability (30.2) to be the most important determinant in the project service quality, and they also expect refurbishment contractors to perform the service they have promised accurately, dependably, and with the promised quality of work. Meanwhile, Empathy (13.3) is perceived to be the least important dimension.
TABLE 3 Importance Weights of the Service
Quality Determinants
Item Service Quality Dimensions Weight1. Reliability 30.22. Responsiveness 23.63. Assurance 17.34. Tangibles 15.65. Empathy 13.3
Service Quality Performance The service quality expected by the clients and received by them (perception; after project completion) is shown in Table 4. Column 3 shows the attributes on the service quality operationalised from the five SERVQUAL factors, while columns 1 and 2 indicate the number of attributes and references. Columns 4 and 5 respectively illustrate the results gathered on the clients’ expectations in terms of how important they regard each attribute. Columns 6 and 7 show the findings on the extent to which the refurbishment contractors have achieved each service quality attribute, as perceived by their clients. Columns 8 and 11 are the paired samples T-test comparing the mean scores of the clients’ expectations and the contractors’ perception of the attributes. The T-test computes the differences between the values of the two variables for each case and tests whether the average differs from 0. The difference is between the service before, or that expected by client and that after receiving the service, as perceived by the clients. As the clients were also asked to indicate how important the five SERVQUAL factors are, these importance weights were also used to convert the ratings into weighted ratings using Equations 2 and 3 which have been given in Table 3 (see columns 12 and 13, respectively). Finally, the service quality score was calculated using Equation 1 and is presented in Column 14. For a better interpretation, the statistical results were summarized into five service quality dimensions (SERVQUAL Scores) which are shown in Table 5, and the results are also illustrated in Fig. 1. A discussion of the results is given in the subsequent sections.
TABLE 2 Reliability of each measurement used in the study
Item Service Quality Dimensions Number of Variables Alpha1. Tangible 7 .7962. Responsiveness 6 .7103. Reliability 7 .8484. Assurance 6 .8035. Empathy 6 .804

Sallehan Ismail, Mohamad Hamdan Othman and Sufian Che Amat
114 Pertanika J. Soc. Sci. & Hum. Vol. 20 (1) 2012
TABLE 4 Statistical results for the refurbishment contractors’ service quality
RefWeighted Weighted Service
Mean Rank Mean Rank MeanStd. Dev. t-value
Sig.(2-tailed)
expectation mean
perception mean
quality (SQ)
Score1 2 3 4 5 6 7 8 9 10 11 12 13 14
Tangibles 3.90 3.00 0.609 0.469 -0.1401 TAN1 The written and graphical output of contractor is
well presented3.84 28 3.14 9 -0.70 0.86 -7.064 0.000 0.599 0.489 -0.110
2 TAN2 Contractor staffs are always tidy in appearance 3.43 32 2.82 32 -0.61 0.84 -6.220 0.000 0.536 0.441 -0.0953 TAN3 Contractor has up-to-date equipment
technology4.03 21 2.95 27 -1.08 0.79 -11.778 0.000 0.629 0.460 -0.169
4 TAN4 Contractor has innovative in constructionmethods
4.08 19 3.09 15 -0.99 0.84 -10.154 0.000 0.637 0.483 -0.154
5 TAN5 Contractor has visually appealing physicalfacilities
3.78 30 2.85 30 -0.93 0.78 -10.255 0.000 0.591 0.445 -0.146
6 TAN6 Contractor has a motivated and unitedworkforce
3.99 24 2.99 25 -1.00 0.86 -10.002 0.000 0.622 0.466 -0.156
7 TAN7 Contractor has in-housed or external technicalexpertise
4.15 15 3.19 5 -0.96 0.71 -11.612 0.000 0.648 0.498 -0.150
Responsiveness 4.38 3.15 1.033 0.743 -0.290
8 RES1 Contractor tells client exactly when the work willbe carried out
4.50 6 3.16 7 -1.34 0.94 -12.238 0.000 1.061 0.745 -0.315
9 RES2 Contractor ensures project hand-over is wellahead of the date for occupation by users
4.54 5 3.03 20 -1.51 0.91 -14.303 0.000 1.070 0.713 -0.357
10 RES3 Contractor is flexible to accommodate variationof requirements during the project
4.27 11 3.12 12 -1.15 0.84 -11.780 0.000 1.006 0.736 -0.271
11 RES4 Contractor responses promptly to client'srequests and problems
4.38 8 3.31 2 -1.07 0.88 -10.424 0.000 1.032 0.780 -0.252
12 RES5 Contractor employees are always willing to help 4.20 14 3.23 4 -0.97 0.86 -9.736 0.000 0.990 0.761 -0.22913 RES6 Contractor accords priority to complaints
(defects) on completed project4.41 7 3.07 16 -1.34 0.97 -11.876 0.000 1.038 0.723 -0.315
Reliability 4.47 3.13 1.352 0.946 -0.40614 REL1 Contractor maintains a good reputation 4.62 2 3.42 1 -1.20 0.76 -13.646 0.000 1.397 1.034 -0.36415 REL2 Contractor maintains high construction quality 4.65 1 3.12 13 -1.53 0.98 -13.372 0.000 1.405 0.944 -0.46216 REL3 Contractor maintains an open and honest
relationship with client4.35 9 3.03 21 -1.32 0.97 -11.785 0.000 1.315 0.915 -0.400
17 REL4 Contractor's construction is done right first time 4.58 3 3.07 17 -1.51 1.10 -11.826 0.000 1.385 0.927 -0.458
18 REL5 Contractor's meet the exact specifications andrequirement
4.58 4 3.07 18 -1.51 0.88 -14.801 0.000 1.385 0.927 -0.458
19 REL6 Contractor promises to do something by acertain time, they will do so
4.23 12 3.07 19 -1.16 0.84 -11.839 0.000 1.279 0.927 -0.351
20 REL7 Contractor provides the same level of serviceperformance to all clients at different times
4.28 10 3.14 10 -1.15 0.90 -10.957 0.000 1.295 0.948 -0.347
Assurance 4.09 3.14 0.709 0.544 -0.16521 ASS1 Contractor makes client feel secure in leaving
the project in its hands4.11 18 3.24 3 -0.86 0.88 -8.446 0.000 0.712 0.562 -0.150
22 ASS2 Contractor has staff who are consistentlycourteous and polite with client
4.00 22 3.15 8 -0.85 0.90 -8.121 0.000 0.694 0.546 -0.148
23 ASS3 Contractor has staff whose behavior instillsconfidence in client
4.00 23 3.14 11 -0.86 0.78 -9.513 0.000 0.694 0.544 -0.150
24 ASS4 Contractor has competent staff to performtechnical duties
4.22 13 3.12 14 -1.09 0.92 -10.190 0.000 0.731 0.541 -0.190
25 ASS5 Contractor has staff who have the knowledge toanswer client's questions
4.08 20 3.19 6 -0.89 0.84 -9.167 0.000 0.708 0.553 -0.155
26 ASS6 Contractor has the capability to coversubcontractor's works if it fails
4.14 16 2.99 26 -1.15 0.89 -11.147 0.000 0.717 0.518 -0.199
Empathy 3.92 2.95 0.520 0.391 -0.12927 EMP1 Contractor understands the specific needs of
client3.96 25 3.01 22 -0.95 0.95 -8.572 0.000 0.525 0.399 -0.125
28 EMP2 Contractor makes an effort to understand thegeneral requirements client
3.93 26 2.93 31 -1.00 0.98 -8.785 0.000 0.521 0.389 -0.133
29 EMP3 Contractor produces works without ruiningclient's reputation
3.93 27 3.00 23 -0.93 0.94 -8.523 0.000 0.521 0.398 -0.124
30 EMP4 Contractor staffs give individual attention toclient
3.82 29 3.03 28 -0.80 0.86 -7.977 0.000 0.507 0.401 -0.106
31 EMP5 Contractor has the client's best interests atheart
3.76 31 2.85 24 -0.91 1.04 -7.519 0.000 0.498 0.378 -0.120
32 EMP6 Contractor is contactable at all times 4.12 17 2.86 29 -1.26 0.79 -13.601 0.000 0.546 0.380 -0.167
Paired DifferencesNo Service Quality Dimensions & attributes Unweighted expectation
Unweighted perception

Measuring Refurbishment Contractors’ Service Quality and Client Satisfaction
115Pertanika J. Soc. Sci. & Hum. Vol. 20 (1) 2012
The Importance of Service Quality DimensionsThe determination of service quality dimensions is important, as it will enable refurbishment contractors to understand which service quality dimension should be prioritized while managing refurbishment projects. As presented in Table 5, among the five dimensions, the most important one for expectation performance is reliability, with a weighted mean of 1.35. This is followed by the dimensions of responsiveness (mean = 1.03), assurance (mean = 0.71), and tangibles (mean = 0.61). Empathy was found to be the least important dimension (mean = 0.52). The respondents were also asked to indicate the relative importance of each of the five determinants of service quality (by giving them weights totalling to 100) in Section C of the questionnaire. The ratings given by the respondents for each determinant were then
summed up. The results revealed that the clients considered reliability (mean = 0.321) as the most important determinant in the project service quality, followed by responsiveness (mean = 0.236), whereas empathy (0.123) was perceived to be of the least important (see Table 3).
Therefore, reliability is the most important dimension that providers should look into and improve on in order to meet clients’ expectations, as clients put substantial weight on that particular dimension. The high ranks of the reliability dimensions also suggest that clients from public institutions of higher learning expect refurbishment contractors to perform the services as they have promised independently and to achieve the quality and accuracy of work. To them, the appearance of the physical facilities of the refurbishment contractors is not that important in the delivery of construction tasks. This could be due to the fact that during the
Fig. 1: A diagram showing the mean score for the clients’ expectations and their perceptions of service quality

Sallehan Ismail, Mohamad Hamdan Othman and Sufian Che Amat
116 Pertanika J. Soc. Sci. & Hum. Vol. 20 (1) 2012
construction and management of refurbishment projects, complicated equipment with the latest technology are not needed, unlike in the new construction projects. Therefore, to fulfil the clients’ needs, the refurbishment contractors must ensure that the services they deliver are of good quality and reliable at all times.
The SERVQUAL Gap DifferenceThe paired samples T-test was used to compare the means of the expectations and the perceptions on the SERVQUAL dimensions. These service quality gaps were calculated by subtracting the respondents’ expectations from their perceptions. A negative service quality gap indicated that the respondents’ expectations were greater than their perceptions, while a positive service quality gap indicated that the respondents’ perceptions exceeded their expectations. The results presented in Table 5 indicated that the weighted score for the reliability dimension had the greatest service gap of -0.41, followed by responsiveness (-0.29), assurance (-0.17),
and tangibles (-0.14). Meanwhile, empathy recorded the smallest service gap (-0.13). For the paired samples T-Test, the negative sign of the t-values for all the variables indicated that the expectations were higher than the perceptions (see Table 4). In all the five service dimensions, the respondents exhibited dissatisfaction. In other words, there was a significant difference between the customers’ expectations and their perceptions on the overall service quality dimension.
The Level of Satisfaction and Service Quality In order to determine the level of satisfaction of clients, the quality of services by the refurbishment contractors was measured using the SERVQUAL scores. The level of service quality satisfaction was calculated by subtracting the weighted perceived performance (perception) scores from the weighted expectation scores. All the SERVQUAL scores for each of the five dimensions were found to be negative,
TABLE 5 SERVQUAL Scores
Dimensions Perception mean
Rank Expectation mean
Rank SERVQUAL score
Unweighted Tangibles
Responsiveness Reliability Assurance Empathy Overall
3.00 3.15 3.13 3.14 2.95 3.07
4 1 3 2 5
3.90 4.38 4.47 4.09 3.92 4.15
5 2 1 3 4
-0.90 -1.23 -1.34 -0.95 -0.97 -1.08
Weighted Tangibles
Responsiveness Reliability Assurance Empathy Overall
0.47 0.74 0.95 0.54 0.39 0.62
4 2 1 3 5
0.61 1.03 1.35 0.71 0.52 0.84
4 2 1 3 5
-0.14 -0.29 -0.41 -0.17 -0.13 -0.23

Measuring Refurbishment Contractors’ Service Quality and Client Satisfaction
117Pertanika J. Soc. Sci. & Hum. Vol. 20 (1) 2012
suggesting that there was a gap between the respondents’ expectations of what the services of a refurbishment contractor should be and their perceptions of the service quality that was actually offered by refurbishment contractors. Furthermore, the results showed that the total overall weighted score was -0.23 (see Table 5), implying that the services as perceived by the clients were below the clients’ expectations. Hence, the service quality provided by refurbishment contractors did not satisfy clients.
The Relationships between Service Quality and Client SatisfactionTo determine the effects of the service quality dimensions on client satisfaction, a multiple
regression analysis was performed to examine the relationship between the measures of service quality provided by the contractors and the measures of client satisfaction. Multiple regression analysis allows the assessment of the degree of the relationship between dependent and independent variables by forming variate of independent variables (Hair et al., 2006). In this study, the regression model considers client satisfaction as a dependent variable, and the five factors of service quality as independent variables. The entry of the variable selection method involving all the five factors of service quality was utilized for the 74 respondents. The results from the regression model indicated that it was statistically significant (F=10.772, p=.000), as reported by an adjusted R2 of 0.442 (see Table 6). This finding further suggested that
TABLE 6 Model summary for the effects of service quality on customer satisfaction
Model
R Square
Adjusted R Square
Change Statistics
R Square Change
F Change df1 Sig. F Change
1 .442 .401 .442 10.772 5 .000
a. Predictors: (Constant), Empathy, Responsive, Assurance, Tangible, Reliabilityb. Dependent Variable: Satisfaction
TABLE 7The influence of the five service quality dimensions on client satisfaction
Model
Service Quality Dimension
Unstandardized Coefficients
Standardized Coefficients
t Sig.
B Std. Error Beta
1 (Constant) .539 .435 1.238 .220 Tangible -.067 .136 -.060 -.494 .623 Responsiveness -.028 .121 -.027 -.236 .814 Reliability -.034 .142 -.031 -.238 .812 Assurance .316 .141 .263 2.243 .028 Empathy .658 .117 .585 5.630 .000
a. Dependent Variable: Satisfaction
Sallehan Ismail, Mohamad Hamdan Othman and Sufian Che Amat
118 Pertanika J. Soc. Sci. & Hum. Vol. 20 (1) 2012
the service variable was able to explain 44.2% of the overall client satisfaction, as clarified by the five factors of service quality.
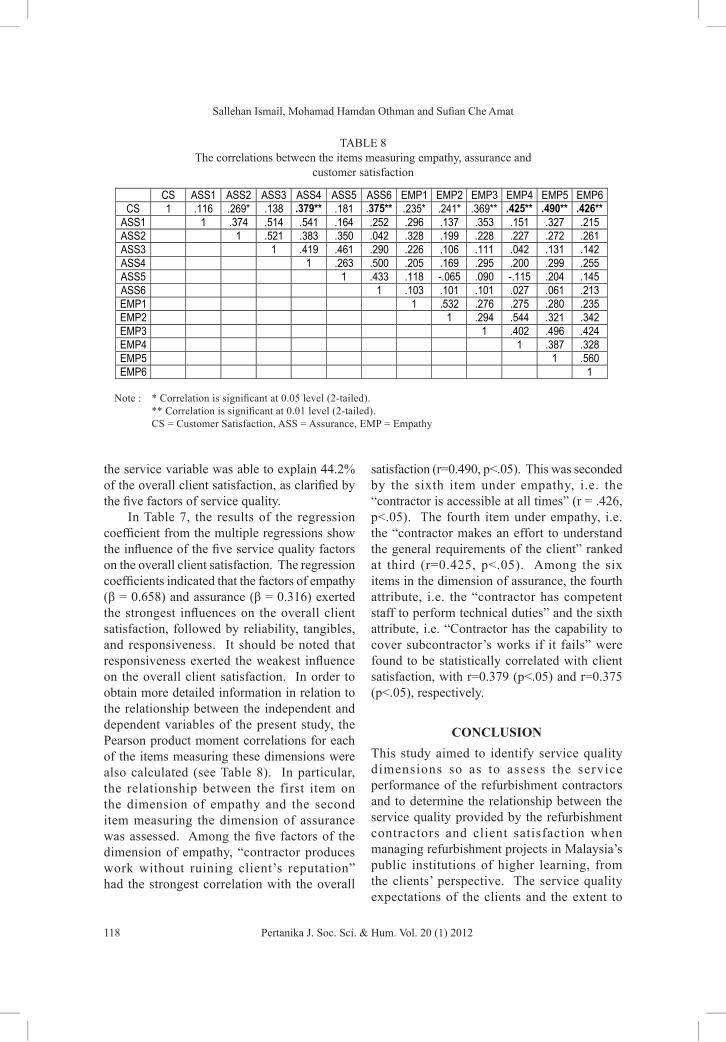
In Table 7, the results of the regression coefficient from the multiple regressions show the influence of the five service quality factors on the overall client satisfaction. The regression coefficients indicated that the factors of empathy (β = 0.658) and assurance (β = 0.316) exerted the strongest influences on the overall client satisfaction, followed by reliability, tangibles, and responsiveness. It should be noted that responsiveness exerted the weakest influence on the overall client satisfaction. In order to obtain more detailed information in relation to the relationship between the independent and dependent variables of the present study, the Pearson product moment correlations for each of the items measuring these dimensions were also calculated (see Table 8). In particular, the relationship between the first item on the dimension of empathy and the second item measuring the dimension of assurance was assessed. Among the five factors of the dimension of empathy, “contractor produces work without ruining client’s reputation” had the strongest correlation with the overall
satisfaction (r=0.490, p<.05). This was seconded by the sixth item under empathy, i.e. the “contractor is accessible at all times” (r = .426, p<.05). The fourth item under empathy, i.e. the “contractor makes an effort to understand the general requirements of the client” ranked at third (r=0.425, p<.05). Among the six items in the dimension of assurance, the fourth attribute, i.e. the “contractor has competent staff to perform technical duties” and the sixth attribute, i.e. “Contractor has the capability to cover subcontractor’s works if it fails” were found to be statistically correlated with client satisfaction, with r=0.379 (p<.05) and r=0.375 (p<.05), respectively.
CONCLUSIONThis study aimed to identify service quality dimensions so as to assess the service performance of the refurbishment contractors and to determine the relationship between the service quality provided by the refurbishment contractors and client satisfaction when managing refurbishment projects in Malaysia’s public institutions of higher learning, from the clients’ perspective. The service quality expectations of the clients and the extent to
TABLE 8 The correlations between the items measuring empathy, assurance and
customer satisfaction
CS ASS1 ASS2 ASS3 ASS4 ASS5 ASS6 EMP1 EMP2 EMP3 EMP4 EMP5 EMP6 CS 1 .116 .269* .138 .379** .181 .375** .235* .241* .369** .425** .490** .426**
ASS1 1 .374 .514 .541 .164 .252 .296 .137 .353 .151 .327 .215 ASS2 1 .521 .383 .350 .042 .328 .199 .228 .227 .272 .261 ASS3 1 .419 .461 .290 .226 .106 .111 .042 .131 .142 ASS4 1 .263 .500 .205 .169 .295 .200 .299 .255 ASS5 1 .433 .118 -.065 .090 -.115 .204 .145 ASS6 1 .103 .101 .101 .027 .061 .213 EMP1 1 .532 .276 .275 .280 .235 EMP2 1 .294 .544 .321 .342 EMP3 1 .402 .496 .424 EMP4 1 .387 .328 EMP5 1 .560 EMP6 1
Note : * Correlation is significant at 0.05 level (2-tailed). ** Correlation is significant at 0.01 level (2-tailed). CS = Customer Satisfaction, ASS = Assurance, EMP = Empathy

Measuring Refurbishment Contractors’ Service Quality and Client Satisfaction
119Pertanika J. Soc. Sci. & Hum. Vol. 20 (1) 2012
which these expectations were achieved by the refurbishment contractors on the 32 attributes under the five determinants of service quality (SERVQUAL) were obtained and determined through a questionnaire survey. The findings of this study revealed the following:
1. Reliability was ranked as the most important dimension, followed by responsiveness, while the least important dimension was empathy.
2. The clients were found to have high expectat ions of the refurbishment contractors’ service quality. Based on the SERVQUAL score results, the weighted score for the service quality gap in the reliability dimension was ranked to be the highest (-0.41), followed by responsiveness (-0.29), assurance (-0.17), and tangibles (-0.14). The smallest service gap was found in the empathy dimension (-0.13). Meanwhile, the negative t-values for all the variables indicated that the expectations were higher than the perceptions.
3. The total overall SERVQUAL score provided by refurbishment contractors was -0.23, indicating that the performance of the service provided by the refurbishment contractors did not meet the clients’ expectation. This also means that the clients, i.e. the public institutions of higher learning, were not satisfied with their contractors’ performance.
4. Empathy and assurance were found to have significant effects on customer satisfaction, as compared to responsiveness which had insignificant impacts on customer satisfaction.
The implication of this study is that refurbishment contractors need to significantly improve themselves in the area of project service quality.
REFERENCESArditi D., & Lee, D. E. (2003). Assessing the corporate
service quality performance of design-build
contractors using quality function deployment. Construction Management and Economics, 21, 175–85.
Ashara, T. (1992). Customer Service quality management in the construction industry: a comparative study of the US and Japan (Master Thesis dissertation). Department of Civil Engineering, Massachussets Institute of Technology, Cambridge, MA. Retrieved November 22, 2008, from http://hdl.handle.net/1721.1/12827
Carman, J. M. (1990). Consumer perceptions of service quality: an assessment of the SERVQUAL dimensions. Journal of Retailing, 66, 33-55.
Construction Industry Development Board (CIDB), (2009). Contractors registered, quarter 1, total contractors registered by contractor registration grade and state of registration, CIDB Portal. Retrieved July 22, 2009, from http://www.cidb.gov.my/v6/files/B1_Q1_09.pdf
Hair, J. F., Black, B., Babin, B., Anderson, R. E., & Tatham, R. L. (2006). Multivariate data analysis, (6th edition). N.J: Englewood Cliffs (Prentice Hall).
Hasegawa, F. (1988). Built by Japan : competitive strategies of the Japanese construction industry. New York: Wiley.
Holm, M. G., & Bröchner, J. (1997). Satisfying the ultimate customer in housing refurbishment. In L. K. Quah (Ed.), Facilities Management and Maintenance, Proceedings CIB W70 International Symposium on Management, Maintenance and Modernization of Building Facilities (pp. 205-212). Singapore: McGraw-Hill.
Holm, M. G. (2000). Service management in housing refurbishment: a theoretical approach. Construction Management and Economics, 18, 525–33.
Hoxley, M. (1998). The impact of competitive fee tendering on construction professional service quality. London: RICS Research Findings No. 24, Royal Institute of Chartered Surveyors.
Kam, C. W., & Tang, S. L. (1997). Development and implementation public construction works in Singapore and Hong Kong. Reliability Management, 14(9), 909-28.

Sallehan Ismail, Mohamad Hamdan Othman and Sufian Che Amat
120 Pertanika J. Soc. Sci. & Hum. Vol. 20 (1) 2012
Landin, A. (2000). ISO 9001 within the Swedish construction sector. Construction Management and Economics, 18(5), 509-518.
Ling, F. Y. Y., & Chong, C. L. K. (2004). Design-and-build contractors’ service quality in public projects in Singapore. Building and Environment, 40, 815–823.
Liu, A. M. M., & Walker, A. (1998). Evaluation of project outcomes. Construction Management and Economics, 16(2), 209-19.
Maloney, W. F. (2002). Construction Product/Service and Customer Satisfaction. Journal of Construction Engineering And Management, 128(6), 522.
McDougall, G., & T. Levesque (1994). A Revised View of Service Quality Dimensions: An Empirical Investigation. Journal of Professional Services Marketing, 11(1), 189-210.
New Strait Time Press (NSTP), (2002, September 22). No practice of awarding contract to lower bidder. News Archive 1991, NSTP e-media online.
Nunnally, J. C., & Bernstein, I. (1994). Psychometric theory (3rd ed.). New York: McGraw-Hill.
Parasuraman, A., Zeithaml, V. A., & Berry, L. L. (1988). SERVQUAL: A multiple item scale for measuring consumer’s perceptions of service quality. Journal of Retailing, 64(1), 12-40.
Pheng, L. S., & Hong S. H. (2005). Research and concepts strategic quality management for the construction industry. The TQM Magazine , 17(1), 35-53.
Shammas-Toma, M., Seymour, D., & Clark, L. (1998). Obstacles to implementing Total Quality Management in the UK construction industry. Construction Management and Economics, 16(2), 177-92.
Siu, G. K. W, Bridge, A., & Skitmore, M. (2001). Assessing the service quality of building maintenance providers: mechanical and engineering services. Construction Management and Economics, 19, 719–26.
Torbica, Z. M., & Stroh R. C. (2001). Customer satisfaction in home building. Journal of Construction Engineering and Management, 127(1), 82-86.
Vincent, O., William C. J., & Godwin O. (2008). An empirical test of the drivers of overall customer satisfaction: evidence from multivariate Granger causality. Journal of Services Marketing, 22(6), 434–444.
Zeithaml, V. A, Parasuraman, A., & Berry L. L (1990). Delivering quality service: balancing customer perceptions and expectations. New York: Free Press.