measuring service quality in developing … is to certify that the research paper on “measuring...
TRANSCRIPT

MEASURING SERVICE QUALITY IN DEVELOPING RETAIL
STRATEGIES FOR SUPER MARKETS IN SRI LANKA.
By
Nishan C. Perera
Dip.M (UK), MCIM , MSLIM , Chartered Marketer (UK)
Certified Professional Marketer (Asia Pacific)
A Research Paper submitted to the
Postgraduate Institute of Management
University of Sri Jayewardenepura
in partial fulfilment of the requirements
of the Master of Business Administration Degree
Colombo 08 – Sri Lanka
2003
This is to certify that the research paper on “Measuring Service Quality in
Developing Retail Strategies for Super Markets in Sri Lanka”
By
Nishan C. Perera
has been accepted by the
Postgraduate Institute of Management
University of Sri Jayewardenepura
in partial fulfilment of the requirement
of the Master of Business Administration Degree
………………………... ………………….
Research Supervisor Director - PIM
Date : Date :
LIST OF ILLUSTRATIONS
Figure 01 Types of service quality gaps 08
Figure 02 Service continuum for a product 10
Figure 03 Service quality and the extended marketing mix for services 11
Figure 04 Nordic model of perceived service quality 12
Figure 05 Gaps model on service quality 14
Figure 06 Customer assessment of service quality 14
Figure 07 Service quality dimensions of the three-component model 16
Figure 08 Service quality levels of the multilevel model 17
Figure 09 Service quality dimensions of the hierarchical approach model. 18
Figure 10 Conceptual framework of the CALSUPER model 19
Figure 11 Tracking service quality 20
Figure 12 Service quality and customer satisfaction 23
Figure 13 Functional & technical service quality and willingness to buy 23
Figure 14 Retail planning process 26
Figure 15 Merchandising mix strategies 28
Figure 16 Influences on store location strategy 32
Figure 17 Store facility management mix elements 32-33
Figure 18 Retail promotions mix 35
Figure 19 Types of sales promotional incentives directed to the consumer 37
Figure 20 Customer service strategies in store selection and purchasing 38
Figure 21 Customer service strategy 39
Figure 22 Classifications of in a retail organisational structures 41
Figure 23 Merchandising logistics strategies 42
Figure 24 Original CALSUPER model and suggested modifications 57-58
Figure 25 Broad organizational structure of RPD 62
Figure 26 Business functions of Cargills group 66
Figure 27 Organizational structure of Cargills Food City supermarket 67
Figure 28 Broad organizational structure of Jaykay Marketing Services 70
Figure 29 Organizational structure of SATHOSA 74
LIST OF ILLUSTRATIONS (continued)
Figure 30 Organizational structure of SENTRA 77
Figure 31 Service quality recognition matrix of the five supermarkets 79
Figure 32 Polarization of supermarket segments 84
Figure 33 Overall conclusion of the research 99
Figure 34 Four step process model 102
Figure 35 Service quality gaps identified in the pilot study 122
Figure 36 Service quality gaps identified in the pilot study-graph 123
Figure 37 Classification of the retail industry in Sri Lanka 129
Figure 38 Turnover of the five supermarkets 134
Figure 39 Growth in turnover of five the supermarkets – 2000/2002 135
Figure 40 Change in sales share between five supermarkets 136
Figure 41 Growth in supermarket outlets 137
Figure 42 Super market retail life cycle 138
Figure 43 Complains handling procedure - SATHOSA 141
Figure 44 Frequency of visits 142
Figure 45 Gender break down of the respondents 143
Figure 46 Marital status of respondents 144
Figure 47 Age distribution of respondents 145
Figure 48 Household income distribution of respondents 146
Figure 49 Gap method – service quality 165
Figure 50 Gap method – product quality/prices paid 166
Figure 51 Percentage method 167
Figure 52 Percentage method – Service quality – graphical 169
Figure 53 Percentage method – Product quality/prices - graphical 170
Figure 54 Importance perception matrix – service statements 171
Figure 55 Importance perception matrix – product statements 172
Figure 56 Importance perception matrix – sub dimensions 173
Figure 57 Importance perception matrix – dimensions 174
Figure 58 Gaps & strategy interface 175
LIST OF TABLES
Table 01 Results of the pilot study 02
Table 02 Elements of the extended marketing mix for services 10
Table 03 Considerations in retail location planning 32
Table 04 Considerations for Store facility management elements 33
Table 05 Retail pricing strategies 34
Table 06 Income distribution of respondents and price expectations 83
Table 07 Names of supermarkets operating in Sri Lanka 130
Table 08 Geographical distribution of super markets 132
Table 09 Customer satisfaction index – Arpico 139
Table 10 SUPER TEST - KEELLS 140
Table 11 Correlation between income level and price expectations 147
Table 12 Correlation between service quality and overall satisfaction S1 148
Table 13 Correlation between service quality and overall satisfaction S2 149
Table 14 Correlation between service quality and overall satisfaction S3 150
Table 15 Correlation between service quality and overall satisfaction S4 151
Table 16 Correlation between product quality and overall satisfaction 152
Table 17 Correlation between prices paid and overall satisfaction 153
Table 18 Hypothesis testing of H1 using a null hypothesis 157
Table 19 Hypothesis testing of H2 using a null hypothesis 158
Table 20 Hypothesis testing of H3 using a null hypothesis 159
Table 21 Summary of regression model for all supermarkets 160

LIST OF APPENDICES
Appendix I
I - A Report of the pilot study to establish the research problem. 115
I - B Questionnaire used for the pilot study 119
I - C Respondent profile of the pilot study 121
I - D1 Service quality gaps identified in the pilot study 122
I - D2 Service quality gaps identified in the pilot study-graph 123
Appendix II
II - A Guidelines used for the interviews 124
II - B Questionnaire used for the main study 125
Appendix III
III - A Classification of the retail formats in Sri Lanka 129
III - B Names of supermarkets operating in Sri Lanka 130
III - C Geographical distribution of supermarkets 132
III - D Geographical distribution of supermarkets - map 133
III - E Turnover of the five supermarkets 134
III - F Growth in turnover of five supermarkets – 2000/2002 135
III - G Change in sales share between five supermarkets 136
III - H Growth in supermarket outlets 137
III - I Supermarket retail life cycle 138
III - J Customer satisfaction index – Arpico 139
III - K Keels Super Test , service quality measurement technique. 140
III - L Complains handling unit at the ministry of commerce 141
LIST OF APPENDICES (Continued)
Appendix IV
IV - A Frequency of visits 142
IV - B Gender break down of the respondents 143
IV - C Marital status of respondents 144
IV - D Age distribution of respondents 145
IV - E Household income distribution of respondents 146
IV - F Correlation between income and price expectations 147
IV - G 1- 4 Tabulation of results for service quality – S1 to S4 148
IV - H Correlation between product quality and overall satisfaction 152
IV - I Correlation between prices paid and overall satisfaction 153
IV - J Results of the multiple regression analysis 154
IV - K 1-3 Hypotheses Testing 157
IV - L Summary of the regression analysis 160
Appendix V
V - A SUPER GAP TEST questionnaire 161
V - B Score method 162
V - C1 Gap method – service quality 165
V - C2 Gap method – product quality/prices paid 166
V - D1 Percentage method – table for all 167
V - D2 Percentage method – service quality – graphical 169
V - D3 Percentage method – product quality/prices - graphical 170
V - E1 Importance perception matrix – service statements 171
V - E2 Importance perception matrix – product statements 172
V - E3 Importance perception matrix – sub dimensions 173
V - E4 Importance perception matrix – dimensions 174
V - F Gaps & strategy interface 175
V - G SUPER GAP MONITER – Index to monitor performance 177

ACKNOWLEDEGEMENT
The writer would like to acknowledge the contribution made by several individuals in making
this research study a success.
A special note of appreciation is extended towards, Dr. Uditha Liyanage, for his insights in
guiding and supervising this research study.
The PIM librarian staff together with the librarians of the University of Colombo, University of
Sri Jayewardenepura, and the American Center is commended for an excellent job done in
extracting important articles required for the research.
The managers and the executives of Jaykay Marketing, Cargills Food City, Sentra, Sathosa and
Arpico supermarkets needs a special word of thanks for the support extended in carrying out this
study. The contribution by Mr. Shantha Kularatne at Arpico, Mr. Kumar De Silva at Jaykay
Marketing, Mr. Daraniyagala at Sentra and Mr. Wasantha Wanigasooriya at Sathosa is
appreciated for spending time explaining their operations and coordinating arrangements for the
writer in carrying out the study in their supermarkets.
Mrs. Niranjala Sendanayake at Lanka Market Research Bureau, Mr. Lohitha Karunaratne at
Arpico, Mr Dusty Alahakoon at Ceylon Tobacco Company is thanked for the extended support
given in helping the writer to compute and analyse data in interpreting the outcome of the study.
The director, the members of the faculty and all the staff at PIM, are acknowledged for their
immense contribution extended to me during my stay at PIM.
Finally I would like to thank my wife Tania for her unstinted support given in making this a
reality and my son Arith, as young as he is, in understanding his father spending long hours
away from him in completing this study.
ABSTRACT
The focus of this research study is measuring service quality as a basis for developing retail
strategies for the supermarkets in Sri Lanka. The study limits its scope to supermarkets, which
sells fast moving consumer goods (FMCG).
As identified in literature, service quality assessment is the discrepancy between the
expectations of a service and the perceived performance of that service. If perceived
performance meets or exceeds the expectation, then service quality could be regarded as good
(positive or no gap) and if it falls short of the expectation, then service quality could be stated as
poor (negative gap). The core problem that this research addresses is the non-recognition of
service quality gaps by Sri Lankan supermarkets in serving their customers. The writer argues
that this may result in a decrease in the overall satisfaction among customers in shopping in
supermarkets. The writer defines non-recognition of service quality as a combination of
measurement and awareness of service quality gaps by the supermarkets.
In studying the above problem, this research study unfolds four clear objectives.
The first objective is to assess the state of service quality recognition levels in the supermarkets
in Sri Lanka. In achieving this objective the writer develops the service quality recognition
matrix, which is a combination of two dimensions, as per the definition given for service quality
recognition. Through the intersection of these two dimensions, four types of supermarkets are
argued to be in force. These are
S1 type – Supermarkets that measure and are aware of service quality gaps.
S2 type – Supermarkets that measure but are not aware of service quality gaps.
S3 type – Supermarkets that does not measure but has an idea of the service quality
S4 type – Supermarkets that does not measure neither are aware of service quality gaps.
Five of the largest supermarkets, which sell FMCG products in Sri Lanka, were studied and
were plotted into this matrix based on their level of awareness and how they measure service
quality gaps in their supermarkets
The second objective set for the research was to study the relationship between the recognition
of service quality and the overall satisfaction in shopping in supermarkets. The writer questioned
the relationship between service quality gaps and the overall satisfaction in shopping in
supermarkets in depth and presented his argument that S1 type supermarkets would increase
their customer satisfaction with service quality leading to a higher impact on the overall
customer satisfaction than the rest. A conceptual model was developed where three hypotheses
were presented for testing which essentially stated that the overall satisfaction of customers who
shop in S1 type supermarkets are greater than customers who shop in either S2, S3 or S4 types.
The rationale for this argument was that supermarkets, which had a high level of service quality
recognition level, understood the gaps better than the others. Through the development of retail
strategies they were able to close some of those negative gaps efficiently than the rest.
The third objective set for the research was to identify the influence of satisfaction with product
quality and satisfaction with prices paid on the overall satisfaction of the super market customer.
In order to test the second and the third objectives, a questionnaire survey was carried out among
4 supermarkets representing each of the quadrants of the service quality recognition matrix. The
overall satisfaction of those supermarkets was arrived at by measuring gaps in service quality,
product quality and satisfaction with prices paid. The questionnaire was adapted by a similar
study done in supermarkets in Spain with minimum changes. The findings suggested that the
overall satisfaction of S1 supermarkets were higher than S2, S3 or S4 in terms of an average.
However during the hypotheses test, although S1 satisfaction was significantly higher than S2
and S3, it was not significantly different from S4. This lead to the rejection of hypotheses three.
(S1 satisfaction > S4 satisfaction).
In understanding the possible reasons for the above relationships through correlation analysis,
multiple regression analysis, and analysis of supermarket customer segments and through other
cross analysis, the following conclusions were arrived at.
The customers of the four supermarkets could be clearly segmented into two distinct groups
based on their level of income and price expectations. They are price inelastic customer
segments (S1 and S2) and price elastic customer segments (S3 & S4)
Service quality appears to have a significant impact on the overall satisfaction of all
supermarkets.
Satisfaction with product quality acted as a qualifying criterion in influencing the overall
satisfaction of supermarket customers irrespective of segments.
In more price inelastic markets, service quality acts as a clear determinant of overall
satisfaction while satisfaction with product quality and prices paid acts as qualifiers. In more
price elastic markets, satisfaction with prices would become a clear differentiator of overall
satisfaction while product quality and service quality would act as qualifiers.
The above findings explain why the third hypothesis which compared overall satisfaction with
price inelastic (S1) and price elastic (S4) market segments had different levels of influence from
service quality and prices. The original conviction of the writer, which stated service quality as a
determining criterion of satisfaction did not hold true for every situation. The overall conclusion
was that the impact of service quality, product quality and prices paid in influencing the overall
satisfaction needs to be understood and commented based on the respective market segments the
supermarkets were targeting to.
The fourth and the final objective of this study was to make strategy recommendations in closing
service quality gaps. As recommendations the writer will present a four-step model, which gives
new insights as to how, service quality, product quality and gaps in prices paid should be
measured using the SUPER GAP TEST as suggested by the writer. Insights into how gaps could
be quantified using three techniques namely the score method, gap method and the percentage
method will be discussed in length. Recommendations were also made giving the supermarkets
two strategy tools, which could be used as diagnostic tools in bridging the gaps in service
quality. A proposal is made in developing an index in measuring and monitoring the
implementation of the strategies in closing gaps. Finally the writer also recommends two generic
strategies for supermarkets to consider influencing the overall customer satisfaction for both
types of segments that were identified in the research.

TABLE OF CONTENTS
List of Illustrations …………………………. ii
List of Tables …………………………. iv
List of Appendices …………………………. v
Acknowledgement …………………………. vii
Abstract …………………………. viii
PART I
CHAPTER I - INTRODUCTION
1. Background …………………………. 01
2. Research problem …………………………. 01
3. Justification of the problem …………………………. 02
4. Objectives of the study …………………………. 03
5. Significance of the study …………………………. 04
6. Scope of the study …………………………. 05
7. Chapter framework …………………………. 06
CHAPTER II - LITERATURE REVIEW
1. Introduction …………………………. 07
2. Definition of service quality …………………………. 07
3. Service quality and the service marketing mix …………………. 09
4. Techniques in measuring service quality ……………….………… 12
5. Service quality, product quality, prices and customer satisfaction 21
6. Developing retail mix strategies ………………………….. 25
7. Summary …………………………. 44
CHAPTER III - CONCEPTUAL FRAMEWORK & METHODOLOGY
1. Introduction …………………………. 45
2. Research question …………………………. 45
3. Argument …………………………. 45
4. Conceptual framework ………………………… 46
5. Hypothesis ………………………… 49
6. Definition of key concepts ………………………… 50
7. Operationalisation ………………………… 51
8. Methodology ………………………… 55
8.1 Methodology of collecting information ……………………. 55
8.2 Selection of the sample ………………………… 55
8.3 Questionnaire design ………………………… 55
8.4 Method of data analysis ………………………… 57
9. Limitations of the study …………………………. 58
10. Summary …………………………. 59
PART II
CHAPTER IV – PRESENT SERVICE QUALITY RECOGNITION LEVELS
1. Introduction …………………………. 60
2. Super markets at a glance ………………………… 61
3. Arpico Super centers ………………………… 62
4. Cargills Super markets ………………………… 66
5. Keells Super markets ………………………… 70
6. Sathosa Super markets ………………………… 74
7. Sentra Super markets ………………………… 76
8. Service quality recognition matrix for the five supermarkets …….. 79
9. Summary …………………………. 80
CHAPTER V – DATA ANALYSIS AND DISCUSSION OF FINDINGS
1. Introduction ………………………….. 81
2. Target market profile of the sample ………….……………….. 81
3. Identifying super market segments …….……………………. 83
4. Findings on service quality recognition and overall satisfaction…… 85
5. Findings on product quality and overall satisfaction ……………… 86
6. Findings on prices paid and overall satisfaction ……………..……. 86
7. Discussion of finding of the multiple regression analysis …………. 87
8. Testing of hypothesis ………………………….. 89
9. Summary ………………………….. 91
CHAPTER VI – CONCLUSIONS
1. Introduction ………………………….. 92
2. Service quality recognition in Sri Lankan supermarkets .…………. 92
3. Relationships between gaps and satisfaction of those attributes…… 92
4. Relationships between service quality and overall satisfaction ..….. 94
5. Relationships between product quality and overall satisfaction ..….. 94
6. Relationships between prices paid and overall satisfaction ……….. 95
7. Service and prices vs overall satisfaction ………………………….. 96
8. Conclusions from hypothesis testing …………………………. 97
9. Overall conclusion of the study …………………………. 99
10. Summary …………………………. 100
CHAPTER VII – RECOMMENDATIONS
1. Introduction …………………….… 101
2. Four step process approach in closing gaps ………. .…………….. 102
3. Step one – Measuring gaps …………………….… 103
4. Step two – Analysing the gaps .……………………… 104
5. Step three – Building strategies to close gaps …..…………………. 106
6. Step four – Monitoring gaps .………………………. 110
7. Overall strategies based on research findings ……………………… 112
8. Summary ………………………. 114
Appendix I - Pilot study results …………………………. 115
Appendix II - Questionnaires used for the research …………... 124
Appendix III - Glance at the supermarket industry in Sri Lanka 129
Appendix IV - Survey data …………………………. 142
Appendix V - Recommendations …………………………. 161
List of references …………………………. 179
Bibliography …………………………. 182
Interview schedule …………………………. 183
1
Chapter I
INTRODUCTION
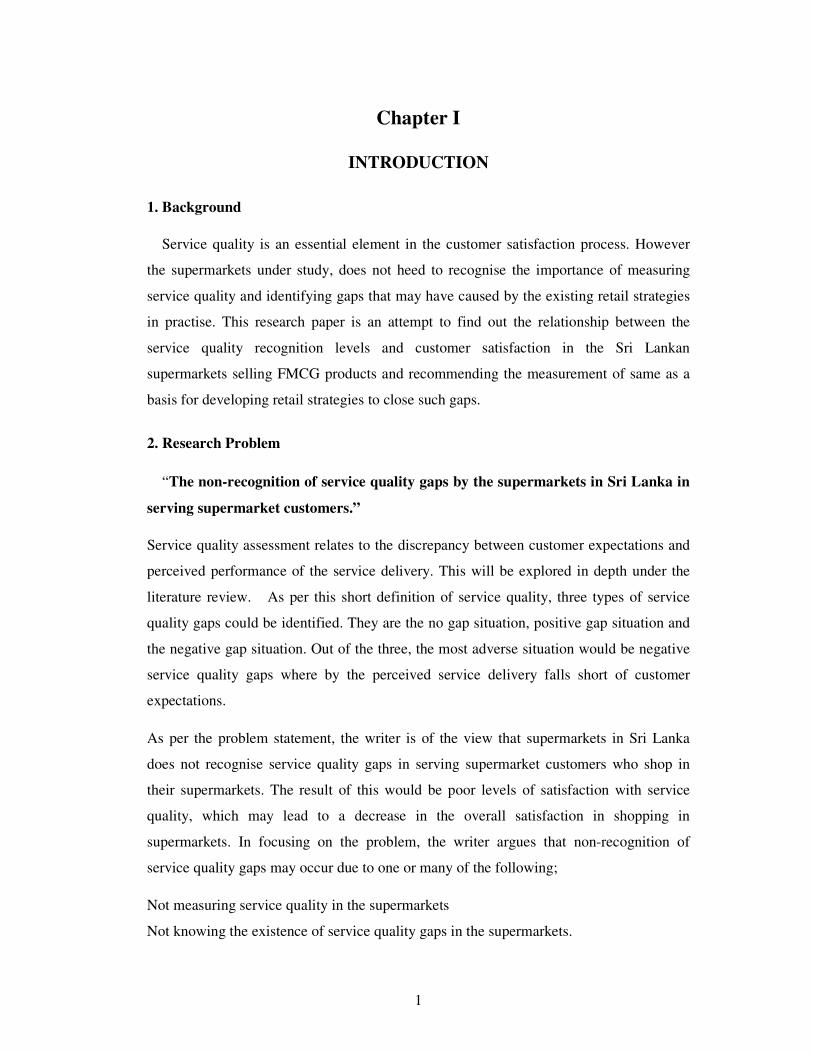
1. Background
Service quality is an essential element in the customer satisfaction process. However
the supermarkets under study, does not heed to recognise the importance of measuring
service quality and identifying gaps that may have caused by the existing retail strategies
in practise. This research paper is an attempt to find out the relationship between the
service quality recognition levels and customer satisfaction in the Sri Lankan
supermarkets selling FMCG products and recommending the measurement of same as a
basis for developing retail strategies to close such gaps.
2. Research Problem
“The non-recognition of service quality gaps by the supermarkets in Sri Lanka in
serving supermarket customers.”
Service quality assessment relates to the discrepancy between customer expectations and
perceived performance of the service delivery. This will be explored in depth under the
literature review. As per this short definition of service quality, three types of service
quality gaps could be identified. They are the no gap situation, positive gap situation and
the negative gap situation. Out of the three, the most adverse situation would be negative
service quality gaps where by the perceived service delivery falls short of customer
expectations.
As per the problem statement, the writer is of the view that supermarkets in Sri Lanka
does not recognise service quality gaps in serving supermarket customers who shop in
their supermarkets. The result of this would be poor levels of satisfaction with service
quality, which may lead to a decrease in the overall satisfaction in shopping in
supermarkets. In focusing on the problem, the writer argues that non-recognition of
service quality gaps may occur due to one or many of the following;
Not measuring service quality in the supermarkets
Not knowing the existence of service quality gaps in the supermarkets.
2
3. Justification of the Research Problem
Lack of published empirical studies on the supermarket industry in Sri Lanka deprives
the writer in quoting previous work in providing evidence that the problem stated is in
existence. A pilot study was commissioned for this purpose.
In order to prove that there is a state of non-recognition of service quality in supermarkets
in Sri Lanka, highlighting the existence of service quality gaps would provide sufficient
evidence for the existence of the problem at hand. Out of the three service quality gaps
that the writer mentioned above, the existence of negative service quality gaps (where the
expected service falls short of the perceived service level) might seem to be harmful to
the supermarkets. No supermarket would like to operate with these negative gaps if they
are aware of its existence. On the other hand a “No gap” situation or a “Positive gap”
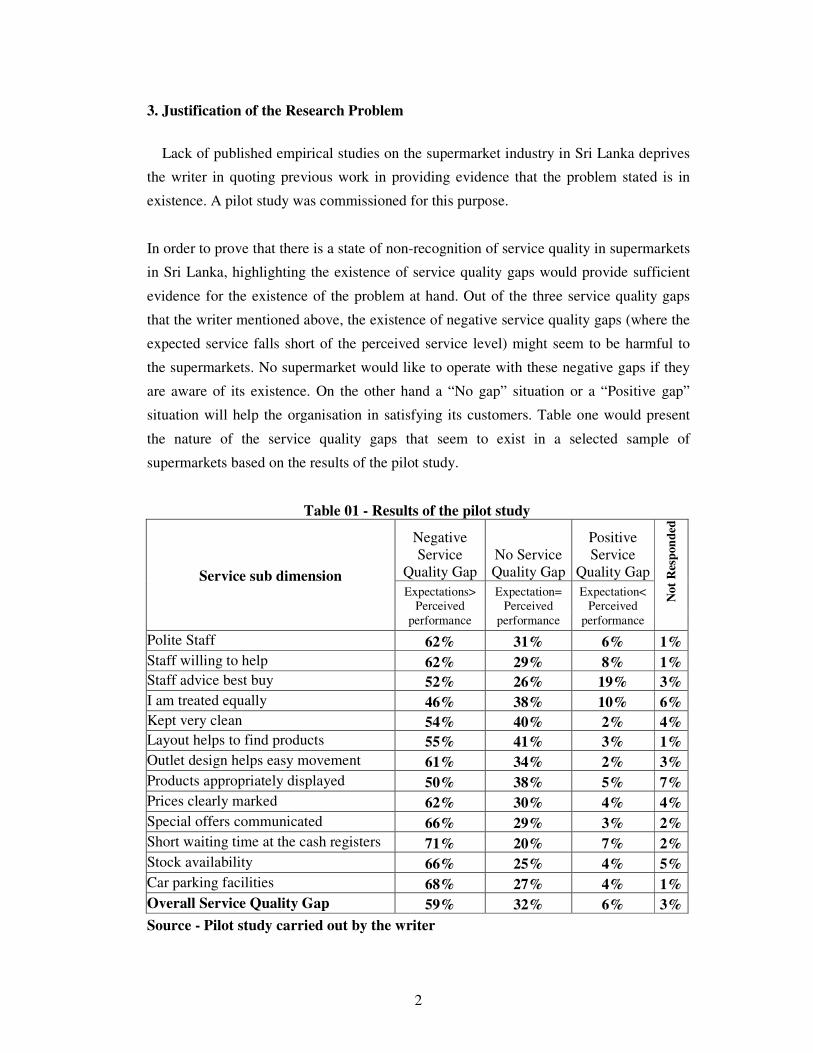
situation will help the organisation in satisfying its customers. Table one would present
the nature of the service quality gaps that seem to exist in a selected sample of
supermarkets based on the results of the pilot study.
Table 01 - Results of the pilot study
Service sub dimension
Negative
Service
Quality Gap
No Service
Quality Gap
Positive
Service
Quality Gap
No
t R
esp
on
ded
Expectations>
Perceived
performance
Expectation=
Perceived
performance
Expectation<
Perceived
performance
Polite Staff 62% 31% 6% 1%
Staff willing to help 62% 29% 8% 1%
Staff advice best buy 52% 26% 19% 3%
I am treated equally 46% 38% 10% 6%
Kept very clean 54% 40% 2% 4%
Layout helps to find products 55% 41% 3% 1%
Outlet design helps easy movement 61% 34% 2% 3%
Products appropriately displayed 50% 38% 5% 7%
Prices clearly marked 62% 30% 4% 4%
Special offers communicated 66% 29% 3% 2%
Short waiting time at the cash registers 71% 20% 7% 2%
Stock availability 66% 25% 4% 5%
Car parking facilities 68% 27% 4% 1%
Overall Service Quality Gap 59% 32% 6% 3%
Source - Pilot study carried out by the writer
3
The above table clearly indicates that almost in all the dimensions tested, more than 50%
of the respondents felt that the perceived performance of the service had fallen short of
their expectations of that service. The overall negative percentage was 59%. Only 6%
felt that the perceived performance encountered was more than their expecatations. 32%
experienced a no gap situation meaning that they were satisfied with the experience when
comparing with their expectations.
When you analyse the above service quality gaps, one could say that if supermarkets
recognise service quality gaps then no supermarket would allow the existence of negative
service quality gaps as it may lead to customer dissatisfaction. This it self proves that the
level of service quality recognition by supermarkets at present is very low.
The reader is requested to refer appendix one A – D of this study for the methodology
used, the sample chosen, the questionnaire used and the detailed quantification of the
service quality gaps of the pilot study.
4. Objectives of the Study
There are four objectives set to achieve in this study. They are as follows;
1) To assess the present service quality recognition levels of the supermarkets, which
sell FMCG products in Sri Lanka, based on the existing techniques used in
measuring service quality and their level of awareness of such gaps.
2) To study the relationship between the recognition of service quality and the
overall satisfaction in asserting their level of influence on the overall satisfaction
of supermarket customers.
3) To ascertain the influence of satisfaction with product quality and prices paid on
the overall satisfaction of supermarket customers.
4) To recommend a process in closing gaps to increase overall satisfaction of
supermarket customers by developing retail strategies.
4
5. Significance of the Study.
The significance of this study is presented from the three points of view as identified
by the writer.
The significance of service quality in the overall satisfaction of supermarket customers.
The significance of the study to the super market operators in Sri Lanka.
The significance of the supermarket industry to the Sri Lankan consumers
In assessing the significance of service quality for the overall satisfaction, literature
clearly points out the significance of service quality in influencing the overall satisfaction
of the customers in terms of the pre purchase evaluation as well as the post purchase
satisfaction of customers. This will be explored in the literature review in detail.
In discussing the significance of the study to the super market operators in Sri Lanka the
following are sited as valid inputs.
The assessment of present service quality recognition levels in the industry would give
the major operators an opportunity to asses their stand in the process. This study will
present techniques in measuring service quality in quantifying the existing gaps. This in
turn would help supermarkets to understand gaps more preciously in finding solutions.
The investigation of the relationship between service quality, product quality and the
prices paid in influencing the overall satisfaction process would help supermarkets to
prioritise those three elements in their strategies as per their influence.
The suggested tools and strategies in closing service quality gaps would allow the
operators in enhancing overall customer satisfaction levels in the industry inducing the
non users to patronise supermarkets for their shopping needs.
In terms of the importance of the supermarket industry to the Sri Lankan consumer, the
following trends would allow the reader to understand its significance.
Lifestyle of the Sri Lankan consumer is fast changing. It is moving away from a
traditional timeless orientation to a more time bound orientation. The large number of
women entering the work force, the increased number of women opting to higher
education has made time, a factor that most Sri Lankans tend to compete today. This has
made convenience, a number one priority among many customers. In this regard the
5
concept of one stop shopping which the supermarkets promote would allow a continuous
growth opportunity for the industry.
The number of supermarkets operating in Sri Lanka in recent times has expanded rapidly.
As per the data available there are approximately 270 supermarket outlets offering FMCG
products in major areas in the country where the super five chains control 75% of the
outlets. The change in government policy in expanding the service facilities in this sector
through restructuring of the market leader SATHOSA, has created precedence a new set
of norms are being imposed on the industry enhancing customer service.
The high-end supermarkets, which traditionally served the higher segments in society, is
moving down to the middle and lower segments having identified there potential. The
entry of the Sentra supermarket chain together with the restructuring of the SATHOSA
chain has brought the concept of discounted super marketing into the country taking super
marketing into the masses.
The above reasons will justify the significance of this study.
6. Scope of the Study
The scope of the study is limited to the retailing supermarket industry, which sells fast
moving consumer goods (FMCG). The qualifying criteria in identifying them would be
outlets, which offer;
Goods to the retail customers for final consumption
Goods which are on self service display
Outlets which sell FMCG goods
Examples of organizations that are involved in this industry would be, Cargills Food City,
Keells Super, Arpico Supercentres, Sentra, Crystals, Sathosa supermarkets & other
regional supermarkets. Other retail outlets, which sell different goods or similar goods
without self-service, will not be included into this study for reasons of manageability. As
an outcome of this study, specific organisations would be able to recognise service quality
gaps and build retail strategies in reducing negative gaps influencing an increase the
overall satisfaction of supermarket customers.
6
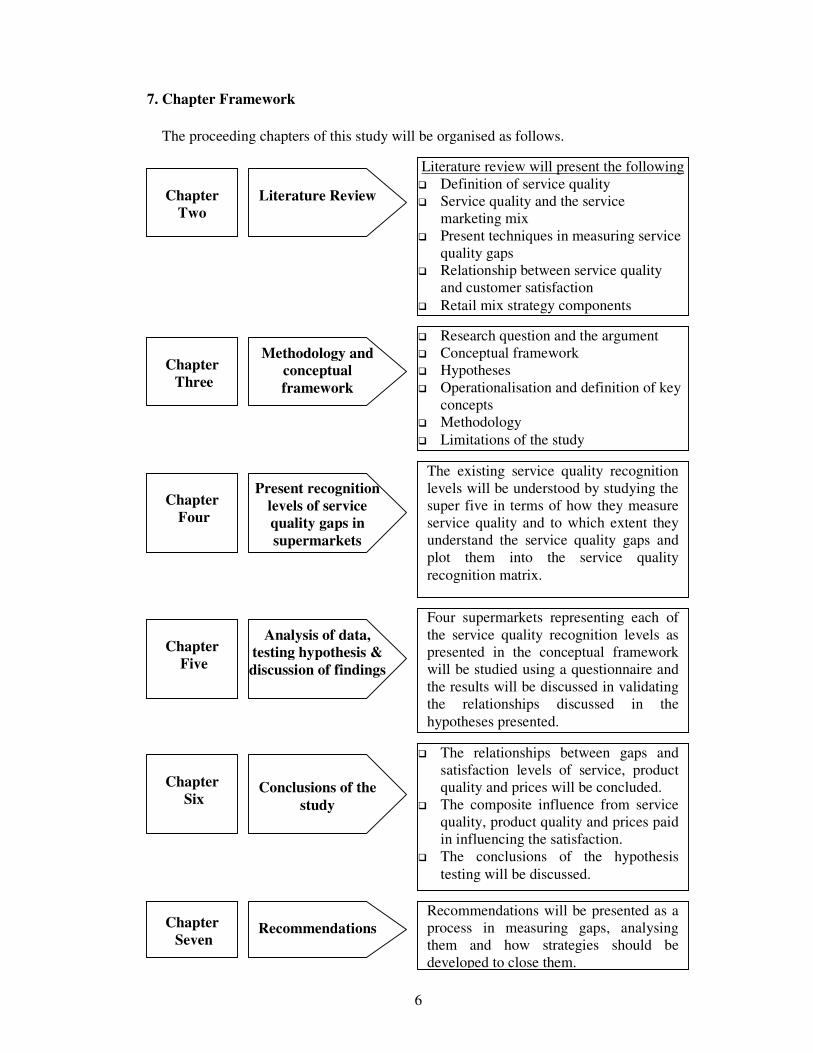
7. Chapter Framework
The proceeding chapters of this study will be organised as follows.
Chapter
Two
Literature review will present the following
� Definition of service quality
� Service quality and the service
marketing mix
� Present techniques in measuring service
quality gaps
� Relationship between service quality
and customer satisfaction
� Retail mix strategy components
Literature Review
Chapter
Three
Methodology and
conceptual
framework
� Research question and the argument
� Conceptual framework
� Hypotheses
� Operationalisation and definition of key
concepts
� Methodology
� Limitations of the study
Chapter
Four
Present recognition
levels of service
quality gaps in
supermarkets
The existing service quality recognition
levels will be understood by studying the
super five in terms of how they measure
service quality and to which extent they
understand the service quality gaps and
plot them into the service quality
recognition matrix.
Chapter
Five
Analysis of data,
testing hypothesis &
discussion of findings
Four supermarkets representing each of
the service quality recognition levels as
presented in the conceptual framework
will be studied using a questionnaire and
the results will be discussed in validating
the relationships discussed in the
hypotheses presented.
Chapter
Six
Conclusions of the
study
� The relationships between gaps and
satisfaction levels of service, product
quality and prices will be concluded.
� The composite influence from service
quality, product quality and prices paid
in influencing the satisfaction.
� The conclusions of the hypothesis
testing will be discussed.
Chapter
Seven
Recommendations
Recommendations will be presented as a
process in measuring gaps, analysing
them and how strategies should be
developed to close them.
7
Chapter II
LITERATURE REVIEW
1. Introduction
The literature review is presented in several sections in this chapter. Section two will
examine the definition of service quality. Section three will identify the elements of the
service marketing mix that would fall under service quality. Section four will present
knowledge of the existing dimensions & techniques used in measuring service quality in
general for the service industry and in particularly for the selected retailing supermarket
industry. This section will also discuss how service quality could be monitored over time
very briefly. Section five will review existing knowledge on the relationships between
service quality and customer satisfaction and other influences of customer satisfaction.
Finally section six will look at the components of the retail mix strategies in getting more
insights in building retail strategies.
2. Definition of Service Quality
The following are some definitions given by some researchers who have pioneered the
service quality theory.
The perceive service quality will be the result of an evaluation process in which
customers compare their perceptions of service delivery and its out come against what
they expect ” (Christian Gronroos : 1984)
The discrepancy between customer expectations and perceptions of service
(Parasuraman, Zeithamal and Berry: 1988)
A measure of how well the service level (perception) matches customer expectation.
Delivering quality service means conforming to customer expectations on a
continuous basis. (Lewis and Booms: 1989).
The above definitions clearly identify two components of service quality. They are
1) Expectations of the service
2) Perceived performance of that service encounter.
8
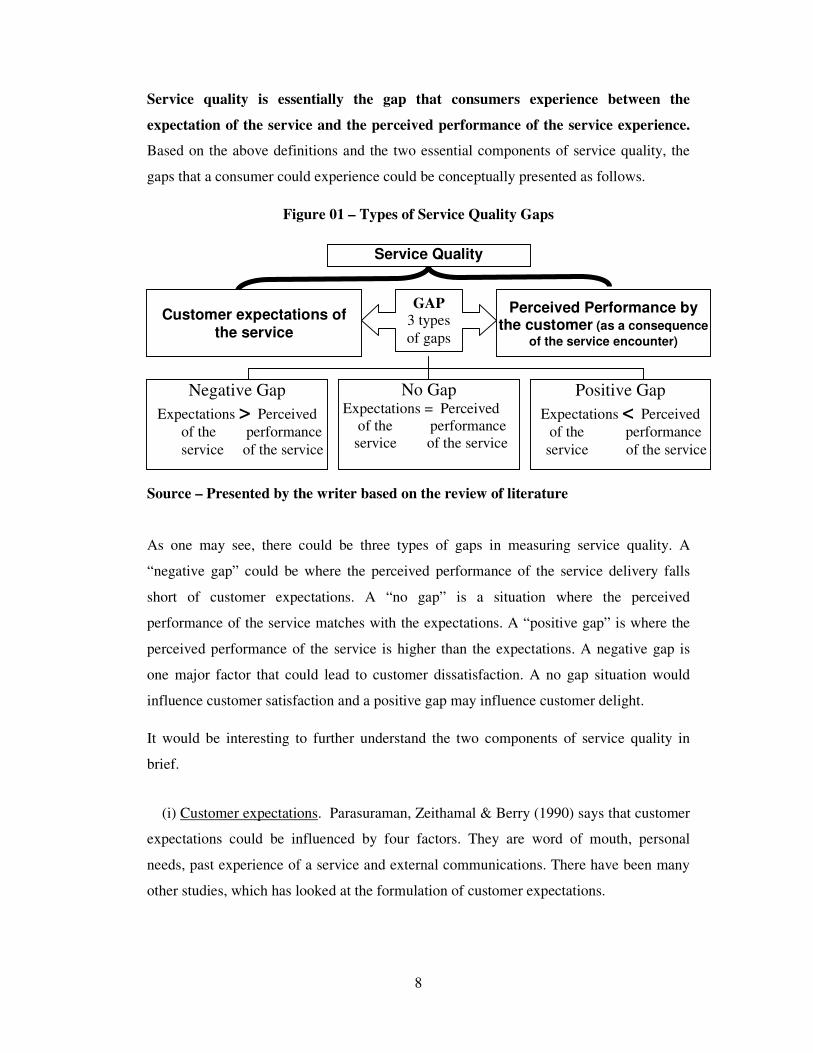
Service quality is essentially the gap that consumers experience between the
expectation of the service and the perceived performance of the service experience.
Based on the above definitions and the two essential components of service quality, the
gaps that a consumer could experience could be conceptually presented as follows.
Figure 01 – Types of Service Quality Gaps
Source – Presented by the writer based on the review of literature
As one may see, there could be three types of gaps in measuring service quality. A
“negative gap” could be where the perceived performance of the service delivery falls
short of customer expectations. A “no gap” is a situation where the perceived
performance of the service matches with the expectations. A “positive gap” is where the
perceived performance of the service is higher than the expectations. A negative gap is
one major factor that could lead to customer dissatisfaction. A no gap situation would
influence customer satisfaction and a positive gap may influence customer delight.
It would be interesting to further understand the two components of service quality in
brief.
(i) Customer expectations. Parasuraman, Zeithamal & Berry (1990) says that customer
expectations could be influenced by four factors. They are word of mouth, personal
needs, past experience of a service and external communications. There have been many
other studies, which has looked at the formulation of customer expectations.
Customer expectations of the service
Perceived Performance by the customer (as a consequence
of the service encounter)
Service Quality
GAP
3 types
of gaps
Negative Gap
Expectations > Perceived
of the performance
service of the service
No Gap Expectations = Perceived
of the performance
service of the service
Positive Gap
Expectations < Perceived
of the performance
service of the service

9
(ii) Perceived performance. Bitner (1994) says that customer’s perceived performance is
created through the “moments of truths” that occur whenever the customer encounters the
service organization. Through such moments of truth encounters, perceptions of service
accumulate over time leading to the determination of service quality gaps by a
comparison of the perceived performance against the expectations.
Service quality is an important issue due to many reasons.
The first aspect would be that over half of our gross domestic production is contributed
from the service industry. This is also a trend world over.
Secondly almost all organizations compete to some degree on the basis of service.
Thirdly superior service quality is proving to be a winning strategy in gaining competitive
advantage. The importance of the concept is self-evident.
3. Service Quality and the Service Marketing Mix.
In many literature on service, it has been argued that the four “P”s of the traditional
marketing mix does not reflect the entirety of the service situation, as a service is
differentiated from a physical product with features such as intangibility, perishability,
variation of the service delivery and inseparability. The traditional marketing mix has
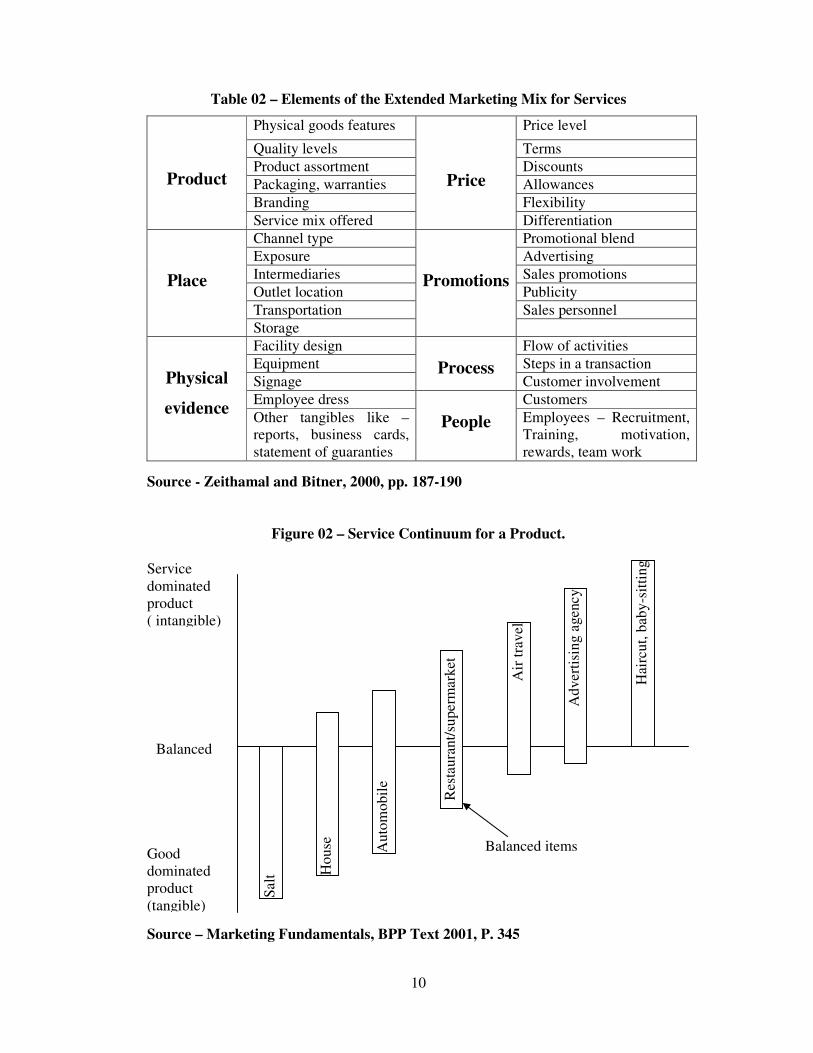
been extended to seven “P”s for service situations. Zeithaml and Bitner (2000) present the
elements of the extended marketing mix for services as follows. Please refer table two in
page ten.
In determining which elements of the service marketing mix is represented by service
quality, one may have to understand the nature of the service on offer it self. Levitt says
That there is no such thing such as service industries. There are only industries whose
service components are greater or less than those of other industries. Every body is in
service. (Levitt : 1972)
Based on Levitt’s argument the service continuum was developed which indicates
different degrees of tangibility/intangibility of a product. Please refer figure two in page
ten for the service continuum of a product.
10
Table 02 – Elements of the Extended Marketing Mix for Services
Product
Physical goods features
Price
Price level
Quality levels Terms
Product assortment Discounts
Packaging, warranties Allowances
Branding Flexibility
Service mix offered Differentiation
Place
Channel type
Promotions
Promotional blend
Exposure Advertising
Intermediaries Sales promotions
Outlet location Publicity
Transportation Sales personnel
Storage
Physical
evidence
Facility design
Process
Flow of activities
Equipment Steps in a transaction
Signage Customer involvement
Employee dress
People
Customers
Other tangibles like –
reports, business cards,
statement of guaranties
Employees – Recruitment,
Training, motivation,
rewards, team work
Source - Zeithamal and Bitner, 2000, pp. 187-190
Figure 02 – Service Continuum for a Product.
Source – Marketing Fundamentals, BPP Text 2001, P. 345
Service
dominated
product
( intangible)
Good
dominated
product
(tangible)
Balanced
Salt
Ho
use
Au
tom
ob
ile
Res
tau
ran
t/su
perm
ark
et
Air
tra
vel
Ad
vert
isin
g a
gen
cy
Hai
rcu
t, b
aby
-sit
tin
g
Balanced items
11
Based on this continuum one will see that each product will have different levels of
physical product elements and service elements in the product offer. If you take super
marketing, it would come under the balance item where the quality of the physical goods
and the intangible aspects such as service elements are equally important in the product
composition in satisfying the customer.
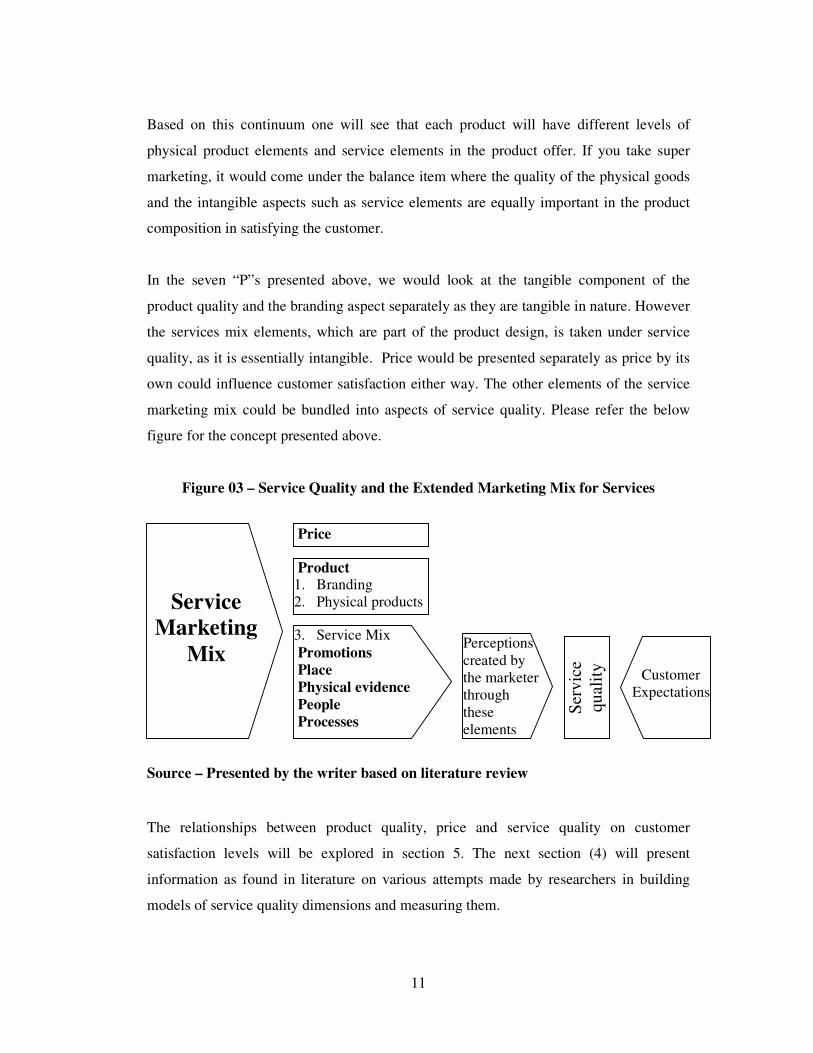
In the seven “P”s presented above, we would look at the tangible component of the
product quality and the branding aspect separately as they are tangible in nature. However
the services mix elements, which are part of the product design, is taken under service
quality, as it is essentially intangible. Price would be presented separately as price by its
own could influence customer satisfaction either way. The other elements of the service
marketing mix could be bundled into aspects of service quality. Please refer the below
figure for the concept presented above.
Figure 03 – Service Quality and the Extended Marketing Mix for Services
Source – Presented by the writer based on literature review
The relationships between product quality, price and service quality on customer
satisfaction levels will be explored in section 5. The next section (4) will present
information as found in literature on various attempts made by researchers in building
models of service quality dimensions and measuring them.
Product 1. Branding
2. Physical products
Price
Service
Marketing
Mix 3. Service Mix
Promotions
Place
Physical evidence
People
Processes
Ser
vic
e
qu
alit
y
Customer
Expectations
Perceptions
created by
the marketer
through
these
elements

12
4. Techniques in Measuring Service Quality
In this section the writer will examine the dimensions and techniques used to
measuring service quality. Also literature, which discusses how service quality measures
are monitored over time, are also explored.
There are many methodologies suggested in literature in measuring service quality and
service quality dimensions. The origins of the service quality theory lie in the literature
presented on product quality and customer satisfaction. However in recent times there had
been much research on service quality. It is said that service quality is the most
researched topic to date. The following are some of the important elements of the service
quality theories presented by different researchers. They are as follows
(i) The Nordic Model by Gronroos in 1984.
This is one of the earliest models of service quality presented in 1984 by Christain
Gronroos. It essentially highlights two service dimensions in measuring service quality.
The following diagram will elaborate this further.
Figure 04 – Nordic Model of Perceived Service Quality
Source – Gronroos, 1982, p. 79 (adopted)
As presented above, the Nordic model presents service quality as the interaction between
expected service and the perceived performance of the service. The gaps are similar to
that presented in the definition.
Expected Service Perceived performance
of the service Perceived Service Quality
Technical Quality
� Technical solutions
� Know how
� Computerized systems
� Machines
Functional Quality � Attitudes, behaviour
� Customer contacts
� Accessibility
� Appearances
� Service mindness
� Internal relations
13
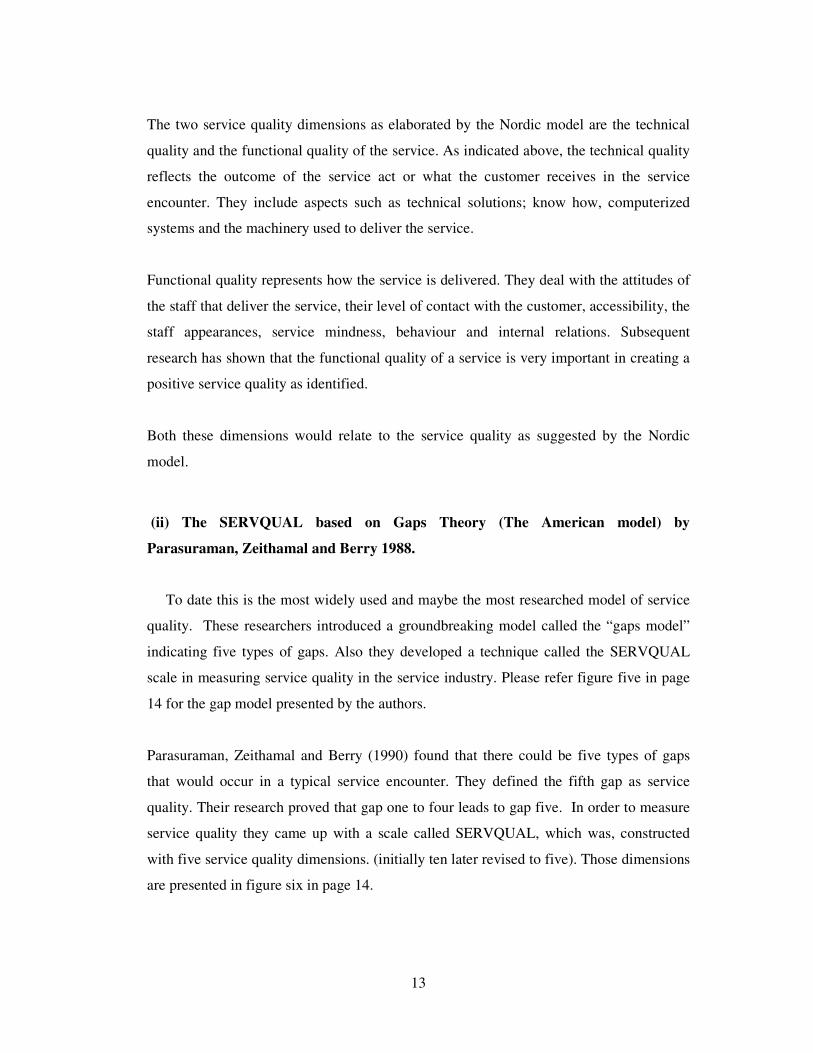
The two service quality dimensions as elaborated by the Nordic model are the technical
quality and the functional quality of the service. As indicated above, the technical quality
reflects the outcome of the service act or what the customer receives in the service
encounter. They include aspects such as technical solutions; know how, computerized
systems and the machinery used to deliver the service.
Functional quality represents how the service is delivered. They deal with the attitudes of
the staff that deliver the service, their level of contact with the customer, accessibility, the
staff appearances, service mindness, behaviour and internal relations. Subsequent
research has shown that the functional quality of a service is very important in creating a
positive service quality as identified.
Both these dimensions would relate to the service quality as suggested by the Nordic
model.
(ii) The SERVQUAL based on Gaps Theory (The American model) by
Parasuraman, Zeithamal and Berry 1988.
To date this is the most widely used and maybe the most researched model of service
quality. These researchers introduced a groundbreaking model called the “gaps model”
indicating five types of gaps. Also they developed a technique called the SERVQUAL
scale in measuring service quality in the service industry. Please refer figure five in page
14 for the gap model presented by the authors.
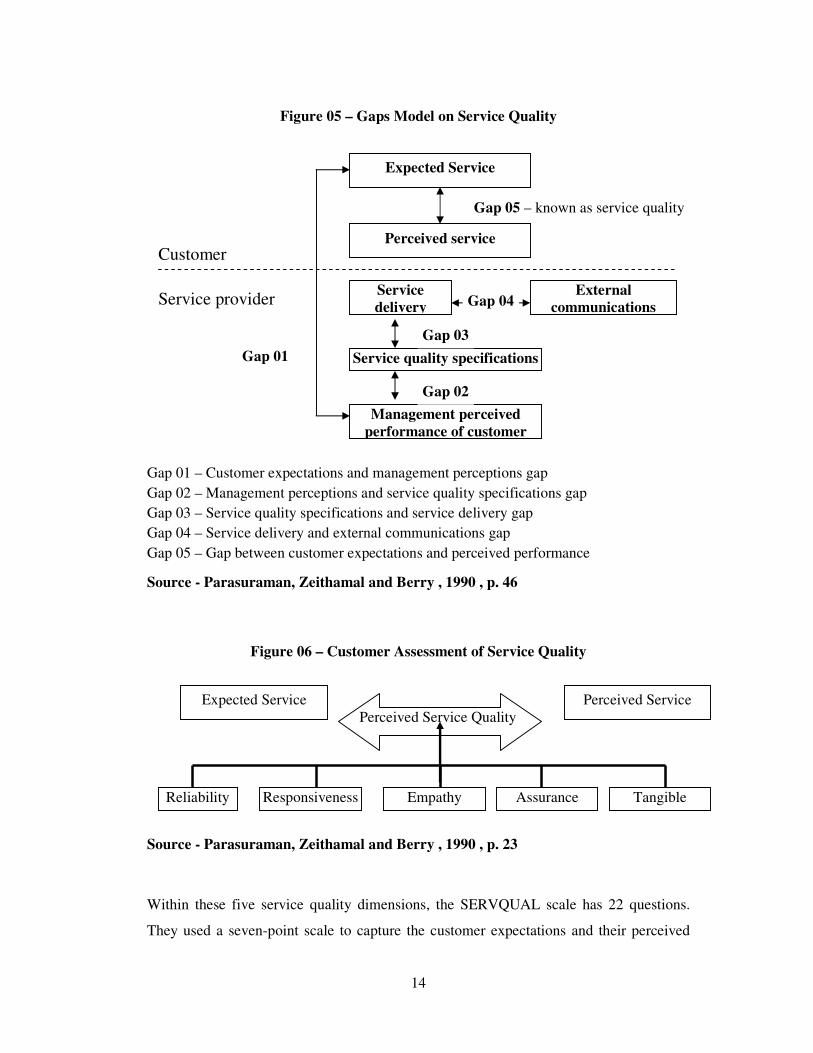
Parasuraman, Zeithamal and Berry (1990) found that there could be five types of gaps
that would occur in a typical service encounter. They defined the fifth gap as service
quality. Their research proved that gap one to four leads to gap five. In order to measure
service quality they came up with a scale called SERVQUAL, which was, constructed
with five service quality dimensions. (initially ten later revised to five). Those dimensions
are presented in figure six in page 14.
14
Figure 05 – Gaps Model on Service Quality
Gap 01 – Customer expectations and management perceptions gap
Gap 02 – Management perceptions and service quality specifications gap
Gap 03 – Service quality specifications and service delivery gap
Gap 04 – Service delivery and external communications gap
Gap 05 – Gap between customer expectations and perceived performance
Source - Parasuraman, Zeithamal and Berry , 1990 , p. 46
Figure 06 – Customer Assessment of Service Quality
Source - Parasuraman, Zeithamal and Berry , 1990 , p. 23
Within these five service quality dimensions, the SERVQUAL scale has 22 questions.
They used a seven-point scale to capture the customer expectations and their perceived
Expected Service Perceived Service
Perceived Service Quality
Reliability Responsiveness Empathy Assurance Tangible
Expected Service
Perceived service
Gap 05 – known as service quality
Customer
Service provider Service
delivery
Service quality specifications
Management perceived
performance of customer
External
communications Gap 04
Gap 02
Gap 03
Gap 01
15
performance separately. The gaps are arrived by subtracting the scores for perceived
performance from the expectations scores. The nature of the service quality gap is then
assessed. They found in the five industries that they carried their research namely the
retail banking, credit cards, securities brokerage, long distance telephone call and product
repair industry, for most dimensions the scores were negative, indicating the perceived
service quality performance did not meet the expectations of the customer.
Parasuraman, Zeithamal and Berry (1990) indicated that the SERVQUAL scale could be
used as a generic model for almost for all of the industries although their research was an
outcome of five industries. However Finn & Lamb (1991) concluded that the
SERVQUAL scale is not valid in a retailing scenario. The CALSUPER study also
concluded that the SERVQUAL is not generic scale and it cannot be used without
adapting to the retail setting.
It is believed that SERVQUAL is not a generic model as intended by the researchers but
needs to be adapted to industry settings and the type of services that are being measured.
However this research brought light into the need to measure service quality and gave
researchers insight into further development of service quality techniques. One could say
that the contribution made by these researchers has become the foundation to all service
quality measures where various researchers are either improving or coming up with
different dimensions as opposed to the given original SERVQUAL scale.
(iii) The Three-Component Model by Rust and Oliver in 1994.
Rust and Oliver (1994) expanded the Nordic model and added a third dimension. They
emphasised the need to look at the service environment as an important dimension of
service quality.
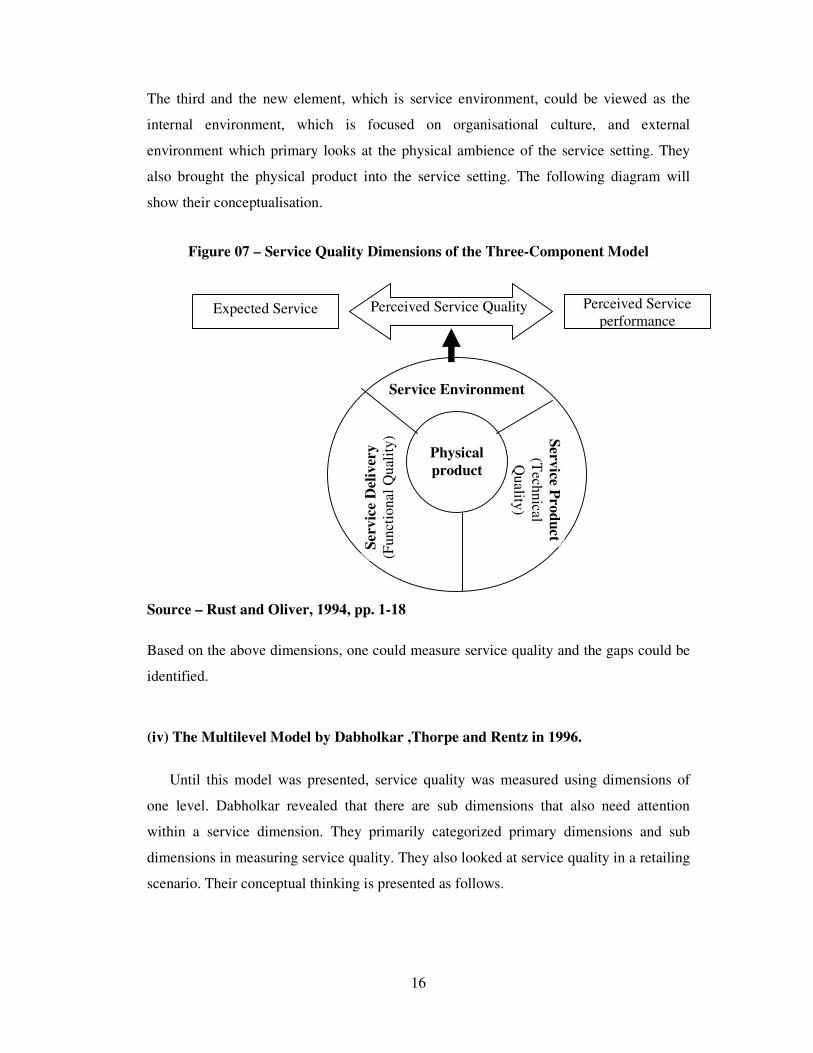
The first service dimension, which was the service product, was the relevant feature of the
service. This is the service that is designed to be delivered. In involves specific features of
the service. In other words it was the technical quality of the service.
The second is service delivery, which is linked to the role of performances in the delivery
of the technical quality of the service. In other words as Gronroos identified, it is
essentially the functional quality of the service.
16
The third and the new element, which is service environment, could be viewed as the
internal environment, which is focused on organisational culture, and external
environment which primary looks at the physical ambience of the service setting. They
also brought the physical product into the service setting. The following diagram will
show their conceptualisation.
Figure 07 – Service Quality Dimensions of the Three-Component Model
Source – Rust and Oliver, 1994, pp. 1-18
Based on the above dimensions, one could measure service quality and the gaps could be
identified.
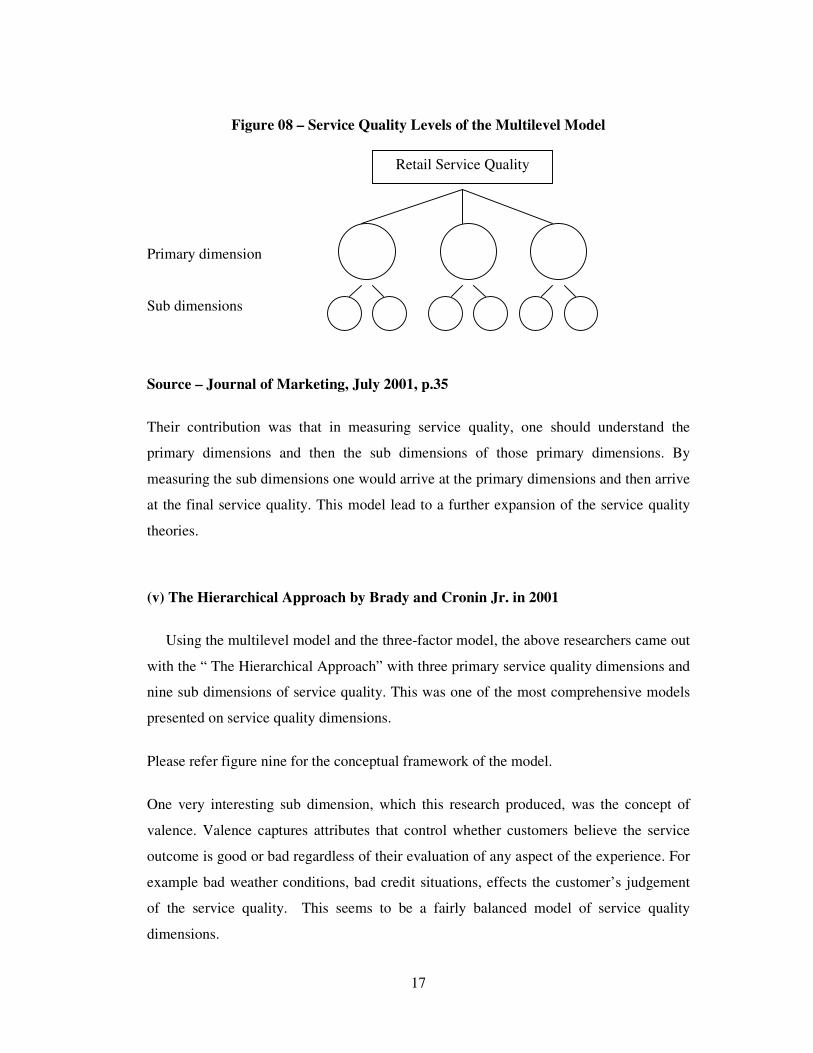
(iv) The Multilevel Model by Dabholkar ,Thorpe and Rentz in 1996.
Until this model was presented, service quality was measured using dimensions of
one level. Dabholkar revealed that there are sub dimensions that also need attention
within a service dimension. They primarily categorized primary dimensions and sub
dimensions in measuring service quality. They also looked at service quality in a retailing
scenario. Their conceptual thinking is presented as follows.
Expected Service Perceived Service
performance
Service Environment
Perceived Service Quality
Serv
ice
Del
iver
y
(Fu
nct
ion
al
Qu
alit
y)
Serv
ice Pro
du
ct
(Tech
nica
l
Qu
ality
)
Physical
product
17
Figure 08 – Service Quality Levels of the Multilevel Model
Primary dimension
Sub dimensions
Source – Journal of Marketing, July 2001, p.35
Their contribution was that in measuring service quality, one should understand the
primary dimensions and then the sub dimensions of those primary dimensions. By
measuring the sub dimensions one would arrive at the primary dimensions and then arrive
at the final service quality. This model lead to a further expansion of the service quality
theories.
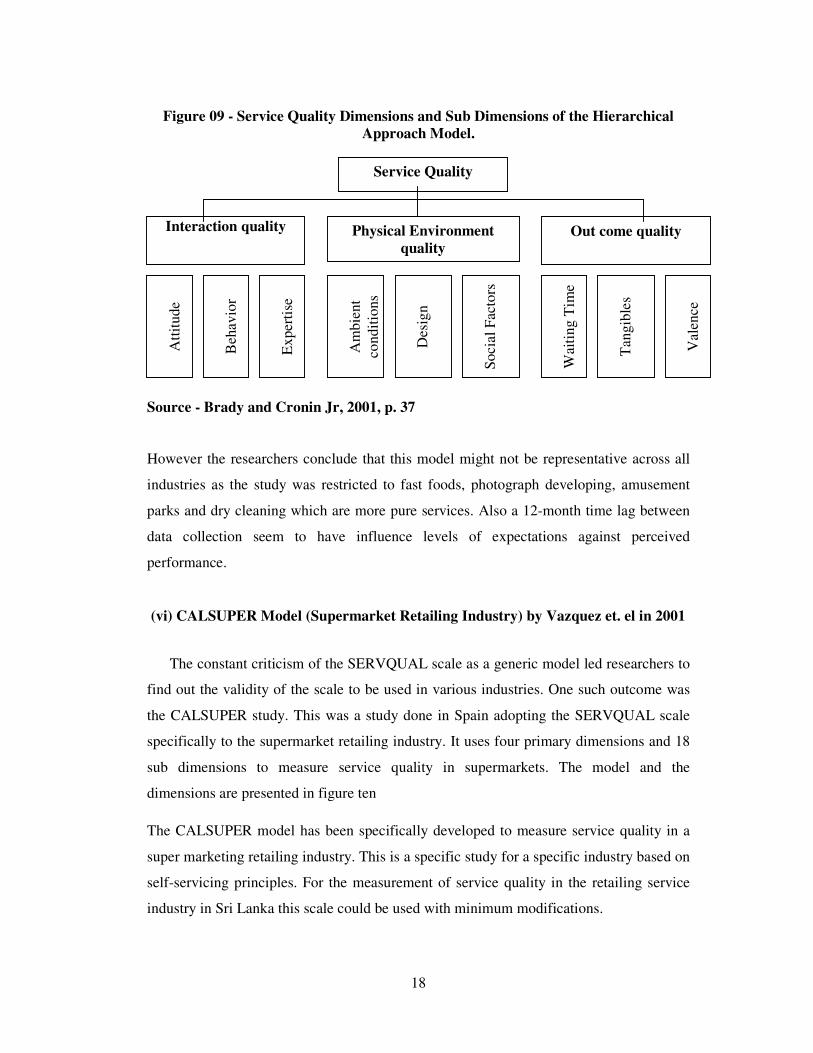
(v) The Hierarchical Approach by Brady and Cronin Jr. in 2001
Using the multilevel model and the three-factor model, the above researchers came out
with the “ The Hierarchical Approach” with three primary service quality dimensions and
nine sub dimensions of service quality. This was one of the most comprehensive models
presented on service quality dimensions.
Please refer figure nine for the conceptual framework of the model.
One very interesting sub dimension, which this research produced, was the concept of
valence. Valence captures attributes that control whether customers believe the service
outcome is good or bad regardless of their evaluation of any aspect of the experience. For
example bad weather conditions, bad credit situations, effects the customer’s judgement
of the service quality. This seems to be a fairly balanced model of service quality
dimensions.
Retail Service Quality
18
Figure 09 - Service Quality Dimensions and Sub Dimensions of the Hierarchical
Approach Model.
.
Source - Brady and Cronin Jr, 2001, p. 37
However the researchers conclude that this model might not be representative across all
industries as the study was restricted to fast foods, photograph developing, amusement
parks and dry cleaning which are more pure services. Also a 12-month time lag between
data collection seem to have influence levels of expectations against perceived
performance.
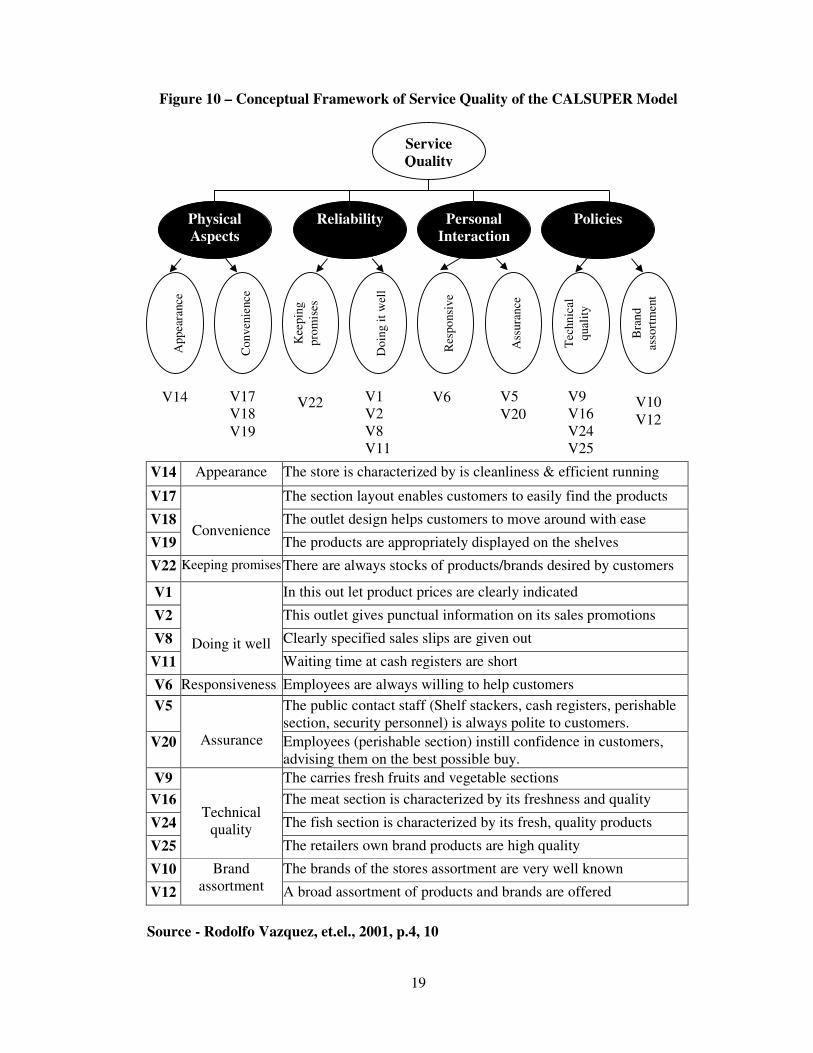
(vi) CALSUPER Model (Supermarket Retailing Industry) by Vazquez et. el in 2001
The constant criticism of the SERVQUAL scale as a generic model led researchers to
find out the validity of the scale to be used in various industries. One such outcome was
the CALSUPER study. This was a study done in Spain adopting the SERVQUAL scale
specifically to the supermarket retailing industry. It uses four primary dimensions and 18
sub dimensions to measure service quality in supermarkets. The model and the
dimensions are presented in figure ten
The CALSUPER model has been specifically developed to measure service quality in a
super marketing retailing industry. This is a specific study for a specific industry based on
self-servicing principles. For the measurement of service quality in the retailing service
industry in Sri Lanka this scale could be used with minimum modifications.
Interaction quality Physical Environment
quality
Out come quality
Att
itu
de
Beh
av
ior
Ex
per
tise
Am
bie
nt
con
dit
ion
s
Des
ign
So
cia
l F
acto
rs
Wai
tin
g T
ime
Tan
gib
les
Vale
nce
Service Quality
19
Figure 10 – Conceptual Framework of Service Quality of the CALSUPER Model
V14 Appearance The store is characterized by is cleanliness & efficient running
V17
Convenience
The section layout enables customers to easily find the products
V18 The outlet design helps customers to move around with ease
V19 The products are appropriately displayed on the shelves
V22 Keeping promises There are always stocks of products/brands desired by customers
V1
Doing it well
In this out let product prices are clearly indicated
V2 This outlet gives punctual information on its sales promotions
V8 Clearly specified sales slips are given out
V11 Waiting time at cash registers are short
V6 Responsiveness Employees are always willing to help customers
V5
Assurance
The public contact staff (Shelf stackers, cash registers, perishable
section, security personnel) is always polite to customers.
V20 Employees (perishable section) instill confidence in customers,
advising them on the best possible buy.
V9
Technical
quality
The carries fresh fruits and vegetable sections
V16 The meat section is characterized by its freshness and quality
V24 The fish section is characterized by its fresh, quality products
V25 The retailers own brand products are high quality
V10 Brand
assortment
The brands of the stores assortment are very well known
V12 A broad assortment of products and brands are offered
Source - Rodolfo Vazquez, et.el., 2001, p.4, 10
Physical
Aspects
Reliability
Personal
Interaction
Policies
Service
Quality A
pp
eara
nce
Co
nv
enie
nce
Kee
pin
g
pro
mis
es
Do
ing i
t w
ell
Res
po
nsi
ve
Ass
ura
nce
Tec
hn
ical
qual
ity
Bra
nd
asso
rtm
ent
V14 V17
V18
V19
V22 V1
V2
V8
V11
V6 V5
V20
V9
V16
V24
V25
V10
V12
20
(vi) Others
There were also other methods introduced such as the SERPERF by Cronin and Taylor
(1992) using direct measures to what extent customers consider their perceptions of
performances of the service to be superior, similar or inferior to the expected service.
The above are some methods available for service organisations in measuring service
quality.
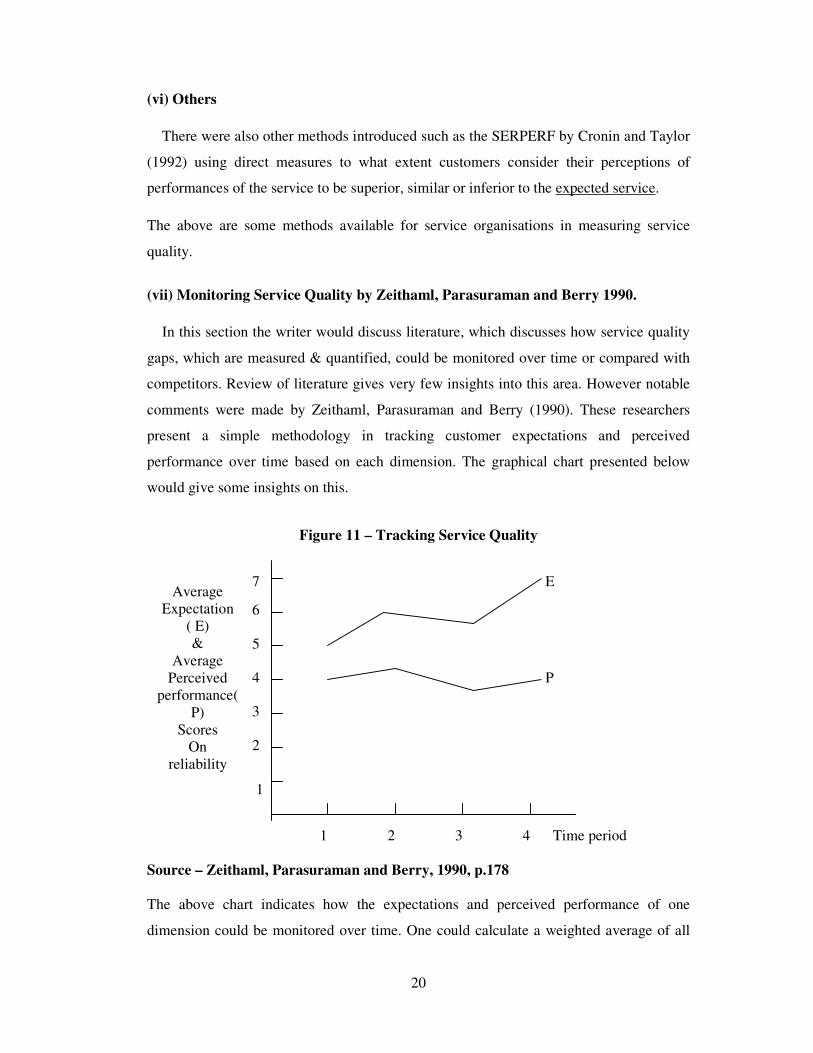
(vii) Monitoring Service Quality by Zeithaml, Parasuraman and Berry 1990.
In this section the writer would discuss literature, which discusses how service quality
gaps, which are measured & quantified, could be monitored over time or compared with
competitors. Review of literature gives very few insights into this area. However notable
comments were made by Zeithaml, Parasuraman and Berry (1990). These researchers
present a simple methodology in tracking customer expectations and perceived
performance over time based on each dimension. The graphical chart presented below
would give some insights on this.
Figure 11 – Tracking Service Quality
1
Source – Zeithaml, Parasuraman and Berry, 1990, p.178
The above chart indicates how the expectations and perceived performance of one
dimension could be monitored over time. One could calculate a weighted average of all
2
3
4
5
6
7 Average
Expectation
( E)
&
Average
Perceived
performance(
P)
Scores
On
reliability
Time period 1 2 3 4
P
E
21
the dimensions and monitor the change every time a measure is made on service quality.
By doing this, organisations would be able to monitor how expectations change over time
as well as perceived performance of the service experience. Also this would be very
useful in monitoring the effectiveness of any retail strategies implemented and correcting
any negative service quality gaps, which was identified, by a previous measure of service
quality. It would also be an effective tool for performance measurement over time.
Similarly one could take the overall scores and plot it against their immediate
competitors. This would give insights in how one is standing against other competitive
retailing supermarkets.
5. Service Quality , Product quality, Prices and Customer Satisfaction
In this section, our attention would be to review literature, which discusses the
relationship between service quality and customer satisfaction. In other words what is the
significance of service quality in the customer satisfaction process. In determining this the
influence from product quality and prices paid for customer satisfaction process will also
be explored for completeness sake. As a prelude some definitions of customer
satisfaction are explored below.
As noted by Oliver (1993), satisfaction is derived from the Latin word “satis” (which
means enough) and “facere” (which means to do or make). The related word is
“satiation” which loosely means “enough” or “enough to excess”. This term implies that
satisfaction refers to a fulfillment response. Based on above, Oliver (1997) defines
satisfaction as follows
Satisfaction is the customer’s fulfillment response. It is a judgment that a product or
service feature, or the product or service itself, provides a pleasurable level of
consumption – related fulfillment. (Oliver:1997:85)
As per Oliver, satisfaction is the customer’s evaluation of a product or service in terms of
whether that product or service has met their needs and expectations.
Fournier & Glen (1999) concluded that the above process of satisfaction was based on the
paradigm of “Comparison Standards”. They called this the CS Paradigm. According to
them the CS paradigm basically states that consumers hold pre consumption product
standards, observe product performance, compare performance with their standards, form
22
confirmation or disconfirmation perceptions, combine these perceived performance with
standard levels and then form summary satisfaction judgements.
Fournier & Glen (1999) brings out a new paradigm on consumer satisfaction called the
balancing paradigm, which looks at a more holistic, context dependent and dynamic
process of satisfaction. They say that it is a multi model, multi modal blend of
motivations, cognitions, emotions and meanings embedded in socio cultural settings,
which transforms during progressive and regressive consumer-product interactions. This
brings light that customer satisfaction is more than a mere comparison between pre
consumption standards (expectations) and perceived performance.
Oliver (1989) expanded the customer satisfaction theory as a consumer experience. He
conceptualised this experience as a combination of “satisfaction as contentment”,
“satisfaction as surprise”, “satisfaction as pleasure”, and “satisfaction as relief”.
Pine and Gilmore (1998) in their ground breaking article also concluded that today
customers are mostly looking for experiences and elaborated the characteristics of such
experiences in terms of four realms. Today most customer satisfaction theories present
customer satisfaction as a process rather than a mere activity of fulfilment.
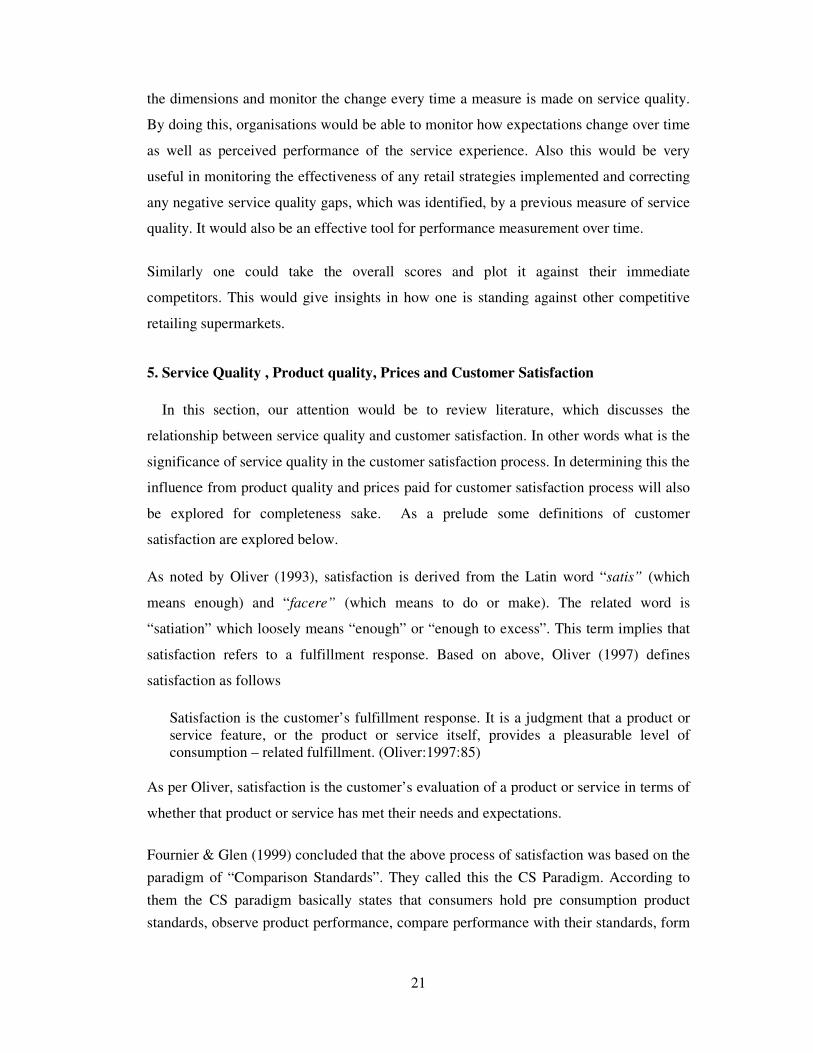
In turning our attention to the relationships between service quality and customer
satisfaction, the work of Zeithaml and Bitner ( 2000) needs to be highlighted. They
presented a model in depicting the relationship between satisfaction with service quality
and customer satisfaction and points out that product (Physical) quality and prices paid
are also important variables in the customer satisfaction process. Please refer figure 12 for
their model. They acknowledge the CS paradigm where customers form expectations of
preconceived notions of product quality, expectations of value and expectations of service
standards and compare their perceived performance with those in forming conclusions.
Their attention was mainly on the service quality whereby the comparison of service
expectations and perceived performance of the service, was instrumental in formulating
the perceived service quality. While highlighting product quality and price, Zeithaml and
Bitner (1990) also concluded that situational factors and personal factors could also affect
the customer satisfaction process.
23
Figure 12 – Service Quality and Customer Satisfaction
Source - Zeithaml and Bitner, 2000, p.75
In essence this model suggests that service quality as a significant aspect of customer
satisfaction. While product quality, pricing in particular has an equal share in gaining
customer satisfaction; service quality could be sited as an important aspect in contributing
towards customer the overall satisfaction levels. The above model talks mainly about post
purchase customer satisfaction.
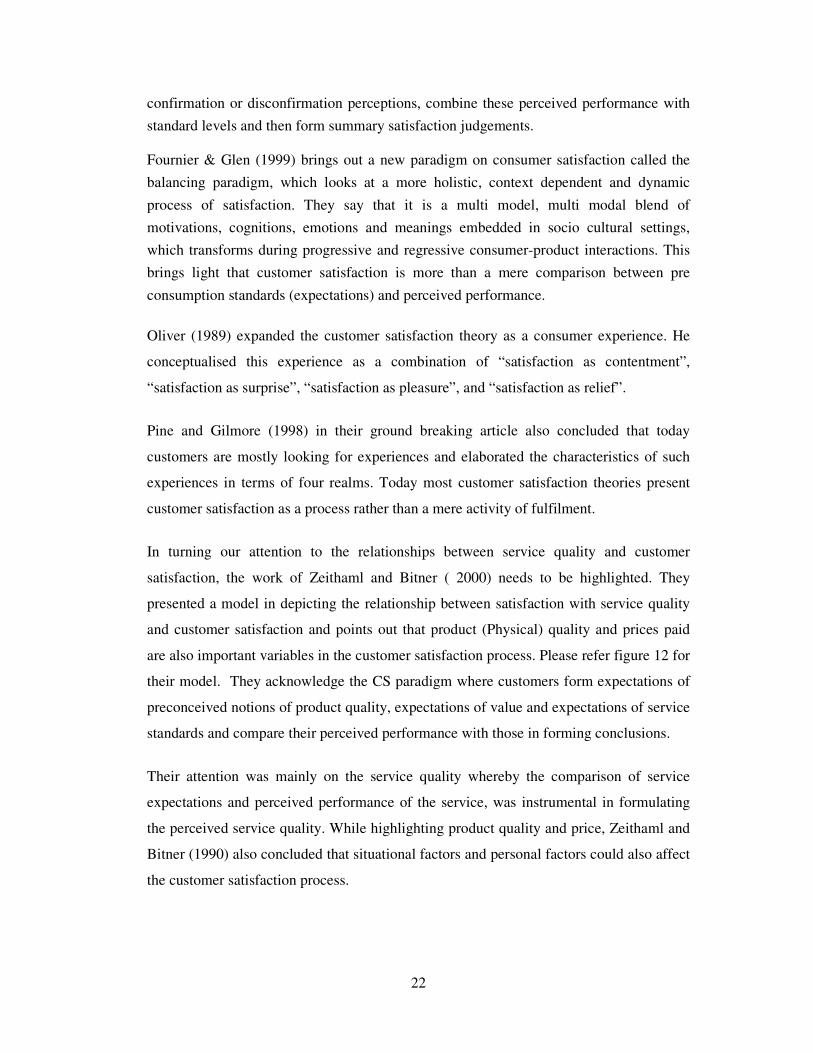
Figure 13 – Functional & Technical Service Quality on Willingness to Buy
Source - Jillian, Geoffrey and Lester, 1996, p.45
Service
Quality
Product
Quality
Price
Customer
satisfaction/
dissatisfaction
Situational
factors
Expectations
Perceived
performance
Adopted by
the
researcher
Personal
factors
Customers
emotional
responses
Attributions
Perceptions
of equity
Functional service quality
Technical service quality
Product quality
Relative price
Value
Willingness
to buy
24
Jillian, Geoffrey & Lester (1996) in their study “Retail service quality and perceived
value, a comparison of two models” concludes that perceived performance of service
quality during a service encounter influences consumer’s willingness to buy more than
perceptions of product quality itself. Please refer figure 13 in page 23 for their model,
which they validated through research. Their conclusion was that in the pre purchase
stage, customers perceived service quality, influenced the willingness to buy, more than
product quality and relative price itself. In assessing the perceived service quality, they
looked at the technical quality and the functional quality separately and they concluded
that the functional quality made a bigger influence in this process.
Based on the two models presented above, it is clear that service quality is an important
element in the customer satisfaction process. We know that it influences both pre
purchase as well as post purchase customer satisfaction levels.
In the definitions of customer satisfaction presented, the writer highlighted that mainly it
was based on the CS paradigm. Until very recently it was the opinion of the research
world that customer satisfaction was a direct outcome of the match between the
expectations of product quality and the performance of the product. The role of product
quality is thus established as a determinant of customer satisfaction.
In understanding the role of price in the customer satisfaction process, the research
carried out by Voss, Parasuraman and Grewal (1998) in assessing the roles of price,
performance and expectations in satisfaction levels conclude that the role of price is not
very important when the perceived performance (product or service) is consistent with the
prices paid. But whenever the perceived performance is not in line with the prices paid,
it will have a major impact on the customer’s satisfaction process.
In summary the literature has identified the impact of product quality, prices and service
quality on the customer satisfaction process. While Ziethamal and Bitner (2000) argues
that perceived service quality is an important element of customer satisfaction (post
purchase satisfaction), Jillian, Geoffrey & Lester (1996) have concluded that service
quality has a higher influence on customer pre purchase willingness to buy than product
quality or the relative prices paid
While there are many research on pre purchase influence and prices, the research done by
Voss, Parasuraman and Grewal (1998) enables us to reasonably assume that when
25
performance (could be product quality as well) is consistent (may even be among
competitors), the role of price in the customer satisfaction process would be insignificant
and in time of inconsistencies, the role of price would be a determining factor in
increasing or decreasing customer satisfaction levels. They highlighted the importance of
this to see the relationship with other determinants of customer satisfaction as well.
6. Developing Retail Mix Strategies
This section of the literature review will attempt to understand the components of the
retail strategy. In order to supplement the readers understanding in building retail
strategies, the retail planning process is discussed in brief as a pre amble.
Retailing is essentially “ All activities involved in selling goods or services directly to
final customers for their personal, non business use” – Kotler (1996). The retailer
essentially solves the discrepancy of assortment between the customer and the
manufacturer (wholesalers) in meeting both their expectations of assortment and
quantity. Retailing deals with all strategies in providing the products to the final customer
and is considered today as a marketing organization, a link between the producer and the
customer, a member in the distribution channel and finally as an image creator.
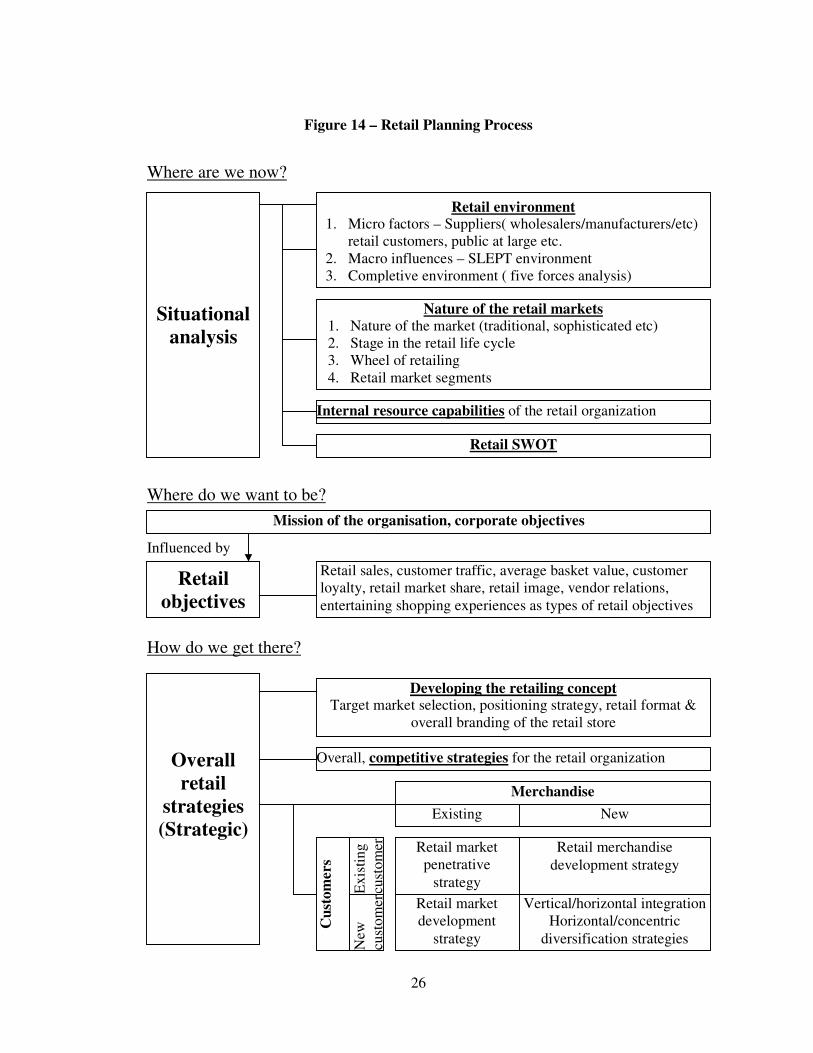
The retail planning process is no different to normal planning activities, but the
terminology and some of the elements could be quite different in certain situations. In
understanding retail strategy building, one needs to look at this from a total perspective.
The diagram 14 will elaborate the entire retail planning process. The writer has taken the
concepts from literature and arranged for the easy comprehension of the reader. Please
refer this figure for the retail planning process.
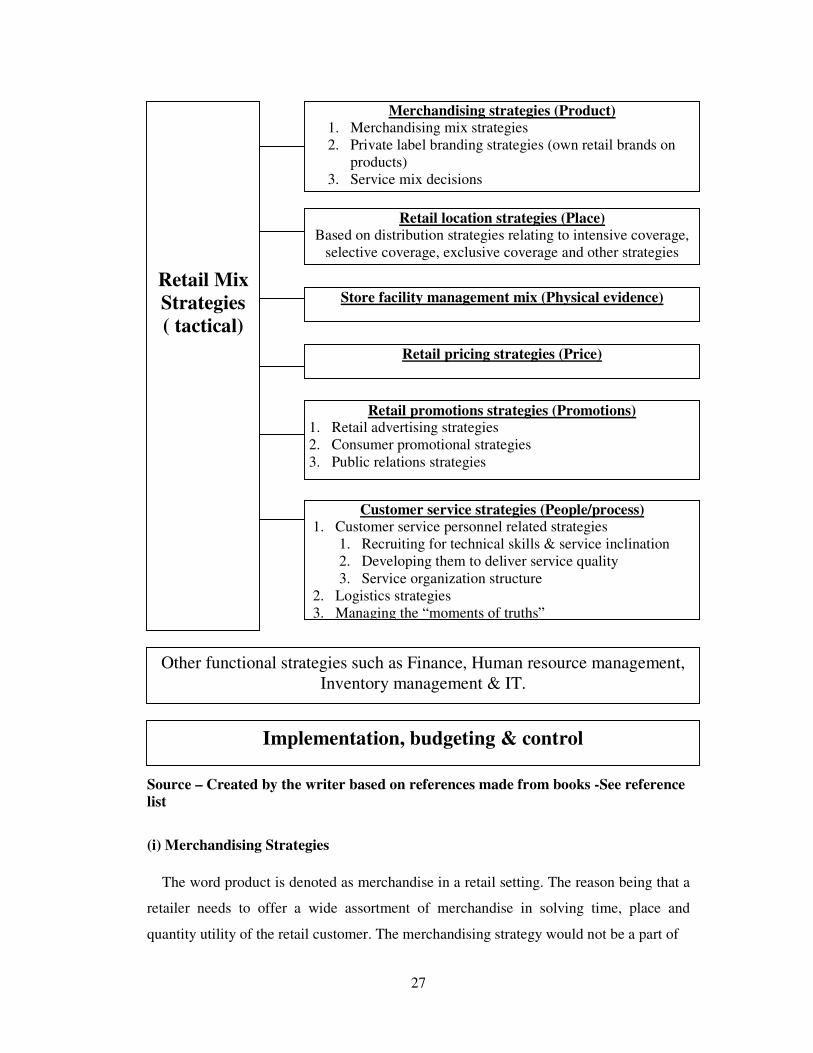
With retailing planning process in mind the writer will elaborate the components of the
retail mix strategies in the proceeding section. Supermarket retailing essentially lies in the
middle of the service continuum where the tangible product quality as well as the
intangible service quality would be important to the customer in his satisfaction process.
This is especially true for a self-service super marketing experience. Therefore retail mix
strategies needs to be viewed in parallel to the service marketing strategies, which are
organised within the seven P’s concept.
26
Figure 14 – Retail Planning Process
Where are we now?
Where do we want to be?
Influenced by
How do we get there?
Situational
analysis
Retail environment 1. Micro factors – Suppliers( wholesalers/manufacturers/etc)
retail customers, public at large etc.
2. Macro influences – SLEPT environment
3. Completive environment ( five forces analysis)
Nature of the retail markets
1. Nature of the market (traditional, sophisticated etc)
2. Stage in the retail life cycle
3. Wheel of retailing
4. Retail market segments
Internal resource capabilities of the retail organization
Retail SWOT
Retail
objectives
Retail sales, customer traffic, average basket value, customer
loyalty, retail market share, retail image, vendor relations,
entertaining shopping experiences as types of retail objectives
Mission of the organisation, corporate objectives
Overall
retail
strategies
(Strategic)
Overall, competitive strategies for the retail organization
Developing the retailing concept Target market selection, positioning strategy, retail format &
overall branding of the retail store
Retail merchandise
development strategy
Retail market
development
strategy
Vertical/horizontal integration
Horizontal/concentric
diversification strategies
Cu
sto
mers
New
cust
om
er
Retail market
penetrative
strategy Ex
isti
ng
cust
om
er
Merchandise
Existing New
27
Source – Created by the writer based on references made from books -See reference
list
(i) Merchandising Strategies
The word product is denoted as merchandise in a retail setting. The reason being that a
retailer needs to offer a wide assortment of merchandise in solving time, place and
quantity utility of the retail customer. The merchandising strategy would not be a part of
Retail Mix
Strategies
( tactical)
Merchandising strategies (Product)
1. Merchandising mix strategies
2. Private label branding strategies (own retail brands on
products)
3. Service mix decisions
Retail location strategies (Place)
Based on distribution strategies relating to intensive coverage,
selective coverage, exclusive coverage and other strategies
Store facility management mix (Physical evidence)
Retail pricing strategies (Price)
Retail promotions strategies (Promotions) 1. Retail advertising strategies
2. Consumer promotional strategies
3. Public relations strategies
Customer service strategies (People/process)
1. Customer service personnel related strategies
1. Recruiting for technical skills & service inclination
2. Developing them to deliver service quality
3. Service organization structure
2. Logistics strategies
3. Managing the “moments of truths”
Implementation, budgeting & control
Other functional strategies such as Finance, Human resource management,
Inventory management & IT.
28
service quality but will influence the product quality of the consumers. The
merchandising strategy is made out of merchandising mix strategies; private labelling
branding strategies and the service mix strategies in a retailing scenario.
(a) Merchandising mix strategies.
Merchandising mix refers to the full range or mixture of products that the retailer offers
to the customer. The merchandising mix should represent an appropriate combination of
products to meet specific requirements of the target market. Due to the unlimited
combinations of merchandise the consumer may require, it is generally a difficult task to
operationalize this. Effective merchandising mix planning is essential for a supermarket
to operate effectively. In doing this a retailer will have to give thought to the degree of
perishability of many products.
Also developing the merchandise mix, a retailer would need to pay close attention to the
classifications of products. A retailer will carefully plan different product lines based on
typical target market requirements and purchasing sequence and group them as product
item groups and present individual product units within them.
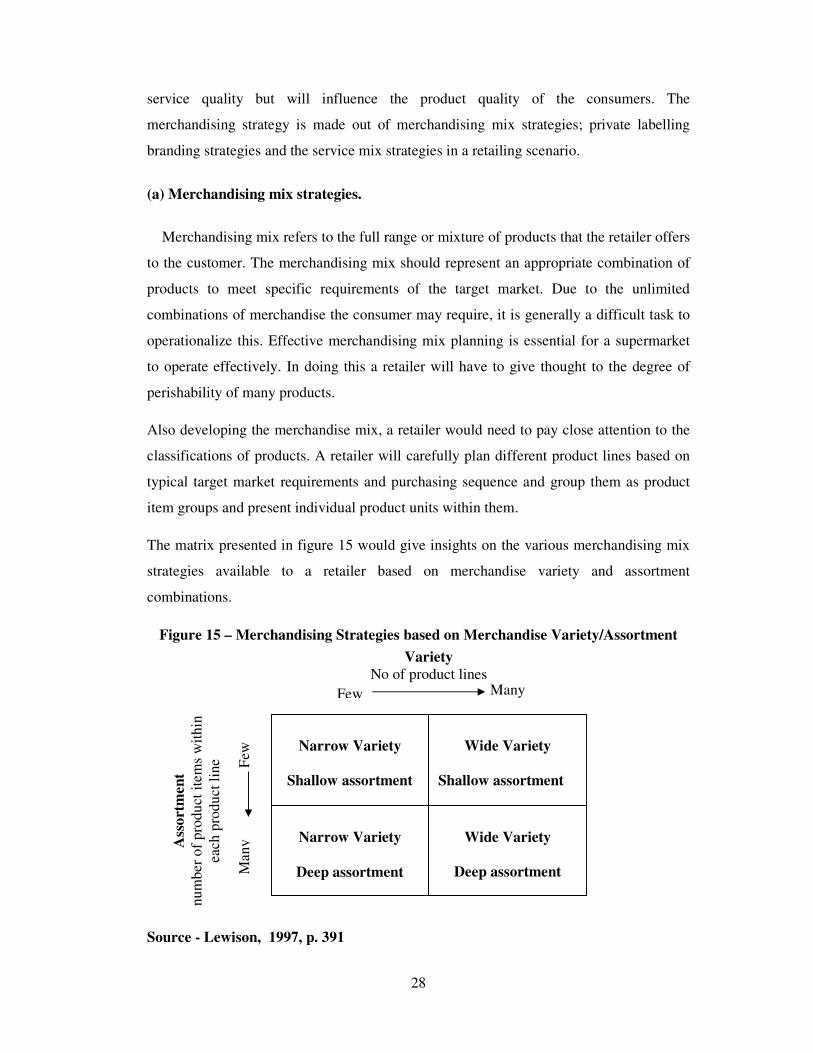
The matrix presented in figure 15 would give insights on the various merchandising mix
strategies available to a retailer based on merchandise variety and assortment
combinations.
Figure 15 – Merchandising Strategies based on Merchandise Variety/Assortment
Source - Lewison, 1997, p. 391
Narrow Variety
Shallow assortment
Wide Variety
Shallow assortment
Narrow Variety
Deep assortment
Wide Variety
Deep assortment
Variety
No of product lines
Few Many
Ass
ort
men
t
nu
mb
er
of
pro
du
ct i
tem
s w
ith
in
each
pro
du
ct l
ine Few
M
an
y
29
Based on the above matrix the following four merchandising mix strategies could be
formulated.
Narrow variety/shallow assortment strategy. Offers the most limited product selection
to any of the combination strategies. Good example would be vending machines offering
limited types of newspapers, drinks, candy etc. Generally this strategy suffers from poor
image and less customer loyalty other than that generated by convenience.
Wide variety/shallow assortment strategy. The basic principle of this is “ stock a little
of everything”. The retailer offers a wide selection of different product lines but limits the
assortment of brands, styles, and sizes, and so on within each line. This strategy appeals
to a broad market, satisfying customers in terms of product availability, promoting one
stop shopping and permitting reasonable control over inventories. The disadvantage of
this would be loss of sales and customer disappointment with lack of selection within
product lines.
Narrow variety/Deep assortment strategy. This is a specialality philosophy. This is
where a retailer would appeal to a selected group of consumers by offering a few lines
with an excellent selection in each line. By offering a specialised mix of products the
retailer develops distinct store image and a loyal customer base. The limitation would be
the retailer is dependent on single or limited product lines.
Wide variety/Deep assortment strategy. One stop shopping is the basic philosophy in
this all inclusive merchandising mix strategy. This would allow the retailer to create a
board appeal, while satisfying most of the product needs of a specific target market. The
disadvantages in this strategy would be, high level of investment in inventory, low stock
turnover ratio, high usage of space, fixtures and equipment required to display
merchandise.
It needs to be highlighted that within the retailing concept that is developed based on the
target market, positioning and the retail format, a retailer could follow any of the above
four merchandising mix strategies in offering his products to the customers.
30
(b) Private label branding strategies.
Private label branding (own retail branding) occurs when products are sold under a
retail organisations house brand name and are sold exclusively through their retail
organisation outlets. The latter aspect of exclusivity is a matter of scale of the private
label brand, where large retailers may also sell their own brand products in other outlets.
There are two basic types of private label branding strategies available for a retailer.
Integrated strategy – Here the retailer is integrated with his or her own manufacturing
capability.
Independent contracting – Here the retailer persuades a manufacturer to supply products
labelled with the name of the retail company.
Private label branding have made tremendous in roads in the retail industry. The success
of private label brands have been limited to certain product categories and segments of
consumers nevertheless retailers seem to expand the domain of private label offerings.
They represent a significant threat to their national label competitors. Most retailers use a
lower cost/lower quality position in the private label brands in offering customer value.
However this is not the only objective of private label branding. The long-term objective
would be to increase the bargaining power of the retailer with suppliers.
Devon DelVecchio (2001) concludes the following as determinants of private label brand
offerings by retailers.
Consumer perceptions of quality on the product categories where private label brands
are offered were an important determinant.
The functional quality of the products would allow them to effectively compete with
national brands, as the majority of consumers tend to believe that private label brands
should be competitive on functional quality against national brands.
The perceived quality of the private label brand names was positively affected by the
use of symbolic cues.
With the above findings retailers could use some of that knowledge in building private
label brands in their retail outlets.
31
(c) Service mix decisions
Service mix decisions are analysed from pre transactional, transactional and post
transactional requirements. The following service mix could be on offer.
The decision to offer the above services needs to be decided by analysing the qualifying
requirements (minimum expectations of the customers) and the determining requirements
(which may differentiate one retailer from another) of the target market. For an example
adequate parking facilities would be a qualifying requirement of a pre transactional
service in a supermarket. Taking orders over the phone for weekly grocery requirement
may be a determining requirement of a pre transactional service. Based on this a retailer
needs to decide his service mix.
(ii) Retail Location Strategies
It is said that there are three successful criteria in retailing. They are “Location”,
“Location” and “Location”. Having the right location is important in terms of
convenience to the customer. For the retailer, if a mistake is made on the location, it is
almost impossible to correct it.
Retail location strategies are influenced by the three important place strategies in
marketing. That is intensive distribution, selective distribution and exclusive distribution.
The decision of selecting either one of the above strategies are largely influenced by the
geographical distribution of the target market, the frequency of their visits, the retailing
format that the organisation wishes to follow etc.
It is widely believed in the retailing industry, the location could be over ridden by the
concept of destination. A destination is where a consumer will find the retailer, wherever
the retailer is, irrespective of the location. In order to create this, one has to positively
differentiate themselves from their competitors, in terms of product offerings, positioning,
service or with some other motivating factors. However the store location strategy is
influenced by the following factors to a very large extent.
Pre transaction services
� Parking facilities
� Shopping basket facilities
� Store opening & closing
hours
� Customer information
Transaction services
� Credit card facilities
� Gift wrapping service
� Shopping assistance
� Customer check out
� Porter services
Post transaction services
� Delivery service (for
certain products)
� Returns of products
� Complaints resolution
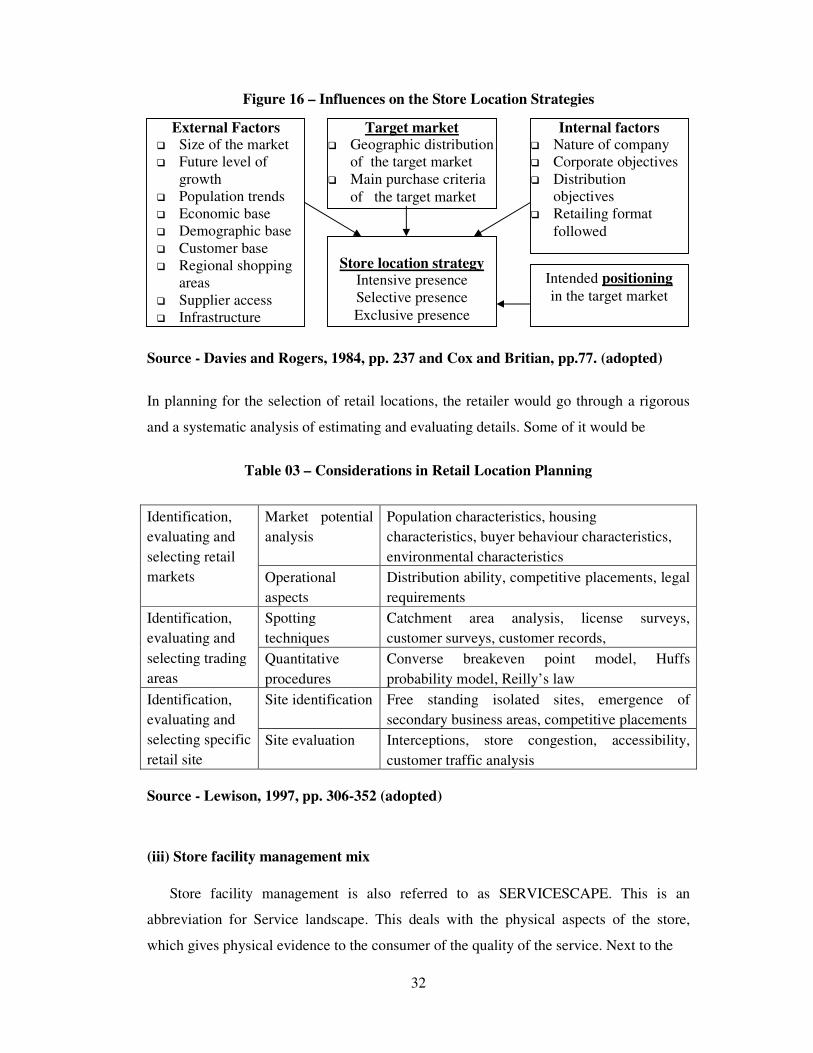
32
Figure 16 – Influences on the Store Location Strategies
Source - Davies and Rogers, 1984, pp. 237 and Cox and Britian, pp.77. (adopted)
In planning for the selection of retail locations, the retailer would go through a rigorous
and a systematic analysis of estimating and evaluating details. Some of it would be
Table 03 – Considerations in Retail Location Planning
Identification,
evaluating and
selecting retail
markets
Market potential
analysis
Population characteristics, housing
characteristics, buyer behaviour characteristics,
environmental characteristics
Operational
aspects
Distribution ability, competitive placements, legal
requirements
Identification,
evaluating and
selecting trading
areas
Spotting
techniques
Catchment area analysis, license surveys,
customer surveys, customer records,
Quantitative
procedures
Converse breakeven point model, Huffs
probability model, Reilly’s law
Identification,
evaluating and
selecting specific
retail site
Site identification Free standing isolated sites, emergence of
secondary business areas, competitive placements
Site evaluation Interceptions, store congestion, accessibility,
customer traffic analysis
Source - Lewison, 1997, pp. 306-352 (adopted)
(iii) Store facility management mix
Store facility management is also referred to as SERVICESCAPE. This is an
abbreviation for Service landscape. This deals with the physical aspects of the store,
which gives physical evidence to the consumer of the quality of the service. Next to the
Store location strategy Intensive presence
Selective presence
Exclusive presence
Target market � Geographic distribution
of the target market
� Main purchase criteria
of the target market
Intended positioning
in the target market
Internal factors � Nature of company
� Corporate objectives
� Distribution
objectives
� Retailing format
followed
External Factors � Size of the market
� Future level of
growth
� Population trends
� Economic base
� Demographic base
� Customer base
� Regional shopping
areas
� Supplier access
� Infrastructure
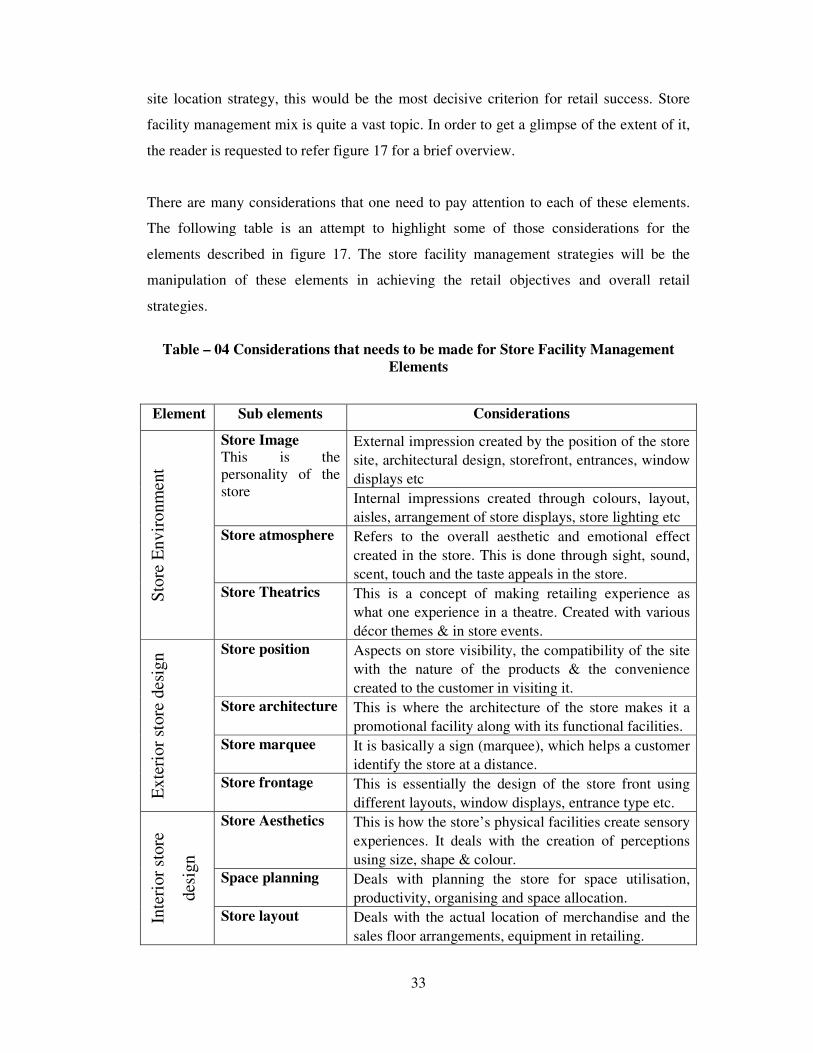
33
site location strategy, this would be the most decisive criterion for retail success. Store
facility management mix is quite a vast topic. In order to get a glimpse of the extent of it,
the reader is requested to refer figure 17 for a brief overview.
There are many considerations that one need to pay attention to each of these elements.
The following table is an attempt to highlight some of those considerations for the
elements described in figure 17. The store facility management strategies will be the
manipulation of these elements in achieving the retail objectives and overall retail
strategies.
Table – 04 Considerations that needs to be made for Store Facility Management
Elements
Element Sub elements Considerations
Sto
re E
nv
iro
nm
ent
Store Image This is the
personality of the
store
External impression created by the position of the store
site, architectural design, storefront, entrances, window
displays etc
Internal impressions created through colours, layout,
aisles, arrangement of store displays, store lighting etc
Store atmosphere Refers to the overall aesthetic and emotional effect
created in the store. This is done through sight, sound,
scent, touch and the taste appeals in the store.
Store Theatrics This is a concept of making retailing experience as
what one experience in a theatre. Created with various
décor themes & in store events.
Ex
teri
or
store
des
ign
Store position Aspects on store visibility, the compatibility of the site
with the nature of the products & the convenience
created to the customer in visiting it.
Store architecture This is where the architecture of the store makes it a
promotional facility along with its functional facilities.
Store marquee It is basically a sign (marquee), which helps a customer
identify the store at a distance.
Store frontage This is essentially the design of the store front using
different layouts, window displays, entrance type etc.
Inte
rior
store
des
ign
Store Aesthetics This is how the store’s physical facilities create sensory
experiences. It deals with the creation of perceptions
using size, shape & colour.
Space planning Deals with planning the store for space utilisation,
productivity, organising and space allocation.
Store layout Deals with the actual location of merchandise and the
sales floor arrangements, equipment in retailing.
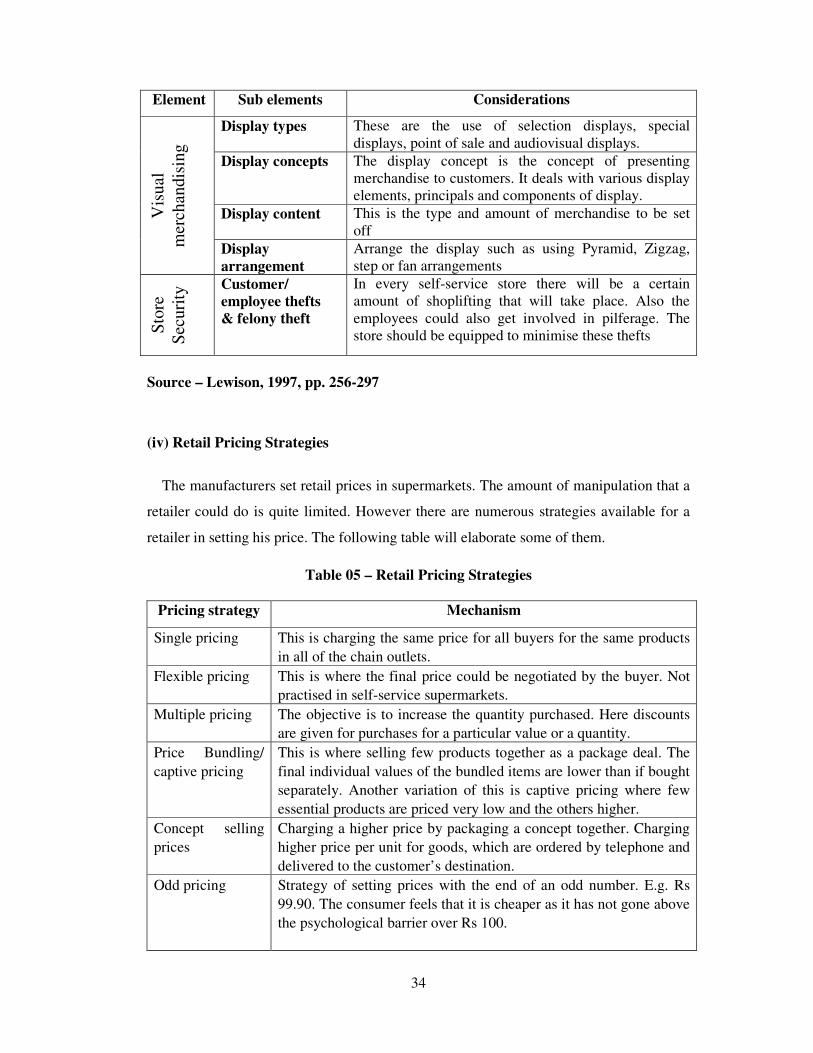
34
Element Sub elements Considerations
Vis
ual
mer
chan
dis
ing
Display types These are the use of selection displays, special
displays, point of sale and audiovisual displays.
Display concepts The display concept is the concept of presenting
merchandise to customers. It deals with various display
elements, principals and components of display.
Display content This is the type and amount of merchandise to be set
off
Display
arrangement
Arrange the display such as using Pyramid, Zigzag,
step or fan arrangements
Sto
re
Sec
uri
ty Customer/
employee thefts
& felony theft
In every self-service store there will be a certain
amount of shoplifting that will take place. Also the
employees could also get involved in pilferage. The
store should be equipped to minimise these thefts
Source – Lewison, 1997, pp. 256-297
(iv) Retail Pricing Strategies
The manufacturers set retail prices in supermarkets. The amount of manipulation that a
retailer could do is quite limited. However there are numerous strategies available for a
retailer in setting his price. The following table will elaborate some of them.
Table 05 – Retail Pricing Strategies
Pricing strategy Mechanism
Single pricing This is charging the same price for all buyers for the same products
in all of the chain outlets.
Flexible pricing This is where the final price could be negotiated by the buyer. Not
practised in self-service supermarkets.
Multiple pricing The objective is to increase the quantity purchased. Here discounts
are given for purchases for a particular value or a quantity.
Price Bundling/
captive pricing
This is where selling few products together as a package deal. The
final individual values of the bundled items are lower than if bought
separately. Another variation of this is captive pricing where few
essential products are priced very low and the others higher.
Concept selling
prices
Charging a higher price by packaging a concept together. Charging
higher price per unit for goods, which are ordered by telephone and
delivered to the customer’s destination.
Odd pricing Strategy of setting prices with the end of an odd number. E.g. Rs
99.90. The consumer feels that it is cheaper as it has not gone above
the psychological barrier over Rs 100.
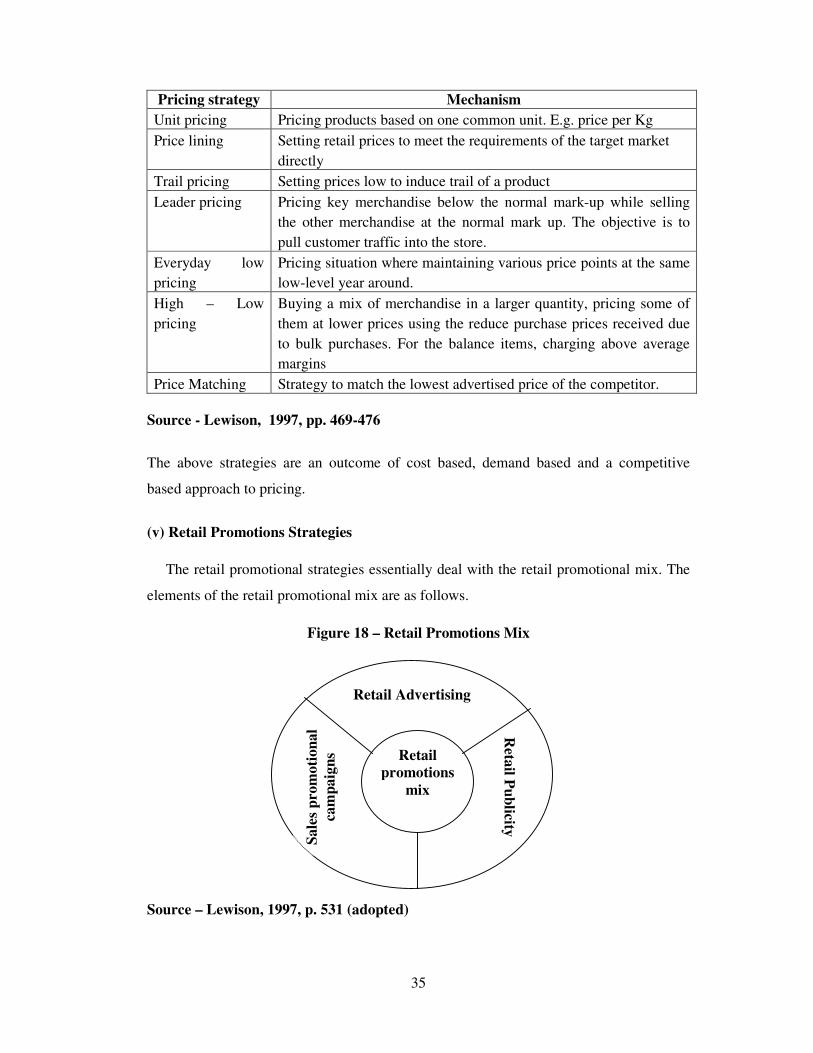
35
Pricing strategy Mechanism
Unit pricing Pricing products based on one common unit. E.g. price per Kg
Price lining Setting retail prices to meet the requirements of the target market
directly
Trail pricing Setting prices low to induce trail of a product
Leader pricing Pricing key merchandise below the normal mark-up while selling
the other merchandise at the normal mark up. The objective is to
pull customer traffic into the store.
Everyday low
pricing
Pricing situation where maintaining various price points at the same
low-level year around.
High – Low
pricing
Buying a mix of merchandise in a larger quantity, pricing some of
them at lower prices using the reduce purchase prices received due
to bulk purchases. For the balance items, charging above average
margins
Price Matching Strategy to match the lowest advertised price of the competitor.
Source - Lewison, 1997, pp. 469-476
The above strategies are an outcome of cost based, demand based and a competitive
based approach to pricing.
(v) Retail Promotions Strategies
The retail promotional strategies essentially deal with the retail promotional mix. The
elements of the retail promotional mix are as follows.
Figure 18 – Retail Promotions Mix
Source – Lewison, 1997, p. 531 (adopted)
Retail Advertising
Sa
les
pro
mo
tio
na
l
cam
pa
ign
s
Reta
il Pu
blicity
Retail
promotions
mix
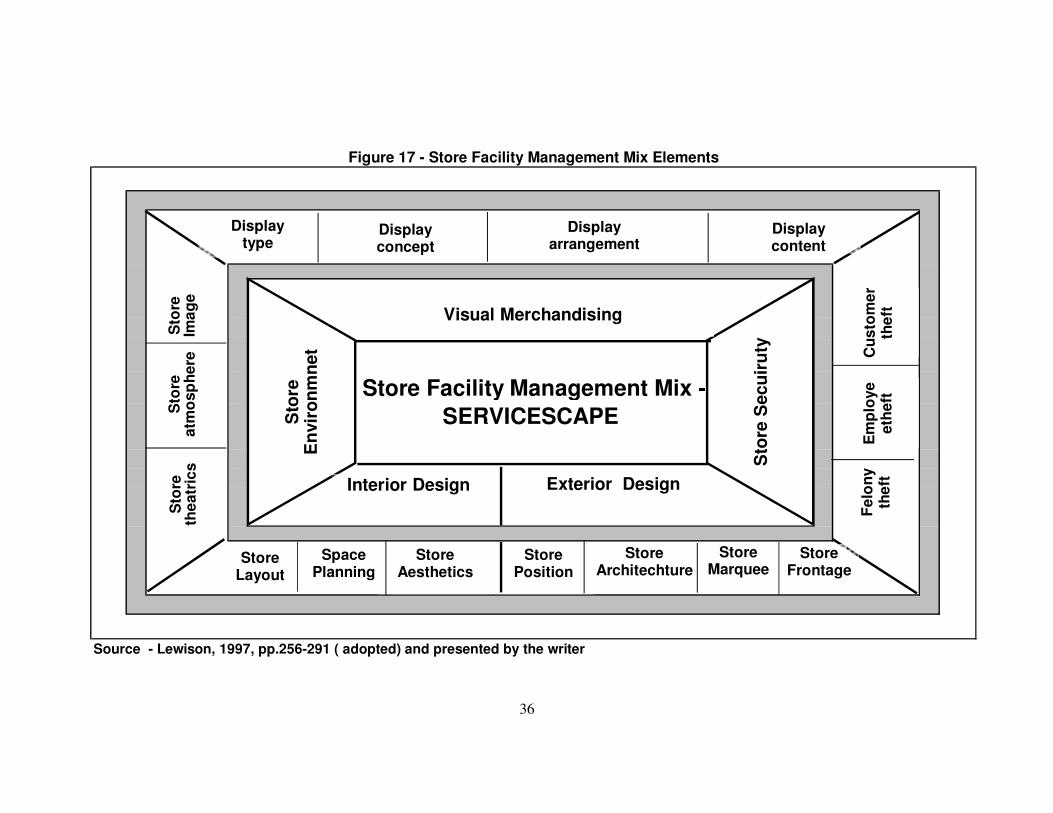
36
Source - Lewison, 1997, pp.256-291 ( adopted) and presented by the writer
Figure 17 - Store Facility Management Mix Elements
Store Facility Management Mix -
SERVICESCAPESto
re
En
vir
on
mn
et
Sto
re S
ecu
iru
ty
Visual Merchandising
Interior Design Exterior Design
Display type
Display content
Display concept
Display arrangement
Sto
re
Ima
ge
Sto
re
atm
osp
he
reS
tore
th
eatr
ics
Store Position
Store Architechture
Store Marquee
Store Frontage
Store Aesthetics
Space Planning
Store Layout
Cu
sto
me
r th
eft
Em
plo
ye
eth
eft
Fe
lon
y
the
ft
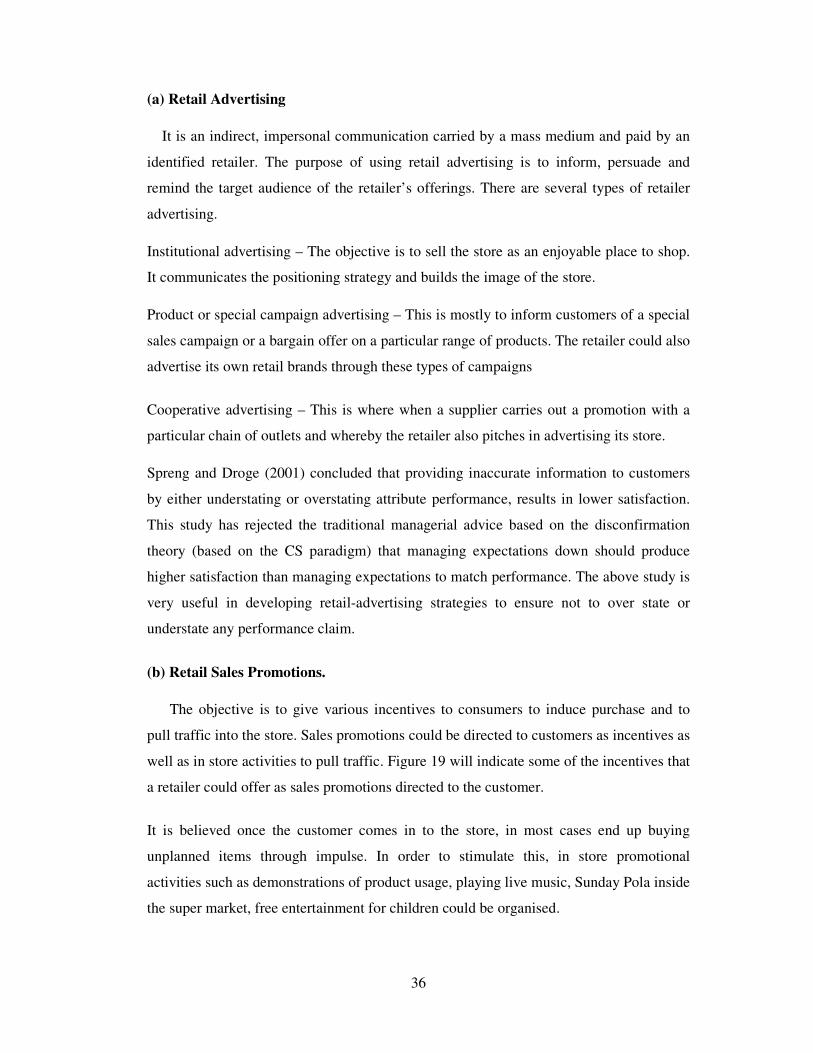
36
(a) Retail Advertising
It is an indirect, impersonal communication carried by a mass medium and paid by an
identified retailer. The purpose of using retail advertising is to inform, persuade and
remind the target audience of the retailer’s offerings. There are several types of retailer
advertising.
Institutional advertising – The objective is to sell the store as an enjoyable place to shop.
It communicates the positioning strategy and builds the image of the store.
Product or special campaign advertising – This is mostly to inform customers of a special
sales campaign or a bargain offer on a particular range of products. The retailer could also
advertise its own retail brands through these types of campaigns
Cooperative advertising – This is where when a supplier carries out a promotion with a
particular chain of outlets and whereby the retailer also pitches in advertising its store.
Spreng and Droge (2001) concluded that providing inaccurate information to customers
by either understating or overstating attribute performance, results in lower satisfaction.
This study has rejected the traditional managerial advice based on the disconfirmation
theory (based on the CS paradigm) that managing expectations down should produce
higher satisfaction than managing expectations to match performance. The above study is
very useful in developing retail-advertising strategies to ensure not to over state or
understate any performance claim.
(b) Retail Sales Promotions.
The objective is to give various incentives to consumers to induce purchase and to
pull traffic into the store. Sales promotions could be directed to customers as incentives as
well as in store activities to pull traffic. Figure 19 will indicate some of the incentives that
a retailer could offer as sales promotions directed to the customer.
It is believed once the customer comes in to the store, in most cases end up buying
unplanned items through impulse. In order to stimulate this, in store promotional
activities such as demonstrations of product usage, playing live music, Sunday Pola inside
the super market, free entertainment for children could be organised.
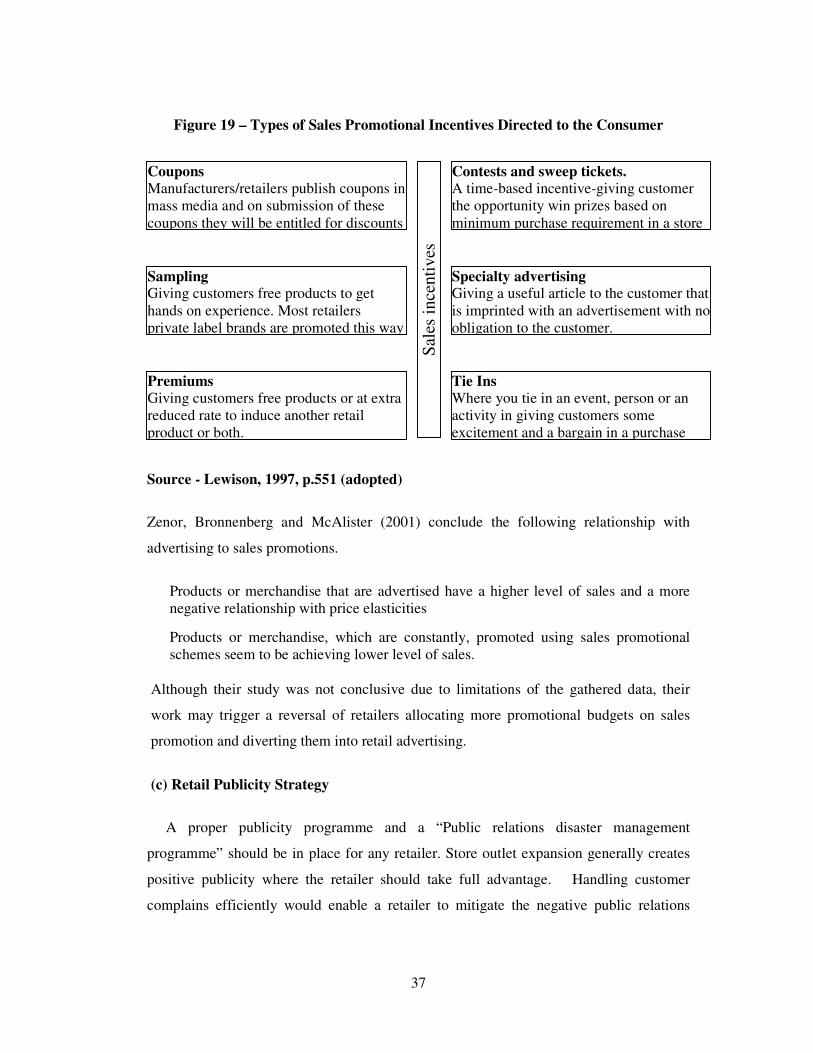
37
Figure 19 – Types of Sales Promotional Incentives Directed to the Consumer
Source - Lewison, 1997, p.551 (adopted)
Zenor, Bronnenberg and McAlister (2001) conclude the following relationship with
advertising to sales promotions.
Products or merchandise that are advertised have a higher level of sales and a more
negative relationship with price elasticities
Products or merchandise, which are constantly, promoted using sales promotional
schemes seem to be achieving lower level of sales.
Although their study was not conclusive due to limitations of the gathered data, their
work may trigger a reversal of retailers allocating more promotional budgets on sales
promotion and diverting them into retail advertising.
(c) Retail Publicity Strategy
A proper publicity programme and a “Public relations disaster management
programme” should be in place for any retailer. Store outlet expansion generally creates
positive publicity where the retailer should take full advantage. Handling customer
complains efficiently would enable a retailer to mitigate the negative public relations
Sal
es i
nce
nti
ves
Coupons
Manufacturers/retailers publish coupons in
mass media and on submission of these
coupons they will be entitled for discounts
Sampling Giving customers free products to get
hands on experience. Most retailers
private label brands are promoted this way
Premiums
Giving customers free products or at extra
reduced rate to induce another retail
product or both.
Contests and sweep tickets.
A time-based incentive-giving customer
the opportunity win prizes based on
minimum purchase requirement in a store
Specialty advertising Giving a useful article to the customer that
is imprinted with an advertisement with no
obligation to the customer.
Tie Ins
Where you tie in an event, person or an
activity in giving customers some
excitement and a bargain in a purchase
38
issues being raised. This is an area mostly neglected by retailers but a very powerful
medium in creating strong customer convictions about a retail store or a chain of outlets.
(vi) Customer Service Strategies.
Customer service reflects an essential part of the retail mix strategies. Cook and
Walter (1991), states that customer service strategy has a greater impact on a customer’s
store selection process and the purchasing process.
Cook and Walter’s analogy is presented below.
Figure 20 – Customer Service Strategy in Store Selection and Purchasing Process
Source – Cox and Walters, 1991, p.157 (adopted)
The importance of customer service strategy is highlighted above and marketers need to
focus more attention to this.
Customer service strategy is built through the service processes that a retail organisation
follows and the use of customer service personnel in delivering those services. Essentially
it deals with both the technical quality as well as the functional quality of the service.
Store selection
Cu
sto
mer
serv
ice
Purchasing
process
Search Comparison Transaction/use
Satisfaction
Dissatisfaction
Exit
Repeat purchase
Loyalty to the store
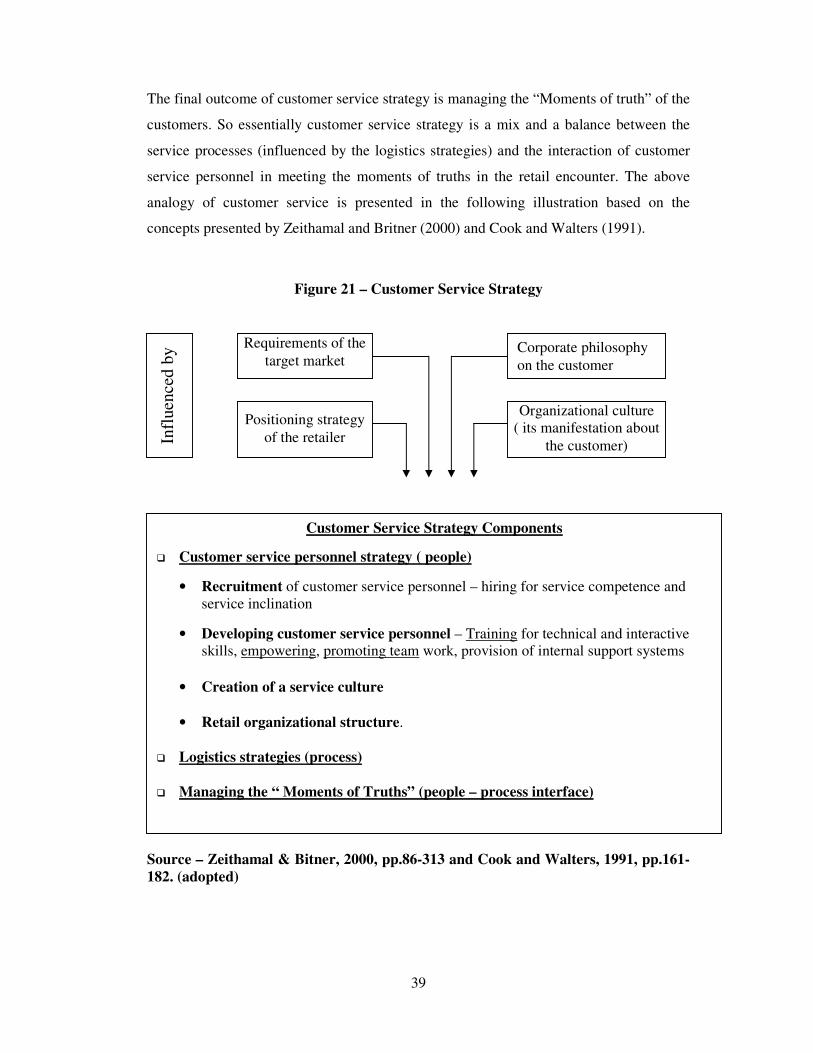
39
The final outcome of customer service strategy is managing the “Moments of truth” of the
customers. So essentially customer service strategy is a mix and a balance between the
service processes (influenced by the logistics strategies) and the interaction of customer
service personnel in meeting the moments of truths in the retail encounter. The above
analogy of customer service is presented in the following illustration based on the
concepts presented by Zeithamal and Britner (2000) and Cook and Walters (1991).
Figure 21 – Customer Service Strategy
Source – Zeithamal & Bitner, 2000, pp.86-313 and Cook and Walters, 1991, pp.161-
182. (adopted)
Infl
uen
ced b
y Requirements of the
target market
Positioning strategy
of the retailer
Corporate philosophy
on the customer
Organizational culture
( its manifestation about
the customer)
Customer Service Strategy Components
� Customer service personnel strategy ( people)
• Recruitment of customer service personnel – hiring for service competence and
service inclination
• Developing customer service personnel – Training for technical and interactive
skills, empowering, promoting team work, provision of internal support systems
• Creation of a service culture
• Retail organizational structure.
� Logistics strategies (process)
� Managing the “ Moments of Truths” (people – process interface)
40
(a) Customer service personnel strategy
Customer service personnel strategy involves four aspects. They are as follows.
The recruitment strategies of customer service personnel. A retailer should hire people
for both service competencies and for service mindness. The former refers to the skills
and knowledge in doing the job. The latter refers to the interest to do service related work
and having a service oriented personally such as helpfulness, thoughtfulness and
sociability.
Developing customer service personnel. Developing service personnel deals with
training them, empowering them, promoting team work and the provision of support
systems. Training essentially needs to be done to develop the technical skills as well as
interactive skills such as courteousness, caring, responsiveness and empathetic nature.
Front lines should be empowered to accommodate customer request through skills, tools
and authority. Empirical studies reveal when there is teamwork, service personnel
performed very well with customers. Support tools to serve the customers also need to be
provided.
Creation of service culture. Gronroos (1984) defines service culture as
A culture where an appreciation for good service exists, and where giving good
service to internal as well as to the ultimate external customer is considered a natural
way of life and one of most important norms by every one. (Gronroos: 1984:435)
The above denotes three aspects, which are the appreciation of good service, considering
both internal (employee) and external customer and treating service as a natural way of
life.
Retail organisational structure. Retail organisational structure is an important element
in the customer service strategy and dealing with service personnel. There are many
organisational structures available and the following continuum will discuss the degree
based on their levels of rigidity and adoptive nature
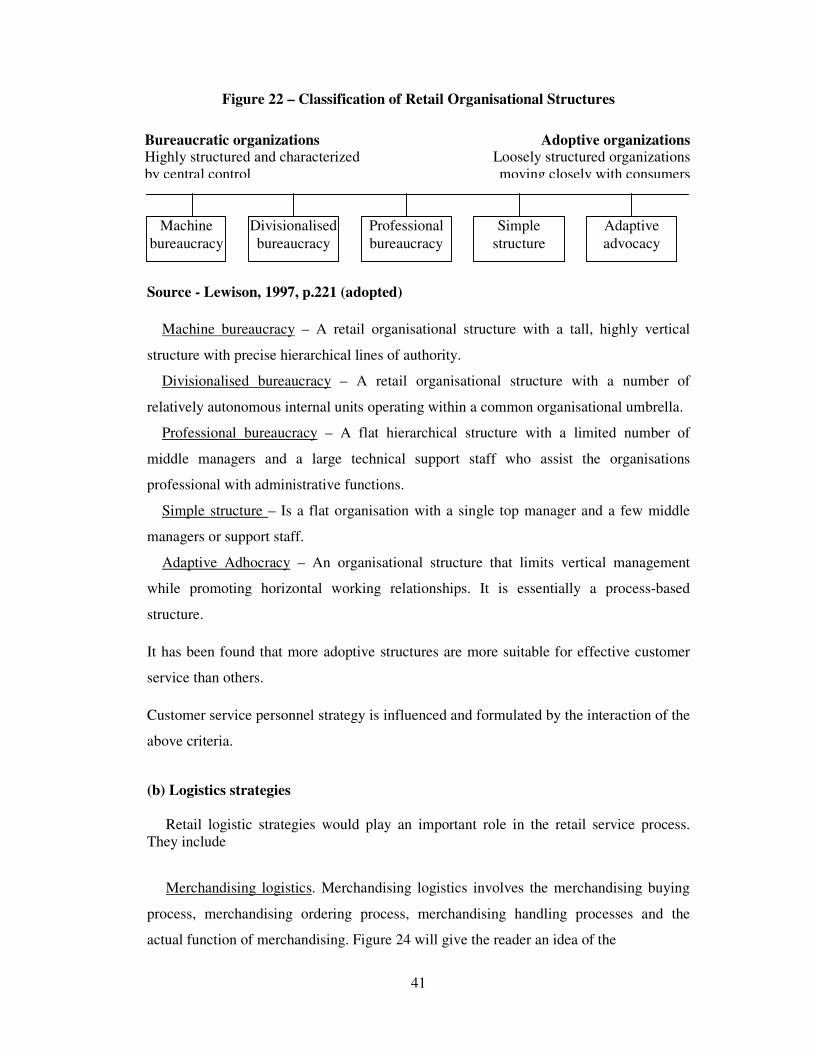
41
Figure 22 – Classification of Retail Organisational Structures
Source - Lewison, 1997, p.221 (adopted)
Machine bureaucracy – A retail organisational structure with a tall, highly vertical
structure with precise hierarchical lines of authority.
Divisionalised bureaucracy – A retail organisational structure with a number of
relatively autonomous internal units operating within a common organisational umbrella.
Professional bureaucracy – A flat hierarchical structure with a limited number of
middle managers and a large technical support staff who assist the organisations
professional with administrative functions.
Simple structure – Is a flat organisation with a single top manager and a few middle
managers or support staff.
Adaptive Adhocracy – An organisational structure that limits vertical management
while promoting horizontal working relationships. It is essentially a process-based
structure.
It has been found that more adoptive structures are more suitable for effective customer
service than others.
Customer service personnel strategy is influenced and formulated by the interaction of the
above criteria.
(b) Logistics strategies
Retail logistic strategies would play an important role in the retail service process.
They include
Merchandising logistics. Merchandising logistics involves the merchandising buying
process, merchandising ordering process, merchandising handling processes and the
actual function of merchandising. Figure 24 will give the reader an idea of the
Bureaucratic organizations Highly structured and characterized
by central control
Adoptive organizations Loosely structured organizations
moving closely with consumers
Machine
bureaucracy
Divisionalised
bureaucracy
Professional
bureaucracy
Simple
structure
Adaptive
advocacy

42
merchandising buying, ordering and the handling process. Effective co-ordination of all
these would allow customers to buy the right product at the right quantity at the right
time. These functions are the sole responsibility of the merchandising and the
warehousing teams of the retail outlet. Effective logistics not only affect service quality
but also effects product quality and would allow higher satisfaction levels.
Figure 23 – Merchandising Logistics Strategies
Source – Lewison, 1997, p.416 (adopted)
The actual function of merchandising goes beyond simply ordering goods. Merchandising
is a function in marketing, which ensures presenting the right product, at the right time, at
the right place, in the right quantity in the right quality for the right price. While many
aspects listed under the function of merchandising are covered by the other retail mix
strategies, presentation of merchandise which is a part of the SERVICESCAPE are
discussed under the store facility management mix. This needs to be effectively managed
under the process by the retail staff for effective service quality. Replenishing products on
the shelves, displaying them properly, indicating prices effectively, clearly labelling them,
removing expired products from shelves, ensuring that the displayed merchandising is
clean etc, are important aspects of the merchandising function.
Procedures to be followed. Procedures the customer needs to follow while shopping
needs to be effectively planned to provide maximum convenience to the customer. It is
equally important that those procedures need to be communicated effectively. For an
Merchandising Logistics Strategies
Merchandise buying
process
Merchandising
ordering process
Merchandising
handling process
Iden
tify
ing
th
e s
ou
rce
of
sup
ply
Co
nta
cti
ng
so
urc
es o
f
sup
ply
Eval
uat
ing
so
urc
es o
f
sup
ply
Neg
oti
atin
g w
ith
sou
rces
of
sup
ply
Reta
il b
uy
ing
stra
tegie
s
Reta
il b
uy
ing
met
ho
ds
Tra
dit
ion
al p
urc
has
e
ord
erin
g s
yst
em
Qu
ick
Res
po
nse
rep
len
ishm
en
t sy
stem
Rec
eiv
ing
mer
chan
dis
e
Ch
eck
ing
mer
chan
dis
e
Mark
ing
merc
han
dis
e
Sto
ckin
g m
erch
and
ise
43
example, where should customers keep their personal belongings while shopping, parking
procedures, entrances and exits, use of cash registers based on cash/credit payment,
quantity of items (less than five counter), assistance at children’s play areas, procedure
for demonstrations, store opening closing hours, opening on holidays, complains handling
procedures etc needs to be clearly communicated. These procedures need to be in line
with customer expectations of convenience.
Various policies governing the customers shopping experience. All organisations
should clearly spell out their policies in interacting with customers. This is an important
part in the formation of expectations thus avoid creating negative service quality gaps by
creating higher expectations and lower perceived performance. Examples of these
policies would be the returns acceptance policy for damaged goods, returns of wrong
goods purchased by the customers, return of excess goods purchased by customers, return
of wrongly invoiced products by the cashier, policy on complains, policies on carrying
private labels, policies on carrying or sourcing special types of products, policies on
assisting disable shoppers, policies on credit purchase, credit period, special deliveries,
treating all customers irrespective of status, income equally etc. Clear communication of
these policies will help customers to form their expectations thus avoid negative service
quality. For example if a retailer clearly mentions that returns will only be accepted with
the original bill or without the product being used or without any alterations, excess
goods purchased will not be accepted, wrongly billed goods will be accepted without any
questions asked, etc the customers would form their expectations accordingly.
What is important is once a policy is communicated, it needs to be followed without
making it red tape or with out varying it too much to suite different people or situations.
A certain amount of flexibility is required but the broad framework needs to be followed.
(c) Managing the moments of truth
The effective interaction of service processes and the service personnel together with
other functional strategy out comes would make an impact on the moment of truths of the
customer. Moment of truth is essentially all the points that a customer comes into contact
during the service encounter. From these moments of truths, customer receives a snap
shot of the organisations service quality and each encounter contributes to the overall
44
formation of perceptions of service quality. Managing moments of truths would manage
customer’s perceived performance of the service. Managing the moments of truth is
essentially the interface between customer service personnel and its processors.
7. Summary
Literature under several sections was discussed in this chapter. Section two looked at
the definition of service quality assessment, which was stated as the discrepancy between
customer expectations and the perceived performance. Based on this definition, three
levels of service quality gaps, which were the negative gap, no gap or a positive gap, were
identified.
In section three we explored elements of the service marketing mix and we ascertained
that based on the continuum of service, service quality was clearly represented by certain
elements of the marketing mix. We noted that product quality and pricing was different to
service quality based on the tangibility component.
Section four discussed various service dimensions used and techniques in measuring
service quality. We observed that most of those were revolving around the elements
identified which lead to the determination of service quality. We also discussed in very
brief various discussions on how to monitor service quality over time.
Section five discussed the relationship between service quality and customer satisfaction
level. Based on various theories we noted that service quality has been stated as an
important element in the customer satisfaction process. We also referred to literature,
which has indicated the influence made by physical product quality, and prices paid in
determining customer satisfaction.
Finally in section six we discussed in length the components of the retail mix strategies
In the next chapter we will discuss the conceptual framework of the proposed research
study in detail.
45
Chapter III
CONCEPTUAL FRAMEWORK AND METHODOLOGY
1. Introduction
In this chapter the writer wishes to present the conceptual framework of the research
study. Based on the research problem stated in chapter one, the research question will be
formulated revealing the dependent and independent variables. Stemming from this, an
argument will be presented on possible relationships between those variables. This
argument will lead to the formation of the conceptual framework, which will present the
hypothesis to be tested. The methodology in carrying out the research will present details
of the operational aspects of the study. Finally, limitations of the study will be discussed.
2. Research Question
The following research question is framed through the analysis of the research problem
presented in chapter one and based on the relationships identified in the literature review.
“What relationship if any exists between the recognition of service quality gaps and
the overall satisfaction of supermarket customers in Sri Lanka.”
Based on the problem stated and insights received through literature surveys, the above
research question is formulated to find out the relationship between the service quality
recognition level and the overall satisfaction of the supermarket customers. The following
argument is presented based on the above research question.
3. Argument
Supermarkets that seem to recognise service quality gaps will tend to increase
their customer satisfaction with service quality, which in turn will increase the
overall satisfaction in shopping in those supermarkets.
The argument presented by the writer indicates that those supermarkets that seem to
recognise service quality gaps would increase the satisfaction with service quality of their
customers. This satisfaction with service quality in turn will lead to an increase in the
overall satisfaction in shopping in the concerned supermarket. The rationale behind this
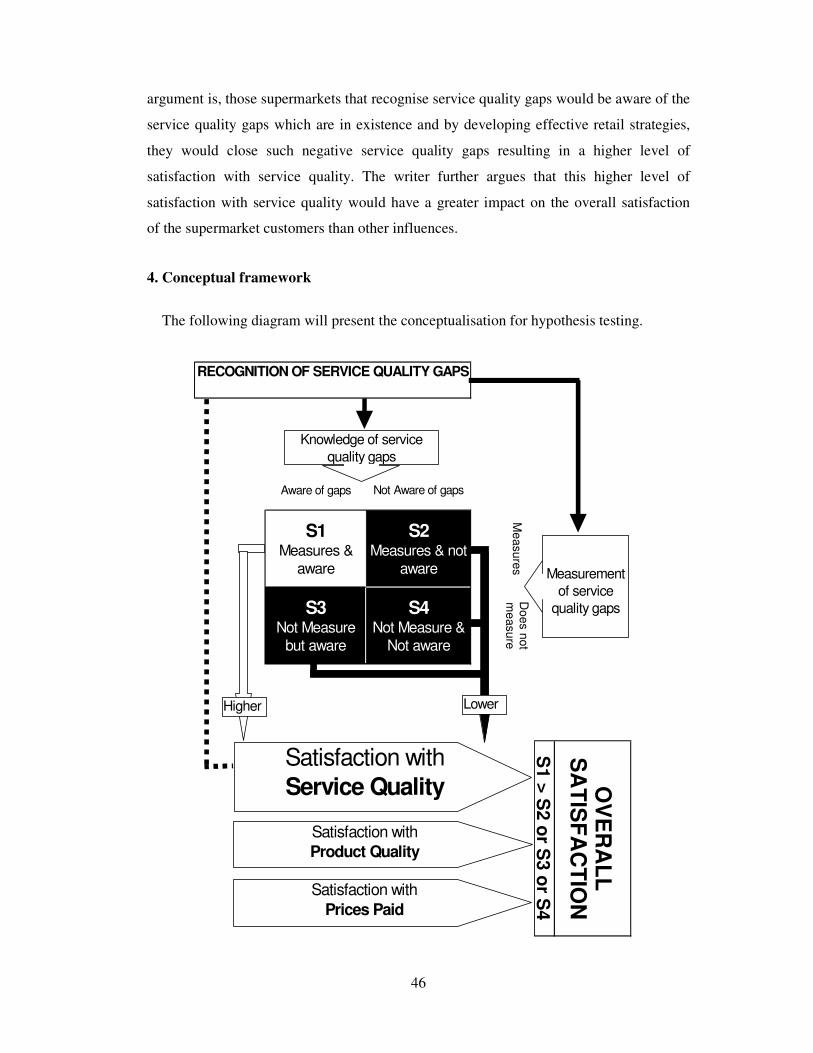
46
argument is, those supermarkets that recognise service quality gaps would be aware of the
service quality gaps which are in existence and by developing effective retail strategies,
they would close such negative service quality gaps resulting in a higher level of
satisfaction with service quality. The writer further argues that this higher level of
satisfaction with service quality would have a greater impact on the overall satisfaction
of the supermarket customers than other influences.
4. Conceptual framework
The following diagram will present the conceptualisation for hypothesis testing.
RECOGNITION OF SERVICE QUALITY GAPS
Aware of gaps Not Aware of gaps
Me
asu
res
S1 Measures &
aware
S2 Measures & not
aware
S3 Not Measure
but aware
S4 Not Measure &
Not aware
S1
> S
2 o
r S3
or S
4
OV
ER
AL
L
SA
TIS
FA
CT
ION
Do
es n
ot
me
asu
re
Satisfaction with
Service Quality
Satisfaction with
Product Quality
Satisfaction with
Prices Paid
Measurement
of service
quality gaps
Knowledge of service
quality gaps
Higher Lower
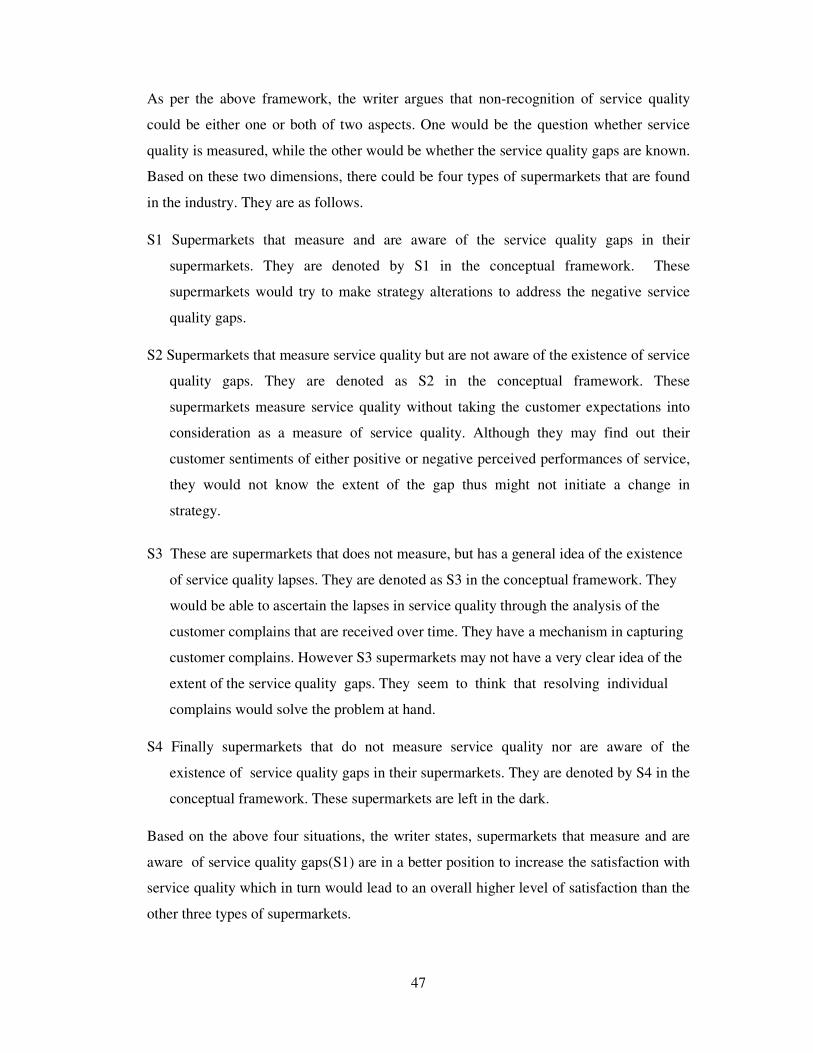
47
As per the above framework, the writer argues that non-recognition of service quality
could be either one or both of two aspects. One would be the question whether service
quality is measured, while the other would be whether the service quality gaps are known.
Based on these two dimensions, there could be four types of supermarkets that are found
in the industry. They are as follows.
S1 Supermarkets that measure and are aware of the service quality gaps in their
supermarkets. They are denoted by S1 in the conceptual framework. These
supermarkets would try to make strategy alterations to address the negative service
quality gaps.
S2 Supermarkets that measure service quality but are not aware of the existence of service
quality gaps. They are denoted as S2 in the conceptual framework. These
supermarkets measure service quality without taking the customer expectations into
consideration as a measure of service quality. Although they may find out their
customer sentiments of either positive or negative perceived performances of service,
they would not know the extent of the gap thus might not initiate a change in
strategy.
S3 These are supermarkets that does not measure, but has a general idea of the existence
of service quality lapses. They are denoted as S3 in the conceptual framework. They
would be able to ascertain the lapses in service quality through the analysis of the
customer complains that are received over time. They have a mechanism in capturing
customer complains. However S3 supermarkets may not have a very clear idea of the
extent of the service quality gaps. They seem to think that resolving individual
complains would solve the problem at hand.
S4 Finally supermarkets that do not measure service quality nor are aware of the
existence of service quality gaps in their supermarkets. They are denoted by S4 in the
conceptual framework. These supermarkets are left in the dark.
Based on the above four situations, the writer states, supermarkets that measure and are
aware of service quality gaps(S1) are in a better position to increase the satisfaction with
service quality which in turn would lead to an overall higher level of satisfaction than the
other three types of supermarkets.

48
In other words S2, S3 & S4 supermarkets may not satisfy their customer as much as the
S1 types.
The framework has also recognised that customer satisfaction could be influenced by
satisfaction with physical product quality and satisfaction with the prices paid by the
customer. The satisfaction with product quality or prices paid would be an outcome of
gaps between expectations of product quality/prices vs. the perceived performances of
product quality/prices actually paid. It is the view of the writer that satisfaction with
service quality may lead to a higher level of satisfaction than these two.
(i) Variables and their relationships
Independent Variables Dependent Variables
Satisfaction with service
quality
Supermarkets that
1. Measure and are aware of service
quality gaps
2. Measures but are not aware of
service quality gaps
3. Does not measure but has an idea of
service quality
4. Does not measure and are not aware
of service quality gaps
Knowledge of service
quality gaps
Measurement of service
quality gaps
Recognition of service
quality gaps
Measurement of service
quality gaps
Knowledge of service quality
gaps
Recognition of service
quality gaps
Customer expectations of
the service
Perceived performance of
the service
Service quality gaps
Satisfaction with service
quality
Overall customer
satisfaction
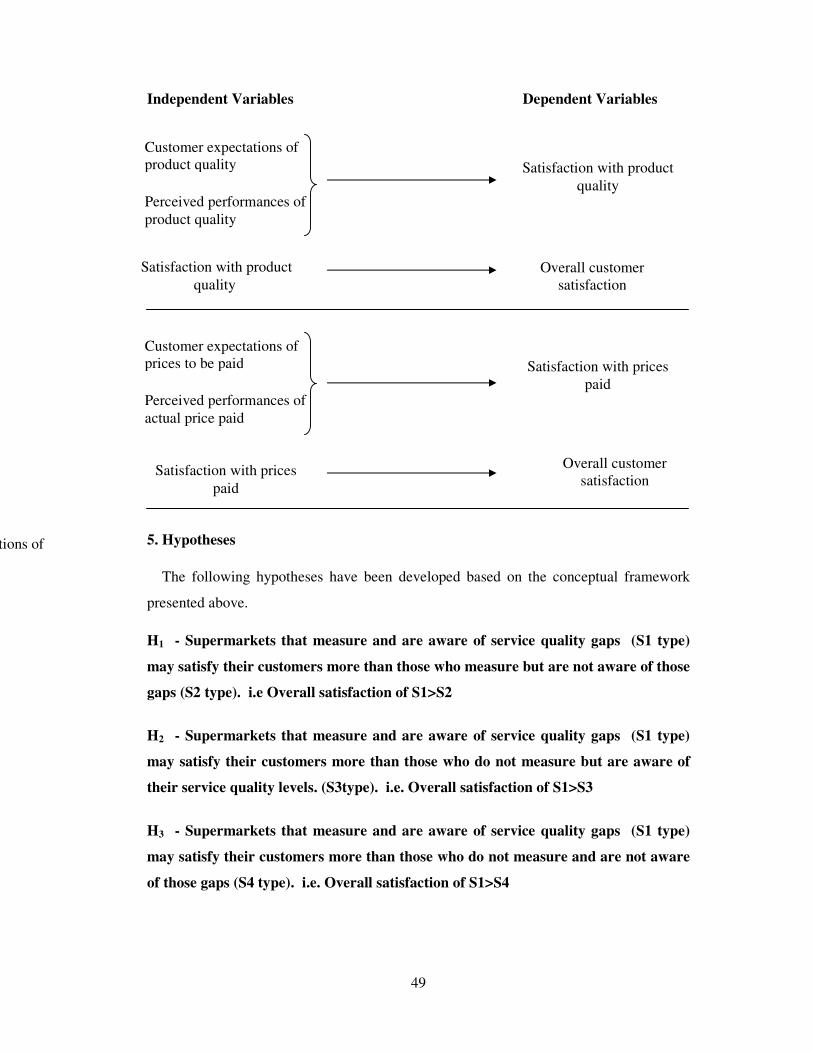
49
Independent Variables Dependent Variables
5. Hypotheses
The following hypotheses have been developed based on the conceptual framework
presented above.
H1 - Supermarkets that measure and are aware of service quality gaps (S1 type)
may satisfy their customers more than those who measure but are not aware of those
gaps (S2 type). i.e Overall satisfaction of S1>S2
H2 - Supermarkets that measure and are aware of service quality gaps (S1 type)
may satisfy their customers more than those who do not measure but are aware of
their service quality levels. (S3type). i.e. Overall satisfaction of S1>S3
H3 - Supermarkets that measure and are aware of service quality gaps (S1 type)
may satisfy their customers more than those who do not measure and are not aware
of those gaps (S4 type). i.e. Overall satisfaction of S1>S4
Customer Expectations of
Customer expectations of
product quality
Perceived performances of
product quality
Satisfaction with product
quality
Satisfaction with product
quality
Overall customer
satisfaction
Customer expectations of
prices to be paid
Perceived performances of
actual price paid
Satisfaction with prices
paid
Satisfaction with prices
paid
Overall customer
satisfaction
50
In developing the above hypotheses, the writer maintains that the impact of product
quality and prices paid are constant as service quality would have a higher impact on
overall customer satisfaction. The above is presented with the following line of argument.
Supermarkets are essentially retailers. i.e. they sell products of other manufactures. The
quality of products in one supermarket would be very much similar to that of another
except for private labels brands and perishables like fruits, vegetables, meat and fish
products. The latter items may represent a small proportion of merchandise and even so
there is no big differentiation between them as per the experience of the writer.
The prices that are charged in most supermarkets are fixed by manufacturers themselves
other than for a few items. The amount of differentiation done through prices are
relatively less.
Given the above two conditions, supermarkets generally differentiate themselves through
the service quality criteria. So the writer has formulated the above hypotheses with the
premise that product quality and prices paid are qualifying criteria of customer
satisfaction and service quality would act as a determining criterion of customer
satisfaction.
The writer would re visit the impact made through product quality and prices paid in
determining the satisfaction level of the Sri Lankan supermarket customers before making
his final conclusions.
6. Definition of Key Concepts
The key concepts used in the conceptual model are defined as follows.
Customer expectations – The expectations created by the customer in his mind before
encountering the service in the supermarkets.
Customer’s perceived performance – The perceived performance the customer creates
in his mind about the service based on the service encounter.
Service quality gap – The discrepancy between the expectations of customers and the
perceived performances of the service offer. Could be of three forms.
51
Positive ( Perceived performance> expectations) , No gap ( Perceived performance =
expectation), Negative gap ( Perceived performance< expectation)
Recognition of service quality gaps – Supermarkets identifying service quality gaps as
important elements in satisfying customer requirements. It would be either one or a
combination of measuring service quality in the supermarkets as well as the knowledge
of the existence of service quality gaps.
Satisfaction with service quality - The gratification that is created in the minds of the
customer by meeting or exceeding their requirements in terms of service quality.
Product quality gap – The discrepancy between the expectations of customers on the
quality of the product and their perceived performances of the product quality after usage.
Price gap – The discrepancy between what the customer expected to pay in buying goods
from the supermarkets and the actual prices paid.
Satisfaction with product quality - The gratification that is created in the minds of the
customer by meeting or exceeding their requirements in terms of product quality.
Satisfaction with prices paid - The gratification that is created in the minds of the
customer by meeting or exceeding their requirements in terms of price expectations and
perceived performances.
Overall customer satisfaction – The gratification that is created in the minds of the
customer by meeting or exceeding their requirements in terms of product, prices and
service quality.
7. Operationalisation
The operationalisation of this research is divided into two sections. The first section
would address the present service quality recognition levels in the five supermarkets
under study. The following table provides the reader with the basis used by the writer in
categorising each of the five supermarkets into the four types of service quality
recognition levels as conceptualised in the service quality recognition matrix.
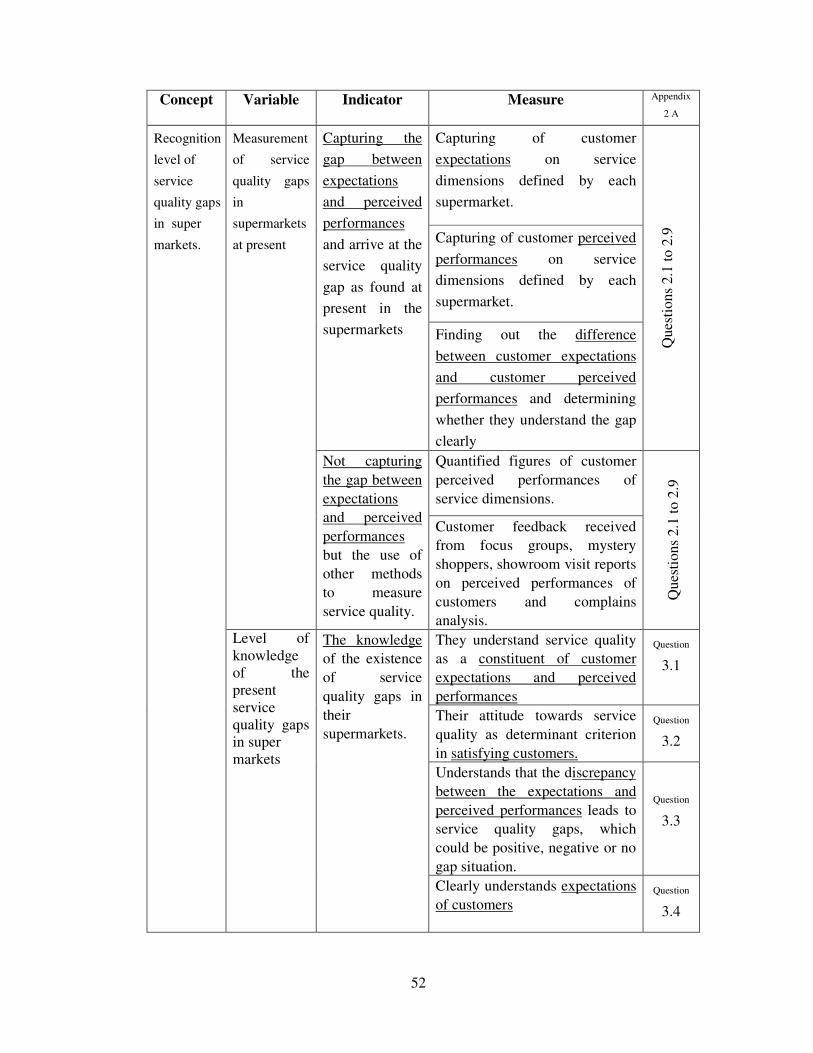
52
Concept Variable Indicator Measure Appendix
2 A
Recognition
level of
service
quality gaps
in super
markets.
Measurement
of service
quality gaps
in
supermarkets
at present
Capturing the
gap between
expectations
and perceived
performances
and arrive at the
service quality
gap as found at
present in the
supermarkets
Capturing of customer
expectations on service
dimensions defined by each
supermarket.
Qu
esti
on
s 2
.1 t
o 2
.9
Capturing of customer perceived
performances on service
dimensions defined by each
supermarket.
Finding out the difference
between customer expectations
and customer perceived
performances and determining
whether they understand the gap
clearly
Not capturing
the gap between
expectations
and perceived
performances
but the use of
other methods
to measure
service quality.
Quantified figures of customer
perceived performances of
service dimensions.
Qu
esti
on
s 2
.1 t
o 2
.9
Customer feedback received
from focus groups, mystery
shoppers, showroom visit reports
on perceived performances of
customers and complains
analysis.
Level of
knowledge
of the
present
service
quality gaps
in super
markets
The knowledge
of the existence
of service
quality gaps in
their
supermarkets.
They understand service quality
as a constituent of customer
expectations and perceived
performances
Question
3.1
Their attitude towards service
quality as determinant criterion
in satisfying customers.
Question
3.2
Understands that the discrepancy
between the expectations and
perceived performances leads to
service quality gaps, which
could be positive, negative or no
gap situation.
Question
3.3
Clearly understands expectations
of customers
Question
3.4
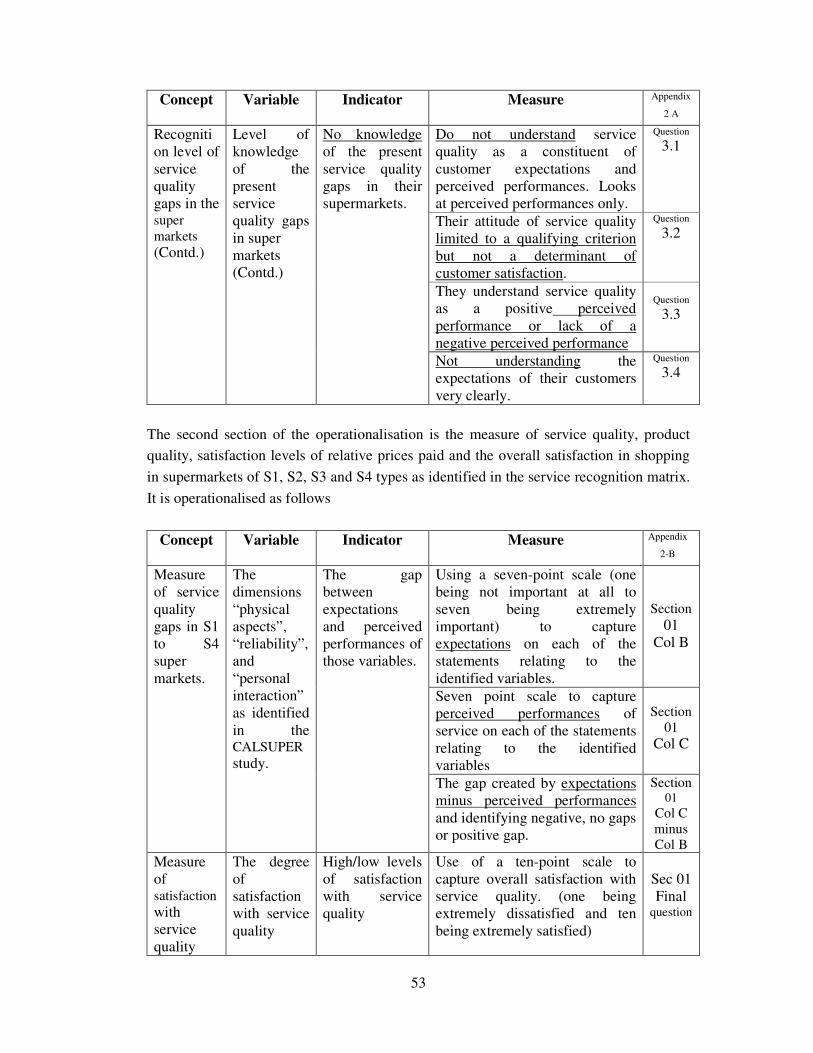
53
Concept Variable Indicator Measure Appendix
2 A
Recogniti
on level of
service
quality
gaps in the super
markets (Contd.)
Level of
knowledge
of the
present
service
quality gaps
in super
markets
(Contd.)
No knowledge
of the present
service quality
gaps in their
supermarkets.
Do not understand service
quality as a constituent of
customer expectations and
perceived performances. Looks
at perceived performances only.
Question
3.1
Their attitude of service quality
limited to a qualifying criterion
but not a determinant of
customer satisfaction.
Question
3.2
They understand service quality
as a positive perceived
performance or lack of a
negative perceived performance
Question
3.3
Not understanding the
expectations of their customers
very clearly.
Question
3.4
The second section of the operationalisation is the measure of service quality, product
quality, satisfaction levels of relative prices paid and the overall satisfaction in shopping
in supermarkets of S1, S2, S3 and S4 types as identified in the service recognition matrix.
It is operationalised as follows
Concept Variable Indicator Measure Appendix
2-B
Measure
of service
quality
gaps in S1
to S4
super
markets.
The
dimensions
“physical
aspects”,
“reliability”,
and
“personal
interaction”
as identified
in the CALSUPER
study.
The gap
between
expectations
and perceived
performances of
those variables.
Using a seven-point scale (one
being not important at all to
seven being extremely
important) to capture
expectations on each of the
statements relating to the
identified variables.
Section
01
Col B
Seven point scale to capture
perceived performances of
service on each of the statements
relating to the identified
variables
Section
01
Col C
The gap created by expectations
minus perceived performances
and identifying negative, no gaps
or positive gap.
Section 01
Col C
minus Col B
Measure
of satisfaction with
service
quality
The degree
of
satisfaction
with service
quality
High/low levels
of satisfaction
with service
quality
Use of a ten-point scale to
capture overall satisfaction with
service quality. (one being
extremely dissatisfied and ten
being extremely satisfied)
Sec 01
Final question

54
Concept Variable Indicator Measure Appendix
2-B
Measure
of
product
quality
gaps in S1
to S4
super
markets.
The
dimension
“Policies”
identified in
the
CALSUPER
study
The gap
between
expectations
and perceived
performances of
that variable.
Seven point scale to capture
expectation of product quality
Section
02
Col B
Seven point scale to capture
perceived performances of
product quality.
Section
02
Col C
Gaps created in product quality
created through expectations and
perceived performances.
Section
02
Col C
minus B
Measure
of
satisfaction
with
product
quality
The degree
of
satisfaction
with product
quality
High/low levels
of satisfaction
with product
quality
Use of a ten-point scale to
capture overall satisfaction with
product quality. ( one being
extremely dissatisfied and ten
being extremely satisfied)
Section
02
Final
question
.
Measure
of gaps in
prices
paid for
S1 – S4
supermark
ets.
A new
dimension
called
“price”
The gap
between
expectations
and perceived
performances of
that variable
Seven point scale to capture
expectation of prices of products
Section
03
Column
Col B
Seven point scale to capture
perceived performances of prices
paid.
Section
03 Col
C
Gaps in prices paid created
through expectations and
perceived performances.
Section
03
Col C
minus B
Measure
of
satisfaction
with
prices
paid
The degree
of
satisfaction
with prices
paid
High/low levels
of satisfaction
with prices
paid.
Use of a ten-point scale to
capture overall satisfaction with
prices paid. ( one being
extremely dissatisfied and ten
being extremely satisfied)
Section
03
Final
question
.
Overall
Customer
satisfaction
The degree
of customer
satisfaction
High/low levels
of satisfaction
Use of a ten point scale to
capture the overall degree of
satisfaction
Section
04
The questionnaire is based on the above operationalisation. The basis of developing the
questionnaires will be further discussed under the methodology.
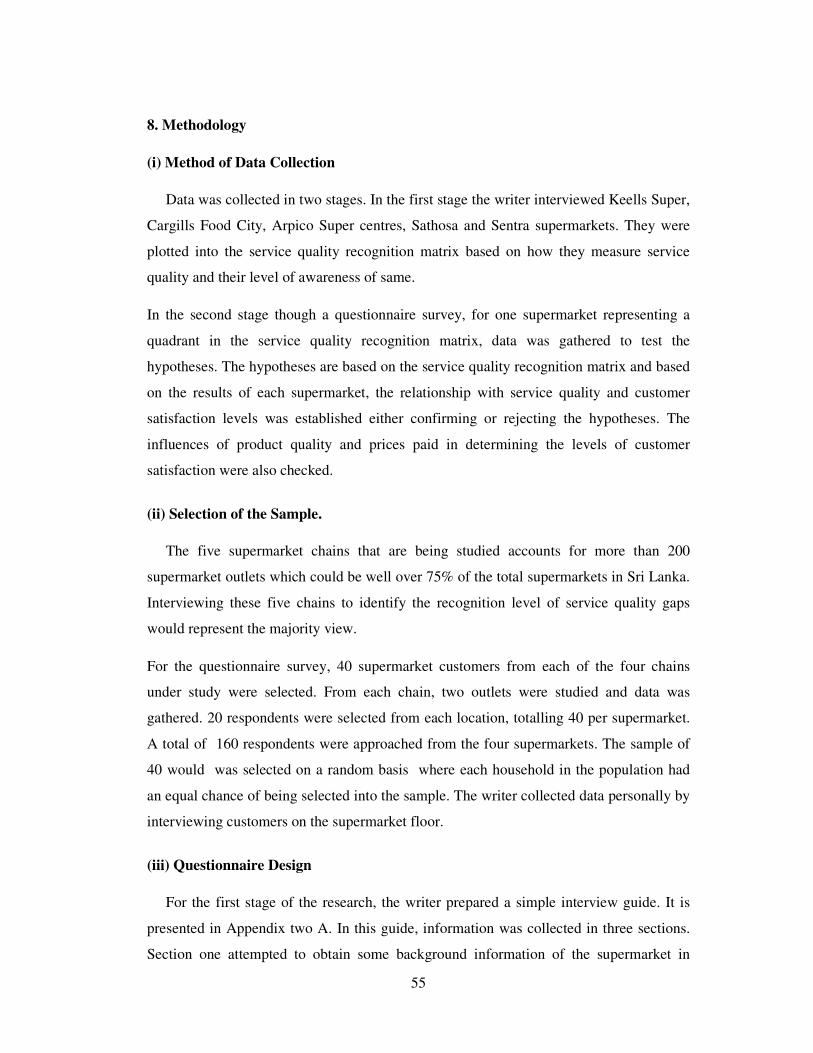
55
8. Methodology
(i) Method of Data Collection
Data was collected in two stages. In the first stage the writer interviewed Keells Super,
Cargills Food City, Arpico Super centres, Sathosa and Sentra supermarkets. They were
plotted into the service quality recognition matrix based on how they measure service
quality and their level of awareness of same.
In the second stage though a questionnaire survey, for one supermarket representing a
quadrant in the service quality recognition matrix, data was gathered to test the
hypotheses. The hypotheses are based on the service quality recognition matrix and based
on the results of each supermarket, the relationship with service quality and customer
satisfaction levels was established either confirming or rejecting the hypotheses. The
influences of product quality and prices paid in determining the levels of customer
satisfaction were also checked.
(ii) Selection of the Sample.
The five supermarket chains that are being studied accounts for more than 200
supermarket outlets which could be well over 75% of the total supermarkets in Sri Lanka.
Interviewing these five chains to identify the recognition level of service quality gaps
would represent the majority view.
For the questionnaire survey, 40 supermarket customers from each of the four chains
under study were selected. From each chain, two outlets were studied and data was
gathered. 20 respondents were selected from each location, totalling 40 per supermarket.
A total of 160 respondents were approached from the four supermarkets. The sample of
40 would was selected on a random basis where each household in the population had
an equal chance of being selected into the sample. The writer collected data personally by
interviewing customers on the supermarket floor.
(iii) Questionnaire Design
For the first stage of the research, the writer prepared a simple interview guide. It is
presented in Appendix two A. In this guide, information was collected in three sections.
Section one attempted to obtain some background information of the supermarket in

56
terms of its organisational structure, turn over, number of outlets, employees , history etc.
Section two contained questions to ascertain how supermarkets measured service quality,
the methodology used, the sample, frequency etc. Section three included questions to
check their level of awareness of service quality gaps in supermarkets.
For the second stage of the research, the questionnaire was designed based on the
CALSUPER study carried out in measuring service quality with a few alterations. In this
original model, the founder researchers conceptualised four major service dimensions in
measuring service quality. They were physical aspects, personal interaction, reliability
and policies. The first three dimensions were used to capture service quality and the
fourth element was to capture the product quality of the supermarket experience. In the
CALSUPER study, the impact of prices paid has not been checked as the researchers had
argued that the satisfaction levels from prices paid would be reflected in the service
quality measures.
Some minor changes were made to the CALSUPER model in using it for the purpose of
this study in particular and also taking the Sri Lankan super marketing customer into
consideration. The changes and the structure of the questionnaire are presented as
follows.
Minimum changes were made to a few statements without affecting the basis of its
measure.
The first three dimensions (physical aspects, personal interaction, and reliability) are
used to measure service quality gaps. Expectations and perceived performances were
captured in two separate seven-point scales. This is presented in section one of the
questionnaire. At the end of this section a check on the overall satisfaction with
service quality was presented in a ten-point scale.
The fourth dimension was used to measure product quality gaps. Expectations and
perceived performances are captured in two separate seven-point scales. Some
statements under policies were also slightly modified. This was presented under
section two in the questionnaire. At the end of this section a check on the overall
satisfaction with product quality was presented in a ten-point scale
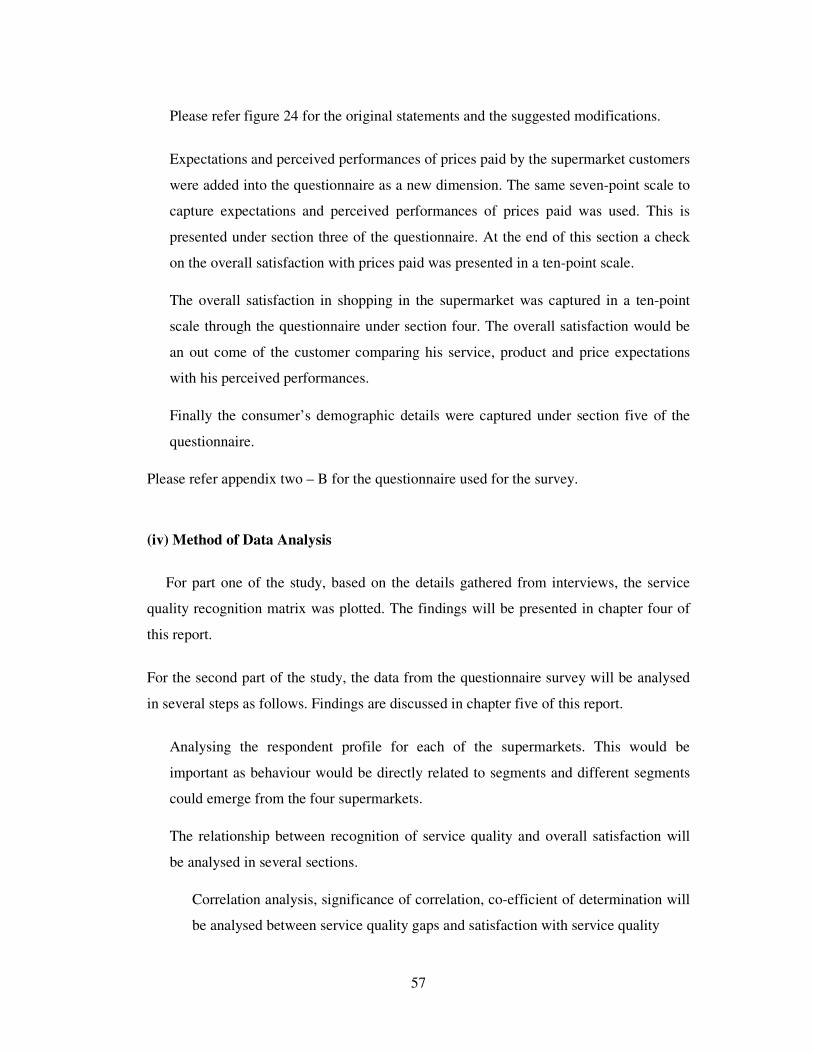
57
Please refer figure 24 for the original statements and the suggested modifications.
Expectations and perceived performances of prices paid by the supermarket customers
were added into the questionnaire as a new dimension. The same seven-point scale to
capture expectations and perceived performances of prices paid was used. This is
presented under section three of the questionnaire. At the end of this section a check
on the overall satisfaction with prices paid was presented in a ten-point scale.
The overall satisfaction in shopping in the supermarket was captured in a ten-point
scale through the questionnaire under section four. The overall satisfaction would be
an out come of the customer comparing his service, product and price expectations
with his perceived performances.
Finally the consumer’s demographic details were captured under section five of the
questionnaire.
Please refer appendix two – B for the questionnaire used for the survey.
(iv) Method of Data Analysis
For part one of the study, based on the details gathered from interviews, the service
quality recognition matrix was plotted. The findings will be presented in chapter four of
this report.
For the second part of the study, the data from the questionnaire survey will be analysed
in several steps as follows. Findings are discussed in chapter five of this report.
Analysing the respondent profile for each of the supermarkets. This would be
important as behaviour would be directly related to segments and different segments
could emerge from the four supermarkets.
The relationship between recognition of service quality and overall satisfaction will
be analysed in several sections.
Correlation analysis, significance of correlation, co-efficient of determination will
be analysed between service quality gaps and satisfaction with service quality
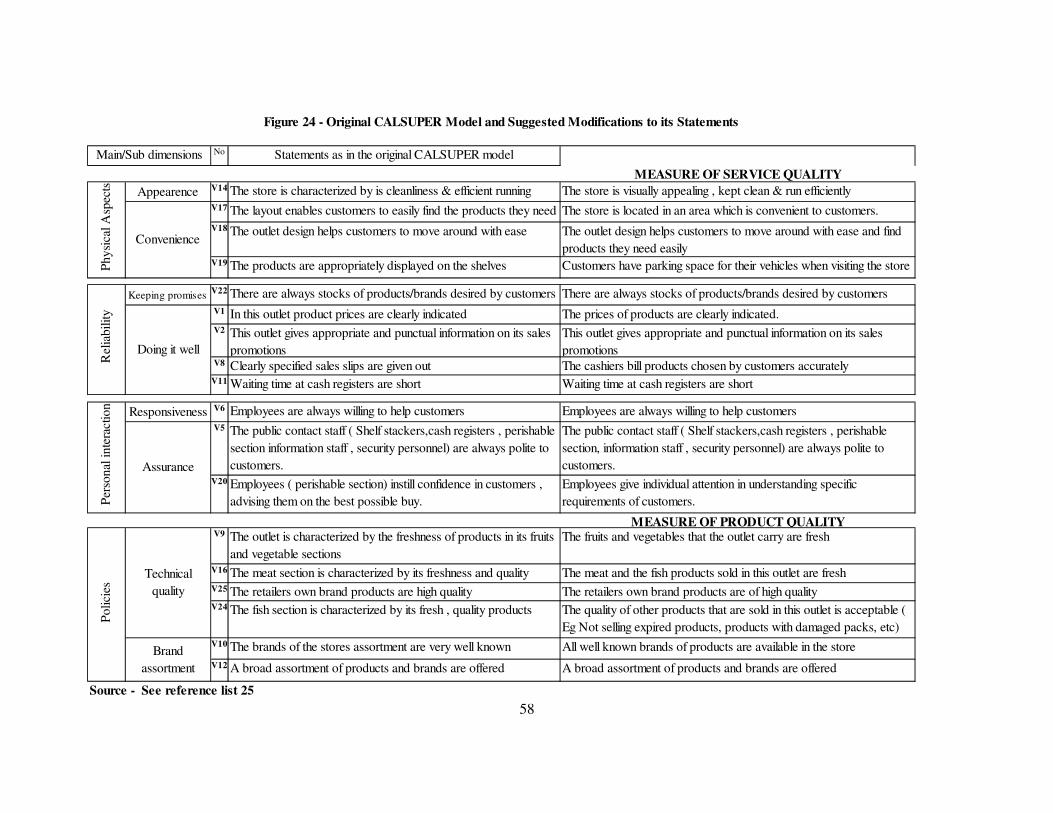
58
No Statements as in the original CALSUPER model MODIFIED STATEMENTS
MEASURE OF SERVICE QUALITY
Appearence V14 The store is characterized by is cleanliness & efficient running The store is visually appealing , kept clean & run efficiently
V17 The layout enables customers to easily find the products they need The store is located in an area which is convenient to customers.
V18 The outlet design helps customers to move around with ease The outlet design helps customers to move around with ease and find
products they need easilyV19 The products are appropriately displayed on the shelves Customers have parking space for their vehicles when visiting the store
Keeping promisesV22 There are always stocks of products/brands desired by customers There are always stocks of products/brands desired by customers
V1 In this outlet product prices are clearly indicated The prices of products are clearly indicated.V2 This outlet gives appropriate and punctual information on its sales
promotions
This outlet gives appropriate and punctual information on its sales
promotionsV8 Clearly specified sales slips are given out The cashiers bill products chosen by customers accurately
V11 Waiting time at cash registers are short Waiting time at cash registers are short
Responsiveness V6 Employees are always willing to help customers Employees are always willing to help customers
V5 The public contact staff ( Shelf stackers,cash registers , perishable
section information staff , security personnel) are always polite to
customers.
The public contact staff ( Shelf stackers,cash registers , perishable
section, information staff , security personnel) are always polite to
customers.V20 Employees ( perishable section) instill confidence in customers ,
advising them on the best possible buy.
Employees give individual attention in understanding specific
requirements of customers.
MEASURE OF PRODUCT QUALITYV9 The outlet is characterized by the freshness of products in its fruits
and vegetable sections
The fruits and vegetables that the outlet carry are fresh
V16 The meat section is characterized by its freshness and quality The meat and the fish products sold in this outlet are fresh V25 The retailers own brand products are high quality The retailers own brand products are of high qualityV24 The fish section is characterized by its fresh , quality products The quality of other products that are sold in this outlet is acceptable (
Eg Not selling expired products, products with damaged packs, etc)
V10 The brands of the stores assortment are very well known All well known brands of products are available in the store
V12 A broad assortment of products and brands are offered A broad assortment of products and brands are offered
Source - See reference list 25
Assurance
Figure 24 - Original CALSUPER Model and Suggested Modifications to its Statements
Main/Sub dimensions
Technical
quality
Brand
assortment
Polici
es
Convenience
Rel
iabil
ity
Physi
cal A
spec
tsP
erso
nal
inte
ract
ion
Doing it well

58
A similar exercise will be carried out to asses the relationship between satisfaction
with service quality and the overall satisfaction.
Relationship between product quality gaps and satisfaction with product quality and
satisfaction with product quality and overall satisfaction will also be subjected to the
same correlation tests as above.
Gaps in prices and satisfaction with prices and satisfaction with prices and overall
satisfaction will also be subjected to a correlation analysis.
In order to identify the composite impact of service quality, product quality and
satisfaction with prices paid in influencing the overall satisfaction, a multiple
regression analysis will be presented.
Finally the three hypotheses presented will be subjected to hypothesis test using the
significance testing at a 5% level of significance.
Various cross analysis will be presented in identifying relationships as suggested by data.
9. Limitations of the Study
The following are sited as limitations in this research study.
1) Alterations done to the CALSUPER study has not been empirically validated for
reasons of manageability and time constrains. All efforts were made to maintain the
original construct of the model with minimum changes. However not validating the
changes would remain as a weakness of the questionnaire.
2) Relative protective policies adopted by supermarkets under study would deprive the
researcher some of the ground situations used at present in measuring service quality
in these organisations and presenting their performance levels. While all efforts will
be made to project the actual situation, the reader would be deprived of some element
of undisclosed facts in the research.
3) The attitude of some of the respondents on the supermarket floor i.e. time constrains,
is sited as a limitation in collecting data. In order to arrive at the sample size , several
more interviews had to be taken as the incompleteness of the questionnaires were high
at times up to 20% affecting the randomness of the sample. This is sited as a
59
limitation and the writer wishes to recommend data collection through a mystery
shopper programme or a focus group study in mitigating this limitation.
4) The conclusions arrived for each supermarket type was based on the measurement of
two outlets for each chain. The target market profile and the measures would at times
be different. Although cross analysis were carried out, there could be variations
among outlets. Also in making generalisations on a supermarket chain, ideally a fair
representation of its outlets needs to be measured. The use of two outlets only would
also act as a limitation on the representative ness.
10. Summary
In this chapter our focus was in presenting a framework of the intended study. The
reader was given a thorough understanding about the relationships in terms of the
research question stemming from the research problem identified. The valid connection
between the argument, conceptual framework and the hypotheses were presented in
testing this model. It was stated that information was collected in two stages where the
first stage was based on a series of interviews in understanding the present service quality
recognition levels in the five supermarkets under study. In the second part, four research
studies using a questionnaire for in each of these supermarkets representing different
service recognition levels were carried out. After measuring the service quality gaps,
through statistical analysis the hypotheses will be validated and the findings of this
research would be presented.
In the next chapter the writer will present his findings on the present service quality
recognition levels in the supermarkets under study based on the conceptual framework
presented.
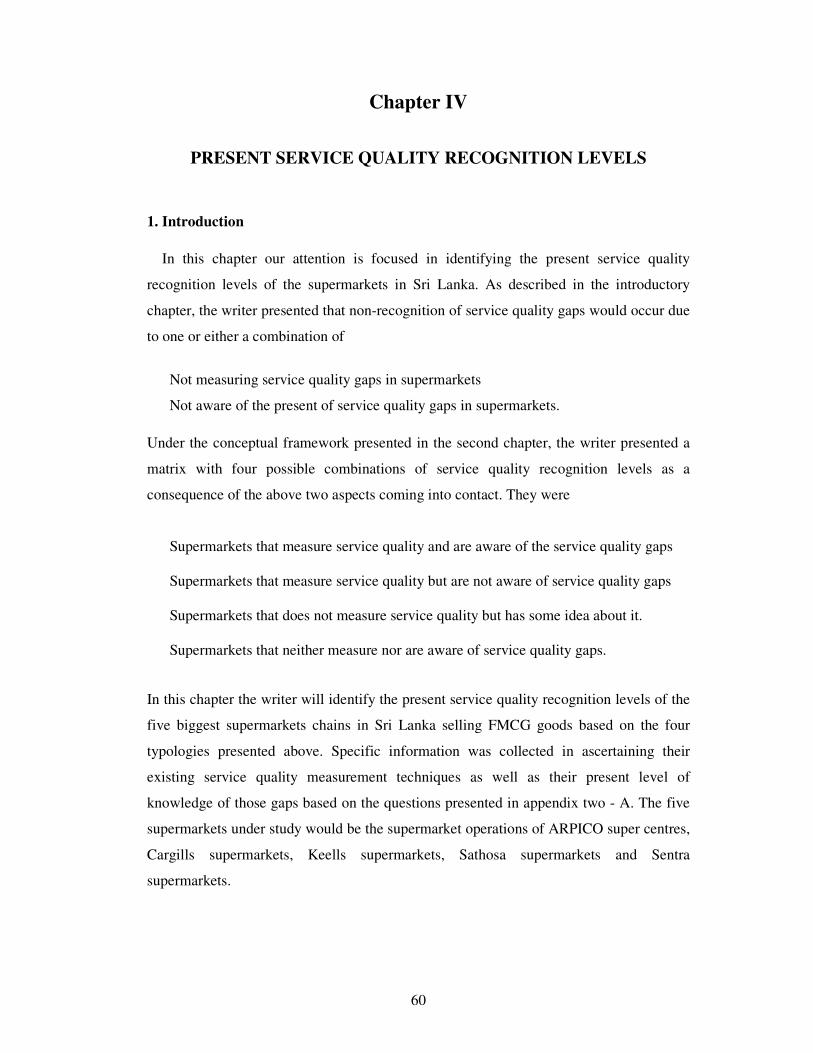
60
Chapter IV
PRESENT SERVICE QUALITY RECOGNITION LEVELS
1. Introduction
In this chapter our attention is focused in identifying the present service quality
recognition levels of the supermarkets in Sri Lanka. As described in the introductory
chapter, the writer presented that non-recognition of service quality gaps would occur due
to one or either a combination of
Not measuring service quality gaps in supermarkets
Not aware of the present of service quality gaps in supermarkets.
Under the conceptual framework presented in the second chapter, the writer presented a
matrix with four possible combinations of service quality recognition levels as a
consequence of the above two aspects coming into contact. They were
Supermarkets that measure service quality and are aware of the service quality gaps
Supermarkets that measure service quality but are not aware of service quality gaps
Supermarkets that does not measure service quality but has some idea about it.
Supermarkets that neither measure nor are aware of service quality gaps.
In this chapter the writer will identify the present service quality recognition levels of the
five biggest supermarkets chains in Sri Lanka selling FMCG goods based on the four
typologies presented above. Specific information was collected in ascertaining their
existing service quality measurement techniques as well as their present level of
knowledge of those gaps based on the questions presented in appendix two - A. The five
supermarkets under study would be the supermarket operations of ARPICO super centres,
Cargills supermarkets, Keells supermarkets, Sathosa supermarkets and Sentra
supermarkets.

61
2. Supermarkets at a Glance
Super marketing is one retail format found in Sri Lanka out of many. Appendix three A
of this report will give the reader insights into different retail classifications in Sri Lanka.
A list of supermarkets that operates in Sri Lanka is presented in appendix three B. You
may see over sixty organisations operating around 270 outlets around the Island accept in
the war torn areas. The geographical distribution of the outlets of the five main
supermarkets and others under study is presented in appendix three C. You may also see
the density per supermarket around the Island. The figures will state that five chains
account for more than 200 out of 270 outlets with Sathosa clearly leading the list.
Appendix three D will present the above distribution on a Sri Lanka map.
Appendices E to I will indicate some of the performance figures for the five outlets.
Appendix E would give the total sales of the five outlets, which is in excess of 10 billion
rupees for the year 2002. Appendix three F will present the growth levels in turnover of
these five supermarkets, which are growing at phenomenal rates. Appendix three G would
highlight the changes in sales shares of these five outlets over the three years and you
may notice that Sathosa’s market share was on the decline and with the advent of its
restructuring plans it has been able to regain some of its share. Appendix three H will
illustrate the growth in the outlets of the five supermarkets over last three years, which
seem to grow on an overall basis.
Appendix three I will give the reader an idea of the supermarket retail life cycle, which
was adopted by the writer from the works of Davidson, Bates and Bass (1976) and plotted
with available data in the industry. You will clearly see that the industry is in a high
growth period entering into the growth stage of the supermarket retail life cycle.
The above information is presented as a preamble in discussing the different operations of
the five supermarkets understudy. The point to note would be that since the industry is in
the high growth stage at present, any single supermarket will not feel a pinch in their sales
for the next few years. But the real test would be when they enter the maturity stage
where intense competition would grab market share of each other. Supermarkets that
undertake measuring service quality would be in a better position to deal with those
changes in time to come than the ones who may not choose to do so at present.

62
3. Supermarket Operations of ARPICO Super Centers
(i) Background
ARPICO super centers are operated and managed by Richard Pieris Distributors
Limited, (RPD) which is a fully owned subsidiary of Richard Pieris and Company
Limited. It operates three super centers at present, which offers both durable and FMCG
products under one roof, creating yet another new retail format in this country. The focus
of our attention in this study is the supermarket operations of the super centers, which
offers FMCG products.
The first Arpico super center was opened in April 2001 at Battaramulla, the second in
Dehiwala in October 2001 and its third at Hyde Park Corner in November 2002. RPD
has a wide distribution operation and the super marketing operation is organized as
follows.
Figure 25 – Broad Organizational Structure of RPD
Source – See interview schedule for Arpico (A5)
Merchandising
category head
Super centre
operations manager
Other support
functions
Human Resource
manager
Centre manager -
Battaramula
Centre manager - Dehiwala
Centre manager -
HPC
Showroom
manager
Supermarket
manager
• Executives
• Cashiers
• Sales assistants
• workers
Training
manager
Responsible for calculating
the customer satisfaction
index.
Mystery shopper system
Scores are
connected to
staff
incentives
RPD
Market research officer
RPC
Other subsidiaries
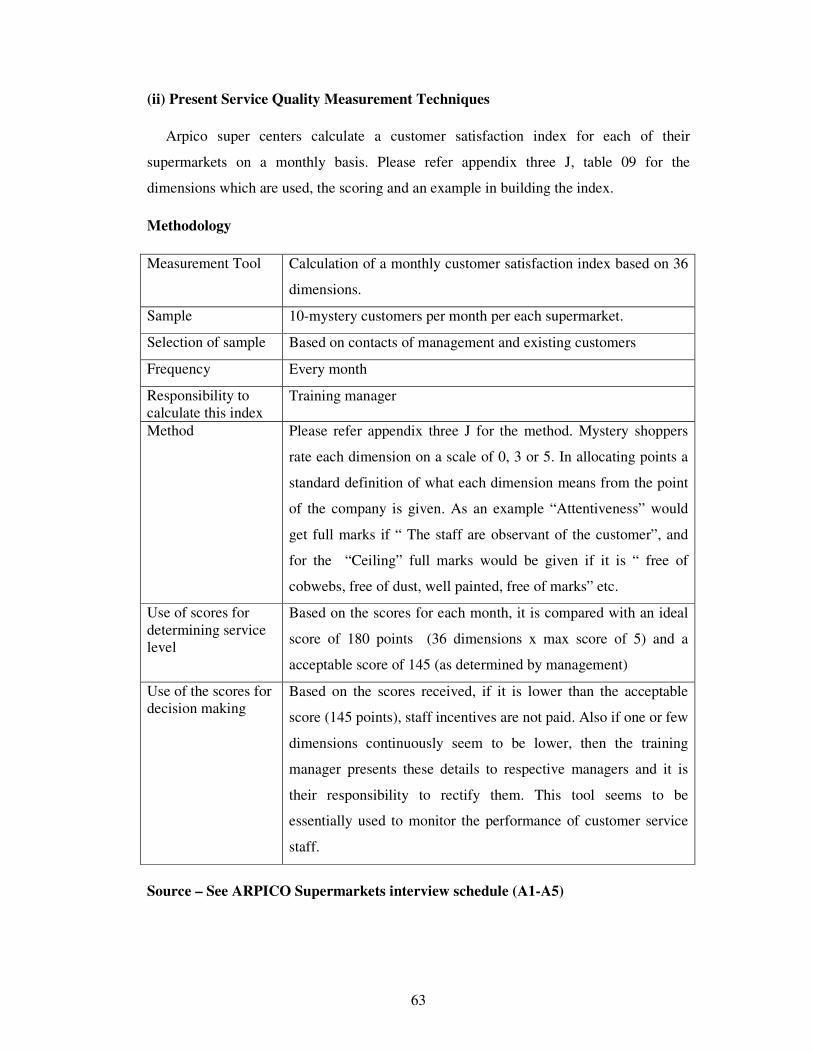
63
(ii) Present Service Quality Measurement Techniques
Arpico super centers calculate a customer satisfaction index for each of their
supermarkets on a monthly basis. Please refer appendix three J, table 09 for the
dimensions which are used, the scoring and an example in building the index.
Methodology
Measurement Tool Calculation of a monthly customer satisfaction index based on 36
dimensions.
Sample 10-mystery customers per month per each supermarket.
Selection of sample Based on contacts of management and existing customers
Frequency Every month
Responsibility to
calculate this index
Training manager
Method Please refer appendix three J for the method. Mystery shoppers
rate each dimension on a scale of 0, 3 or 5. In allocating points a
standard definition of what each dimension means from the point
of the company is given. As an example “Attentiveness” would
get full marks if “ The staff are observant of the customer”, and
for the “Ceiling” full marks would be given if it is “ free of
cobwebs, free of dust, well painted, free of marks” etc.
Use of scores for
determining service
level
Based on the scores for each month, it is compared with an ideal
score of 180 points (36 dimensions x max score of 5) and a
acceptable score of 145 (as determined by management)
Use of the scores for
decision making
Based on the scores received, if it is lower than the acceptable
score (145 points), staff incentives are not paid. Also if one or few
dimensions continuously seem to be lower, then the training
manager presents these details to respective managers and it is
their responsibility to rectify them. This tool seems to be
essentially used to monitor the performance of customer service
staff.
Source – See ARPICO Supermarkets interview schedule (A1-A5)
64
Strengths and weakness of the methodology
Strengths Weakness
The use of an index would give
management insights into the
continuous change in the
performance of service
Although this is called a customer satisfaction
index it only captures the service elements. Thus
will only be a customer service index.
The scores are calculated with the use of 10
mystery shoppers who will not be representative of
the total monthly customer base.
The use of a quantitative measure
and attaching it to performance
gives an idea of the importance the
management has placed in
improving the service dimension of
the supermarkets.
The mystery shoppers provide points based on
definitions given by management on what should
be high/low levels of service quality. At any point
the tool does not check what is important or what
are the expectations of customers. Essentially this
is not a service quality measure but only captures
the perceived performance of what they understand
to be service quality specified by management and
not the customer.
Out of 36 dimensions, 19 aspects falls under the
building and 2 aspects under merchandising which
is not directly under the per view of the
supermarket staff. 21 aspects, which are not part of
their actions, are also taken into consideration in
calculating the index thus in paying incentives.
As a conclusion on the techniques in measuring service quality, ARPICO supermarkets
seem to be using some technique in measuring service dimensions, which is pre
dominantly, used in evaluating the performance of its staff.
(iii) Present Knowledge of the Service Quality Levels
The knowledge of service quality gaps were checked as follows
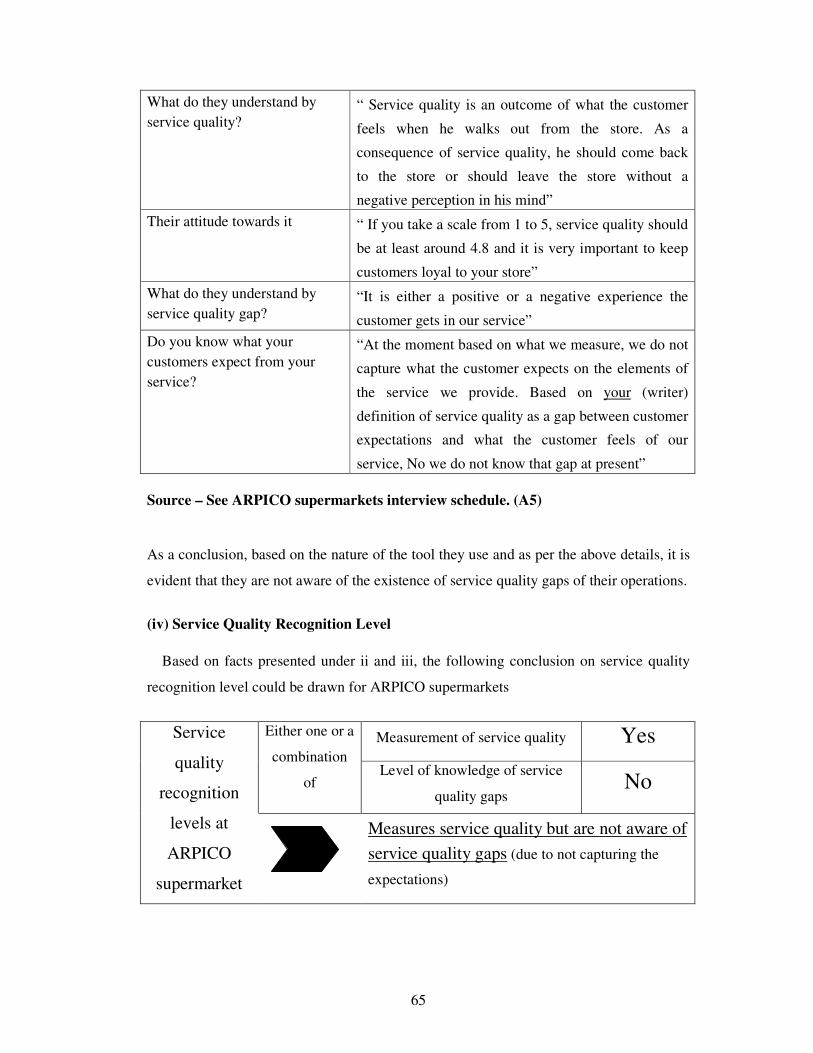
65
What do they understand by
service quality?
“ Service quality is an outcome of what the customer
feels when he walks out from the store. As a
consequence of service quality, he should come back
to the store or should leave the store without a
negative perception in his mind”
Their attitude towards it “ If you take a scale from 1 to 5, service quality should
be at least around 4.8 and it is very important to keep
customers loyal to your store”
What do they understand by
service quality gap?
“It is either a positive or a negative experience the
customer gets in our service”
Do you know what your
customers expect from your
service?
“At the moment based on what we measure, we do not
capture what the customer expects on the elements of
the service we provide. Based on your (writer)
definition of service quality as a gap between customer
expectations and what the customer feels of our
service, No we do not know that gap at present”
Source – See ARPICO supermarkets interview schedule. (A5)
As a conclusion, based on the nature of the tool they use and as per the above details, it is
evident that they are not aware of the existence of service quality gaps of their operations.
(iv) Service Quality Recognition Level
Based on facts presented under ii and iii, the following conclusion on service quality
recognition level could be drawn for ARPICO supermarkets
Service
quality
recognition
levels at
ARPICO
supermarket
Either one or a
combination
of
Measurement of service quality Yes
Level of knowledge of service
quality gaps No
Measures service quality but are not aware of
service quality gaps (due to not capturing the
expectations)
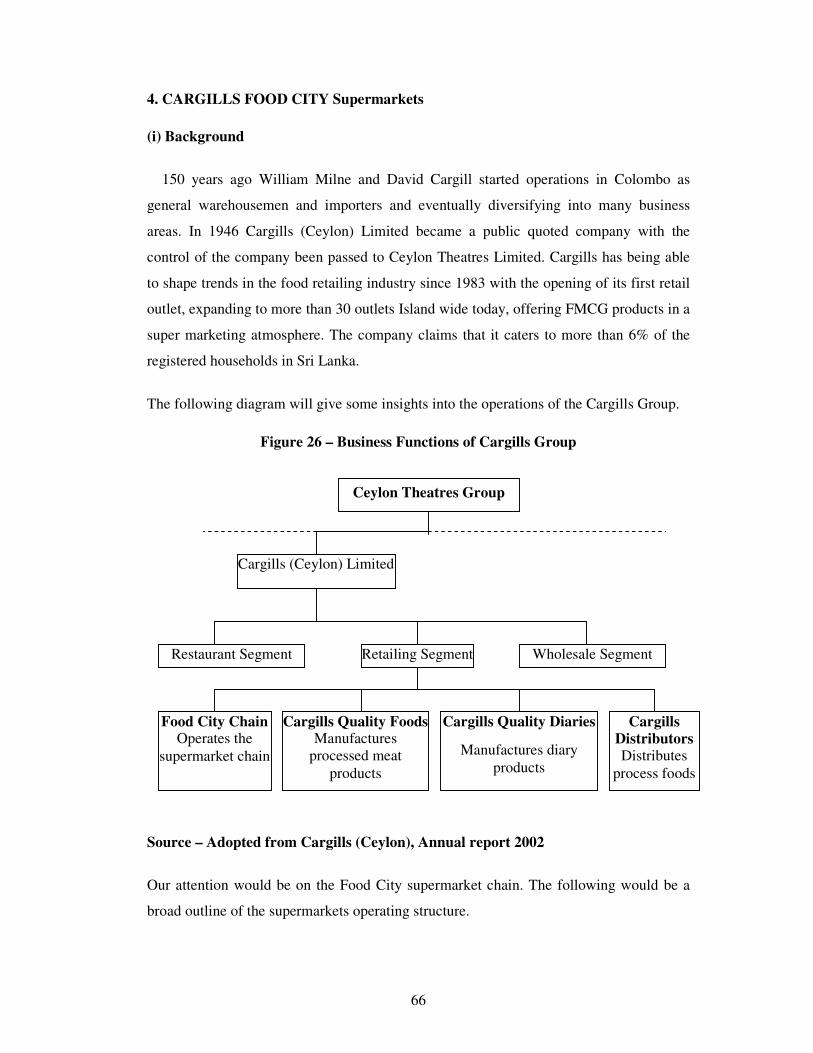
66
4. CARGILLS FOOD CITY Supermarkets
(i) Background
150 years ago William Milne and David Cargill started operations in Colombo as
general warehousemen and importers and eventually diversifying into many business
areas. In 1946 Cargills (Ceylon) Limited became a public quoted company with the
control of the company been passed to Ceylon Theatres Limited. Cargills has being able
to shape trends in the food retailing industry since 1983 with the opening of its first retail
outlet, expanding to more than 30 outlets Island wide today, offering FMCG products in a
super marketing atmosphere. The company claims that it caters to more than 6% of the
registered households in Sri Lanka.
The following diagram will give some insights into the operations of the Cargills Group.
Figure 26 – Business Functions of Cargills Group
Source – Adopted from Cargills (Ceylon), Annual report 2002
Our attention would be on the Food City supermarket chain. The following would be a
broad outline of the supermarkets operating structure.
Ceylon Theatres Group
Cargills (Ceylon) Limited
Food City Chain Operates the
supermarket chain
Cargills Quality Foods Manufactures
processed meat
products
Retailing Segment Restaurant Segment Wholesale Segment
Cargills Quality Diaries
Manufactures diary
products
Cargills
Distributors
Distributes
process foods
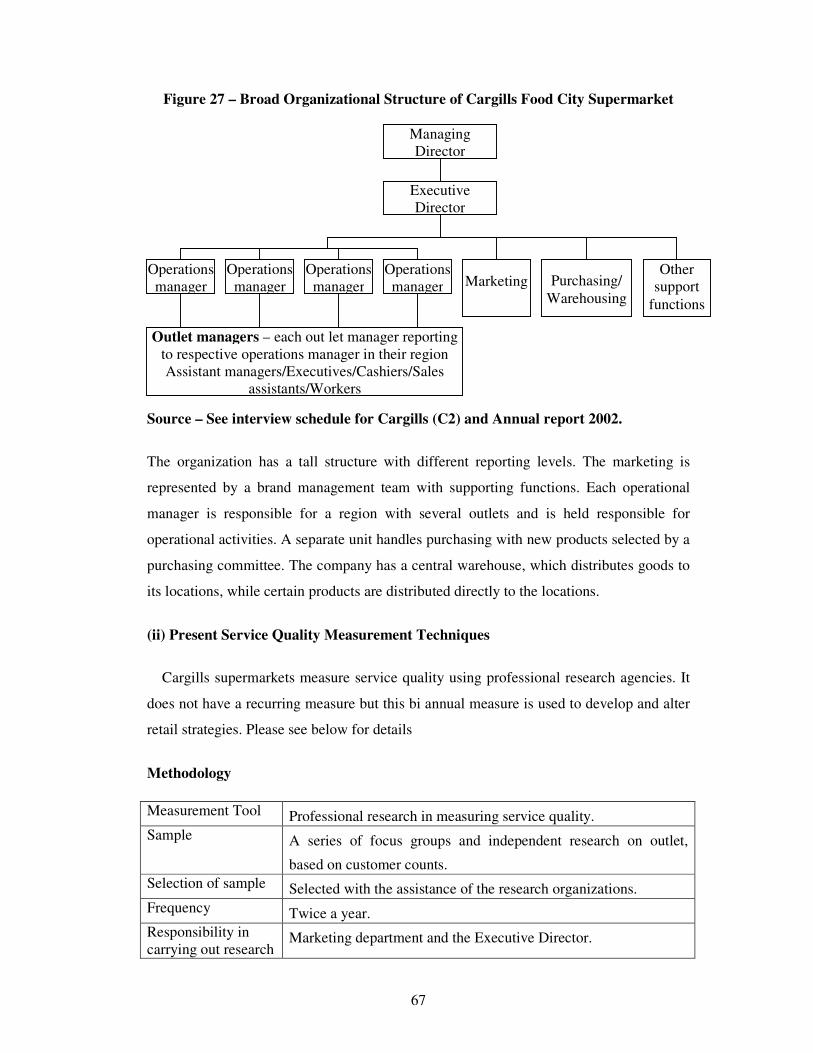
67
Figure 27 – Broad Organizational Structure of Cargills Food City Supermarket
Source – See interview schedule for Cargills (C2) and Annual report 2002.
The organization has a tall structure with different reporting levels. The marketing is
represented by a brand management team with supporting functions. Each operational
manager is responsible for a region with several outlets and is held responsible for
operational activities. A separate unit handles purchasing with new products selected by a
purchasing committee. The company has a central warehouse, which distributes goods to
its locations, while certain products are distributed directly to the locations.
(ii) Present Service Quality Measurement Techniques
Cargills supermarkets measure service quality using professional research agencies. It
does not have a recurring measure but this bi annual measure is used to develop and alter
retail strategies. Please see below for details
Methodology
Measurement Tool Professional research in measuring service quality.
Sample A series of focus groups and independent research on outlet,
based on customer counts.
Selection of sample Selected with the assistance of the research organizations.
Frequency Twice a year.
Responsibility in
carrying out research Marketing department and the Executive Director.
Managing
Director
Executive
Director
Operations
manager
Operations
manager
Operations
manager
Operations
manager
Outlet managers – each out let manager reporting
to respective operations manager in their region
Assistant managers/Executives/Cashiers/Sales
assistants/Workers
Marketing
Purchasing/
Warehousing
Other
support
functions
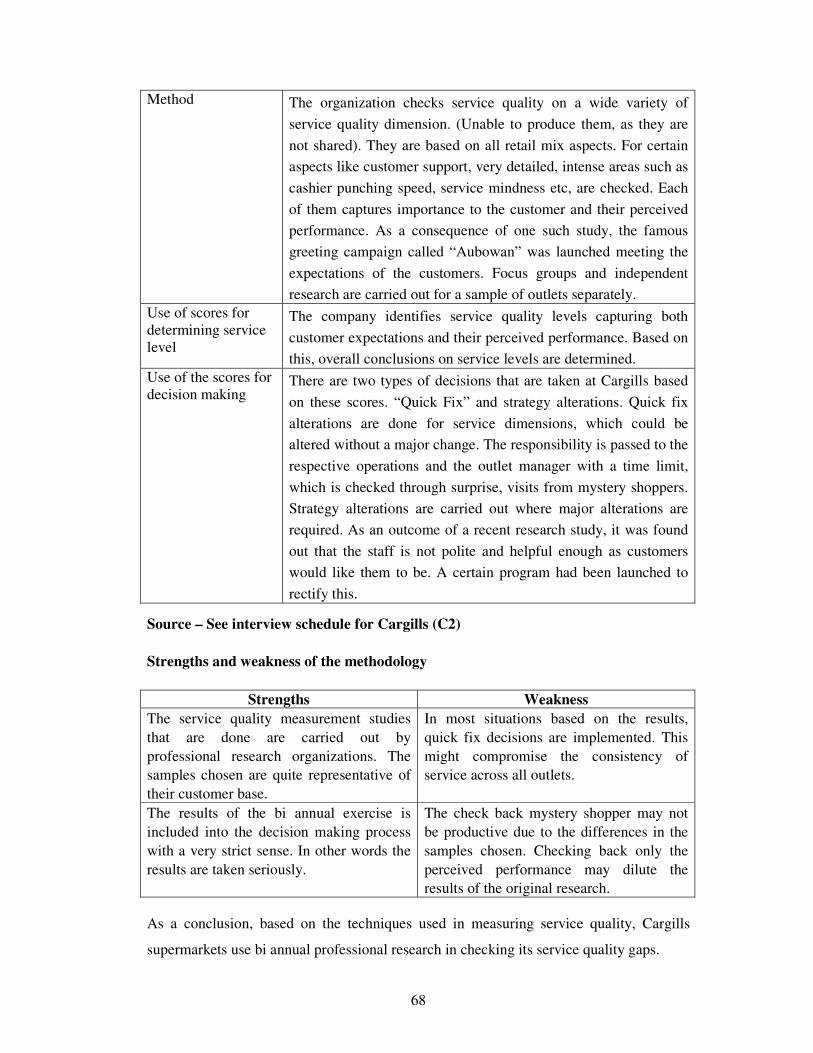
68
Method The organization checks service quality on a wide variety of
service quality dimension. (Unable to produce them, as they are
not shared). They are based on all retail mix aspects. For certain
aspects like customer support, very detailed, intense areas such as
cashier punching speed, service mindness etc, are checked. Each
of them captures importance to the customer and their perceived
performance. As a consequence of one such study, the famous
greeting campaign called “Aubowan” was launched meeting the
expectations of the customers. Focus groups and independent
research are carried out for a sample of outlets separately.
Use of scores for
determining service
level
The company identifies service quality levels capturing both
customer expectations and their perceived performance. Based on
this, overall conclusions on service levels are determined.
Use of the scores for
decision making There are two types of decisions that are taken at Cargills based
on these scores. “Quick Fix” and strategy alterations. Quick fix
alterations are done for service dimensions, which could be
altered without a major change. The responsibility is passed to the
respective operations and the outlet manager with a time limit,
which is checked through surprise, visits from mystery shoppers.
Strategy alterations are carried out where major alterations are
required. As an outcome of a recent research study, it was found
out that the staff is not polite and helpful enough as customers
would like them to be. A certain program had been launched to
rectify this.
Source – See interview schedule for Cargills (C2)
Strengths and weakness of the methodology
Strengths Weakness
The service quality measurement studies
that are done are carried out by
professional research organizations. The
samples chosen are quite representative of
their customer base.
In most situations based on the results,
quick fix decisions are implemented. This
might compromise the consistency of
service across all outlets.
The results of the bi annual exercise is
included into the decision making process
with a very strict sense. In other words the
results are taken seriously.
The check back mystery shopper may not
be productive due to the differences in the
samples chosen. Checking back only the
perceived performance may dilute the
results of the original research.
As a conclusion, based on the techniques used in measuring service quality, Cargills
supermarkets use bi annual professional research in checking its service quality gaps.
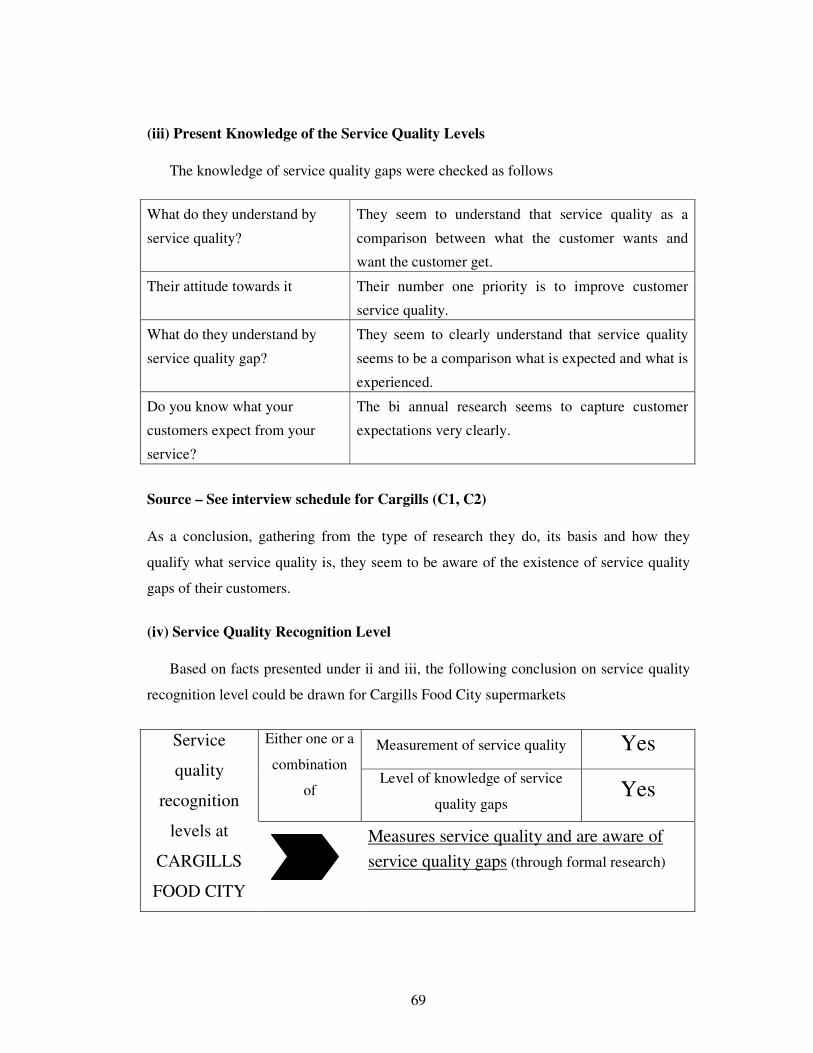
69
(iii) Present Knowledge of the Service Quality Levels
The knowledge of service quality gaps were checked as follows
What do they understand by
service quality?
They seem to understand that service quality as a
comparison between what the customer wants and
want the customer get.
Their attitude towards it Their number one priority is to improve customer
service quality.
What do they understand by
service quality gap?
They seem to clearly understand that service quality
seems to be a comparison what is expected and what is
experienced.
Do you know what your
customers expect from your
service?
The bi annual research seems to capture customer
expectations very clearly.
Source – See interview schedule for Cargills (C1, C2)
As a conclusion, gathering from the type of research they do, its basis and how they
qualify what service quality is, they seem to be aware of the existence of service quality
gaps of their customers.
(iv) Service Quality Recognition Level
Based on facts presented under ii and iii, the following conclusion on service quality
recognition level could be drawn for Cargills Food City supermarkets
Service
quality
recognition
levels at
CARGILLS
FOOD CITY
Either one or a
combination
of
Measurement of service quality Yes
Level of knowledge of service
quality gaps Yes
Measures service quality and are aware of
service quality gaps (through formal research)
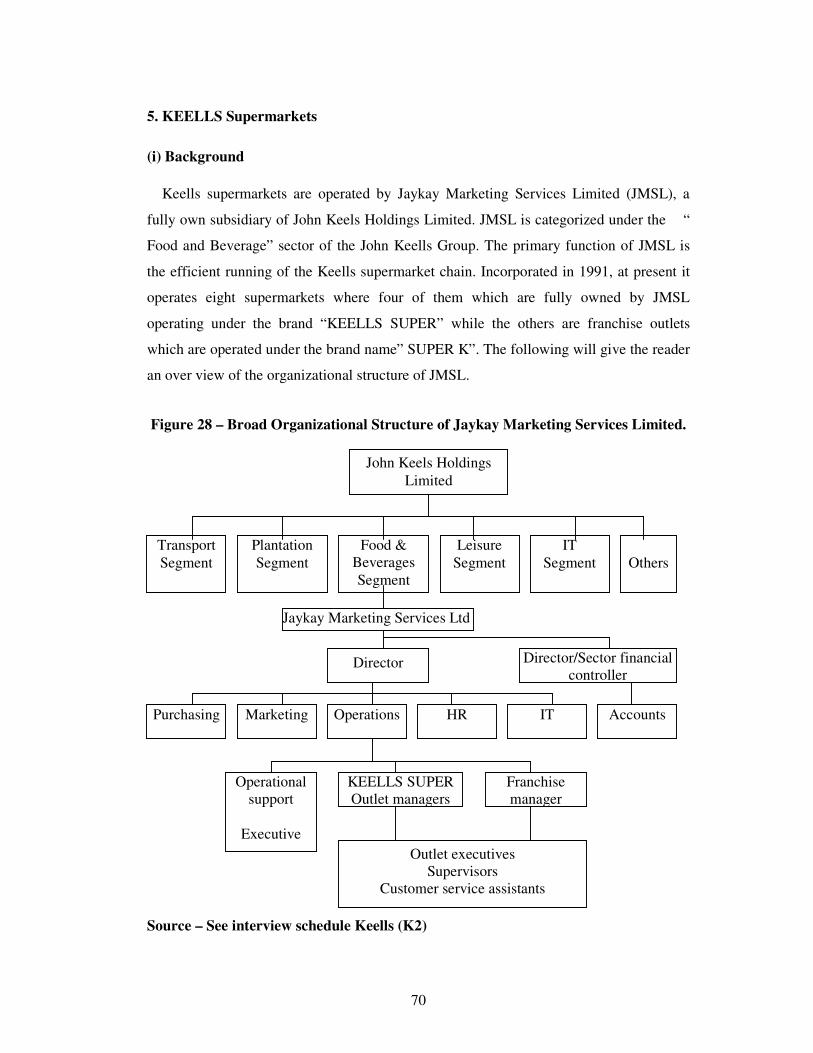
70
5. KEELLS Supermarkets
(i) Background
Keells supermarkets are operated by Jaykay Marketing Services Limited (JMSL), a
fully own subsidiary of John Keels Holdings Limited. JMSL is categorized under the “
Food and Beverage” sector of the John Keells Group. The primary function of JMSL is
the efficient running of the Keells supermarket chain. Incorporated in 1991, at present it
operates eight supermarkets where four of them which are fully owned by JMSL
operating under the brand “KEELLS SUPER” while the others are franchise outlets
which are operated under the brand name” SUPER K”. The following will give the reader
an over view of the organizational structure of JMSL.
Figure 28 – Broad Organizational Structure of Jaykay Marketing Services Limited.
Source – See interview schedule Keells (K2)
John Keels Holdings
Limited
Transport
Segment
Plantation
Segment
Leisure
Segment
Food &
Beverages
Segment
IT
Segment
Others
Jaykay Marketing Services Ltd
Director Director/Sector financial
controller
Purchasing Marketing Operations HR IT Accounts
Franchise
manager
KEELLS SUPER
Outlet managers
Operational
support
Executive
Outlet executives
Supervisors
Customer service assistants
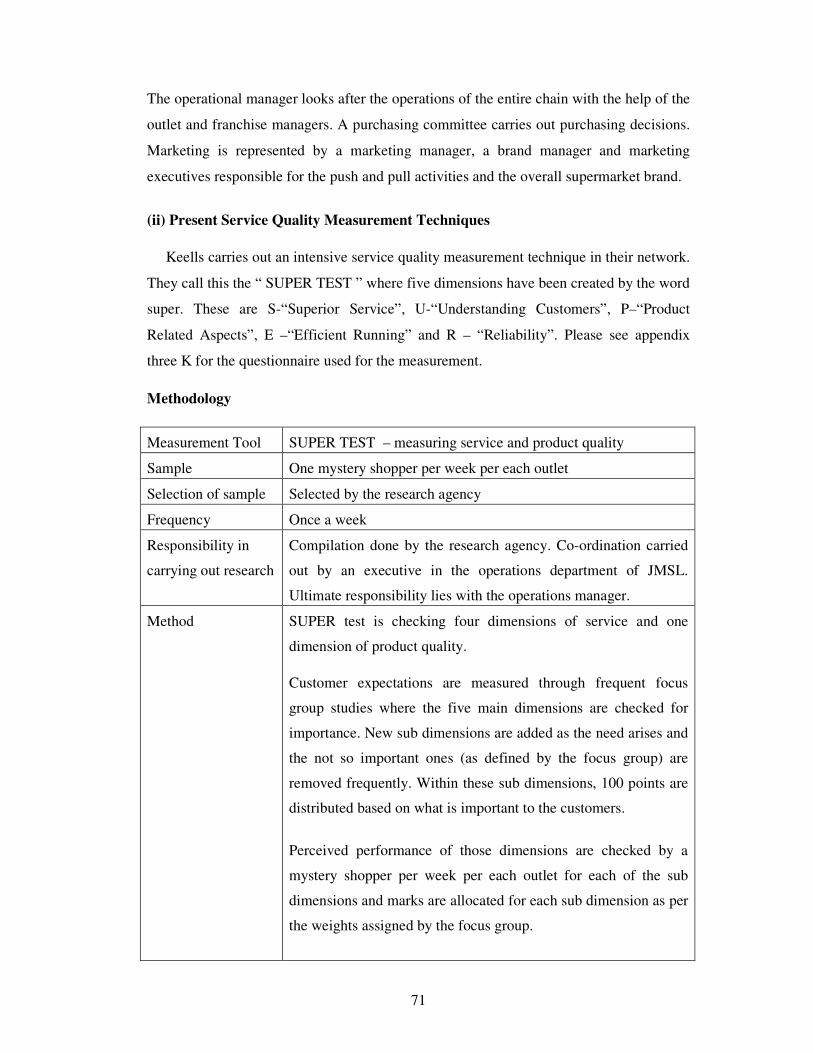
71
The operational manager looks after the operations of the entire chain with the help of the
outlet and franchise managers. A purchasing committee carries out purchasing decisions.
Marketing is represented by a marketing manager, a brand manager and marketing
executives responsible for the push and pull activities and the overall supermarket brand.
(ii) Present Service Quality Measurement Techniques
Keells carries out an intensive service quality measurement technique in their network.
They call this the “ SUPER TEST ” where five dimensions have been created by the word
super. These are S-“Superior Service”, U-“Understanding Customers”, P–“Product
Related Aspects”, E –“Efficient Running” and R – “Reliability”. Please see appendix
three K for the questionnaire used for the measurement.
Methodology
Measurement Tool SUPER TEST – measuring service and product quality
Sample One mystery shopper per week per each outlet
Selection of sample Selected by the research agency
Frequency Once a week
Responsibility in
carrying out research
Compilation done by the research agency. Co-ordination carried
out by an executive in the operations department of JMSL.
Ultimate responsibility lies with the operations manager.
Method SUPER test is checking four dimensions of service and one
dimension of product quality.
Customer expectations are measured through frequent focus
group studies where the five main dimensions are checked for
importance. New sub dimensions are added as the need arises and
the not so important ones (as defined by the focus group) are
removed frequently. Within these sub dimensions, 100 points are
distributed based on what is important to the customers.
Perceived performance of those dimensions are checked by a
mystery shopper per week per each outlet for each of the sub
dimensions and marks are allocated for each sub dimension as per
the weights assigned by the focus group.
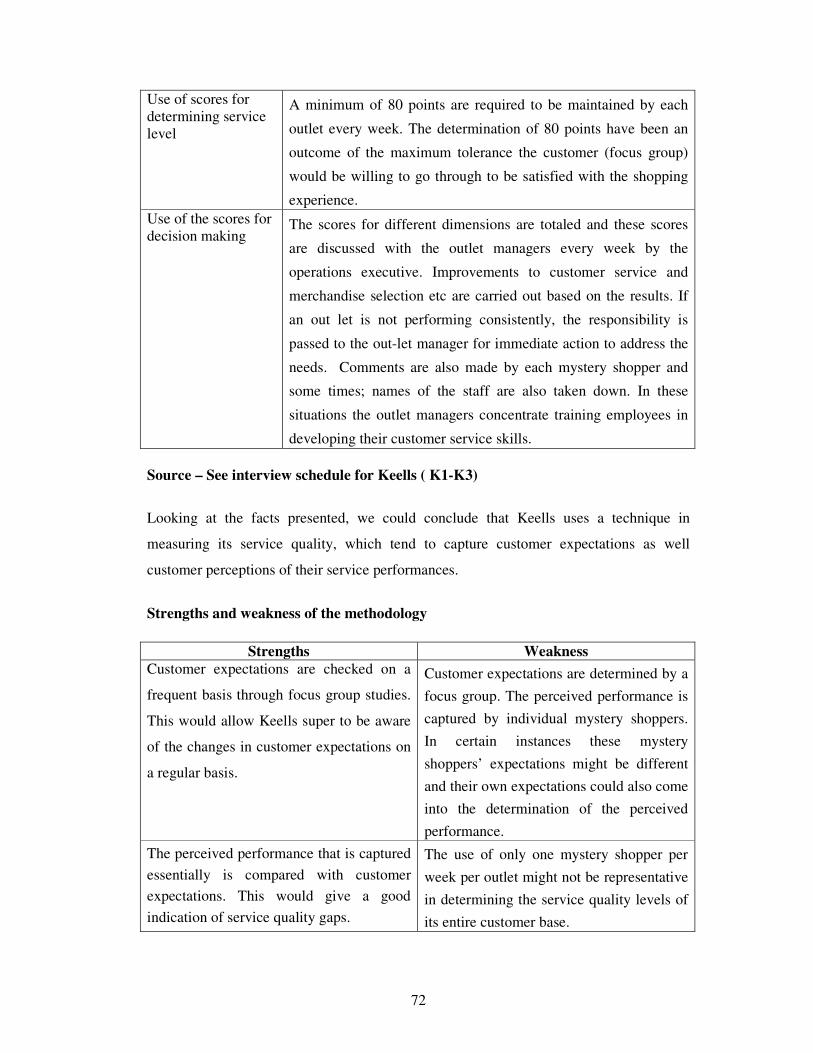
72
Use of scores for
determining service
level
A minimum of 80 points are required to be maintained by each
outlet every week. The determination of 80 points have been an
outcome of the maximum tolerance the customer (focus group)
would be willing to go through to be satisfied with the shopping
experience.
Use of the scores for
decision making
The scores for different dimensions are totaled and these scores
are discussed with the outlet managers every week by the
operations executive. Improvements to customer service and
merchandise selection etc are carried out based on the results. If
an out let is not performing consistently, the responsibility is
passed to the out-let manager for immediate action to address the
needs. Comments are also made by each mystery shopper and
some times; names of the staff are also taken down. In these
situations the outlet managers concentrate training employees in
developing their customer service skills.
Source – See interview schedule for Keells ( K1-K3)
Looking at the facts presented, we could conclude that Keells uses a technique in
measuring its service quality, which tend to capture customer expectations as well
customer perceptions of their service performances.
Strengths and weakness of the methodology
Strengths Weakness
Customer expectations are checked on a
frequent basis through focus group studies.
This would allow Keells super to be aware
of the changes in customer expectations on
a regular basis.
Customer expectations are determined by a
focus group. The perceived performance is
captured by individual mystery shoppers.
In certain instances these mystery
shoppers’ expectations might be different
and their own expectations could also come
into the determination of the perceived
performance.
The perceived performance that is captured
essentially is compared with customer
expectations. This would give a good
indication of service quality gaps.
The use of only one mystery shopper per
week per outlet might not be representative
in determining the service quality levels of
its entire customer base.
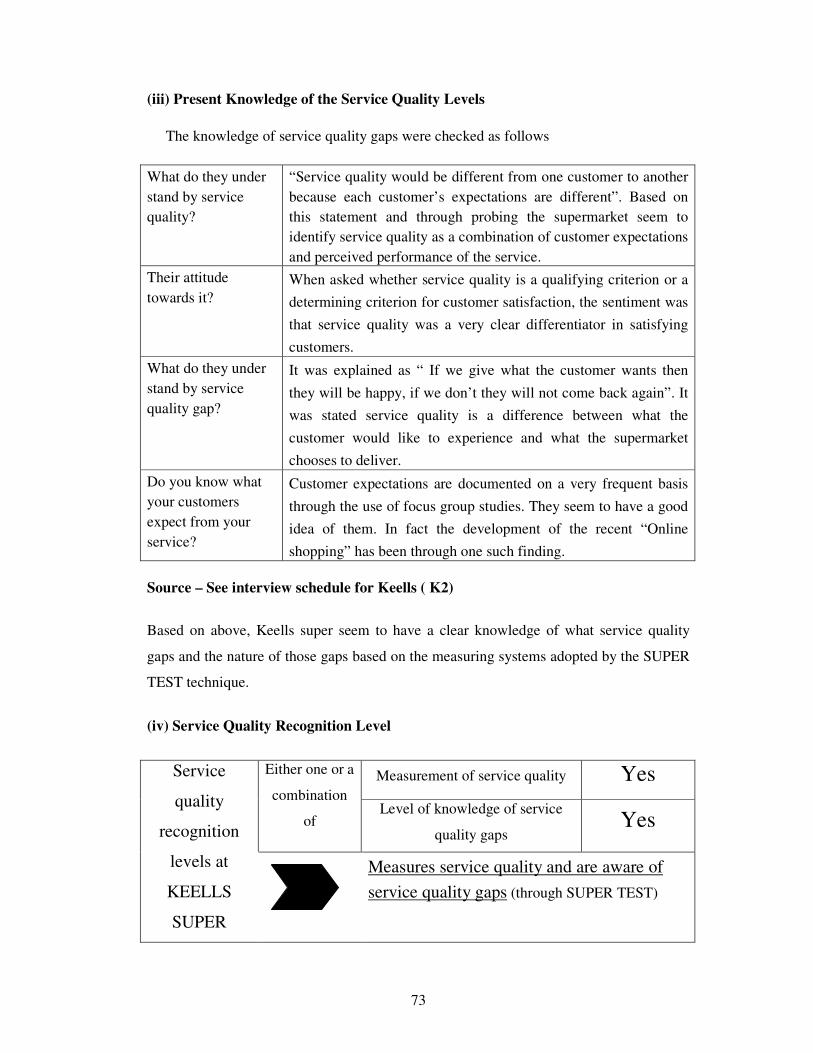
73
(iii) Present Knowledge of the Service Quality Levels
The knowledge of service quality gaps were checked as follows
What do they under
stand by service
quality?
“Service quality would be different from one customer to another
because each customer’s expectations are different”. Based on
this statement and through probing the supermarket seem to
identify service quality as a combination of customer expectations
and perceived performance of the service.
Their attitude
towards it?
When asked whether service quality is a qualifying criterion or a
determining criterion for customer satisfaction, the sentiment was
that service quality was a very clear differentiator in satisfying
customers.
What do they under
stand by service
quality gap?
It was explained as “ If we give what the customer wants then
they will be happy, if we don’t they will not come back again”. It
was stated service quality is a difference between what the
customer would like to experience and what the supermarket
chooses to deliver.
Do you know what
your customers
expect from your
service?
Customer expectations are documented on a very frequent basis
through the use of focus group studies. They seem to have a good
idea of them. In fact the development of the recent “Online
shopping” has been through one such finding.
Source – See interview schedule for Keells ( K2)
Based on above, Keells super seem to have a clear knowledge of what service quality
gaps and the nature of those gaps based on the measuring systems adopted by the SUPER
TEST technique.
(iv) Service Quality Recognition Level
Service
quality
recognition
levels at
KEELLS
SUPER
Either one or a
combination
of
Measurement of service quality Yes
Level of knowledge of service
quality gaps Yes
Measures service quality and are aware of
service quality gaps (through SUPER TEST)
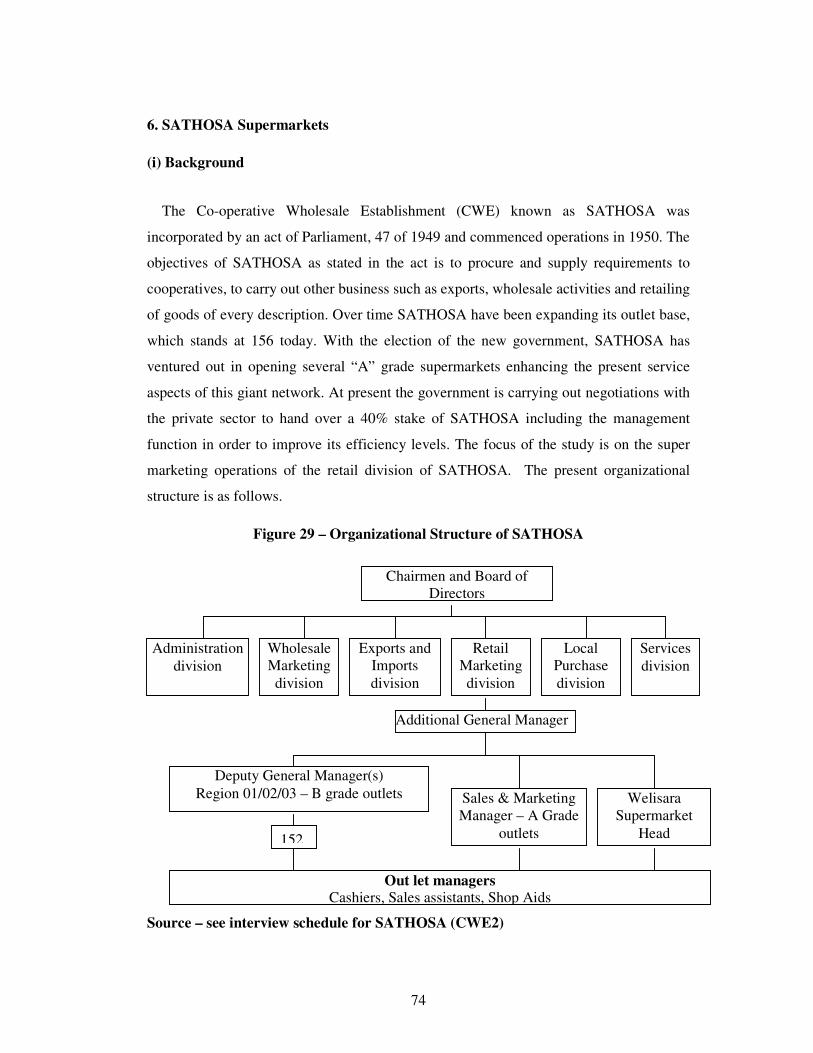
74
6. SATHOSA Supermarkets
(i) Background
The Co-operative Wholesale Establishment (CWE) known as SATHOSA was
incorporated by an act of Parliament, 47 of 1949 and commenced operations in 1950. The
objectives of SATHOSA as stated in the act is to procure and supply requirements to
cooperatives, to carry out other business such as exports, wholesale activities and retailing
of goods of every description. Over time SATHOSA have been expanding its outlet base,
which stands at 156 today. With the election of the new government, SATHOSA has
ventured out in opening several “A” grade supermarkets enhancing the present service
aspects of this giant network. At present the government is carrying out negotiations with
the private sector to hand over a 40% stake of SATHOSA including the management
function in order to improve its efficiency levels. The focus of the study is on the super
marketing operations of the retail division of SATHOSA. The present organizational
structure is as follows.
Figure 29 – Organizational Structure of SATHOSA
Source – see interview schedule for SATHOSA (CWE2)
Chairmen and Board of
Directors
Administration
division
Retail
Marketing
division
Wholesale
Marketing
division
Exports and
Imports
division
Local
Purchase
division
Services
division
Additional General Manager
Deputy General Manager(s)
Region 01/02/03 – B grade outlets Welisara
Supermarket
Head
Sales & Marketing
Manager – A Grade
outlets
Out let managers
Cashiers, Sales assistants, Shop Aids
152
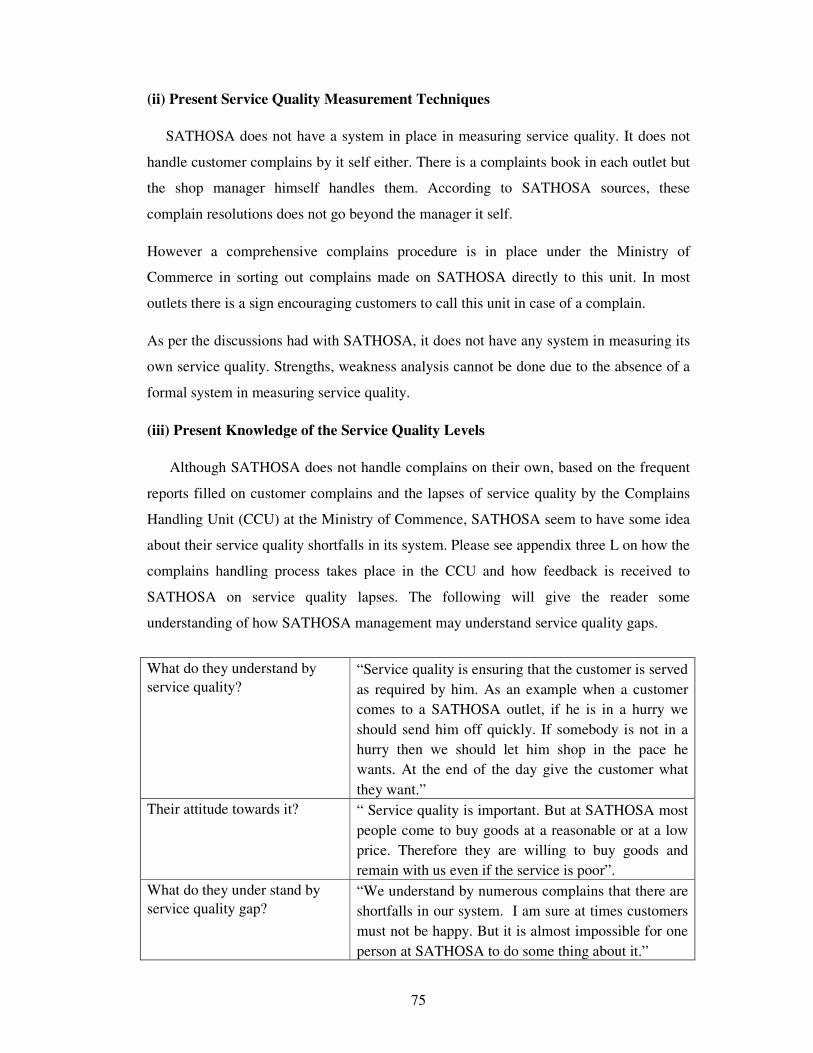
75
(ii) Present Service Quality Measurement Techniques
SATHOSA does not have a system in place in measuring service quality. It does not
handle customer complains by it self either. There is a complaints book in each outlet but
the shop manager himself handles them. According to SATHOSA sources, these
complain resolutions does not go beyond the manager it self.
However a comprehensive complains procedure is in place under the Ministry of
Commerce in sorting out complains made on SATHOSA directly to this unit. In most
outlets there is a sign encouraging customers to call this unit in case of a complain.
As per the discussions had with SATHOSA, it does not have any system in measuring its
own service quality. Strengths, weakness analysis cannot be done due to the absence of a
formal system in measuring service quality.
(iii) Present Knowledge of the Service Quality Levels
Although SATHOSA does not handle complains on their own, based on the frequent
reports filled on customer complains and the lapses of service quality by the Complains
Handling Unit (CCU) at the Ministry of Commence, SATHOSA seem to have some idea
about their service quality shortfalls in its system. Please see appendix three L on how the
complains handling process takes place in the CCU and how feedback is received to
SATHOSA on service quality lapses. The following will give the reader some
understanding of how SATHOSA management may understand service quality gaps.
What do they understand by
service quality?
“Service quality is ensuring that the customer is served
as required by him. As an example when a customer
comes to a SATHOSA outlet, if he is in a hurry we
should send him off quickly. If somebody is not in a
hurry then we should let him shop in the pace he
wants. At the end of the day give the customer what
they want.”
Their attitude towards it? “ Service quality is important. But at SATHOSA most
people come to buy goods at a reasonable or at a low
price. Therefore they are willing to buy goods and
remain with us even if the service is poor”.
What do they under stand by
service quality gap?
“We understand by numerous complains that there are
shortfalls in our system. I am sure at times customers
must not be happy. But it is almost impossible for one
person at SATHOSA to do some thing about it.”
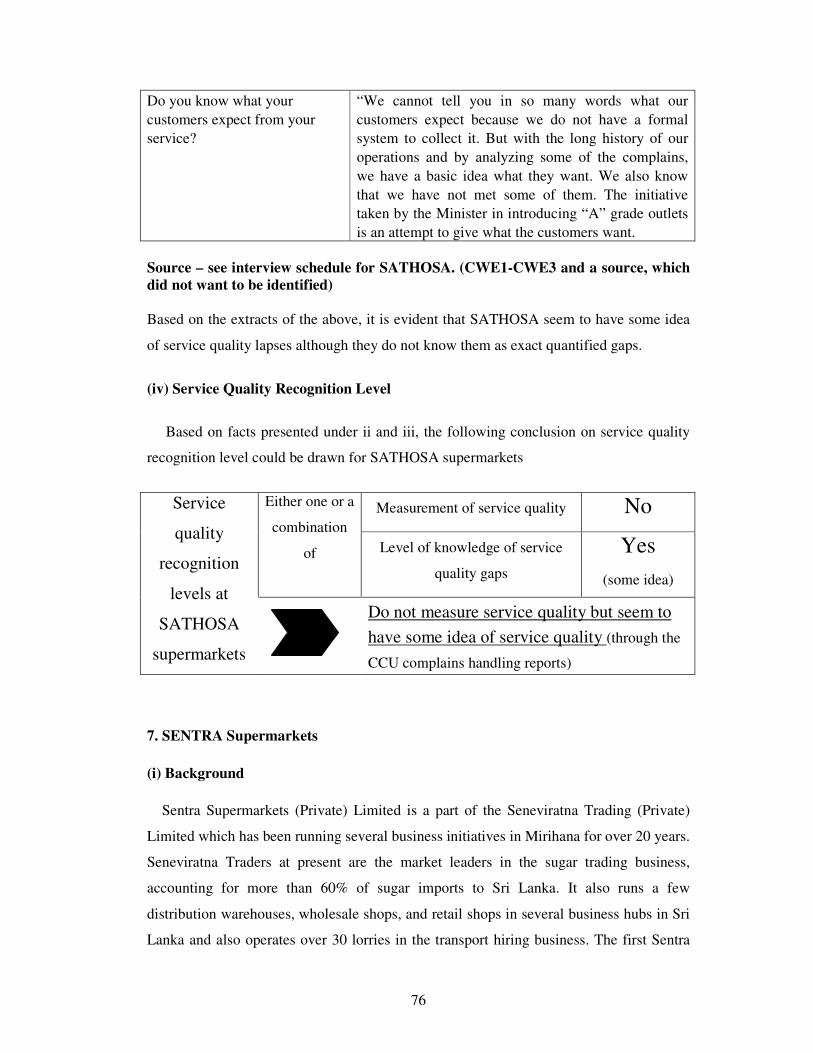
76
Do you know what your
customers expect from your
service?
“We cannot tell you in so many words what our
customers expect because we do not have a formal
system to collect it. But with the long history of our
operations and by analyzing some of the complains,
we have a basic idea what they want. We also know
that we have not met some of them. The initiative
taken by the Minister in introducing “A” grade outlets
is an attempt to give what the customers want.
Source – see interview schedule for SATHOSA. (CWE1-CWE3 and a source, which
did not want to be identified)
Based on the extracts of the above, it is evident that SATHOSA seem to have some idea
of service quality lapses although they do not know them as exact quantified gaps.
(iv) Service Quality Recognition Level
Based on facts presented under ii and iii, the following conclusion on service quality
recognition level could be drawn for SATHOSA supermarkets
Service
quality
recognition
levels at
SATHOSA
supermarkets
Either one or a
combination
of
Measurement of service quality No
Level of knowledge of service
quality gaps
Yes
(some idea)
Do not measure service quality but seem to
have some idea of service quality (through the
CCU complains handling reports)
7. SENTRA Supermarkets
(i) Background
Sentra Supermarkets (Private) Limited is a part of the Seneviratna Trading (Private)
Limited which has been running several business initiatives in Mirihana for over 20 years.
Seneviratna Traders at present are the market leaders in the sugar trading business,
accounting for more than 60% of sugar imports to Sri Lanka. It also runs a few
distribution warehouses, wholesale shops, and retail shops in several business hubs in Sri
Lanka and also operates over 30 lorries in the transport hiring business. The first Sentra
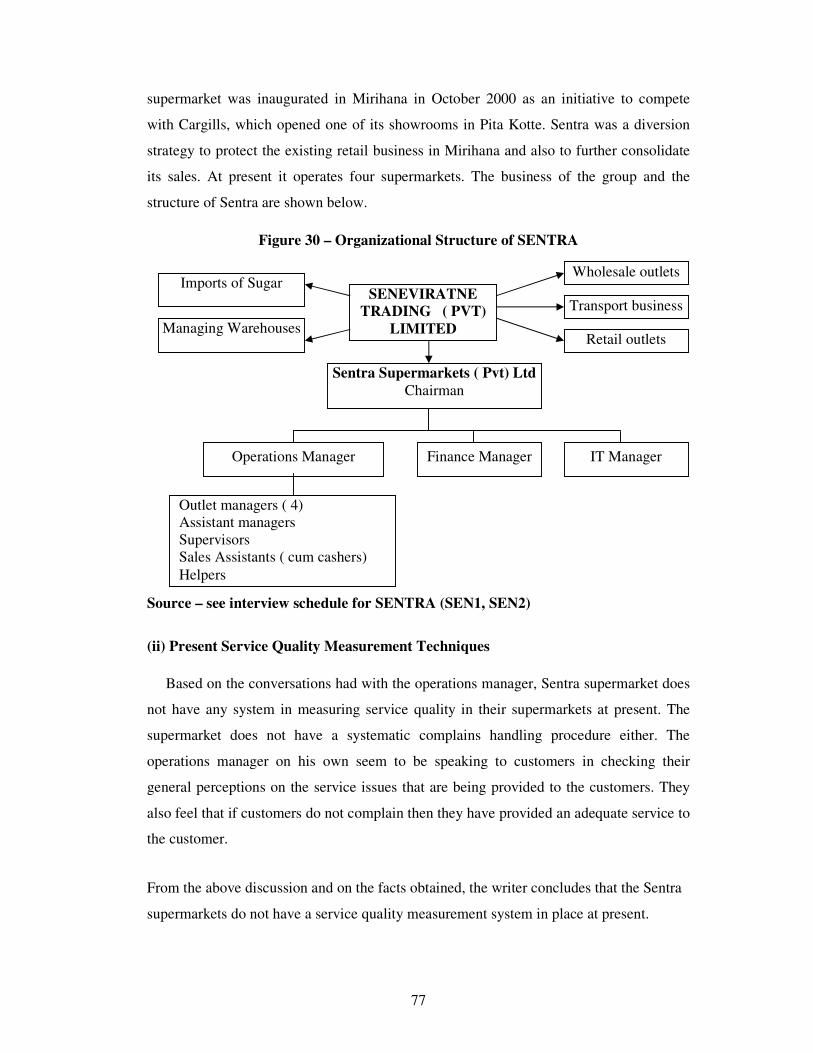
77
supermarket was inaugurated in Mirihana in October 2000 as an initiative to compete
with Cargills, which opened one of its showrooms in Pita Kotte. Sentra was a diversion
strategy to protect the existing retail business in Mirihana and also to further consolidate
its sales. At present it operates four supermarkets. The business of the group and the
structure of Sentra are shown below.
Figure 30 – Organizational Structure of SENTRA
Source – see interview schedule for SENTRA (SEN1, SEN2)
(ii) Present Service Quality Measurement Techniques
Based on the conversations had with the operations manager, Sentra supermarket does
not have any system in measuring service quality in their supermarkets at present. The
supermarket does not have a systematic complains handling procedure either. The
operations manager on his own seem to be speaking to customers in checking their
general perceptions on the service issues that are being provided to the customers. They
also feel that if customers do not complain then they have provided an adequate service to
the customer.
From the above discussion and on the facts obtained, the writer concludes that the Sentra
supermarkets do not have a service quality measurement system in place at present.
SENEVIRATNE
TRADING ( PVT)
LIMITED
Sentra Supermarkets ( Pvt) Ltd
Chairman
Imports of Sugar
Managing Warehouses
Wholesale outlets
Retail outlets
Transport business
Operations Manager Finance Manager IT Manager
Outlet managers ( 4)
Assistant managers
Supervisors
Sales Assistants ( cum cashers)
Helpers
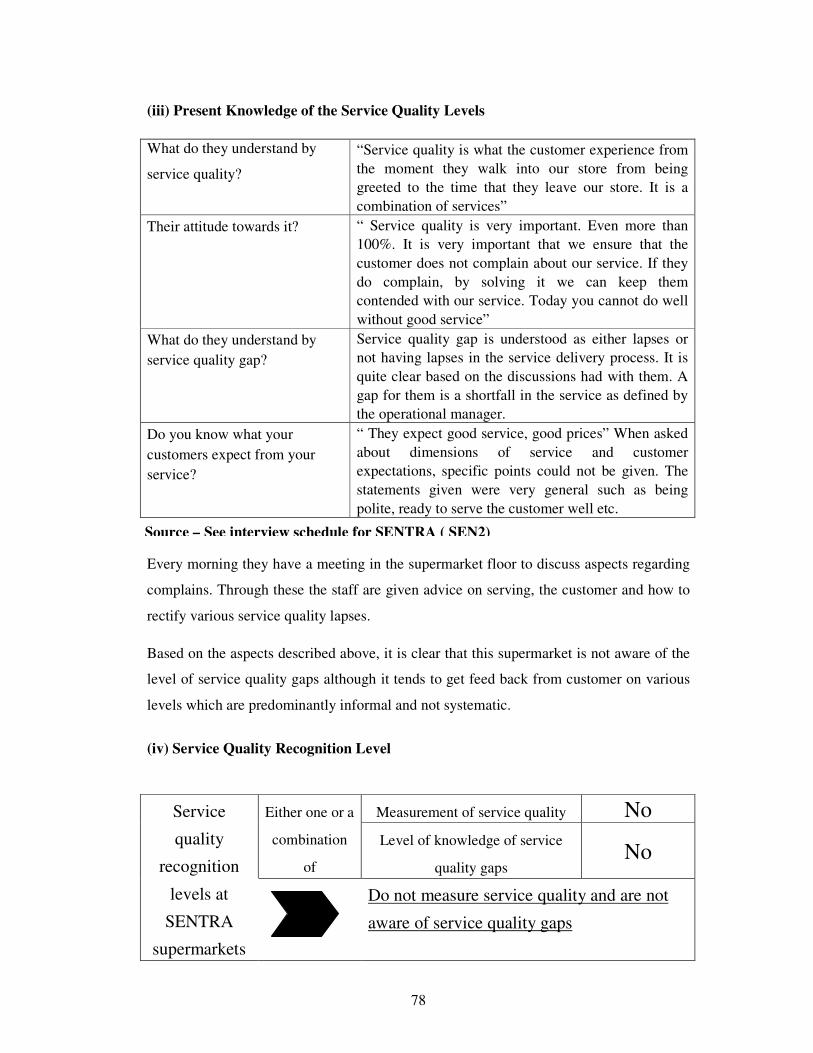
78
(iii) Present Knowledge of the Service Quality Levels
What do they understand by
service quality?
“Service quality is what the customer experience from
the moment they walk into our store from being
greeted to the time that they leave our store. It is a
combination of services”
Their attitude towards it? “ Service quality is very important. Even more than
100%. It is very important that we ensure that the
customer does not complain about our service. If they
do complain, by solving it we can keep them
contended with our service. Today you cannot do well
without good service”
What do they understand by
service quality gap?
Service quality gap is understood as either lapses or
not having lapses in the service delivery process. It is
quite clear based on the discussions had with them. A
gap for them is a shortfall in the service as defined by
the operational manager.
Do you know what your
customers expect from your
service?
“ They expect good service, good prices” When asked
about dimensions of service and customer
expectations, specific points could not be given. The
statements given were very general such as being
polite, ready to serve the customer well etc.
Every morning they have a meeting in the supermarket floor to discuss aspects regarding
complains. Through these the staff are given advice on serving, the customer and how to
rectify various service quality lapses.
Based on the aspects described above, it is clear that this supermarket is not aware of the
level of service quality gaps although it tends to get feed back from customer on various
levels which are predominantly informal and not systematic.
(iv) Service Quality Recognition Level
Service
quality
recognition
levels at
SENTRA
supermarkets
Either one or a
combination
of
Measurement of service quality No
Level of knowledge of service
quality gaps No
Do not measure service quality and are not
aware of service quality gaps
Source – See interview schedule for SENTRA ( SEN2)
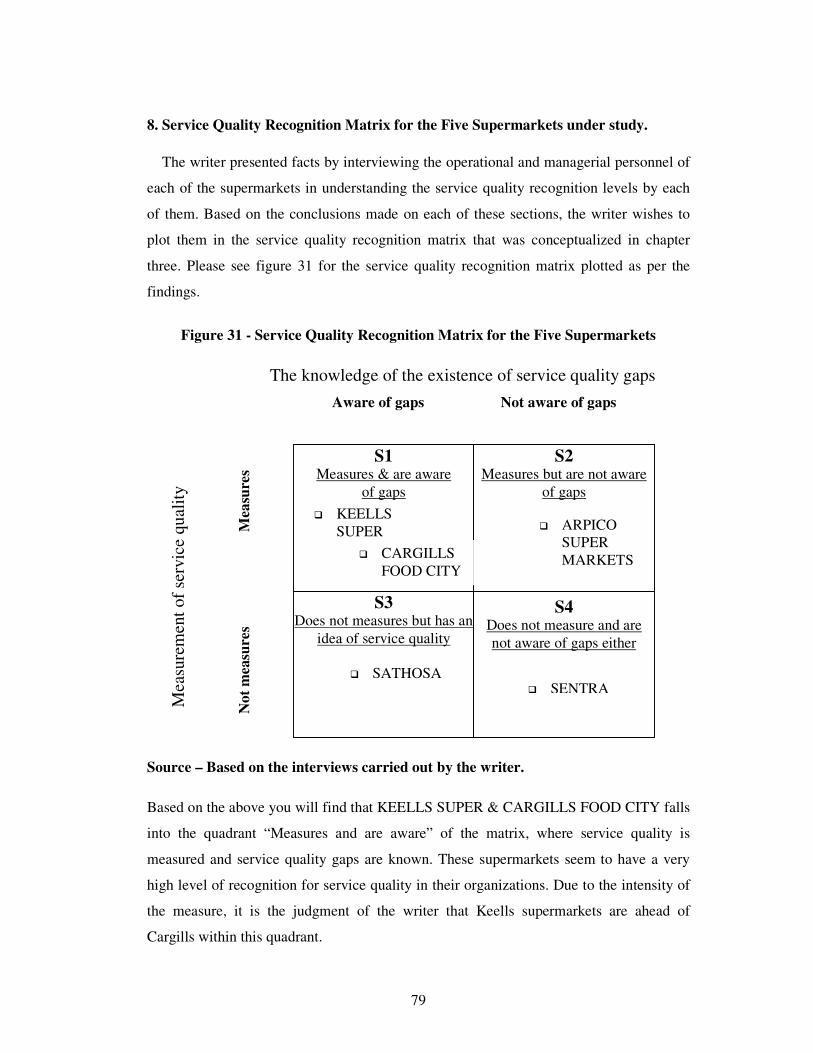
79
8. Service Quality Recognition Matrix for the Five Supermarkets under study.
The writer presented facts by interviewing the operational and managerial personnel of
each of the supermarkets in understanding the service quality recognition levels by each
of them. Based on the conclusions made on each of these sections, the writer wishes to
plot them in the service quality recognition matrix that was conceptualized in chapter
three. Please see figure 31 for the service quality recognition matrix plotted as per the
findings.
Figure 31 - Service Quality Recognition Matrix for the Five Supermarkets
Source – Based on the interviews carried out by the writer.
Based on the above you will find that KEELLS SUPER & CARGILLS FOOD CITY falls
into the quadrant “Measures and are aware” of the matrix, where service quality is
measured and service quality gaps are known. These supermarkets seem to have a very
high level of recognition for service quality in their organizations. Due to the intensity of
the measure, it is the judgment of the writer that Keells supermarkets are ahead of
Cargills within this quadrant.
The knowledge of the existence of service quality gaps
Mea
sure
men
t of
serv
ice
qu
alit
y
Aware of gaps Not aware of gaps
Mea
sure
s
No
t m
easu
res
S1 Measures & are aware
of gaps
S2 Measures but are not aware
of gaps
S3 Does not measures but has an
idea of service quality
S4 Does not measure and are
not aware of gaps either
� KEELLS
SUPER
� CARGILLS
FOOD CITY
� SATHOSA
� ARPICO
SUPER
MARKETS
� SENTRA

80
ARPICO supermarkets fall into the quadrant “ measures but are not aware ” based on the
facts received during the interviews. Here although they have a good measurement
technique, it does not lead to the identification of service quality gaps, as they do not
capture the customer expectations, which is an essential element of service quality. So the
recognition level of service quality is lower.
SATHOSA supermarkets fall into the quadrant “ does not measure but are aware of
service quality” based on the facts revealed during the study. Here we found that although
SATHOSA does not measure service quality in any form, through its existing customer
complains procedures, they seem to be aware that there is a shortfall in their service when
comparing with their customer expectations. However due to the lack of a measurement
they would not know the extent of this gap. Their recognition level is low.
Finally SENTRA supermarkets fall into the quadrant “ does not measure and does not
know” based on the facts presented above. Here the supermarket does not seem to know
the existence of service quality gaps as well as they do not follow any method either to
measure it. The supermarkets service quality recognition seems to be low.
9. Summary
In this Chapter the writer attempted to find out the present service quality recognition
levels in the five supermarkets that were studied. Based on the interviews carried out by
the writer, the five supermarkets were plotted into the service quantity matrix that was
conceptualized by the writer. The findings suggested that two supermarkets were in the
high recognition category while the balance three was in the lower recognition category.
With the conclusion of this chapter, the first objective set for this study was achieved
which tried to understand the present service quality recognition levels of supermarkets
selling FMCG products in Sri Lanka
In the following chapter, the writer will empirically validate the hypothesis presented
elaborating the relationship between service quality recognition levels of supermarkets in
the four quadrants of the matrix and their customer satisfaction levels leading to
conclusions.
81
Chapter V
ANALYSIS OF DATA AND DISCUSSION OF FINDINGS
1. Introduction
In the last chapter, the writer categorized the five supermarkets under study into four
quadrants of the service quality recognition matrix as conceptualised by the writer. In this
chapter the writer would present data, obtained through the questionnaire survey carried
out for each supermarket representing each of the quadrants in the matrix.
The writer has attempted to identify relationships as suggested by data with the use of
various statistical analyses such as correlation, significance of correlation, determination
of the correlation, multiple regression analysis and hypotheses testing. The relationships
as suggested by data seem to shed light on important conclusions between satisfaction
with service quality, product quality and prices paid in influencing the overall
satisfaction in shopping in supermarkets.
2. Target Market Profile of the Sample for each Supermarket.
In understanding the relationships as suggested by data, the profile of the target market
is analysed under the following demographic factors. The reader is requested to refer to
respective appendices for results.
(i) Frequency of visits of the respondents (Appendix four A)
(ii) Gender breakdown of the respondents(Appendix four B)
(iii) Marital status of the respondents (Appendix four C)
(iv) Age break down of the respondents(Appendix four D)
(v) Household income breakdown of the respondents (Appendix four E)
(i) Frequency of Visits to the Supermarket
As per appendix four A , you may notice that in all supermarkets, the frequent visitors
constitute the majority of the supermarket customers. However in S3 and S4
supermarkets, the frequent visitors are below and the infrequent visitors are above the
overall average. This could mean that a section of customers in S3 and S4 supermarkets
seem to switch either between supermarkets or between other retail formats in buying
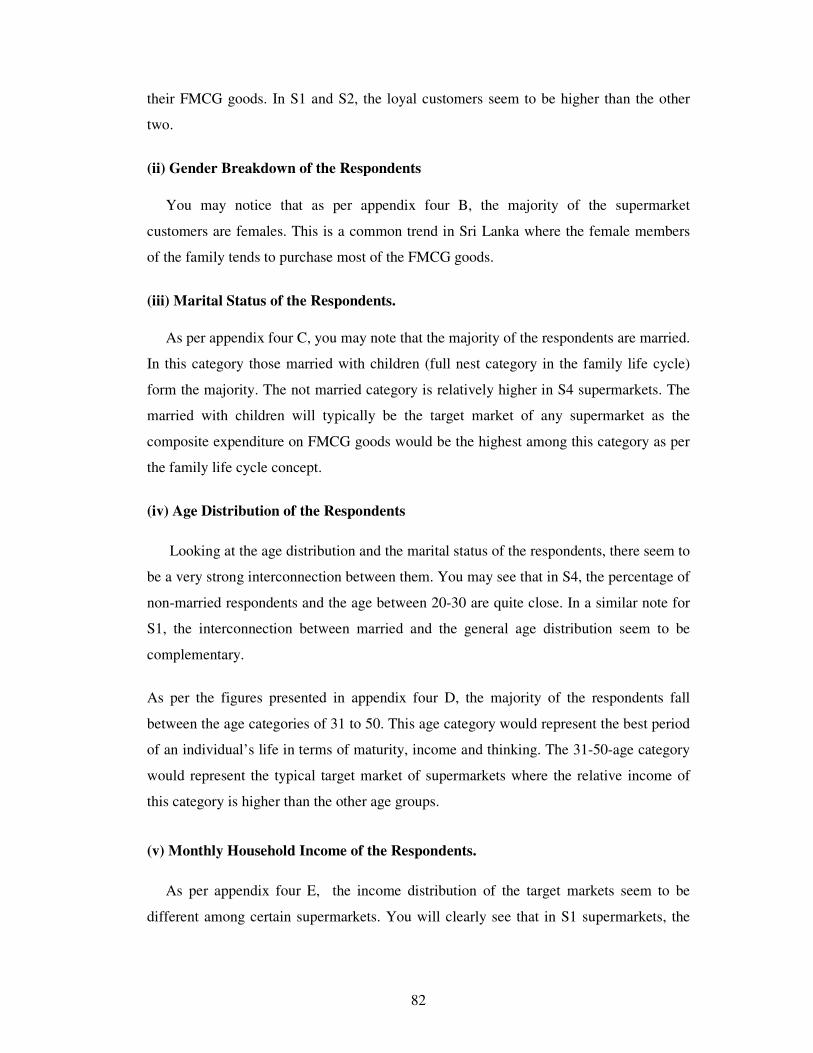
82
their FMCG goods. In S1 and S2, the loyal customers seem to be higher than the other
two.
(ii) Gender Breakdown of the Respondents
You may notice that as per appendix four B, the majority of the supermarket
customers are females. This is a common trend in Sri Lanka where the female members
of the family tends to purchase most of the FMCG goods.
(iii) Marital Status of the Respondents.
As per appendix four C, you may note that the majority of the respondents are married.
In this category those married with children (full nest category in the family life cycle)
form the majority. The not married category is relatively higher in S4 supermarkets. The
married with children will typically be the target market of any supermarket as the
composite expenditure on FMCG goods would be the highest among this category as per
the family life cycle concept.
(iv) Age Distribution of the Respondents
Looking at the age distribution and the marital status of the respondents, there seem to
be a very strong interconnection between them. You may see that in S4, the percentage of
non-married respondents and the age between 20-30 are quite close. In a similar note for
S1, the interconnection between married and the general age distribution seem to be
complementary.
As per the figures presented in appendix four D, the majority of the respondents fall
between the age categories of 31 to 50. This age category would represent the best period
of an individual’s life in terms of maturity, income and thinking. The 31-50-age category
would represent the typical target market of supermarkets where the relative income of
this category is higher than the other age groups.
(v) Monthly Household Income of the Respondents.
As per appendix four E, the income distribution of the target markets seem to be
different among certain supermarkets. You will clearly see that in S1 supermarkets, the
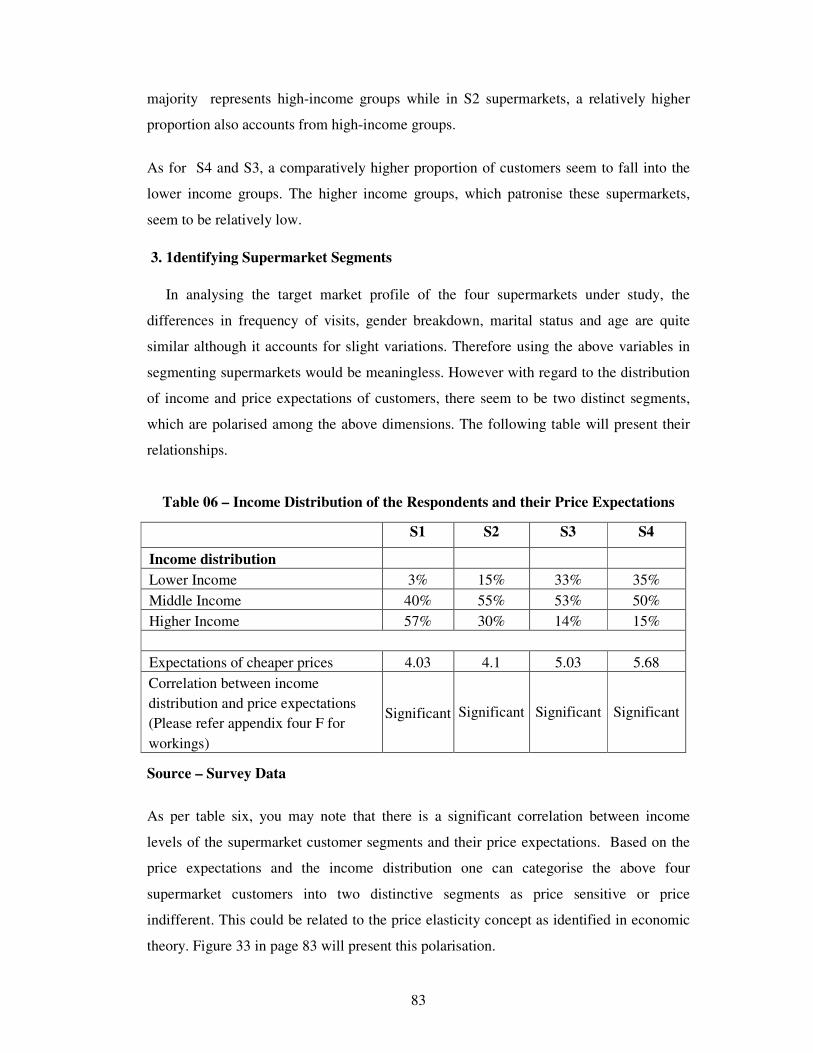
83
majority represents high-income groups while in S2 supermarkets, a relatively higher
proportion also accounts from high-income groups.
As for S4 and S3, a comparatively higher proportion of customers seem to fall into the
lower income groups. The higher income groups, which patronise these supermarkets,
seem to be relatively low.
3. 1dentifying Supermarket Segments
In analysing the target market profile of the four supermarkets under study, the
differences in frequency of visits, gender breakdown, marital status and age are quite
similar although it accounts for slight variations. Therefore using the above variables in
segmenting supermarkets would be meaningless. However with regard to the distribution
of income and price expectations of customers, there seem to be two distinct segments,
which are polarised among the above dimensions. The following table will present their
relationships.
Table 06 – Income Distribution of the Respondents and their Price Expectations
S1 S2 S3 S4
Income distribution
Lower Income 3% 15% 33% 35%
Middle Income 40% 55% 53% 50%
Higher Income 57% 30% 14% 15%
Expectations of cheaper prices 4.03 4.1 5.03 5.68
Correlation between income
distribution and price expectations
(Please refer appendix four F for
workings)
Significant Significant Significant Significant
Source – Survey Data
As per table six, you may note that there is a significant correlation between income
levels of the supermarket customer segments and their price expectations. Based on the
price expectations and the income distribution one can categorise the above four
supermarket customers into two distinctive segments as price sensitive or price
indifferent. This could be related to the price elasticity concept as identified in economic
theory. Figure 33 in page 83 will present this polarisation.
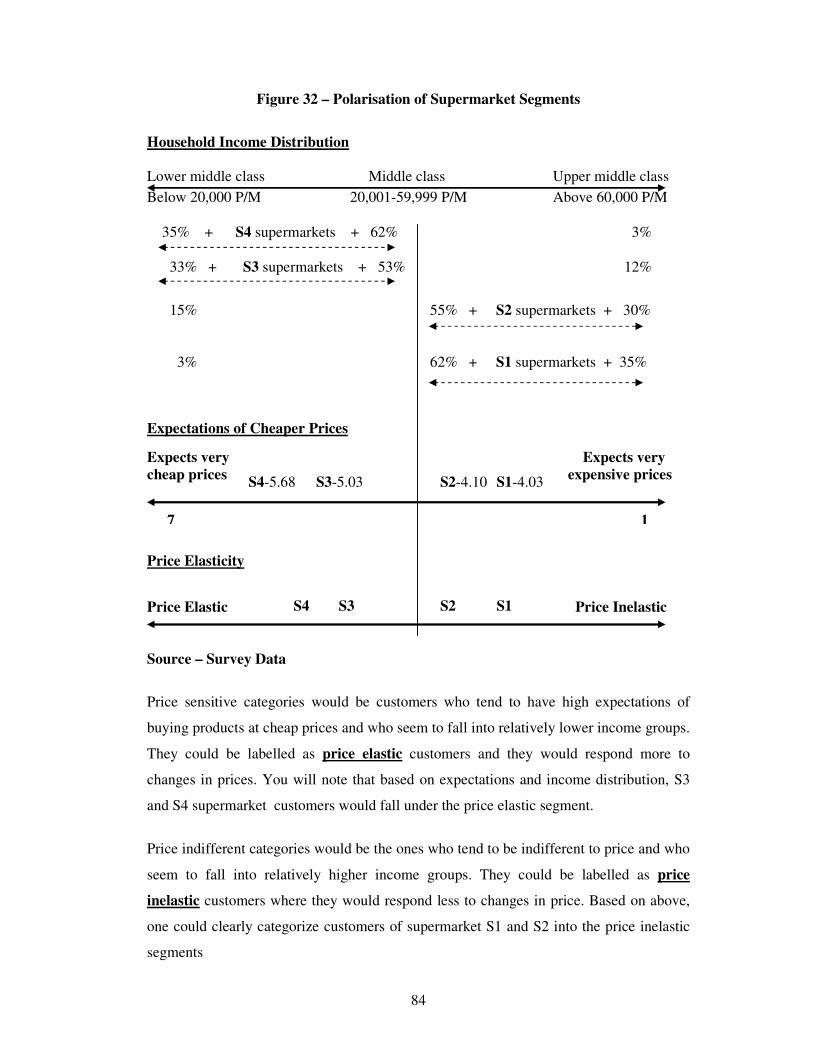
84
Figure 32 – Polarisation of Supermarket Segments
Household Income Distribution
Lower middle class Middle class Upper middle class
Below 20,000 P/M 20,001-59,999 P/M Above 60,000 P/M
35% + S4 supermarkets + 62% 3%
33% + S3 supermarkets + 53% 12%
15% 55% + S2 supermarkets + 30%
3% 62% + S1 supermarkets + 35%
Expectations of Cheaper Prices
Expects very Expects very
cheap prices expensive prices
Price Elasticity
Price Elastic Price Inelastic
Source – Survey Data
Price sensitive categories would be customers who tend to have high expectations of
buying products at cheap prices and who seem to fall into relatively lower income groups.
They could be labelled as price elastic customers and they would respond more to
changes in prices. You will note that based on expectations and income distribution, S3
and S4 supermarket customers would fall under the price elastic segment.
Price indifferent categories would be the ones who tend to be indifferent to price and who
seem to fall into relatively higher income groups. They could be labelled as price
inelastic customers where they would respond less to changes in price. Based on above,
one could clearly categorize customers of supermarket S1 and S2 into the price inelastic
segments
7
S1-4.03 S2-4.10 S3-5.03 S4-5.68
S1 S2 S3 S4
1
85
Based on the above findings , supermarkets customers could be clearly segmented into
two categories, which are
Price elastic supermarket segments ( more responsive to price). - S3 and S4
Price inelastic supermarket segments ( less responsive to prices) -S1 and S2
4. Findings on Service Quality Recognition Levels and Overall Satisfaction.
In this section we will first try to understand the correlation between service quality
gaps and the satisfaction with service quality and then the correlation with satisfaction
with service quality and overall satisfaction in shopping in supermarket explored. This is
analysed for all 4 supermarkets. A detailed analysis is available in appendix four G 1-4.
In identifying the correlation, statistical analysis of correlation(r), coefficient of
determination ( r2) and the significance of the correlation will be presented.
(i) Correlation between Service Quality Gaps and Satisfaction with Service
Quality
The reader is requested to refer appendix four G1 to G4 where, columns A and B
would reflect the correlation analysis carried out between service quality gaps and
satisfaction with service quality for the four supermarkets. In the same analysis the
significance of correlation, the determination of correlation is also presented.
You may note that for all supermarkets, the data seem to suggest a high positive
significant correlation between the service quality gaps and the satisfaction with service
quality. Also the high coefficient of determination would indicate that the variation in
satisfaction with service quality is explained by service quality gaps to a very large
extent.
(ii) Correlation between Satisfaction with Service Quality and the Overall
Satisfaction in Shopping in the Supermarkets.
In this section the writer will try to understand the correlation between satisfaction
with service quality and the overall satisfaction in shopping in supermarkets. The nature
of this relationship, its strength and its significance will be explored. The reader is once
again requested to refer appendix four G1 to G4 , columns B and C for the correlation
analysis carried out between satisfaction with service quality and the overall satisfaction
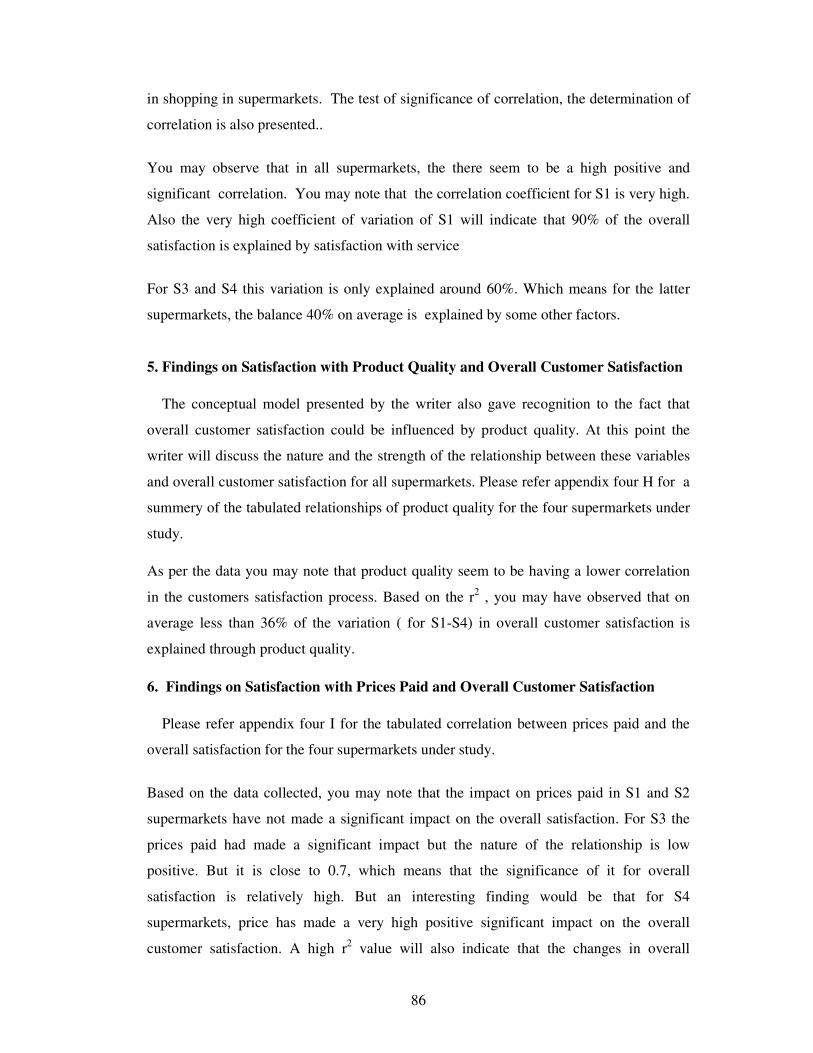
86
in shopping in supermarkets. The test of significance of correlation, the determination of
correlation is also presented..
You may observe that in all supermarkets, the there seem to be a high positive and
significant correlation. You may note that the correlation coefficient for S1 is very high.
Also the very high coefficient of variation of S1 will indicate that 90% of the overall
satisfaction is explained by satisfaction with service
For S3 and S4 this variation is only explained around 60%. Which means for the latter
supermarkets, the balance 40% on average is explained by some other factors.
5. Findings on Satisfaction with Product Quality and Overall Customer Satisfaction
The conceptual model presented by the writer also gave recognition to the fact that
overall customer satisfaction could be influenced by product quality. At this point the
writer will discuss the nature and the strength of the relationship between these variables
and overall customer satisfaction for all supermarkets. Please refer appendix four H for a
summery of the tabulated relationships of product quality for the four supermarkets under
study.
As per the data you may note that product quality seem to be having a lower correlation
in the customers satisfaction process. Based on the r2 , you may have observed that on
average less than 36% of the variation ( for S1-S4) in overall customer satisfaction is
explained through product quality.
6. Findings on Satisfaction with Prices Paid and Overall Customer Satisfaction
Please refer appendix four I for the tabulated correlation between prices paid and the
overall satisfaction for the four supermarkets under study.
Based on the data collected, you may note that the impact on prices paid in S1 and S2
supermarkets have not made a significant impact on the overall satisfaction. For S3 the
prices paid had made a significant impact but the nature of the relationship is low
positive. But it is close to 0.7, which means that the significance of it for overall
satisfaction is relatively high. But an interesting finding would be that for S4
supermarkets, price has made a very high positive significant impact on the overall
customer satisfaction. A high r2 value will also indicate that the changes in overall
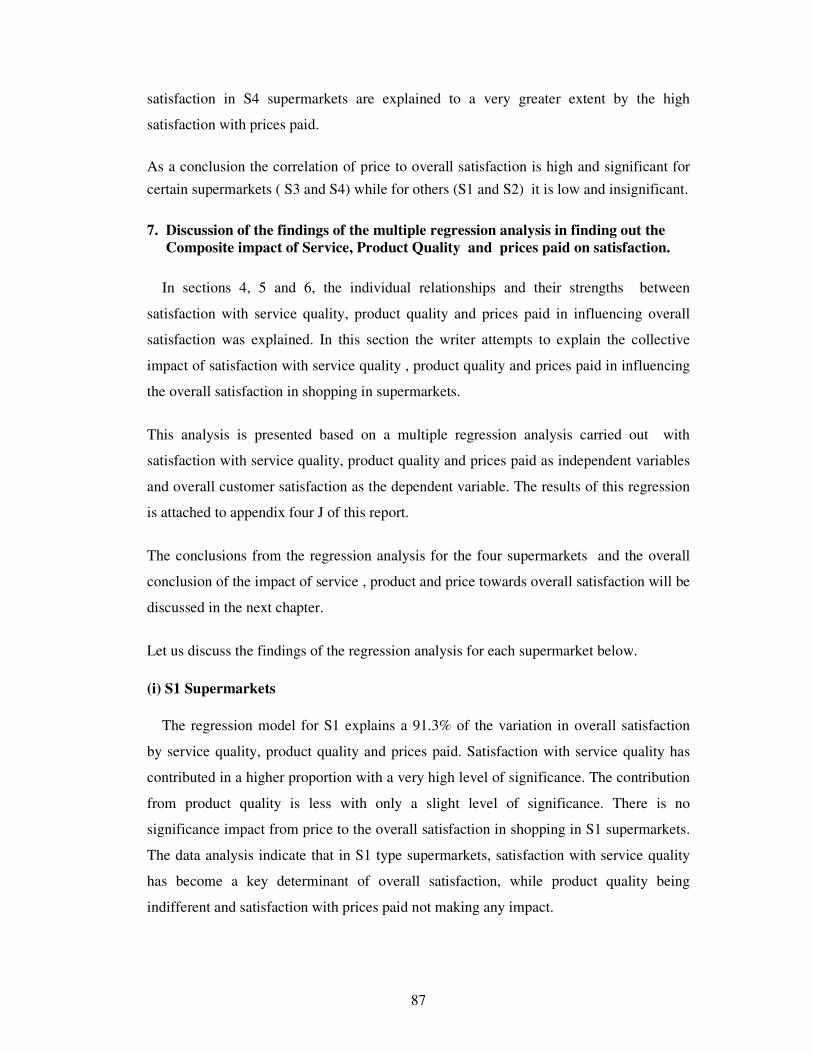
87
satisfaction in S4 supermarkets are explained to a very greater extent by the high
satisfaction with prices paid.
As a conclusion the correlation of price to overall satisfaction is high and significant for
certain supermarkets ( S3 and S4) while for others (S1 and S2) it is low and insignificant.
7. Discussion of the findings of the multiple regression analysis in finding out the
Composite impact of Service, Product Quality and prices paid on satisfaction.
In sections 4, 5 and 6, the individual relationships and their strengths between
satisfaction with service quality, product quality and prices paid in influencing overall
satisfaction was explained. In this section the writer attempts to explain the collective
impact of satisfaction with service quality , product quality and prices paid in influencing
the overall satisfaction in shopping in supermarkets.
This analysis is presented based on a multiple regression analysis carried out with
satisfaction with service quality, product quality and prices paid as independent variables
and overall customer satisfaction as the dependent variable. The results of this regression
is attached to appendix four J of this report.
The conclusions from the regression analysis for the four supermarkets and the overall
conclusion of the impact of service , product and price towards overall satisfaction will be
discussed in the next chapter.
Let us discuss the findings of the regression analysis for each supermarket below.
(i) S1 Supermarkets
The regression model for S1 explains a 91.3% of the variation in overall satisfaction
by service quality, product quality and prices paid. Satisfaction with service quality has
contributed in a higher proportion with a very high level of significance. The contribution
from product quality is less with only a slight level of significance. There is no
significance impact from price to the overall satisfaction in shopping in S1 supermarkets.
The data analysis indicate that in S1 type supermarkets, satisfaction with service quality
has become a key determinant of overall satisfaction, while product quality being
indifferent and satisfaction with prices paid not making any impact.

88
(ii) S2 Supermarkets
Regression model for S2 explains a 71.7% of the variation in overall satisfaction
through satisfaction with service quality, product quality and prices paid. The balance
28.3% is not explained thus could be explained by other situational conditions. Once
again you may note that satisfaction with service quality has contributed to a higher
proportion with a significant impact on the overall satisfaction. The contribution from
product quality is very small with no level of significance. There is no significance of
price to the overall satisfaction in S2 supermarket as well.
Once again service quality seem to make a significant impact on the overall satisfaction
while satisfaction with product quality and prices paid have not made a significant impact
on the overall satisfaction levels.
(iii) S3 Supermarkets
Regression model for S3 explains a 74.7% of the variation in overall satisfaction
through satisfaction with service quality, product quality and prices paid. The balance
25.6% is not explained thus could be due to other situational conditions. You may note
that satisfaction with service quality has contributed to a higher proportion with a
significant impact for the overall satisfaction. However the regression coefficient is not
very high. The contribution from product quality has made a significant impact on the
overall customer satisfaction while the impact from price is also significant.
In S3 supermarket although service seem to have a bigger impact, product quality and
prices paid seem to have made quite a significant impact on overall satisfaction levels.
(iv) S4 Supermarkets
For supermarket S4, the regression model explains an 88.4% of the variation in
overall satisfaction through satisfaction with service quality, product quality and prices
paid. There is a significant impact made by satisfaction with service quality on overall
satisfaction. According to the P values, the product quality has only a slight significance
in overall satisfaction. One interesting observation is that satisfaction with prices paid has
a higher significance even more than in service quality for S4 supermarkets. In S4, price
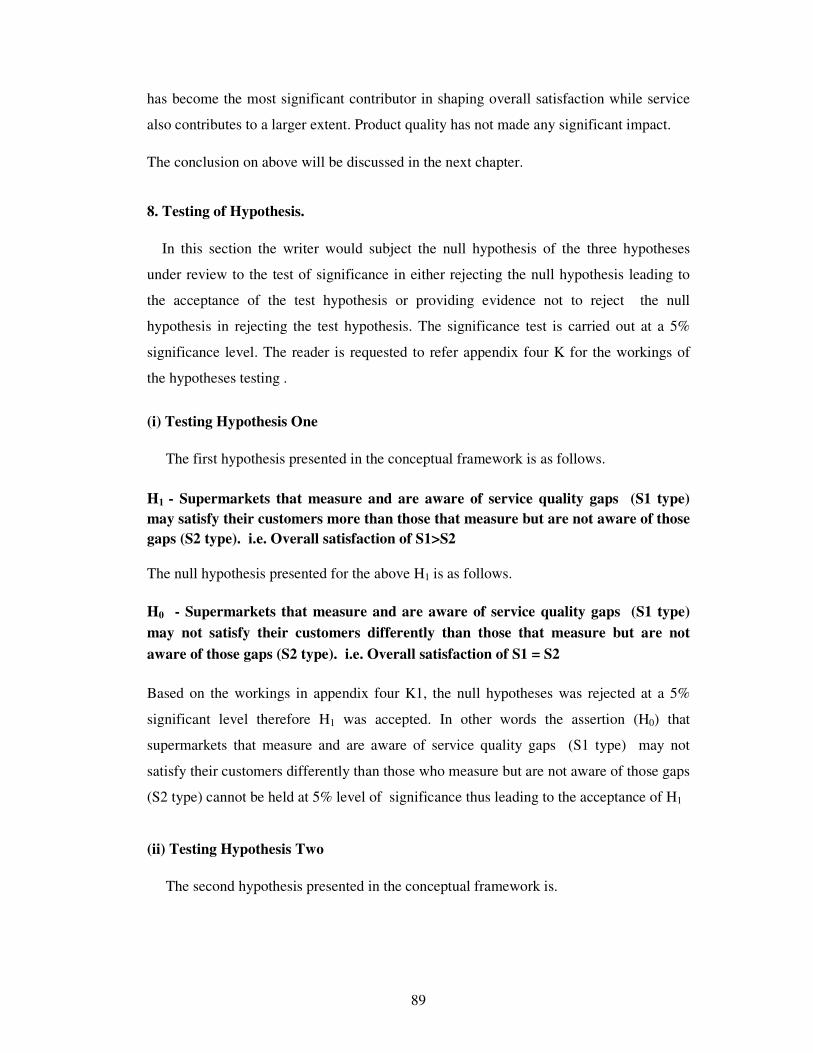
89
has become the most significant contributor in shaping overall satisfaction while service
also contributes to a larger extent. Product quality has not made any significant impact.
The conclusion on above will be discussed in the next chapter.
8. Testing of Hypothesis.
In this section the writer would subject the null hypothesis of the three hypotheses
under review to the test of significance in either rejecting the null hypothesis leading to
the acceptance of the test hypothesis or providing evidence not to reject the null
hypothesis in rejecting the test hypothesis. The significance test is carried out at a 5%
significance level. The reader is requested to refer appendix four K for the workings of
the hypotheses testing .
(i) Testing Hypothesis One
The first hypothesis presented in the conceptual framework is as follows.
H1 - Supermarkets that measure and are aware of service quality gaps (S1 type)
may satisfy their customers more than those that measure but are not aware of those
gaps (S2 type). i.e. Overall satisfaction of S1>S2
The null hypothesis presented for the above H1 is as follows.
H0 - Supermarkets that measure and are aware of service quality gaps (S1 type)
may not satisfy their customers differently than those that measure but are not
aware of those gaps (S2 type). i.e. Overall satisfaction of S1 = S2
Based on the workings in appendix four K1, the null hypotheses was rejected at a 5%
significant level therefore H1 was accepted. In other words the assertion (H0) that
supermarkets that measure and are aware of service quality gaps (S1 type) may not
satisfy their customers differently than those who measure but are not aware of those gaps
(S2 type) cannot be held at 5% level of significance thus leading to the acceptance of H1
(ii) Testing Hypothesis Two
The second hypothesis presented in the conceptual framework is.
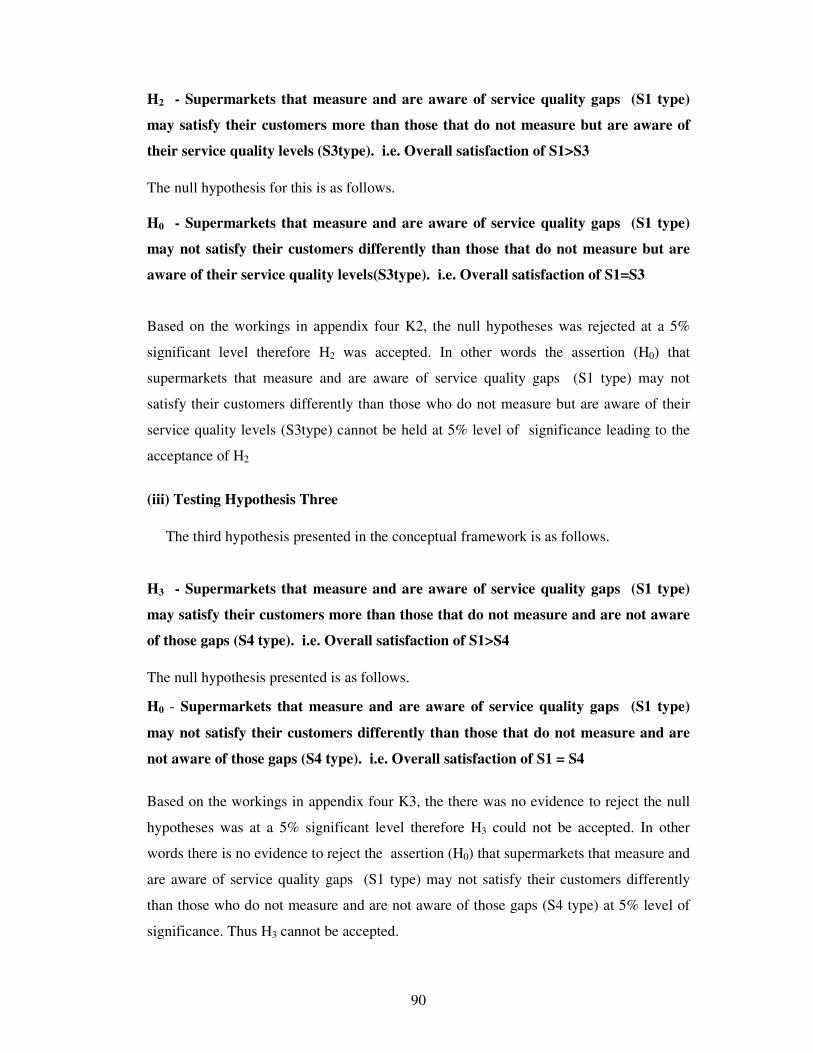
90
H2 - Supermarkets that measure and are aware of service quality gaps (S1 type)
may satisfy their customers more than those that do not measure but are aware of
their service quality levels (S3type). i.e. Overall satisfaction of S1>S3
The null hypothesis for this is as follows.
H0 - Supermarkets that measure and are aware of service quality gaps (S1 type)
may not satisfy their customers differently than those that do not measure but are
aware of their service quality levels(S3type). i.e. Overall satisfaction of S1=S3
Based on the workings in appendix four K2, the null hypotheses was rejected at a 5%
significant level therefore H2 was accepted. In other words the assertion (H0) that
supermarkets that measure and are aware of service quality gaps (S1 type) may not
satisfy their customers differently than those who do not measure but are aware of their
service quality levels (S3type) cannot be held at 5% level of significance leading to the
acceptance of H2
(iii) Testing Hypothesis Three
The third hypothesis presented in the conceptual framework is as follows.
H3 - Supermarkets that measure and are aware of service quality gaps (S1 type)
may satisfy their customers more than those that do not measure and are not aware
of those gaps (S4 type). i.e. Overall satisfaction of S1>S4
The null hypothesis presented is as follows.
H0 - Supermarkets that measure and are aware of service quality gaps (S1 type)
may not satisfy their customers differently than those that do not measure and are
not aware of those gaps (S4 type). i.e. Overall satisfaction of S1 = S4
Based on the workings in appendix four K3, the there was no evidence to reject the null
hypotheses was at a 5% significant level therefore H3 could not be accepted. In other
words there is no evidence to reject the assertion (H0) that supermarkets that measure and
are aware of service quality gaps (S1 type) may not satisfy their customers differently
than those who do not measure and are not aware of those gaps (S4 type) at 5% level of
significance. Thus H3 cannot be accepted.
91
As a summary based on the significance testing, H1 and H2 has been accepted through the
rejection of their null hypotheses based on the data obtained through the research but H3
has not been accepted due to the lack of evidence to reject the respective null hypothesis.
The conclusions based on the above findings will be discussed in the next chapter.
9. Summary
In this chapter the writer attempted to present data, which was gathered from the
survey carried out among four supermarkets, which represented each of the four
quadrants of the service quality recognition matrix.
Based on the type of relationships identified, it was observed that there was a strong
correlation between gaps in service quality, product quality and prices paid with their
respective satisfaction levels with service quality, product quality and prices paid.
There was also a significant high positive correlation between satisfaction with service
quality and overall satisfaction. While the satisfaction with product quality was
significant, the correlation was only low positive with overall satisfaction. Satisfaction
with price was significant for S3 and S4 supermarkets while for others it was
insignificant.
Composite impact of service quality, product quality and prices paid was also analysed
using a multiple regression analysis.
The hypothesis testing carried out at a 95% level of significance leads us to acceptance of
hypothesis one and two. There was no evidence to reject the null hypothesis of the third
hypothesis at a 95% level of confidence.
In the next chapter the writer will present the overall conclusions made in this study.

92
Chapter VI
CONCLUSIONS
1. Introduction
In chapter four, the writer presented information, which led to the acceptance of the
service quality recognition matrix for the supermarkets in Sri Lanka. Chapter five
presented the findings of the questionnaire survey carried out in understanding the impact
of service quality, product quality and prices paid on the overall satisfaction in shopping
in supermarkets. This chapter will consolidate the findings and arrive at the overall
conclusions of the study. They are as follows.
2. Service Quality Recognition in Sri Lankan Supermarkets selling FMCG
Products
“Supermarkets which sell fast moving consumer goods in Sri Lanka could be
categorized into four types based on their service quality recognition levels”
These four types are
S1 type – Supermarkets that measure and know service quality gaps.
S2 type – Supermarkets that measure service quality but are not ware of gaps
S3 type – Supermarkets that does not measure but has an idea of the service quality
S4 type – Supermarkets that does not measure neither are aware of service quality gaps.
3. The relationship between service quality, product quality, price gaps and their
respective satisfaction with service, product quality and prices paid
“There appears to be a very strong positive relationship between
� Service quality gaps and satisfaction with service quality
� Product quality gaps and satisfaction with product quality
� Price gaps and satisfaction with prices paid.”
The gaps that are under discussion here are essentially the difference between the
perceived performance of the service, consuming the product and payment of the actual
prices as against the expectations that were created of that service, product quality and the
intended prices to be paid. For example the gaps would be arrived by
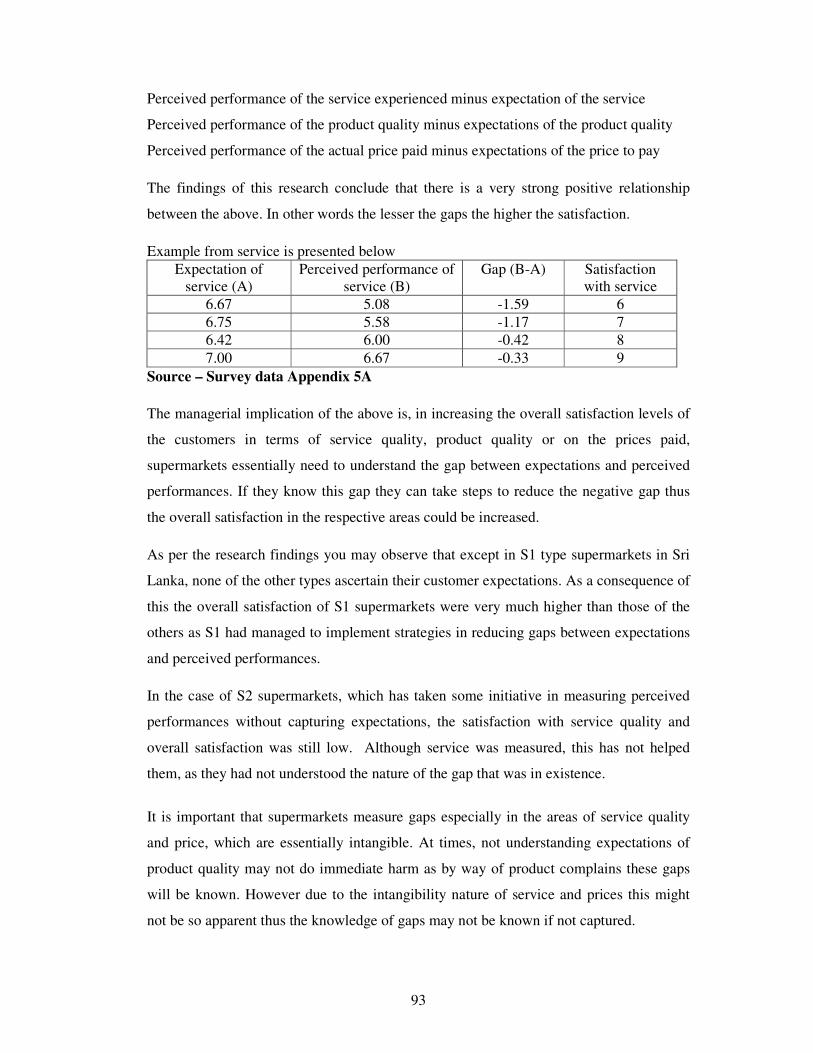
93
Perceived performance of the service experienced minus expectation of the service
Perceived performance of the product quality minus expectations of the product quality
Perceived performance of the actual price paid minus expectations of the price to pay
The findings of this research conclude that there is a very strong positive relationship
between the above. In other words the lesser the gaps the higher the satisfaction.
Example from service is presented below
Expectation of
service (A)
Perceived performance of
service (B)
Gap (B-A) Satisfaction
with service
6.67 5.08 -1.59 6
6.75 5.58 -1.17 7
6.42 6.00 -0.42 8
7.00 6.67 -0.33 9
Source – Survey data Appendix 5A
The managerial implication of the above is, in increasing the overall satisfaction levels of
the customers in terms of service quality, product quality or on the prices paid,
supermarkets essentially need to understand the gap between expectations and perceived
performances. If they know this gap they can take steps to reduce the negative gap thus
the overall satisfaction in the respective areas could be increased.
As per the research findings you may observe that except in S1 type supermarkets in Sri
Lanka, none of the other types ascertain their customer expectations. As a consequence of
this the overall satisfaction of S1 supermarkets were very much higher than those of the
others as S1 had managed to implement strategies in reducing gaps between expectations
and perceived performances.
In the case of S2 supermarkets, which has taken some initiative in measuring perceived
performances without capturing expectations, the satisfaction with service quality and
overall satisfaction was still low. Although service was measured, this has not helped
them, as they had not understood the nature of the gap that was in existence.
It is important that supermarkets measure gaps especially in the areas of service quality
and price, which are essentially intangible. At times, not understanding expectations of
product quality may not do immediate harm as by way of product complains these gaps
will be known. However due to the intangibility nature of service and prices this might
not be so apparent thus the knowledge of gaps may not be known if not captured.
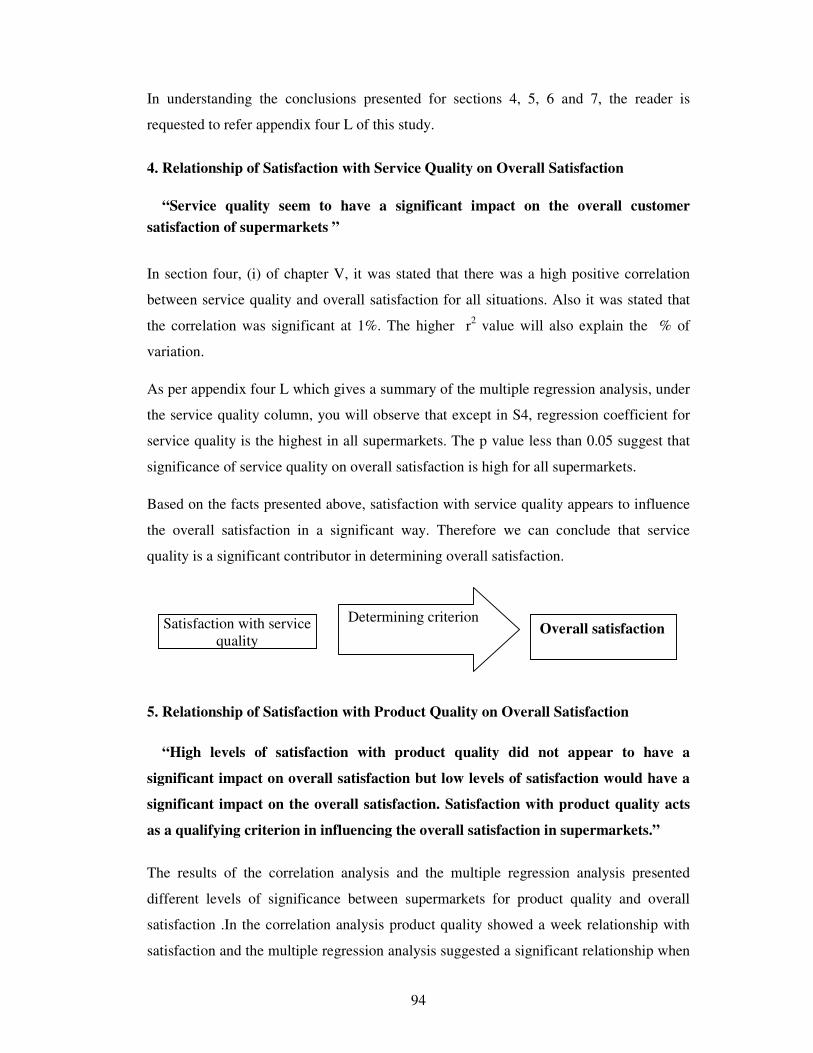
94
In understanding the conclusions presented for sections 4, 5, 6 and 7, the reader is
requested to refer appendix four L of this study.
4. Relationship of Satisfaction with Service Quality on Overall Satisfaction
“Service quality seem to have a significant impact on the overall customer
satisfaction of supermarkets ”
In section four, (i) of chapter V, it was stated that there was a high positive correlation
between service quality and overall satisfaction for all situations. Also it was stated that
the correlation was significant at 1%. The higher r2 value will also explain the % of
variation.
As per appendix four L which gives a summary of the multiple regression analysis, under
the service quality column, you will observe that except in S4, regression coefficient for
service quality is the highest in all supermarkets. The p value less than 0.05 suggest that
significance of service quality on overall satisfaction is high for all supermarkets.
Based on the facts presented above, satisfaction with service quality appears to influence
the overall satisfaction in a significant way. Therefore we can conclude that service
quality is a significant contributor in determining overall satisfaction.
5. Relationship of Satisfaction with Product Quality on Overall Satisfaction
“High levels of satisfaction with product quality did not appear to have a
significant impact on overall satisfaction but low levels of satisfaction would have a
significant impact on the overall satisfaction. Satisfaction with product quality acts
as a qualifying criterion in influencing the overall satisfaction in supermarkets.”
The results of the correlation analysis and the multiple regression analysis presented
different levels of significance between supermarkets for product quality and overall
satisfaction .In the correlation analysis product quality showed a week relationship with
satisfaction and the multiple regression analysis suggested a significant relationship when
Satisfaction with service
quality
Determining criterion Overall satisfaction
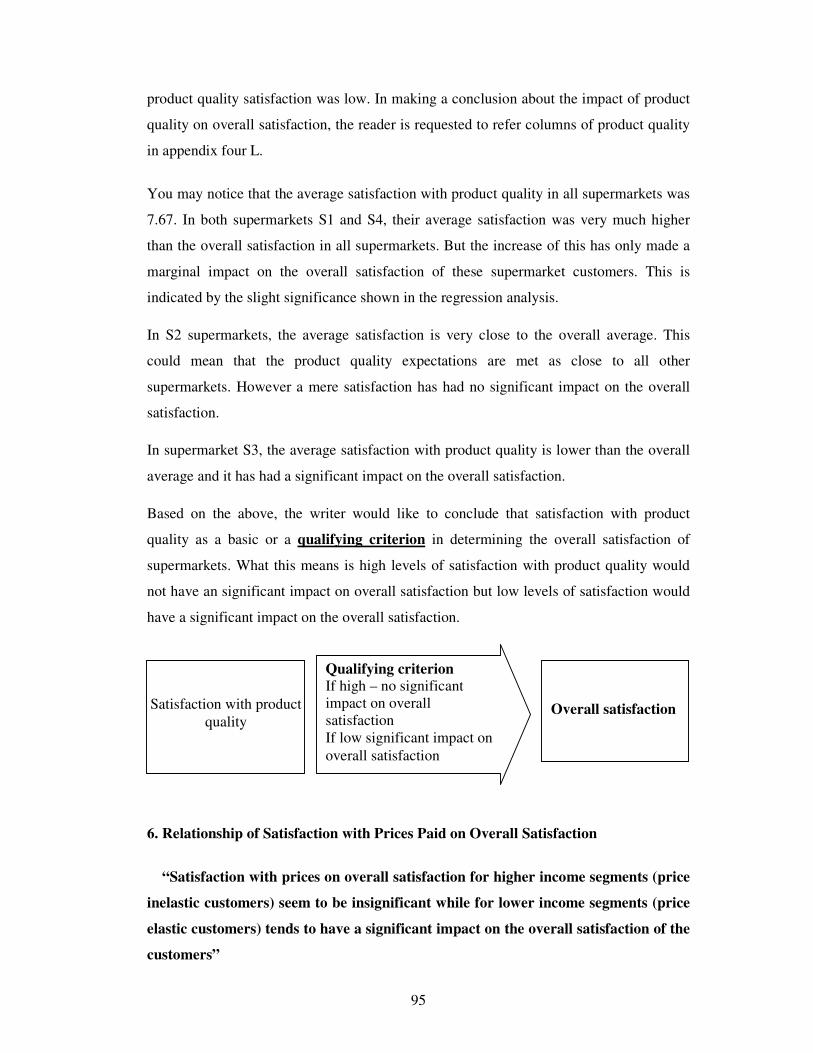
95
product quality satisfaction was low. In making a conclusion about the impact of product
quality on overall satisfaction, the reader is requested to refer columns of product quality
in appendix four L.
You may notice that the average satisfaction with product quality in all supermarkets was
7.67. In both supermarkets S1 and S4, their average satisfaction was very much higher
than the overall satisfaction in all supermarkets. But the increase of this has only made a
marginal impact on the overall satisfaction of these supermarket customers. This is
indicated by the slight significance shown in the regression analysis.
In S2 supermarkets, the average satisfaction is very close to the overall average. This
could mean that the product quality expectations are met as close to all other
supermarkets. However a mere satisfaction has had no significant impact on the overall
satisfaction.
In supermarket S3, the average satisfaction with product quality is lower than the overall
average and it has had a significant impact on the overall satisfaction.
Based on the above, the writer would like to conclude that satisfaction with product
quality as a basic or a qualifying criterion in determining the overall satisfaction of
supermarkets. What this means is high levels of satisfaction with product quality would
not have an significant impact on overall satisfaction but low levels of satisfaction would
have a significant impact on the overall satisfaction.
6. Relationship of Satisfaction with Prices Paid on Overall Satisfaction
“Satisfaction with prices on overall satisfaction for higher income segments (price
inelastic customers) seem to be insignificant while for lower income segments (price
elastic customers) tends to have a significant impact on the overall satisfaction of the
customers”
Satisfaction with product
quality
Qualifying criterion
If high – no significant
impact on overall
satisfaction
If low significant impact on
overall satisfaction
Overall satisfaction
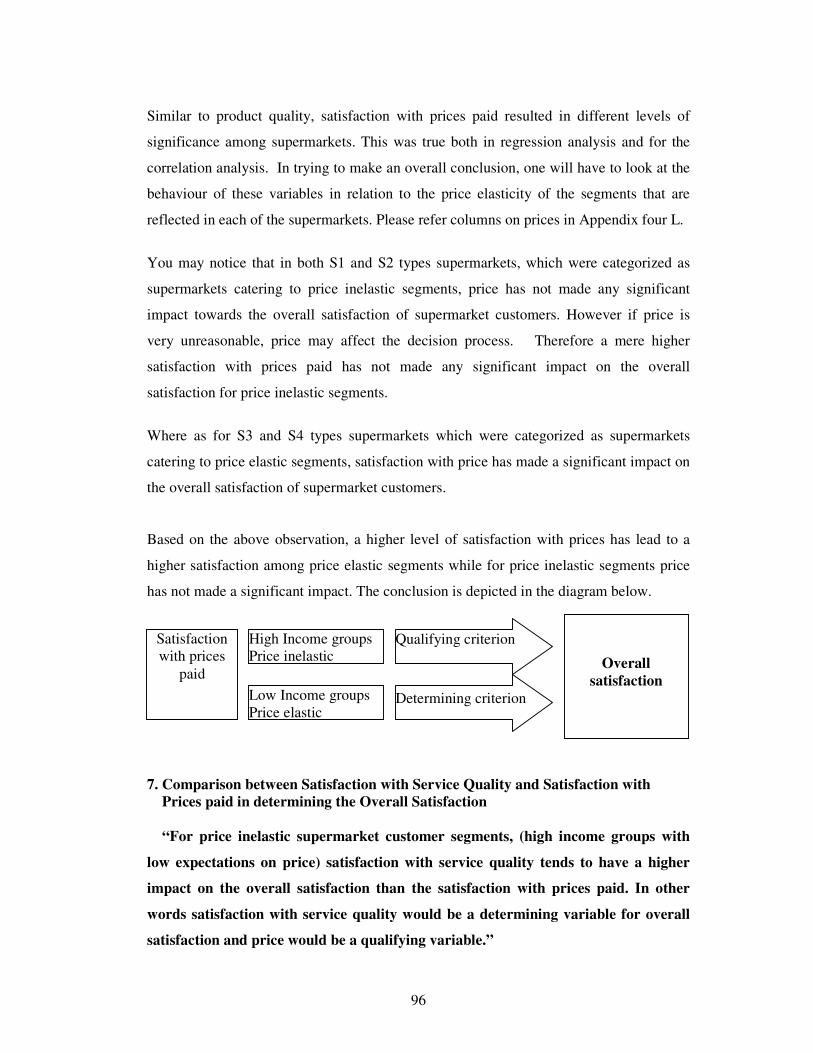
96
Similar to product quality, satisfaction with prices paid resulted in different levels of
significance among supermarkets. This was true both in regression analysis and for the
correlation analysis. In trying to make an overall conclusion, one will have to look at the
behaviour of these variables in relation to the price elasticity of the segments that are
reflected in each of the supermarkets. Please refer columns on prices in Appendix four L.
You may notice that in both S1 and S2 types supermarkets, which were categorized as
supermarkets catering to price inelastic segments, price has not made any significant
impact towards the overall satisfaction of supermarket customers. However if price is
very unreasonable, price may affect the decision process. Therefore a mere higher
satisfaction with prices paid has not made any significant impact on the overall
satisfaction for price inelastic segments.
Where as for S3 and S4 types supermarkets which were categorized as supermarkets
catering to price elastic segments, satisfaction with price has made a significant impact on
the overall satisfaction of supermarket customers.
Based on the above observation, a higher level of satisfaction with prices has lead to a
higher satisfaction among price elastic segments while for price inelastic segments price
has not made a significant impact. The conclusion is depicted in the diagram below.
7. Comparison between Satisfaction with Service Quality and Satisfaction with
Prices paid in determining the Overall Satisfaction
“For price inelastic supermarket customer segments, (high income groups with
low expectations on price) satisfaction with service quality tends to have a higher
impact on the overall satisfaction than the satisfaction with prices paid. In other
words satisfaction with service quality would be a determining variable for overall
satisfaction and price would be a qualifying variable.”
Satisfaction
with prices
paid
Qualifying criterion High Income groups
Price inelastic
Low Income groups
Price elastic Determining criterion
Overall
satisfaction
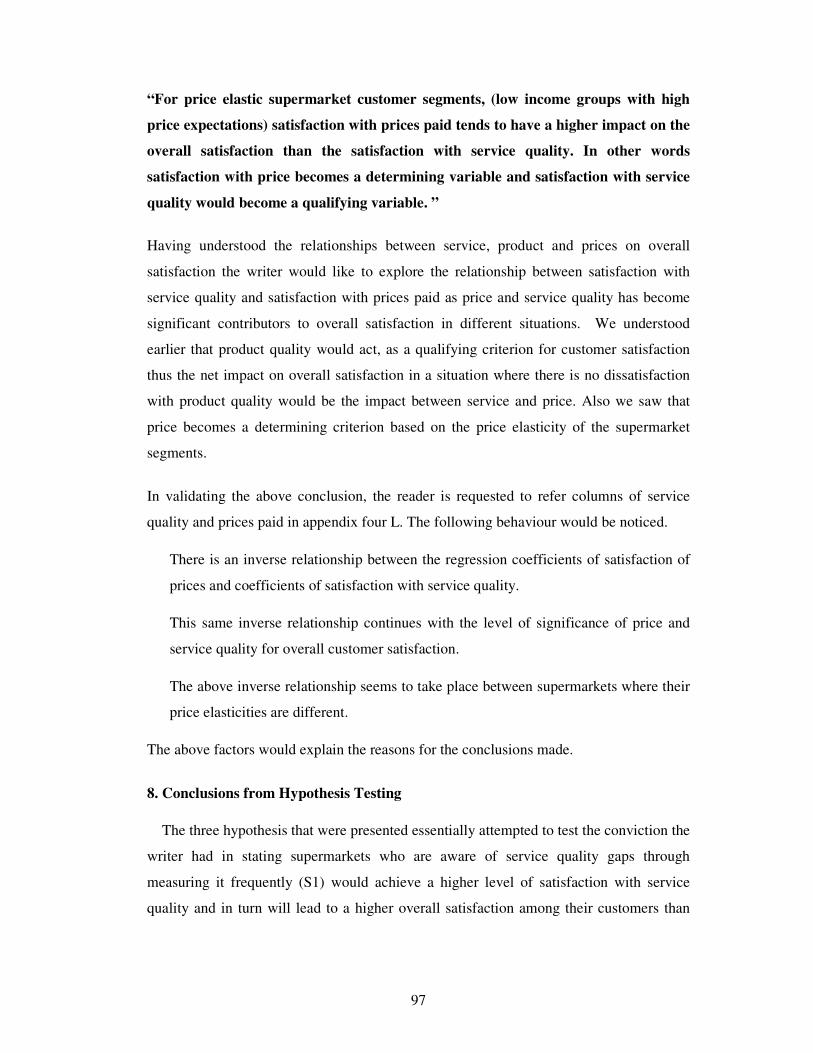
97
“For price elastic supermarket customer segments, (low income groups with high
price expectations) satisfaction with prices paid tends to have a higher impact on the
overall satisfaction than the satisfaction with service quality. In other words
satisfaction with price becomes a determining variable and satisfaction with service
quality would become a qualifying variable. ”
Having understood the relationships between service, product and prices on overall
satisfaction the writer would like to explore the relationship between satisfaction with
service quality and satisfaction with prices paid as price and service quality has become
significant contributors to overall satisfaction in different situations. We understood
earlier that product quality would act, as a qualifying criterion for customer satisfaction
thus the net impact on overall satisfaction in a situation where there is no dissatisfaction
with product quality would be the impact between service and price. Also we saw that
price becomes a determining criterion based on the price elasticity of the supermarket
segments.
In validating the above conclusion, the reader is requested to refer columns of service
quality and prices paid in appendix four L. The following behaviour would be noticed.
There is an inverse relationship between the regression coefficients of satisfaction of
prices and coefficients of satisfaction with service quality.
This same inverse relationship continues with the level of significance of price and
service quality for overall customer satisfaction.
The above inverse relationship seems to take place between supermarkets where their
price elasticities are different.
The above factors would explain the reasons for the conclusions made.
8. Conclusions from Hypothesis Testing
The three hypothesis that were presented essentially attempted to test the conviction the
writer had in stating supermarkets who are aware of service quality gaps through
measuring it frequently (S1) would achieve a higher level of satisfaction with service
quality and in turn will lead to a higher overall satisfaction among their customers than
98
supermarkets which measure and are not aware (S2) or does not measure but are aware
(S3) or not either of both (S4).
The rationale for this argument was supermarkets that had identified gaps and measures it
frequently, would implement strategies in closing those gaps leading to higher levels of
satisfaction with service quality. It was the presumption of the writer that service quality
would have a bigger impact in the overall customer satisfaction than satisfaction with
product quality and prices paid.
The acceptance of the first hypothesis where the writer argued that supermarkets that
measure and are aware of service quality gaps (S1) would satisfy their customers more
than those that measure but are not aware (S2) strengthened the above conviction.
The acceptance of the second hypothesis where the writer argued that supermarkets that
measure and aware of service quality gaps (S1) would satisfy their customers more than
those who do not measure but seem to have an idea of service quality (S3) once again
validated the above point.
The non acceptance of the third hypothesis where by the writer argued that supermarkets
who measure and are aware of service quality gaps (S1) would satisfy their customers
more than those who do not measure neither are aware of the gaps (S4) lead some
inconsistency in the original argument. The reason being although service quality was
higher than S4, the overall satisfaction of S1 was not significantly higher than S4. From
the multiple regressions we saw that it was price, which had made the bigger impact on
S4 supermarket than service quality.
The above explains the non-acceptance of the H3. Hypothesis three essentially compared
the overall satisfaction of S1 (price inelastic) with S4 (price elastic) supermarket. The
latter supermarket was patronised by a majority of low-income customers who were very
price sensitive (based on the very high expectations on price and lower incomes). A very
high level of satisfaction with price (9 out of 10) had made a significant impact on the
overall satisfaction of these customers. So low levels of service quality essentially did not
lead to lower satisfaction levels in price sensitive segments.
The question why the second hypothesis was accepted where S3 was a price elastic
segment would be raised if the above argument was correct. In S3 case, the lower
99
satisfaction with product quality and prices had an impact on overall satisfaction together
with service quality.
9. Overall Conclusion of the Study.
Based on all the facts presented above the writer would present the overall conclusion
of the study.
Figure 33 - Overall Conclusion of the Study.
It is argued that in more price inelastic supermarket customer segments, service quality
would be a clear determinant of overall satisfaction while satisfaction with product
quality and prices paid will act as a qualifier. Where in more price elastic supermarket
customer segments, satisfaction with prices would become a clear differentiator of overall
satisfaction while product quality and service quality would act as qualifiers.
The above findings suggest that the influence of satisfaction with service quality, product
quality and prices paid with overall satisfaction had to be associated with the relative
segments where supermarkets operates and cannot be concluded in isolation. Segments
where essentially differentiated on price elasticity in supermarkets.
The above findings will alter the writers original conviction and would arrive at the
conclusion that the impact of service quality, product quality or prices paid on customer
satisfaction is dependent on the market segment and the target market that the
supermarket caters to. This would also challenge the traditional thinking where it was
Ov
era
ll c
ust
om
er
sati
sfa
ctio
n
Qualifying
criterion
Satisfaction
with product
quality
Determining
criterion
Satisfaction
with prices
paid
Qualifying
criterion
Satisfaction
with service
quality
Satisfaction
with service
quality
Satisfaction
with product
quality
Satisfaction
with prices
paid
Qualifying
criterion
Price inelastic supermarket
segments (High income)
Qualifying
criterion
Determining
criterion
Price elastic supermarket
segments (low income)
100
thought that satisfaction in shopping in supermarkets was a combination of satisfaction
with product quality and satisfaction with service based on the placing of supermarkets as
a hybrid in the product service continuum.
10. Summary
This chapter essentially presented the conclusions made from the study. They are listed
down in summary below
Supermarkets which sell fast moving consumer goods in Sri Lanka could be
categorized into four types based on their service quality recognition levels
There appears to be a very strong positive relationship between service quality gaps
and satisfaction with service quality, product quality gaps and satisfaction with
product quality and price gaps and satisfaction with prices paid.
Service quality appears to have a significant impact on the overall customer
satisfaction of supermarkets.
Satisfaction with product quality acts as a qualifying criterion in influencing the
overall satisfaction in supermarkets irrespective of the type of customer.
In more price inelastic markets service quality would be a clear determinant of overall
satisfaction while satisfaction with product quality and prices paid will act as a
qualifier. In more price elastic markets, satisfaction with prices would become a clear
differentiator of overall satisfaction while product quality and service quality would
act as qualifiers.
Based on above, the overall conclusion would be the impact of service quality,
product quality and prices paid on customer satisfaction is dependent on the market
segment and the target market the supermarket operates in.
The conclusion of this chapter lead to the meeting of the second and the third objectives
of the study where relationships between service quality, product quality and prices paid
were concluded based on the findings as suggested by data.
In the next chapter the writer will make strategy recommendations in influencing the
overall satisfaction for different supermarket segments.
101
Chapter VII
RECOMMENDATIONS
1. Introduction
This chapter is presented with the intension of achieving the final objective set for this
research study. That is to recommend retail strategies in closing gaps identified in
measuring service quality, product quality and prices paid. In the last chapter we
concluded that service quality was a significant contributor in influencing the overall
satisfaction of the supermarket customers. When understanding the composite impact of
service quality, product quality and prices paid on overall satisfaction, we observed that
in price inelastic supermarket customer segments, service quality was a clear
differentiator of satisfaction while product quality and prices paid acted as qualifying
criteria. In more price elastic segments our conclusion was that service quality and
product quality acted as a qualifying criterion while satisfaction with prices paid, acted as
a clear differentiator. The data indicates that in all supermarkets there were negative gaps
(perceived performance<expectations) for service quality, product quality and for prices
paid.
In this chapter the writer will present a four step process approach in closing service,
product quality and price gaps based on different supermarket segment requirements by
building tactical retail strategies. In the final section of this report, two generic strategies
will be recommended based the findings for the behaviour of service quality, product
quality and prices paid in influencing overall satisfaction in supermarkets.
2. Four Step Process Approach in Closing Gaps in Supermarkets.
The intension of the writer in proposing the above four step approach is to offer a
complete tool to the supermarket industry in measuring service quality, analysing the
gaps, identifying effective strategies that would close those gaps and monitoring its
successful implementation. As suggested the four steps would be
Step one – Measuring service/product quality and price gaps
Step two – Analysing the gaps
Step three – Building effective retail strategies in closing those gaps
Step four – Implementing and monitoring strategies and gaps over time.
The above steps will be discussed in detail in this chapter. Please refer figure 34 for the
complete model and its components as proposed by the writer.
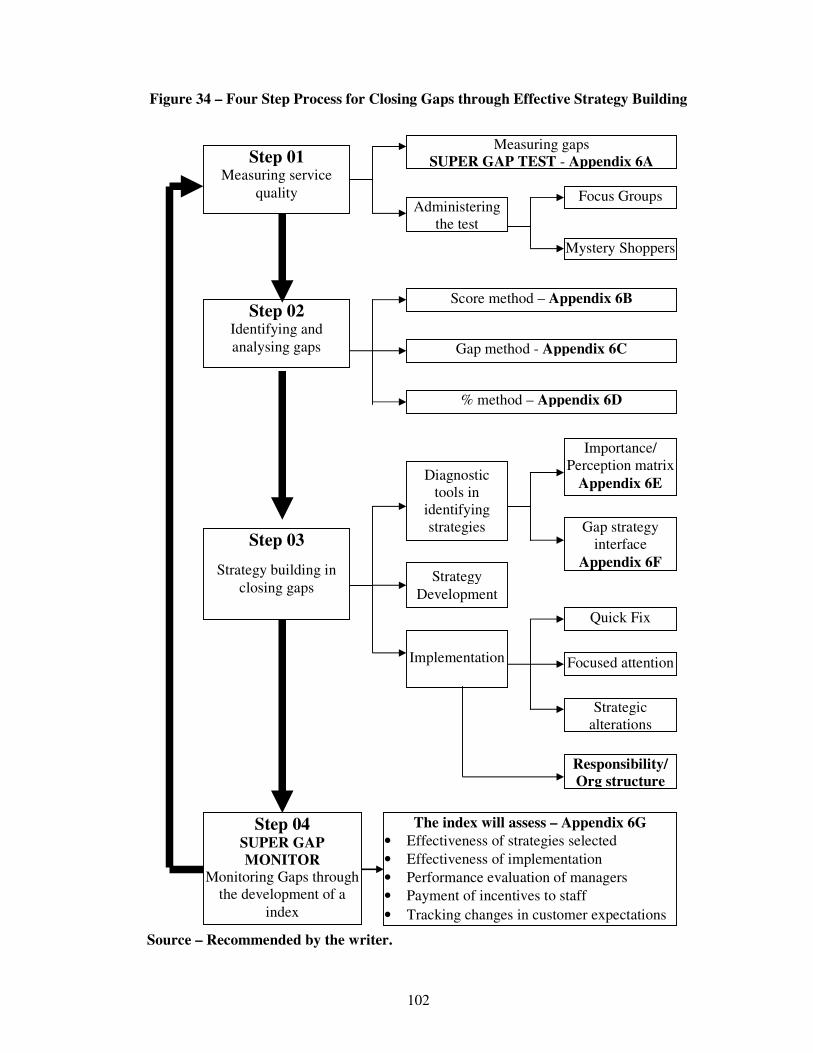
102
Figure 34 – Four Step Process for Closing Gaps through Effective Strategy Building
Source – Recommended by the writer.
Step 01 Measuring service
quality
Measuring gaps
SUPER GAP TEST - Appendix 6A
Administering
the test
Focus Groups
Mystery Shoppers
Step 02 Identifying and
analysing gaps
Score method – Appendix 6B
Gap method - Appendix 6C
% method – Appendix 6D
Step 03
Strategy building in
closing gaps
Diagnostic
tools in
identifying
strategies
Importance/
Perception matrix
Appendix 6E
Gap strategy
interface
Appendix 6F
Implementation
Quick Fix
Focused attention
Strategic
alterations
Responsibility/
Org structure
Step 04 SUPER GAP
MONITOR
Monitoring Gaps through
the development of a
index
The index will assess – Appendix 6G
• Effectiveness of strategies selected
• Effectiveness of implementation
• Performance evaluation of managers
• Payment of incentives to staff
• Tracking changes in customer expectations
Strategy
Development
103
3. Step one -Measuring Service Quality/Product Quality & Price Gaps
(i) SUPER GAP TEST
The writer is proposing the use of the above measurement tool in measuring service,
product quality and price gaps in the FMCG supermarkets on a regular basis. This
proposed tool is presented to the reader in Appendix five A.
This test is based on the questionnaire, which was presented in appendix two B in this
research. All the dimensions used to measure service, product and price are presented in a
concise format. The expectations and perceived performances are measured on a scale of
one to seven where one would be for extremely low scores and seven for extremely high
scores. The SUPER GAP TEST comes with a covering sheet giving guidelines to in
filling it. One additional feature that is found in this test is where the respondents are
requested to include comments. This would help the supermarkets to capture any
important qualitative information which otherwise would not.
Overall scales on satisfaction with service quality, product quality and price paid and
satisfaction in shopping in supermarkets has been omitted from the super gap test, as they
were relevant for the research only. If a supermarket wishes, they may include those
scales as well. Also supermarkets could also include other variables, as they desire
without making the questionnaire too long and complicated.
(ii) Administering the Test
It was stated under the limitations that administering the test by an interviewer
speaking to customers on the supermarket floor could lead to problems such as lack of
interest and time constraints by the customer limiting the effectiveness of the test. This
might lead to incomplete questionnaires and even at times bias answers by customers. In
order to avoid this, it is suggested that the test be carried out either in focus group studies
or in a mystery shopper’s programme. While focus group studies would be intense, the
representativeness and the in-store shopping experiences may be compromised. The best
method would be to administer this as a mystery shopper programme. This is practical as
S1 & S2 supermarkets at present have a very strong mystery shopper programme in place.

104
The test needs to be carried out for each outlet individually as target market distribution is
based on areas and especially service dimensions would be very much different from
outlet to outlet.
Ideally a sample of 35-40 mystery shoppers per outlet would be a fairy good sample.
Mystery shopper could be an existing customer who visits a particular supermarket outlet
on a frequent basis. It would be ideal if the test could be carried out once in two months
as any period shorter than this would lead to a higher costs and a period longer than this
might not show changes over time. The instruction sheet states the expectations of all the
dimensions to be marked before the mystery shopper goes into the supermarket. This is
strongly recommended; other wise expectations may be influenced by in store influences.
Based on all of the above, the following would be a summary in administering the test.
Tool to measure gaps SUPER GAP TEST
Data collection Mystery shopper programme
Data collected for Each outlet individually
Frequency Once in two months
Sample size Ideal if around 35-40 respondents per outlet
Sample selection Select frequent customers and tie them up for some benefit. The
majority should represent the target market. One can rotate the
sample every year to maintain expectations while this would
reflect changes in perceived performances through strategy
alterations.
Completing the tool Expectations to be indicated before visiting the outlet.
Experiences to be filled while shopping or immediately after
4. Step Two - Identifying gaps
The writer is proposing three levels in identifying and quantifying gaps that were
measured. They are as follows.
(i) Score Method in Identifying the Gaps.
The reader is requested to refer appendix five B for the presentation of gaps using the
score method for one of the supermarkets which was measured in the survey. As per
appendix five B, you may note that average scores of all the respondents for expectations
and perceived performances for each service, product and price dimension is added and
presented. These scores are presented separately for physical aspects, reliability, personal
105
interaction, overall service quality, product quality and prices. For each of them under the
total scores you will find a figure called ideal score. This is the sum total of the average
expectations for each of the dimensions. The third row is a proportionate score where the
sum total of average perceived performances are weighted against the sum total of
average expectations and presented as a percentage.
For example for physical aspects the sum total of the average expectations are 24.75
points. ( out of a maximum of 28 points = 7 points x 4 statements in physical aspects).
However the sum total of average perceived performances are 19.68 points (out of a
maximum of 28 points = 7 points x 4 statements in physical aspects). The proportionate
score would be where average perceived performance divided by average expectation
(ideal score) as a percentage. This is 79% (16.68/24.75 as a %) of the average
expectations was represented by the overall perceived performance of the service for that
dimension. The above system will indicate the relative behaviour of expectations and
perceived performances showing that the latter has fallen short of expectations giving
supermarkets a clear idea of its standing on service quality, product quality and prices
paid.
(ii) Gap Method.
The reader is requested to refer to appendix five C 1 and C2 to get an insight of this
method. In this method the average expectations, perceived performances and the gap
across all respondents for each dimension is presented graphically in a line chart. This
method will clearly show the comparative expectations across dimensions where one can
judge the importance of certain dimensions than others and gaps are presented very
clearly. The red line will show the negative gaps (perceived performance<expectation)
and when it turns green it will indicate a positive gap. (Perceived
performance>expectation)
(iii) Percentage Method.
Through this method we will further quantify the gaps identified above. Please refer
appendix 5D1 for this method. Here each degree of the gap is presented as a percentage
for each dimension of all respondents. The intensity of the gap could be identified here.
You may see in appendix 5D2 for stock availability, helpfulness & polite staff the
negative gaps are 100%.
106
5. Step three – Strategy Building in Closing Gaps in Service, Product and in Prices.
Step three needs to be evaluated through a further two sub steps. They are as follows.
(i) Diagnostic Tools in Identifying Strategies to Close Gaps
Two following two tools are recommended for supermarkets to use as diagnostic tools
in selecting strategies for different gaps. They are
a) Importance perception matrix - This tool helps the supermarket to identify the
importance of each of the dimensions to the customer vs. their present perceived
performance. The reader is requested to refer appendix five E1 to E4. Service, product
quality and price dimensions are plotted in a matrix using their importance vs. there
perceived performance. The expectation captured in the SUPER GAP TEST would be
the importance dimension, which is ranging from one (low) to seven (high). Perceived
performance also moves on a similar line. Based on these four situations the importance
perception matrix could be presented as follows.
Quadrant one. High importance and high perceived performance will dictate a
competitive strength situation. Supermarkets should maintain or improve them further.
Quadrant two. High importance and low perceived performance will indicate a
competitive vulnerable situation. A supermarket will need to improve these dimensions.
Quadrant three. Low importance and high-perceived performance would be an
irrelevant superiority. The supermarket is good in areas where the customer does not
seem to identify as important. One may continue with very low effect.
Quadrant four. Low importance and low perceived performance – Relative indifferent
situation where effort needs to be reduced.
You may note that as per appendix E1, outlet design, stock availability, accurate billing
and short waiting time, which is important dimensions to the customers, are performing
low. If these are not rectified, the supermarket may loose customers to other
supermarkets. Similarly information on sales promotions and individual attention were
not important to customers but the supermarket has done well in those areas. Maintaining
them without effort and cost is desirable. All other variables fell into the competitive
strength quadrant but based on their placing and the nature of the gap you will see that
107
helpful employees and politeness needs definite improvement although they sit in this
quadrant, which is on the edge. Appendix E2 will also show placements for product and
price statements.
You can carry this out for sub dimensions (E3) and dimensions (E4) of the SUPER GAP
TEST to check their standing. So it is vital that after testing the gaps, this matrix is
developed as you will have to address only the critical ones (competitive vulnerable)
faster in order to protect market share.
b) Service, product, price gap and strategy interface. This is yet another tool that
could be used. Once gaps and their standing in the importance perception matrix are
identified this tool will provide the supermarket which strategies that it should select to
close the gaps. This is found in appendix five F. You will notice that this interface has
married service, product and price dimensions into the retail mix strategies. In appendix
five E1, the importance perception matrix identified that stock availability was in the
competitive vulnerability quadrant. In other words stock availability was important to
customers but the perceived performance of stock availability was low. The interface
would prompt possible strategies that would effect this situation.
Merchandising mix strategies – If the supermarket is following a wide variety and
shallow assortment strategy (stock a little of every thing), then this strategy may effect
this situation.
There could be a mismatch between the display types, concept adopted; content that
could be displayed on the shelf and the customers off take. If too little stocks could be
stored in a given shelf, then constant replenishment needs to be done. Also errors in
display arrangements where products are arranged in a manner, which is not familiar
to normal practise or the typical purchasing sequence, customers may think that
stocks are not available but actually it might be in another location.
The most important contributor for stock availability could be purchasing and
ordering decisions. These may also be affected by the policies and the procedures the
supermarket may follow. Due to complicated centralised procedures there could be a
delay in the stocks being ordered.
Training of staff in handling replenishment. This could be another contributor where
although stocks are available in the showroom feeder stores, they may have not been
108
put to shelves due to lack of training in handling replenishment or due to a problem
with the structure of the staff in the store organisational structure.
So based on the existing knowledge of retail strategies, the interface gives sufficient aid
to the supermarkets to choose the correct strategy for the correct problem.
(ii) Strategy Development
Strategy development essentially deals with the selection of the retail mix in closing
the gaps. SUPER TEST measured the gaps and using the score, gap and the percentage
method, the supermarket identified the intensity of those gaps. By analysing the
importance perception matrix, the important gaps that need attention were chosen.
The interface will prompt the supermarket which retail mix strategy would deal with the
given gap. Strategy development is essentially the selection of each of these strategies and
building the retail mix. Since one gap may deal with more than one strategy the retail mix
would be an important issue.
(iii) Implementing the Strategies
Implementation is carrying out the retail mix strategies that were created in closing the
concerned gap. It is the sentiment of the writer, that different methods of implementation
are required for different gaps. They are as follows.
a) Quick fix - This is where the supermarket could quickly make alterations in its
strategies for a given gap. For example if the gap for the cleanliness is highly negative,
the management could fix this very quickly with minimum effort. These are called quick
fix solutions.
b) Focused attention - This is where the given gap deals with a change of attitudes. For
example a negative gap on staff helpfulness, politeness, may need a focus attention of
changing them overtime with a focused training programme. Staff training could be
initiated on politeness and an incentive scheme could be proposed to motivate them. In
implementing this, management would need to focus on these issues for a period in
rectifying them.
c) Strategic alterations - This deals with implementing strategies that may have a
significant impact on cost. For example a problem with location, outlet design, or car

109
parking may need a quite an investment to rectify. These needs could be considered as
more strategic or long-term alterations to the retail strategies.
d) Organisational structural support - In this section the writer wishes to make
recommendations about the supermarket organisational structure in measuring service,
product quality and price gaps and carrying out or supporting the function of the entire
four step process approach as suggested.
Out of the five supermarkets that were studied in chapter four, Cargills, Keells and Arpico
had soughed the assistance of market research agencies in measuring gaps. In the case of
Arpico, it was co-ordinated by the training manager, at Keells by the operations unit and
at Cargills by the marketing department. In all three situations, service quality was
measured by people who were directly involved with the operations to some extent. In the
next section the writer would propose the use of these measures to be linked to
performance evaluation.
Keeping all this in mind the writer wishes to propose the establishment of a new position
in the supermarket, giving the sole responsibility to measure, analyse gaps, use of
strategic tools, and monitoring the progress of customer feedback on service, product
quality and satisfaction with prices paid. This position needs to report directly to the
general manager or the managing director by passing other levels to avoid any influences
on the outcome. If there is already a research unit, then this person could be a part of it.
This position to be designated as “Manager, Service Development”. If the supermarket
seeks the assistance of an agency, then an executive position would be sufficient while if
there is a cost issue in working with agencies, a managerial position with two supporting
staff may be adequate for the job fulfilment.
This individual or the unit will be responsible for
i) Refining the SUPER GAP TEST on a periodical basis to suite the expectations of
the customers and the organisation
ii) Carrying out the mystery shopper programme
iii) Analysing the data and identifying the gaps
iv) Presenting them to operations management and the merchandising teams
v) Developing the diagnostic tools
110
vi) Co-ordinating with the respective units in identifying strategies.
vii) Calculating the index and presenting its finding on a periodical basis.
With this independent unit, the effectiveness of the whole process could be augmented
and the supermarket will be able to achieve a competitive edge in its performance.
6. Step 04 - Monitoring the Progress and Continuous Evaluation
In most organisations, although strategies are identified, problems of poor
implementation would deprive the organisation to achieve its desired results. In order to
avert such a situation, the writer wishes to propose the development of an index to
monitor few aspects of service, product quality and satisfaction with prices overtime. The
reader is requested to refer appendix five G for the proposed index. It is called the super
gap monitor. The super gap monitor comes with several indices.
Super gap physical index – This index monitors the changing attributes of expectations
and perceived performances of customers overtime of physical aspects of service. This
would be very useful for supermarket designing and new outlet planning.
Super gap staff index - This index monitors the changing attributes of expectations and
perceived performance of customers on the reliability and personal interaction aspects of
service. These are coupled together as both of these attributes mainly deal with
performance of staff.
Super gap SQ index – This would be the index to monitor the service quality changes in
the supermarkets. This would be an outcome of the above two indices.
Super gap PQ index – This index monitors the changes in product quality over time.
Super gap PP index – This index will deal with the changes in gaps in prices paid.
Super gap TOTO index – This would a total index for that supermarket under
consideration. This would be an out come of SQ, PQ and the PP indices.
The methodology in calculating the indices are explained as follows. (Appendix five G)
Data for February are actual figures based on the survey results. Data for April 2003 &
June 2003 are example figures used in explaining the building of the indices.
111
Each index is calculated with the aid of two sub indices.
Sub index A will check the expectations of the customer on the relevant index attribute
under discussion. February 2003 figures were taken as base figures in calculating the
index. For example for the SUPER GAP PHYSICAL INDEX, sub index A, the score is
24.75 from a maximum of 28 points. (7 points x four statements) The index is 100 since it
is the base period. For April the index has moved to 105.05 showing a 5.05% increase in
expectations of the customers. For June it has increased by 9% from the base year. It
tracks the changes in expectations over time. In order to avoid inter segment biasness’,
once the mystery shoppers are selected they could be used for a minimum period of one
year to reduce this error.
Sub index B will check the perceived performances of the customer on the relevant index
attribute under discussion. For April you may notice that the perceived performance of
SUPER GAP PHYSICAL INDEX has only changed slightly. For September it has
improved by 6%. Similarly one can track the changes of the perceived performances,
which are directly related to the implementation of strategy.
The final index is built on a proportion score between the perceived performance and the
expectation of that attribute. Because the ideal situation would be for the supermarket to
meet expectations. For February the proportion score of the physical aspects has been
79.49. (( 19.68 perceived performance/24.75 expectation) x 100). In order words the
supermarket was able to achieve a perceived performance of 79% as against its customer
expectations. This would be the base thus the index is 100. For April the final index has
deteriorated by 3.24% ( 100-96.76). If you look at it closely, this was caused because of
an increase in customer expectations by 5% and an increase in perceived performance by
around 1%. In other words this index captures the performance against expectations,
which is the core of this study.
Other indices are also based on the same principle.
The use of these indices for monitoring purposes Indices could be used to check the
effectiveness of the strategies selected to close gaps. If the strategy selected in closing the
gap does not reduce the gap between the expectation and the perceived performance, then
the effectiveness of the chosen strategy could be judged by the indices. For example if the
112
gaps in staff politeness is high and a strategy of reprimanding staff for lack of politeness
does not yield in the improvement of the index, then the strategy might not be very
effective.
These indices will also indicate the effectiveness of implementation of strategies. For
example, in cleanliness gap, if a chosen strategy yields in low scores in the index would
mean a problem of implementation.
Performance evaluation of managers could be also checked through these indices. In
evaluating the supermarket managers the SUPER GAP TOTO INDEX for each outlet
could be used. In evaluating performance of operations managers, a composite of the
TOTO index for all outlets could be tabulated. In evaluating the performance of the
merchandising teams, a composite index for SUPER GAP PQ and PP indices could be
used.
Paying staff incentives could be based on the SUPER GAP STAFF INDEX. A minimum
basis could be established and based on the movement of the index their incentives could
be calculated. This would promote team performance and put pressure on non-
performers.
Finally these indices could be used to monitor changes in customer attributes and the
changing importance of various dimensions overtime prompting changes to long-term
strategies.
7. Overall Strategies for Supermarkets based on Research Findings.
In our study we concluded that behaviour of service quality, product quality and prices
paid on overall satisfaction was dependent on different supermarket segments. The writer
wishes to propose two generic strategies for the two basic segments that were identified in
the study. These are borrowed from Michael Porter and adopted to the supermarket
situations. They are as follows
(i) Value Focus Strategies
Value focus strategies are suggested for more price elastic supermarket segments. Here
supermarkets, which primarily cater to price elastic segments, will need to be low cost
operators. By focusing on these supermarkets will be in a position to offer high value for
113
money to their customers. High value does not essentially mean giving the lowest prices.
The writer suggests different methods in practising these.
Loyalty programmes attached by price benefits through a points accumulating scheme.
Supermarkets could offer a loyalty card for each customer and let points be accumulated
based on the frequency of visit and average basket value. These accumulated points
would allow customers in getting discounted prices during seasonal periods.
Supermarkets would not loose net profits as reduce margins on products during seasonal
periods will be offset by high turnover.
Best buy offers. Supermarkets have quite a lot of opportunities to offer best buys.
Permanent banded offer counters initiated by the supermarkets could increase the value to
the customers. These should not be seasonal or temporary, but should be permanent.
One-price, items are another value offer where the supermarkets offer similar products at
same prices offsetting higher margins with lower ones.
High utility low value items. Products like sugar, rice and dry rations, effective purchase
planning could give the supermarket better purchase prices. Adopting no margin or low
margin for these items will pull crowds into the outlet. The chances of them buying high
margin products are also higher balancing the overall margins.
Value focus strategies would essentially deal with the pricing and the retail sales
promotions strategies of the retail mix.
(i) Service Focus Differentiators
On the other hand, for supermarkets catering to price inelastic customers,
differentiating strategies using service quality would be most appropriate. Measuring
service quality would be extremely important to these supermarkets as we saw how a
clear differentiation could be carried out by service quality for these segments. These
supermarkets could differentiate themselves with the convenience of location,
servicescape, people and the processes that customers go through in shopping in the
supermarkets. The supermarket would ideally want them to give a unique shopping
experience with additionals such as on line ordering, telephone ordering, delivery, valiae
parking etc. Managing the moments of truths in terms of high levels of service would be
114
very important for these supermarkets. In implementing these strategies, a set of high
calibre management personnel and front line staff will have to be recruited.
8. Summary
In this chapter the writer recommended a four step process in measuring, analysing
gaps in supermarkets in building strategies to close gaps and ensuring effective
implementation and monitoring overtime. The recommendations made would certainly be
useful for all supermarkets, which sell FMCG products in Sri Lanka thus enhancing
shopping experience of supermarket customers. The effectiveness of the
recommendations would also be useful in grabbing market share from other retail formats
which still tends to dominate the FMCG products market as well as grabbing share from
other supermarkets which may not carryout such an exercise. Also the above exercise
would help the reduction of switching between supermarkets and the creation of a loyal
group of customers.
This chapter also discussed two generic strategies for the two supermarket segments
identified in the research study.
The conclusion of this chapter would fulfil the final objective set for this study in terms of
making strategy recommendations in closing gaps in supermarkets with the idea of
enhancing the overall customer satisfaction. The writer would like to make an appeal to
all supermarkets to engage in the above process thus the overall satisfaction levels of the
Sri Lankan supermarket consumer could be increased leading to an increase in the quality
of life.
115
Appendix I - A
Report of the Pilot study to establish the research problem.
1. Objective of the pilot study
To ascertain whether there are service quality gaps in the supermarket retailing
industry in Sri Lanka.
2. Scope
As per the objective, the aim of the pilot study was to see whether there are service
quality gaps in the supermarket retailing industry in Sri Lanka and if so to ascertain the
nature of this gap. This pilot study does not intend to study relationship between service
quality and customer satisfaction. It would try to quantify the service quality gaps in a
selected sample of supermarkets which sell FMCG products.
3. Methodology
(i) Model
The pilot study was based on a similar research carried out in Spain, which tried to
measure service quality in the supermarket retailing industry using a scale called
CALSUPER, which had been adopted from the SERVQUAL scale. It is important to
highlight that although some of the sub dimensions used to measure service quality in
CALSUPER was used for the pilot study, the objective was NOT to measure service
quality it self but only to see nature of the service quality gaps.
Some of the service dimensions used in the “CALSUPER” technique were used for the
pilot study. Three service dimensions (out of the four used in CALSUPER) were used
for the pilot study. These are Personal Interaction, Physical Aspects and Reliability. All
sub dimensions under the above three service dimensions were used while adopting
some of the sub dimensions to suite the Sri Lankan scenario as per the researchers
understanding. Dimensions used are as follows.
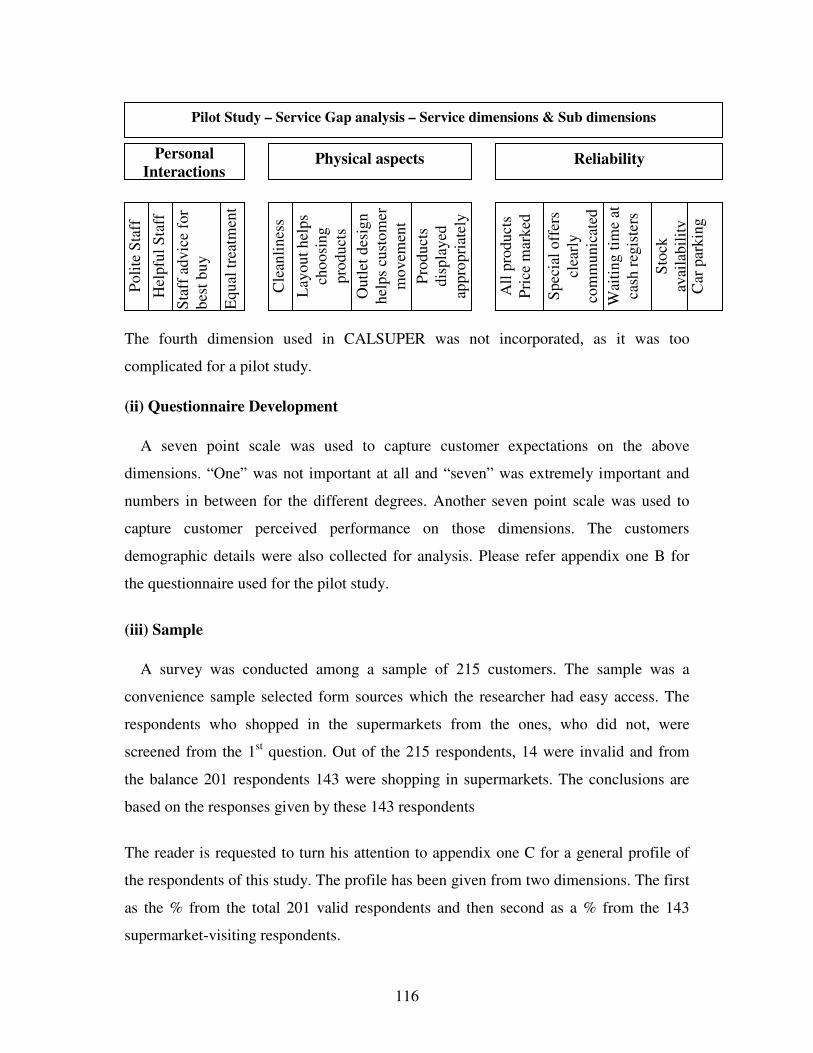
116
The fourth dimension used in CALSUPER was not incorporated, as it was too
complicated for a pilot study.
(ii) Questionnaire Development
A seven point scale was used to capture customer expectations on the above
dimensions. “One” was not important at all and “seven” was extremely important and
numbers in between for the different degrees. Another seven point scale was used to
capture customer perceived performance on those dimensions. The customers
demographic details were also collected for analysis. Please refer appendix one B for
the questionnaire used for the pilot study.
(iii) Sample
A survey was conducted among a sample of 215 customers. The sample was a
convenience sample selected form sources which the researcher had easy access. The
respondents who shopped in the supermarkets from the ones, who did not, were
screened from the 1st question. Out of the 215 respondents, 14 were invalid and from
the balance 201 respondents 143 were shopping in supermarkets. The conclusions are
based on the responses given by these 143 respondents
The reader is requested to turn his attention to appendix one C for a general profile of
the respondents of this study. The profile has been given from two dimensions. The first
as the % from the total 201 valid respondents and then second as a % from the 143
supermarket-visiting respondents.
Pilot Study – Service Gap analysis – Service dimensions & Sub dimensions
Personal
Interactions Physical aspects Reliability
Po
lite
Sta
ff
Hel
pfu
l S
taff
Sta
ff a
dv
ice
for
bes
t b
uy
Eq
ual
tre
atm
ent
Cle
anli
nes
s
Lay
ou
t h
elp
s
cho
osi
ng
pro
du
cts
Ou
tlet
des
ign
hel
ps
cust
om
er
mo
vem
ent
pro
du
cts
P
rod
uct
s
dis
pla
yed
app
rop
riat
ely
All
pro
du
cts
Pri
ce m
ark
ed
Sp
ecia
l o
ffer
s
clea
rly
com
mu
nic
ated
Wai
tin
g t
ime
at
cash
reg
iste
rs
Sto
ck
avai
lab
ilit
y
Car
par
kin
g
117
(iv) Method of analysis
The gap was arrived at by reducing the score on perceived performance from the
score on expectations The following would interpret the three gaps
Negative gap – Perceived performance fell short of the expectations
( Perceived performance < Expectation )
No gap – Perceived performance was equal to the expectations
( Perceived performance = Expectation)
Positive gap – Perceived performance was higher than the expectations.
( Perceived performance > Expectation)
A percentage was arrived at from the total respondents for each of these scores ( 143 )
and the final scores were arrived as a average of that.
4. Discussion of findings
From the total 143 respondents , 46% visited Cargills , 21% visited Keels Supper ,
6% visited Arpico supermarket , 3% Sathosa , 2% Bahira , 1%, Park and shop , 10%
was other regional supermarkets & 11% did not respondent to this question.
Appendix one D will give the reader the findings on the nature of the gaps of service
quality in the supermarket retailing industry in Sri Lanka.
As you may see for all the 13 sub dimensions, there is a negative service quality gap in
the Sri Lankan supermarket retailing industry. As an average 59% of the respondents
felt that there expectations of the service was not met with the perceived performance of
service they experienced. For certain sub dimensions, the negative service quality gap
was over 70% while for others it was low as 46%.
An average of 32% of the respondents felt that their expectations were met by the
perceived performances while only 6% on average felt that their perceived
performances of service quality exceed their expectation.
118
5. Limitations of the pilot study
If you turn your attention to Appendix one C of this report once again, you would
notice that 79% from the total valid respondents were between 20 to 30 years. The
sample is very much biased on the general opinions of this age category.
Also 44% from the total valid respondents were from very junior grades in terms of
their employment level. This might not be a major impeding factor as it was observed
that among the senior management levels the negative gap was even higher. So if the
sample weight were more towards the senior management there would still be enough
evidence to show even higher levels of negative service quality gaps. One possible
reason could be that their expectations being higher than the junior grades.
Also another limitation is that 66% from the total valid respondents were males.
However from the total supermarket shoppers this had come down to 56%.
Also the sample chosen was a convenience sample and may not represent the total view
of the entire supermarket customer’s opinion.
6. Conclusions
So on the whole, the results of the pilot study gives indicates that there is service
quality gap in the supermarket retailing industry in Sri Lanka. Out of these gaps
identified on several service quality dimensions, the majority of the respondents seem to
be having a negative service quality gap (where there perceived performance of the
service quality had fallen short of their expectations) giving evidence to the existence of
the problem stated.
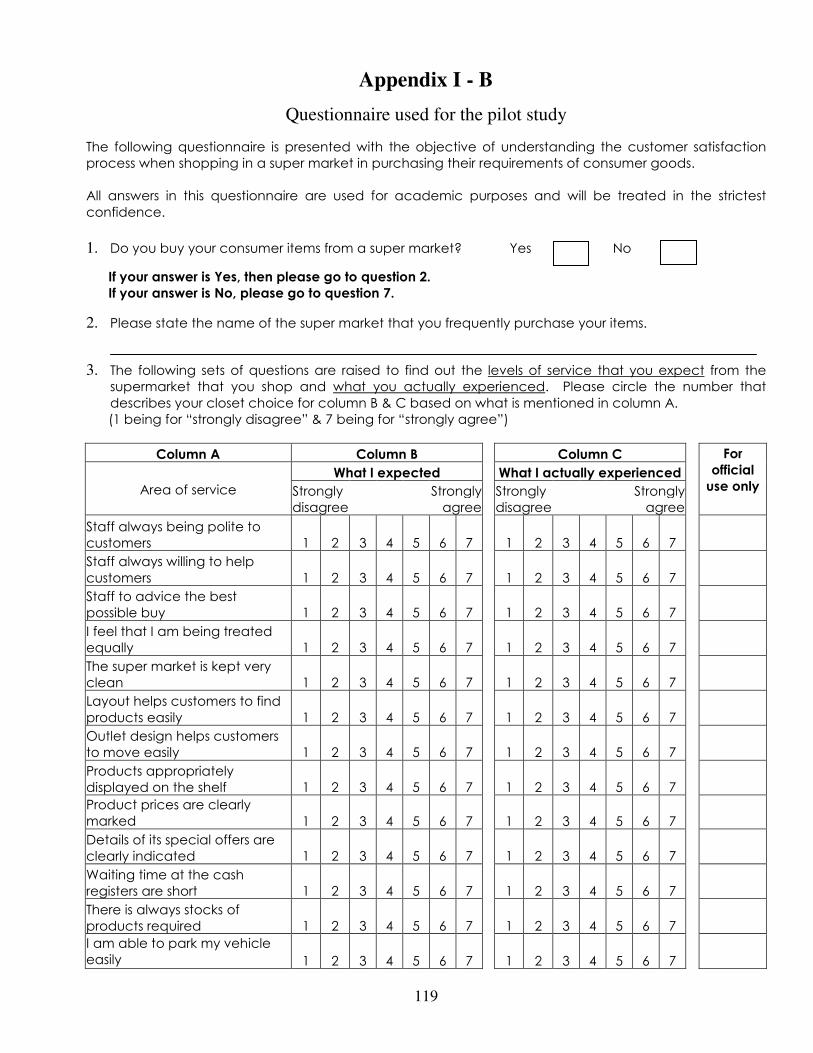
119
Appendix I - B
Questionnaire used for the pilot study
The following questionnaire is presented with the objective of understanding the customer satisfaction
process when shopping in a super market in purchasing their requirements of consumer goods.
All answers in this questionnaire are used for academic purposes and will be treated in the strictest
confidence.
1. Do you buy your consumer items from a super market? Yes No
If your answer is Yes, then please go to question 2.
If your answer is No, please go to question 7.
2. Please state the name of the super market that you frequently purchase your items.
3. The following sets of questions are raised to find out the levels of service that you expect from the supermarket that you shop and what you actually experienced. Please circle the number that
describes your closet choice for column B & C based on what is mentioned in column A.
(1 being for “strongly disagree” & 7 being for “strongly agree”)
Column A Column B Column C For
official
use only Area of service
What I expected What I actually experienced
Strongly
disagree
Strongly
agree
Strongly
disagree
Strongly
agree
Staff always being polite to
customers 1 2 3 4 5 6 7 1 2 3 4 5 6 7
Staff always willing to help
customers 1 2 3 4 5 6 7 1 2 3 4 5 6 7
Staff to advice the best
possible buy 1 2 3 4 5 6 7 1 2 3 4 5 6 7
I feel that I am being treated
equally 1 2 3 4 5 6 7 1 2 3 4 5 6 7
The super market is kept very
clean 1 2 3 4 5 6 7 1 2 3 4 5 6 7
Layout helps customers to find
products easily 1 2 3 4 5 6 7 1 2 3 4 5 6 7
Outlet design helps customers
to move easily 1 2 3 4 5 6 7 1 2 3 4 5 6 7
Products appropriately
displayed on the shelf 1 2 3 4 5 6 7 1 2 3 4 5 6 7
Product prices are clearly
marked 1 2 3 4 5 6 7 1 2 3 4 5 6 7
Details of its special offers are
clearly indicated 1 2 3 4 5 6 7 1 2 3 4 5 6 7
Waiting time at the cash
registers are short 1 2 3 4 5 6 7 1 2 3 4 5 6 7
There is always stocks of
products required 1 2 3 4 5 6 7 1 2 3 4 5 6 7
I am able to park my vehicle
easily 1 2 3 4 5 6 7 1 2 3 4 5 6 7
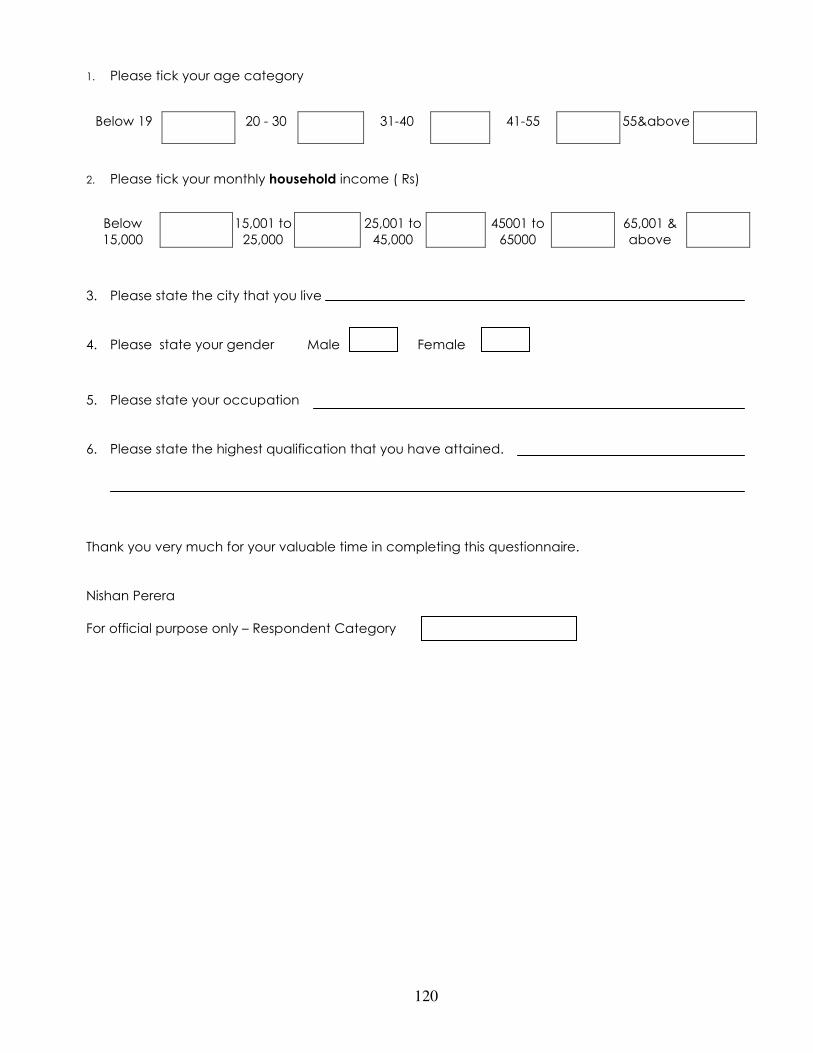
120
1. Please tick your age category
Below 19 20 - 30 31-40 41-55 55&above
2. Please tick your monthly household income ( Rs)
Below
15,000
15,001 to
25,000
25,001 to
45,000
45001 to
65000
65,001 &
above
3. Please state the city that you live
4. Please state your gender Male Female
5. Please state your occupation
6. Please state the highest qualification that you have attained.
Thank you very much for your valuable time in completing this questionnaire.
Nishan Perera
For official purpose only – Respondent Category
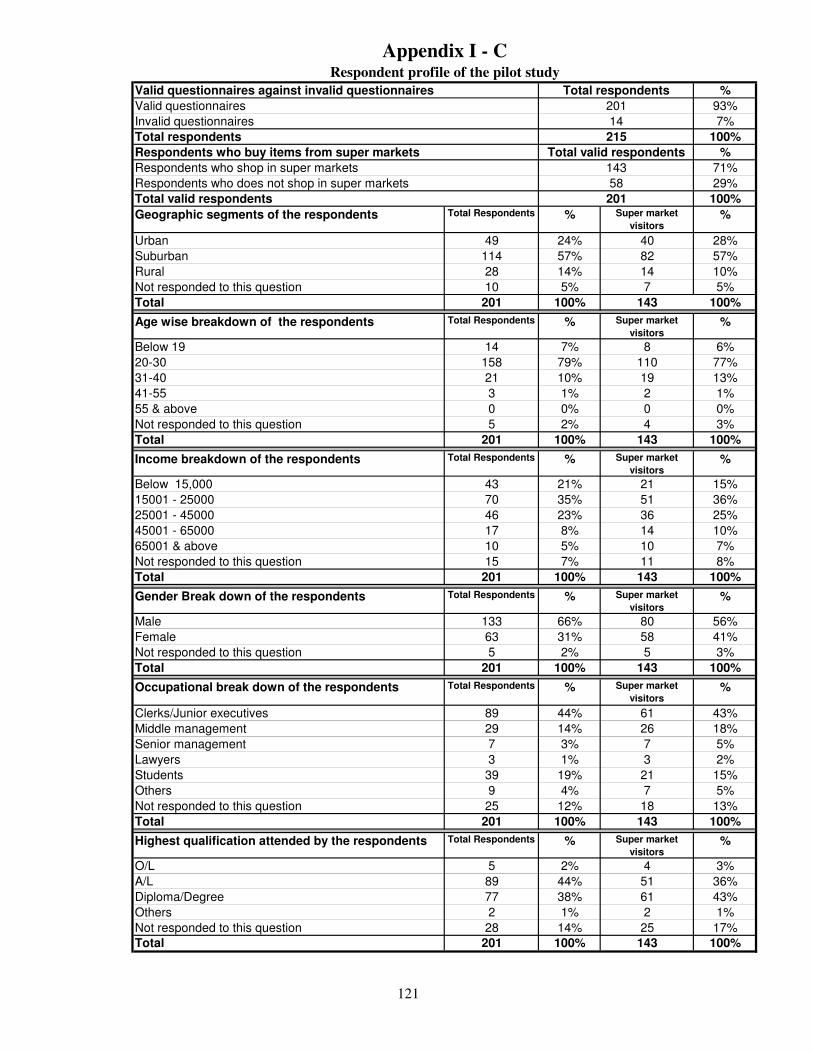
%
93%
7%
100%
%
71%
29%
100%
Geographic segments of the respondents Total Respondents % Super market
visitors%
Urban 49 24% 40 28%
Suburban 114 57% 82 57%
Rural 28 14% 14 10%
Not responded to this question 10 5% 7 5%
Total 201 100% 143 100%
Age wise breakdown of the respondents Total Respondents % Super market
visitors%
Below 19 14 7% 8 6%
20-30 158 79% 110 77%
31-40 21 10% 19 13%
41-55 3 1% 2 1%
55 & above 0 0% 0 0%
Not responded to this question 5 2% 4 3%
Total 201 100% 143 100%
Income breakdown of the respondents Total Respondents % Super market
visitors%
Below 15,000 43 21% 21 15%
15001 - 25000 70 35% 51 36%
25001 - 45000 46 23% 36 25%
45001 - 65000 17 8% 14 10%
65001 & above 10 5% 10 7%
Not responded to this question 15 7% 11 8%
Total 201 100% 143 100%
Gender Break down of the respondents Total Respondents % Super market
visitors%
Male 133 66% 80 56%
Female 63 31% 58 41%
Not responded to this question 5 2% 5 3%
Total 201 100% 143 100%
Occupational break down of the respondents Total Respondents % Super market
visitors%
Clerks/Junior executives 89 44% 61 43%
Middle management 29 14% 26 18%
Senior management 7 3% 7 5%
Lawyers 3 1% 3 2%
Students 39 19% 21 15%
Others 9 4% 7 5%
Not responded to this question 25 12% 18 13%
Total 201 100% 143 100%
Highest qualification attended by the respondents Total Respondents % Super market
visitors%
O/L 5 2% 4 3%
A/L 89 44% 51 36%
Diploma/Degree 77 38% 61 43%
Others 2 1% 2 1%
Not responded to this question 28 14% 25 17%
Total 201 100% 143 100%
Appendix I - C
Valid questionnaires against invalid questionnaires
Valid questionnaires
58Respondents who does not shop in super markets
Total valid respondents
Total respondents
201
14
215
143
Respondents who buy items from super markets
Respondents who shop in super markets
Respondent profile of the pilot study
Invalid questionnaires
Total respondents
Total valid respondents
201
121
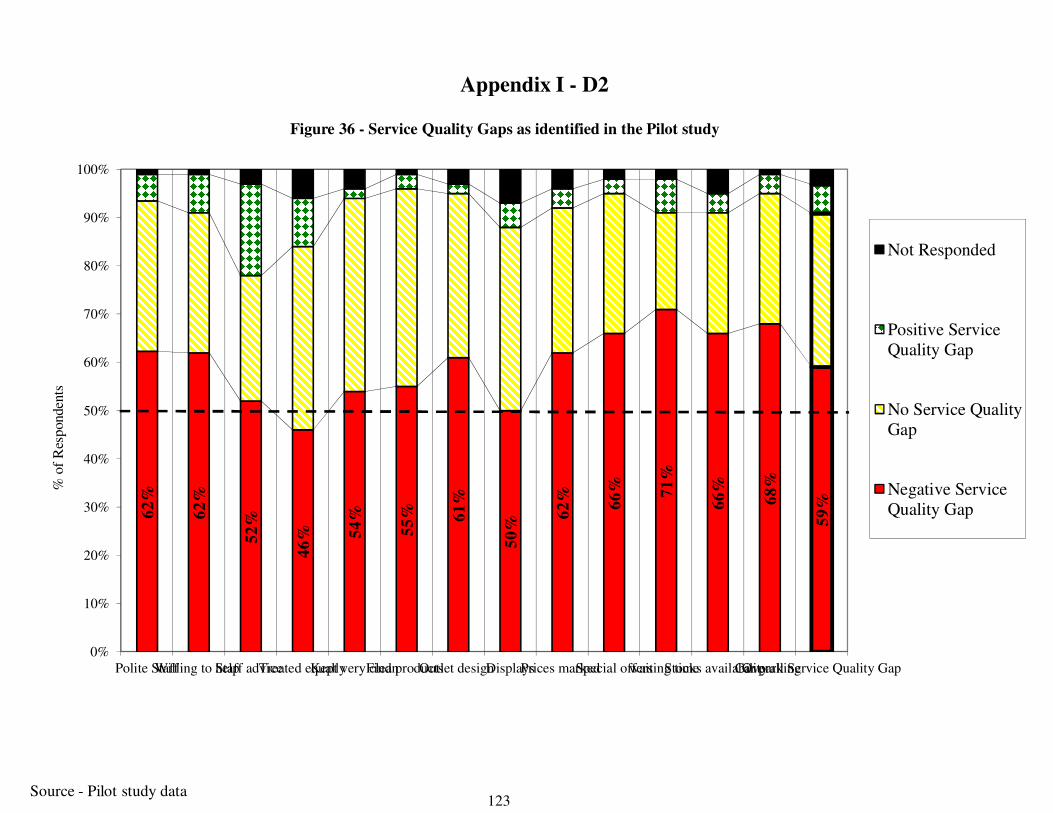
134
62
%
62
%
52
%
46
% 54
%
55
% 61
%
50
%
62
%
66
% 71
%
66
%
68
%
59
%
0%
10%
20%
30%
40%
50%
60%
70%
80%
90%
100%
Polite StaffWilling to helpStaff adviceTreated equallyKept very cleanFind productsOutlet designDisplaysPrices markedSpecial offerswaiting timeStocks availabilityCar parkingOverall Service Quality Gap
% o
f R
esponden
ts
Figure 36 - Service Quality Gaps as identified in the Pilot study
Not Responded
Positive Service
Quality Gap
No Service Quality
Gap
Negative Service
Quality Gap
Source - Pilot study data
Appendix I - D2
123
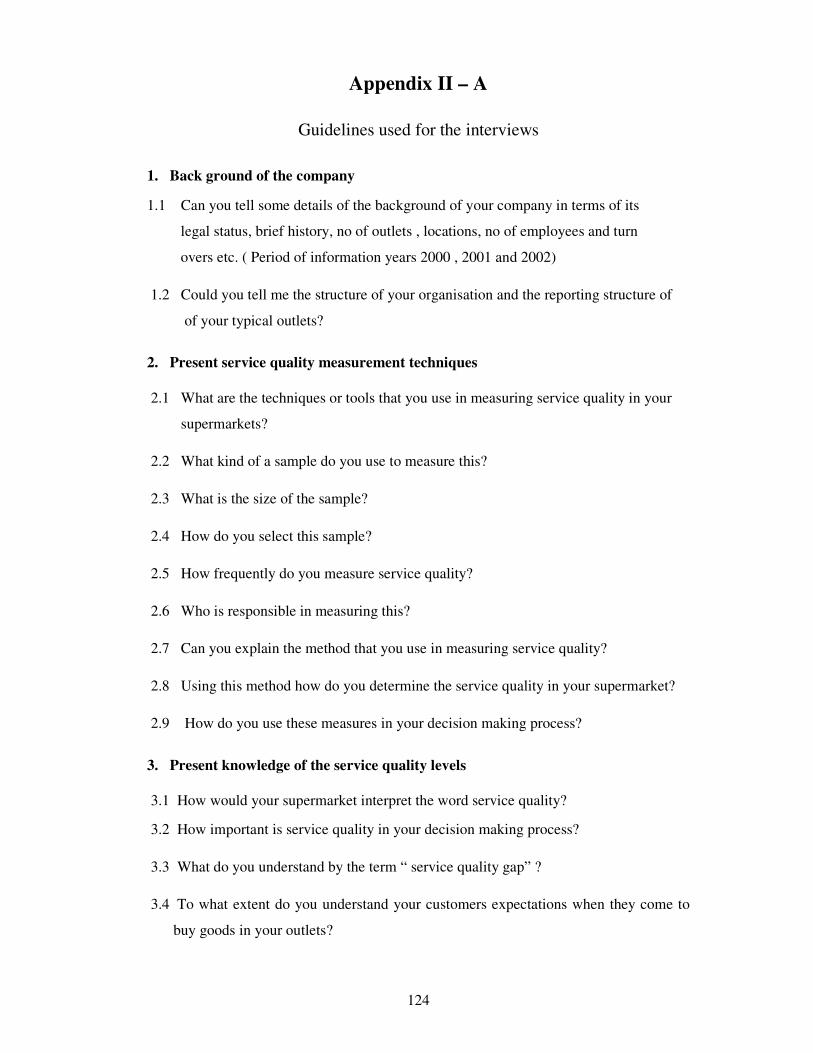
124
Appendix II – A
Guidelines used for the interviews
1. Back ground of the company
1.1 Can you tell some details of the background of your company in terms of its
legal status, brief history, no of outlets , locations, no of employees and turn
overs etc. ( Period of information years 2000 , 2001 and 2002)
1.2 Could you tell me the structure of your organisation and the reporting structure of
of your typical outlets?
2. Present service quality measurement techniques
2.1 What are the techniques or tools that you use in measuring service quality in your
supermarkets?
2.2 What kind of a sample do you use to measure this?
2.3 What is the size of the sample?
2.4 How do you select this sample?
2.5 How frequently do you measure service quality?
2.6 Who is responsible in measuring this?
2.7 Can you explain the method that you use in measuring service quality?
2.8 Using this method how do you determine the service quality in your supermarket?
2.9 How do you use these measures in your decision making process?
3. Present knowledge of the service quality levels
3.1 How would your supermarket interpret the word service quality?
3.2 How important is service quality in your decision making process?
3.3 What do you understand by the term “ service quality gap” ?
3.4 To what extent do you understand your customers expectations when they come to
buy goods in your outlets?
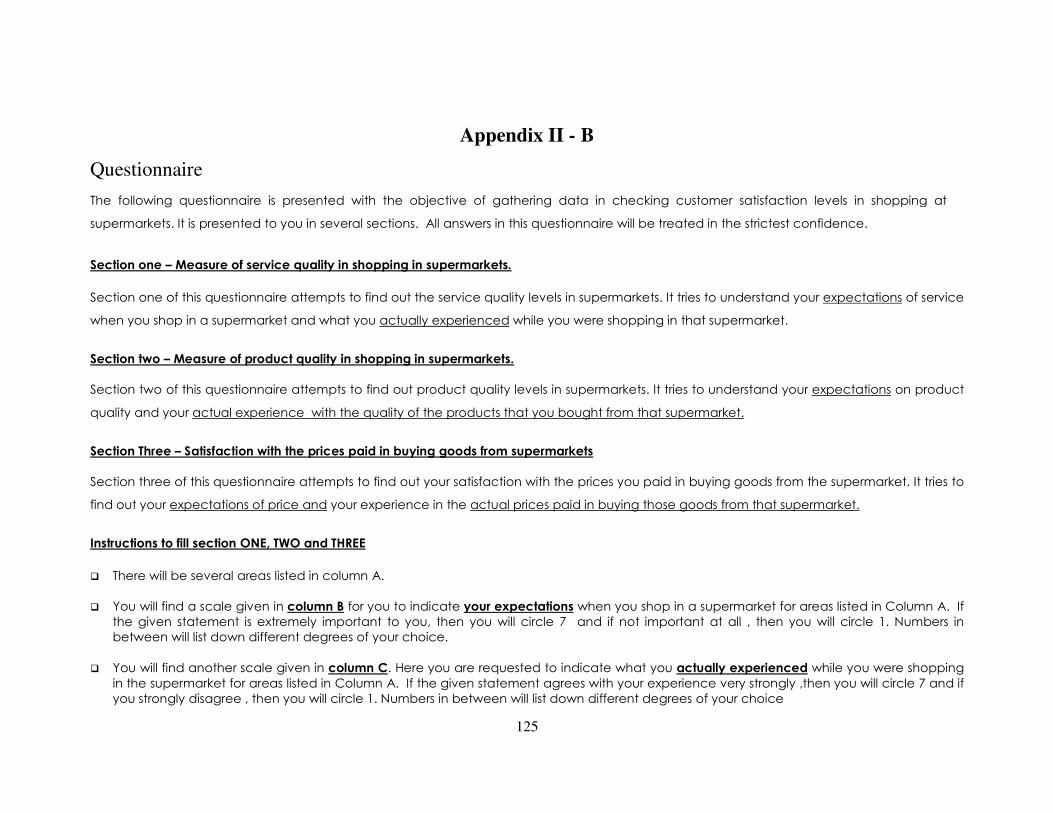
125
Appendix II - B
Questionnaire
Section one – Measure of service quality in shopping in supermarkets.
Section one of this questionnaire attempts to find out the service quality levels in supermarkets. It tries to understand your expectations of service
when you shop in a supermarket and what you actually experienced while you were shopping in that supermarket.
Section two – Measure of product quality in shopping in supermarkets.
Section two of this questionnaire attempts to find out product quality levels in supermarkets. It tries to understand your expectations on product
quality and your actual experience with the quality of the products that you bought from that supermarket.
Section Three – Satisfaction with the prices paid in buying goods from supermarkets
Section three of this questionnaire attempts to find out your satisfaction with the prices you paid in buying goods from the supermarket. It tries to
find out your expectations of price and your experience in the actual prices paid in buying those goods from that supermarket.
Instructions to fill section ONE, TWO and THREE
� There will be several areas listed in column A.
� You will find a scale given in column B for you to indicate your expectations when you shop in a supermarket for areas listed in Column A. If
the given statement is extremely important to you, then you will circle 7 and if not important at all , then you will circle 1. Numbers in
between will list down different degrees of your choice.
� You will find another scale given in column C. Here you are requested to indicate what you actually experienced while you were shopping
in the supermarket for areas listed in Column A. If the given statement agrees with your experience very strongly ,then you will circle 7 and if
you strongly disagree , then you will circle 1. Numbers in between will list down different degrees of your choice
The following questionnaire is presented with the objective of gathering data in checking customer satisfaction levels in shopping at
supermarkets. It is presented to you in several sections. All answers in this questionnaire will be treated in the strictest confidence.
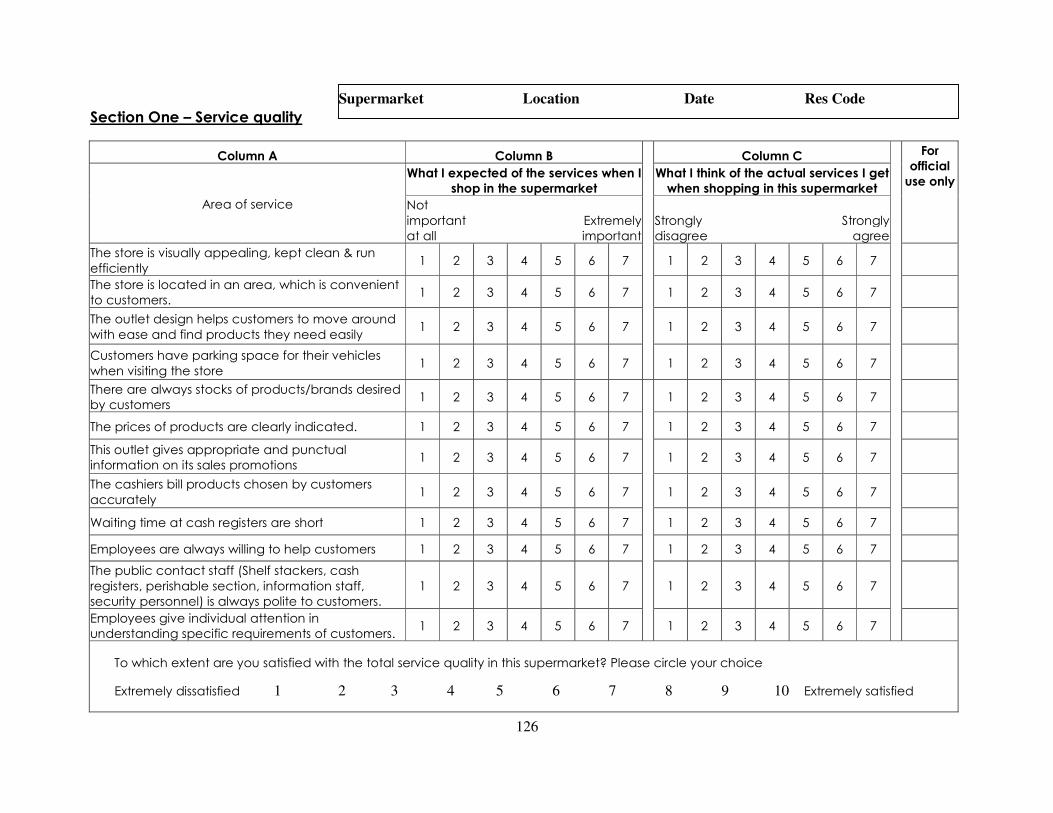
126
Section One – Service quality
Column A Column B Column C For
official
use only
Area of service
What I expected of the services when I
shop in the supermarket
What I think of the actual services I get
when shopping in this supermarket
Not
important
at all
Extremely
important
Strongly
disagree
Strongly
agree
The store is visually appealing, kept clean & run
efficiently 1 2 3 4 5 6 7 1 2 3 4 5 6 7
The store is located in an area, which is convenient
to customers. 1 2 3 4 5 6 7 1 2 3 4 5 6 7
The outlet design helps customers to move around
with ease and find products they need easily 1 2 3 4 5 6 7 1 2 3 4 5 6 7
Customers have parking space for their vehicles
when visiting the store 1 2 3 4 5 6 7 1 2 3 4 5 6 7
There are always stocks of products/brands desired
by customers 1 2 3 4 5 6 7
1 2 3 4 5 6 7
The prices of products are clearly indicated. 1 2 3 4 5 6 7 1 2 3 4 5 6 7
This outlet gives appropriate and punctual
information on its sales promotions 1 2 3 4 5 6 7 1 2 3 4 5 6 7
The cashiers bill products chosen by customers
accurately 1 2 3 4 5 6 7 1 2 3 4 5 6 7
Waiting time at cash registers are short 1 2 3 4 5 6 7 1 2 3 4 5 6 7
Employees are always willing to help customers 1 2 3 4 5 6 7
1 2 3 4 5 6 7
The public contact staff (Shelf stackers, cash
registers, perishable section, information staff,
security personnel) is always polite to customers.
1 2 3 4 5 6 7 1 2 3 4 5 6 7
Employees give individual attention in
understanding specific requirements of customers. 1 2 3 4 5 6 7 1 2 3 4 5 6 7
To which extent are you satisfied with the total service quality in this supermarket? Please circle your choice
Extremely dissatisfied 1 2 3 4 5 6 7 8 9 10 Extremely satisfied
Supermarket Location Date Res Code
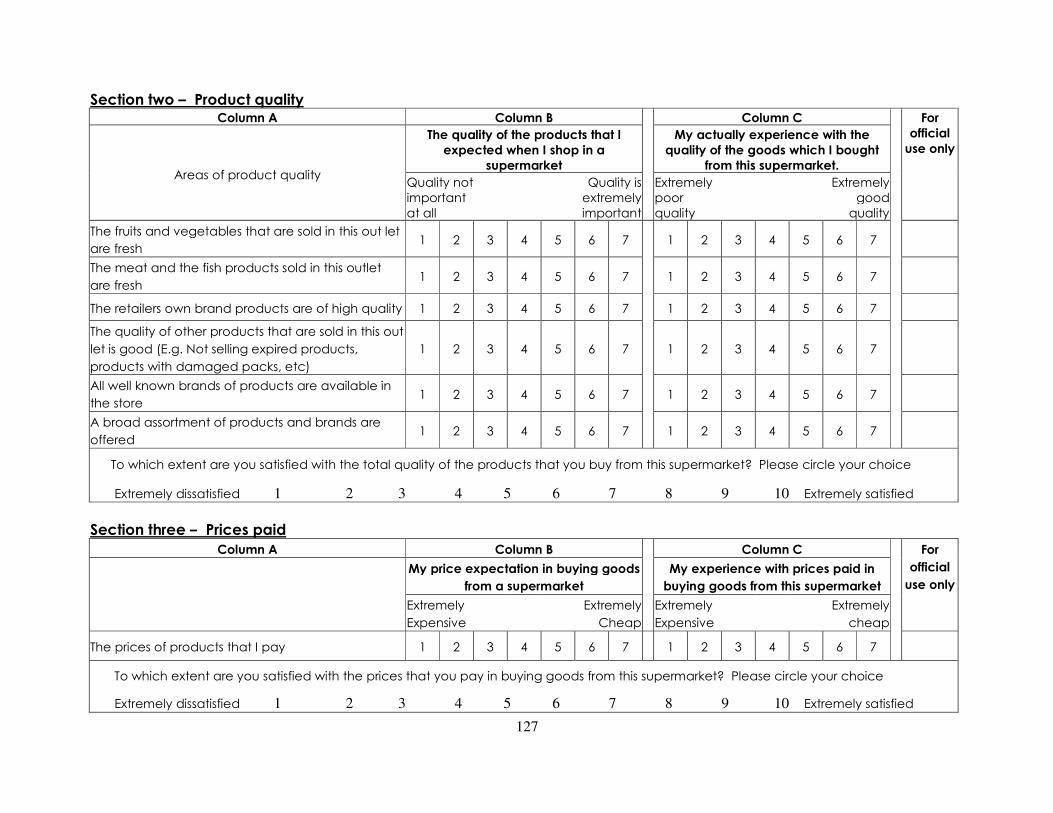
127
Section two – Product quality Column A Column B Column C For
official
use only
Areas of product quality
The quality of the products that I
expected when I shop in a
supermarket
My actually experience with the
quality of the goods which I bought
from this supermarket.
Quality not
important
at all
Quality is
extremely
important
Extremely
poor
quality
Extremely
good
quality
The fruits and vegetables that are sold in this out let
are fresh 1 2 3 4 5 6 7
1 2 3 4 5 6 7
The meat and the fish products sold in this outlet
are fresh 1 2 3 4 5 6 7 1 2 3 4 5 6 7
The retailers own brand products are of high quality 1 2 3 4 5 6 7 1 2 3 4 5 6 7
The quality of other products that are sold in this out
let is good (E.g. Not selling expired products,
products with damaged packs, etc)
1 2 3 4 5 6 7 1 2 3 4 5 6 7
All well known brands of products are available in
the store 1 2 3 4 5 6 7 1 2 3 4 5 6 7
A broad assortment of products and brands are
offered 1 2 3 4 5 6 7 1 2 3 4 5 6 7
To which extent are you satisfied with the total quality of the products that you buy from this supermarket? Please circle your choice
Extremely dissatisfied 1 2 3 4 5 6 7 8 9 10 Extremely satisfied
Section three – Prices paid
Column A Column B Column C For
official
use only
My price expectation in buying goods
from a supermarket
My experience with prices paid in
buying goods from this supermarket
Extremely
Expensive
Extremely
Cheap
Extremely
Expensive
Extremely
cheap
The prices of products that I pay 1 2 3 4 5 6 7 1 2 3 4 5 6 7 To which extent are you satisfied with the prices that you pay in buying goods from this supermarket? Please circle your choice
Extremely dissatisfied 1 2 3 4 5 6 7 8 9 10 Extremely satisfied
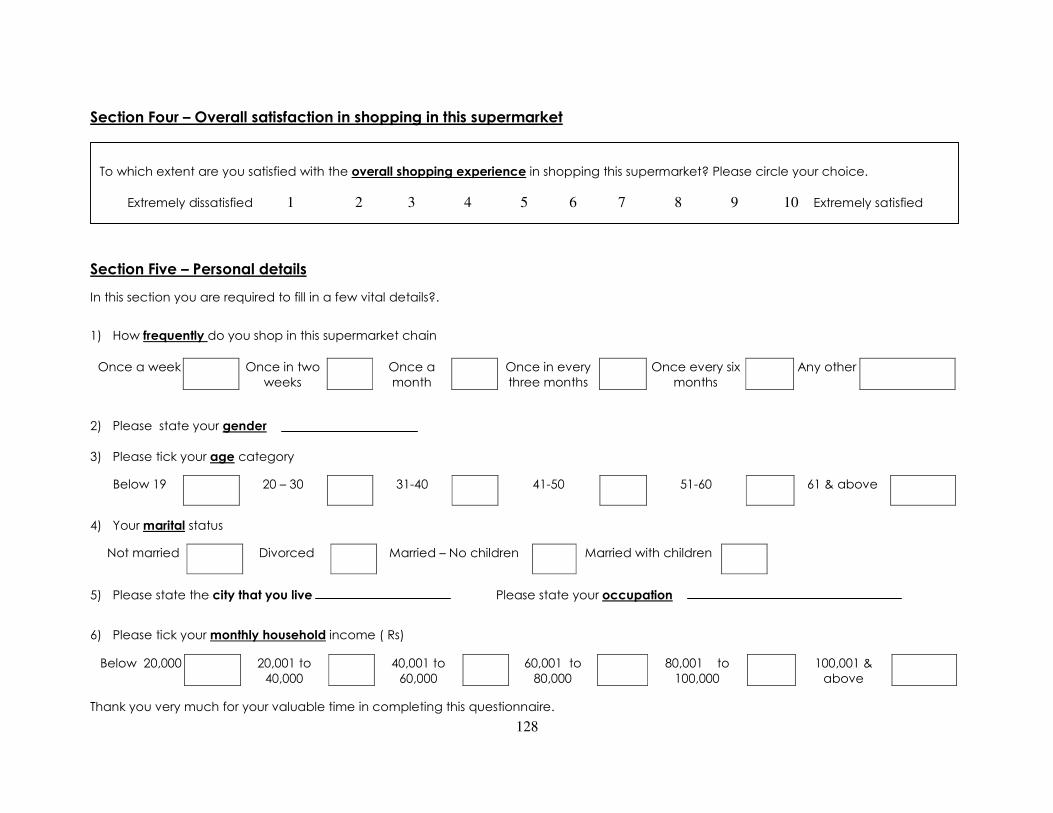
128
Section Four – Overall satisfaction in shopping in this supermarket
Section Five – Personal details
In this section you are required to fill in a few vital details?.
1) How frequently do you shop in this supermarket chain
Once a week Once in two
weeks
Once a
month
Once in every
three months
Once every six
months
Any other
2) Please state your gender
3) Please tick your age category
Below 19 20 – 30 31-40 41-50 51-60 61 & above
4) Your marital status
Not married Divorced Married – No children Married with children
5) Please state the city that you live Please state your occupation
6) Please tick your monthly household income ( Rs)
Below 20,000 20,001 to
40,000
40,001 to
60,000
60,001 to
80,000
80,001 to
100,000
100,001 &
above
Thank you very much for your valuable time in completing this questionnaire.
To which extent are you satisfied with the overall shopping experience in shopping this supermarket? Please circle your choice.
Extremely dissatisfied 1 2 3 4 5 6 7 8 9 10 Extremely satisfied

Source - by the writer based on classifications used in literature.
Figure 37 - Classification of Retail Formats in Sri Lanka
CLASSIFICATION OF RETAIL
FORMATS in Sri Lanka
Appendix III - A
Ba
se
d o
n
me
rch
an
dis
e
va
rie
ty
Ba
se
d o
n C
ore
s
erv
ice
s
Based on direct marketing
Based on operating structure
Direct response retailing
Business districts
Shopping centers
Vendor retailing
Chain stores
Based on
Departmental stores
e.g. Millers
Specialty storese.g. drug stores
Super marketse.g. Cargills , keells, etc
Super centerse.g. Arpico Supercenters
Convenience stores
e.g. various boutiques
Hyper markete.g. Majestic City
Food retailerse.g. Hotels,fast food
Transportation, communications Utility services
Finance , Real estate, insurance
Public administration
Other services
Contractual retailing
Warehouse retailing
Home centere.g.Lanka wall
tiles
Warehouse showroom
Eg Odel warehouse
Large chains
e.g Arpico
Small chains
Eg French corner
Franchiseoperation
e.g. MacDonald
Co-operativese.g. around the
island
Based on pricing of merchandise
Off price retailing
Factory out letseg DSI
One price retailers
e.g Shop 42 in Kohuwala
Independent off pricese.g disposing products of one item in
pavements
Vending machines
e.g. ATM, Nescafe
Stationary vendors e.g. Coca
Cola stands
Mobile venders
e.g. fishmen etc
Direct selling Direct mail
Internet, e-commerce e,g. Damro, internet banking by
many banksetc
Door to door sellinge.g many products
Informecialse,g, teleseen marketing
Quantum marketing
Malls e.g. Regional super markets
Plazas e.g Unity
plaza,Liberty plaza
Not practiced in Sri Lanka as yet in a
large scale.
Mannin market, Nawala tiles etc
129
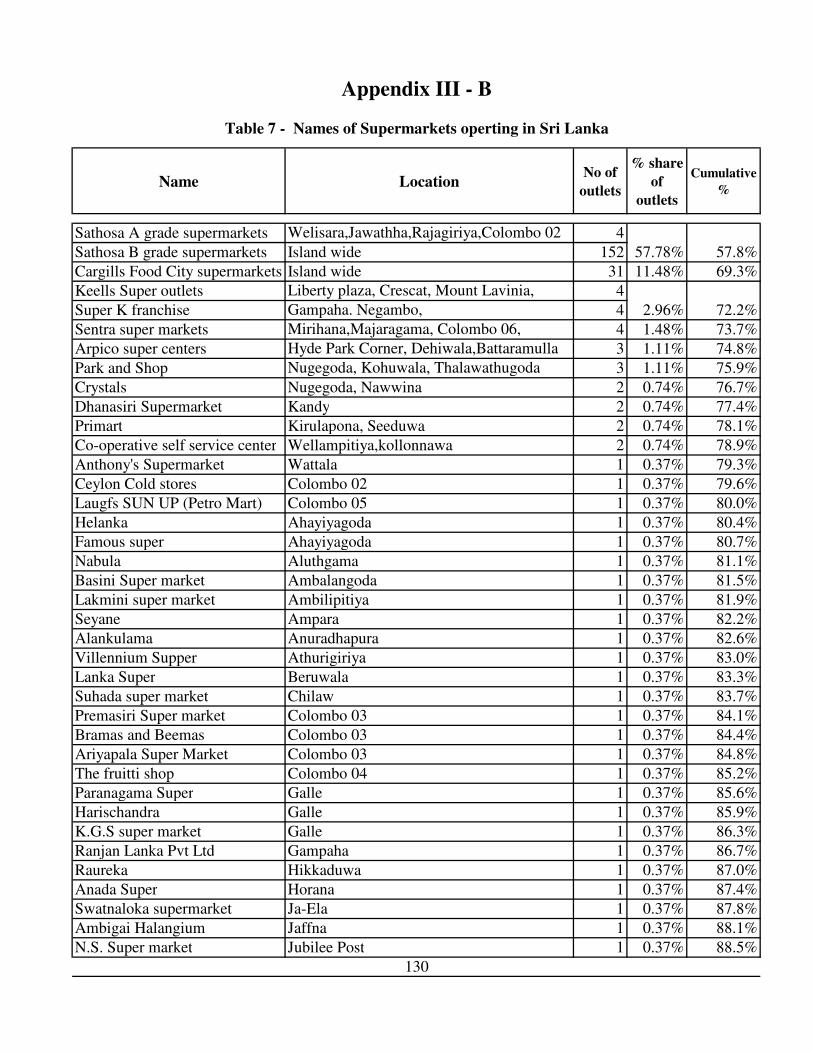
Name LocationNo of
outlets
% share
of
outlets
Cumulative
%
Sathosa A grade supermarkets Welisara,Jawathha,Rajagiriya,Colombo 02 4
Sathosa B grade supermarkets Island wide 152
Cargills Food City supermarkets Island wide 31 11.48% 69.3%
Keells Super outlets Liberty plaza, Crescat, Mount Lavinia, 4
Super K franchise Gampaha. Negambo, 4
Sentra super markets Mirihana,Majaragama, Colombo 06, 4 1.48% 73.7%
Arpico super centers Hyde Park Corner, Dehiwala,Battaramulla 3 1.11% 74.8%
Park and Shop Nugegoda, Kohuwala, Thalawathugoda 3 1.11% 75.9%
Crystals Nugegoda, Nawwina 2 0.74% 76.7%
Dhanasiri Supermarket Kandy 2 0.74% 77.4%
Primart Kirulapona, Seeduwa 2 0.74% 78.1%
Co-operative self service center Wellampitiya,kollonnawa 2 0.74% 78.9%
Anthony's Supermarket Wattala 1 0.37% 79.3%
Ceylon Cold stores Colombo 02 1 0.37% 79.6%
Laugfs SUN UP (Petro Mart) Colombo 05 1 0.37% 80.0%
Helanka Ahayiyagoda 1 0.37% 80.4%
Famous super Ahayiyagoda 1 0.37% 80.7%
Nabula Aluthgama 1 0.37% 81.1%
Basini Super market Ambalangoda 1 0.37% 81.5%
Lakmini super market Ambilipitiya 1 0.37% 81.9%
Seyane Ampara 1 0.37% 82.2%
Alankulama Anuradhapura 1 0.37% 82.6%
Villennium Supper Athurigiriya 1 0.37% 83.0%
Lanka Super Beruwala 1 0.37% 83.3%
Suhada super market Chilaw 1 0.37% 83.7%
Premasiri Super market Colombo 03 1 0.37% 84.1%
Bramas and Beemas Colombo 03 1 0.37% 84.4%
Ariyapala Super Market Colombo 03 1 0.37% 84.8%
The fruitti shop Colombo 04 1 0.37% 85.2%
Paranagama Super Galle 1 0.37% 85.6%
Harischandra Galle 1 0.37% 85.9%
K.G.S super market Galle 1 0.37% 86.3%
Ranjan Lanka Pvt Ltd Gampaha 1 0.37% 86.7%
Raureka Hikkaduwa 1 0.37% 87.0%
Anada Super Horana 1 0.37% 87.4%
Swatnaloka supermarket Ja-Ela 1 0.37% 87.8%
Ambigai Halangium Jaffna 1 0.37% 88.1%
N.S. Super market Jubilee Post 1 0.37% 88.5%
Appendix III - B
130
57.78%
2.96%
57.8%
72.2%
Table 7 - Names of Supermarkets operting in Sri Lanka

Name LocationNo of
outlets
% share
of
outlets
Cumulative
%
Appendix III - B
Table 7 - Names of Supermarkets operting in Sri Lanka
Ranjana's Super market Kalutara 1 0.37% 88.9%
Samarathunga super market Kamburupitiya 1 0.37% 89.3%
Royal garden Super Market Kanady 1 0.37% 89.6%
Sanith Stores Kandana 1 0.37% 90.0%
Apsara super market Kandy 1 0.37% 90.4%
Home needs super market Kandy 1 0.37% 90.7%
Seetha Super market Kandy 1 0.37% 91.1%
Thirasara Supermarket( Pvt) LimitedKelaniya 1 0.37% 91.5%
Prisca Kiribathgoda 1 0.37% 91.9%
Anusha Maha super market Kiribathgoda Junction 1 0.37% 92.2%
Thushara Super Kochchikade 1 0.37% 92.6%
Puhulyaya supermarket Kohuwala 1 0.37% 93.0%
The best super market Kotte 1 0.37% 93.3%
Thilakama Super market Mahabage 1 0.37% 93.7%
Chitu duwa Marawila 1 0.37% 94.1%
Lanka super market Mawanella 1 0.37% 94.4%
Family Super Mount Lavinia 1 0.37% 94.8%
Ranweli supermarket Negambo 1 0.37% 95.2%
Suhadaseva Negambo 1 0.37% 95.6%
Nihal Super Nittabuwa 1 0.37% 95.9%
Gunewadenas and Sons Nugegoda 1 0.37% 96.3%
Cheap Right Nugegoda 1 0.37% 96.7%
Panadura stores Panadura 1 0.37% 97.0%
Luminex Panadura 1 0.37% 97.4%
Nellies Super market Panadura 1 0.37% 97.8%
Keeth Super Piliyandala 1 0.37% 98.1%
Top shop Rajagiriya 1 0.37% 98.5%
Ratnaloka super Ratnapura 1 0.37% 98.9%
Ranawira Kanthele Trincomalee 1 0.37% 99.3%
Wadduwa Super market Wadduwa 1 0.37% 99.6%
Cooperative super center Wariyapola 1 0.37% 100.0%
270
Sources
AC Neilson Lanka Limited
Sathosa, Arpico, Cargills, Keells,Sentra sources
Discussion carried out with 318 students from all over the Island at the Sri lanka Institute of Marketing
131
Total ( This represents 95% of the supermarkets operating in Sri Lanka)
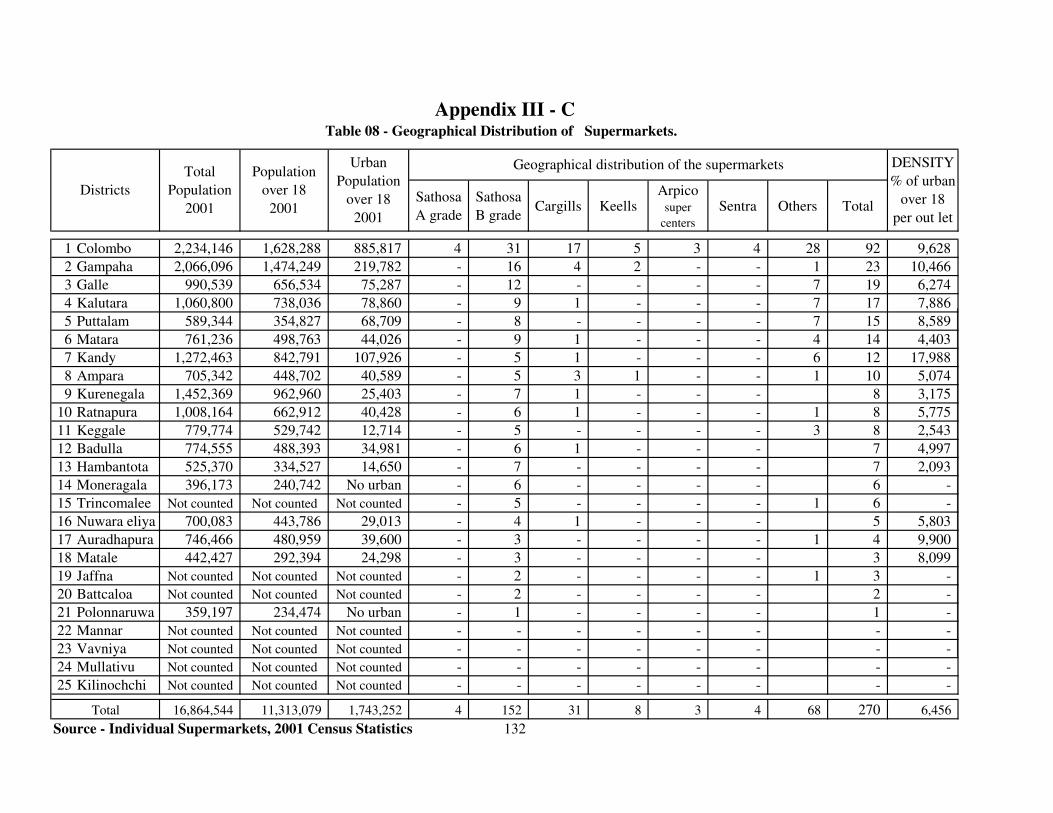
Sathosa
A grade
Sathosa
B gradeCargills Keells
Arpico super
centers
Sentra Others Total
1 Colombo 2,234,146 1,628,288 885,817 4 31 17 5 3 4 28 92 9,628
2 Gampaha 2,066,096 1,474,249 219,782 - 16 4 2 - - 1 23 10,466
3 Galle 990,539 656,534 75,287 - 12 - - - - 7 19 6,274
4 Kalutara 1,060,800 738,036 78,860 - 9 1 - - - 7 17 7,886
5 Puttalam 589,344 354,827 68,709 - 8 - - - - 7 15 8,589
6 Matara 761,236 498,763 44,026 - 9 1 - - - 4 14 4,403
7 Kandy 1,272,463 842,791 107,926 - 5 1 - - - 6 12 17,988
8 Ampara 705,342 448,702 40,589 - 5 3 1 - - 1 10 5,074
9 Kurenegala 1,452,369 962,960 25,403 - 7 1 - - - 8 3,175
10 Ratnapura 1,008,164 662,912 40,428 - 6 1 - - - 1 8 5,775
11 Keggale 779,774 529,742 12,714 - 5 - - - - 3 8 2,543
12 Badulla 774,555 488,393 34,981 - 6 1 - - - 7 4,997
13 Hambantota 525,370 334,527 14,650 - 7 - - - - 7 2,093
14 Moneragala 396,173 240,742 No urban - 6 - - - - 6 -
15 Trincomalee Not counted Not counted Not counted - 5 - - - - 1 6 -
16 Nuwara eliya 700,083 443,786 29,013 - 4 1 - - - 5 5,803
17 Auradhapura 746,466 480,959 39,600 - 3 - - - - 1 4 9,900
18 Matale 442,427 292,394 24,298 - 3 - - - - 3 8,099
19 Jaffna Not counted Not counted Not counted - 2 - - - - 1 3 -
20 Battcaloa Not counted Not counted Not counted - 2 - - - - 2 -
21 Polonnaruwa 359,197 234,474 No urban - 1 - - - - 1 -
22 Mannar Not counted Not counted Not counted - - - - - - - -
23 Vavniya Not counted Not counted Not counted - - - - - - - -
24 Mullativu Not counted Not counted Not counted - - - - - - - -
25 Kilinochchi Not counted Not counted Not counted - - - - - - - -
16,864,544 11,313,079 1,743,252 4 152 31 8 3 4 68 270 6,456
Source - Individual Supermarkets, 2001 Census Statistics 132
Urban
Population
over 18
2001
Table 08 - Geographical Distribution of Supermarkets.
Appendix III - C
Total
Districts
DENSITY
% of urban
over 18
per out let
Geographical distribution of the supermarketsTotal
Population
2001
Population
over 18
2001
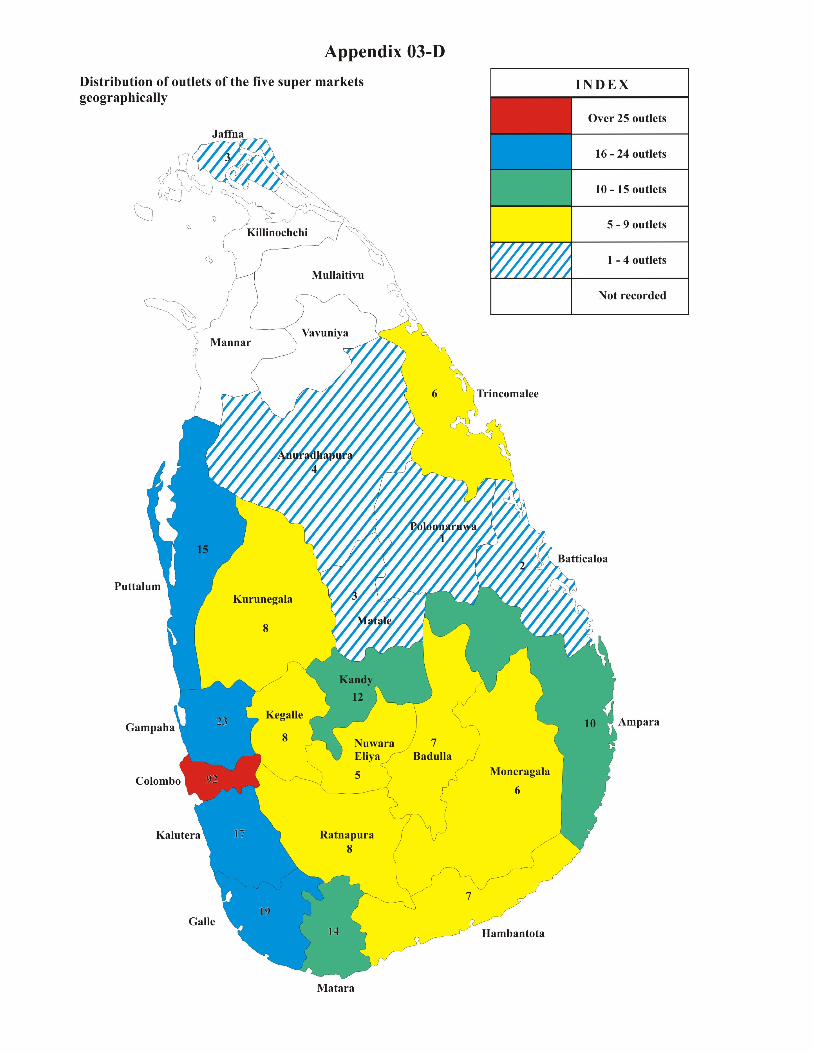
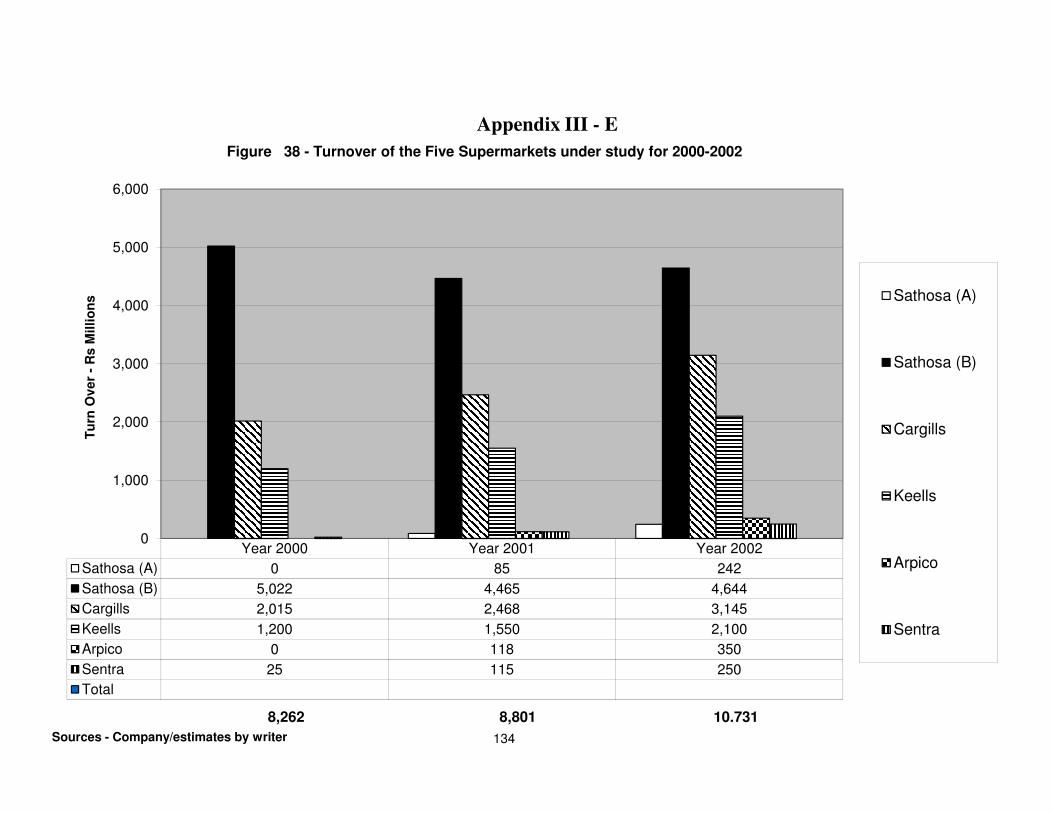
Year 2000 Year 2001 Year 2002
Sathosa (A) 0 85 242
Sathosa (B) 5,022 4,465 4,644
Cargills 2,015 2,468 3,145
Keells 1,200 1,550 2,100
Arpico 0 118 350
Sentra 25 115 250
Total
0
1,000
2,000
3,000
4,000
5,000
6,000
Tu
rn O
ve
r -
Rs
Mil
lio
ns
134
Sathosa (A)
Sathosa (B)
Cargills
Keells
Arpico
Sentra
8,262 8,801 10.731
Sources - Company/estimates by writer
Appendix III - E
Figure 38 - Turnover of the Five Supermarkets under study for 2000-2002
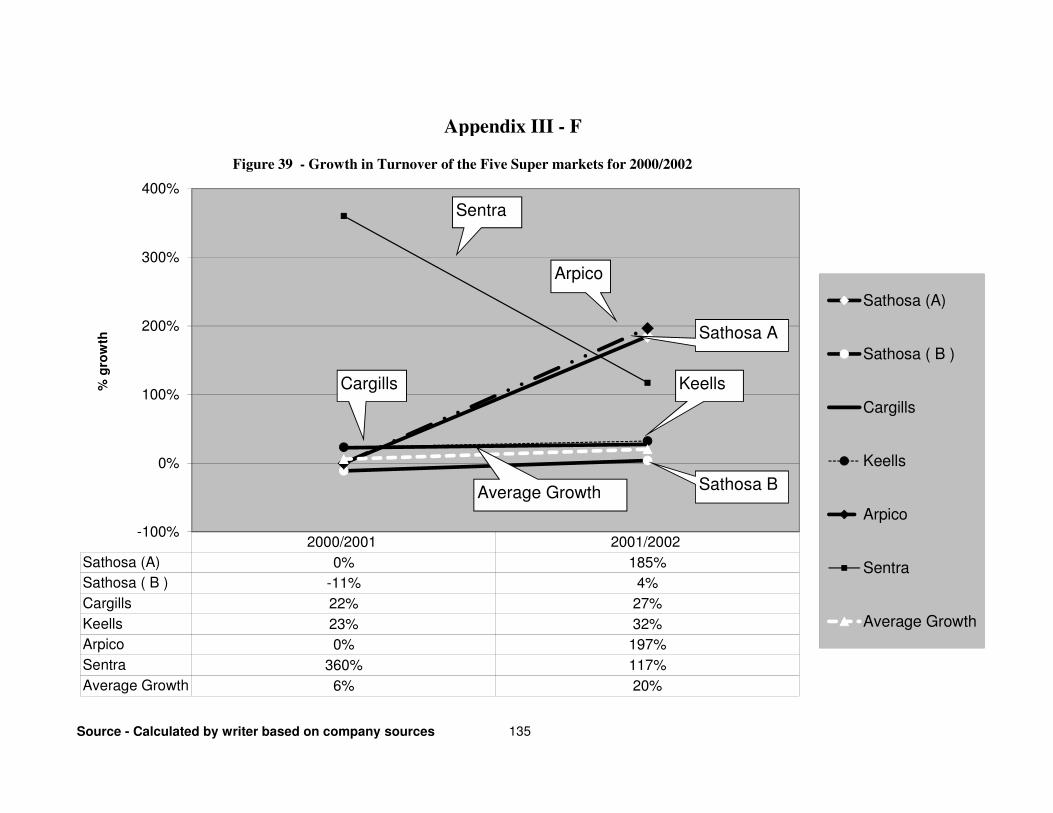
2000/2001 2001/2002
Sathosa (A) 0% 185%
Sathosa ( B ) -11% 4%
Cargills 22% 27%
Keells 23% 32%
Arpico 0% 197%
Sentra 360% 117%
Average Growth 6% 20%
-100%
0%
100%
200%
300%
400%
% g
row
th
135
Sathosa (A)
Sathosa ( B )
Cargills
Keells
Arpico
Sentra
Average Growth
Sentra
Arpico
Sathosa A
Sathosa B
Cargills Keells
Average Growth
Source - Calculated by writer based on company sources
Appendix III - F
Figure 39 - Growth in Turnover of the Five Super markets for 2000/2002
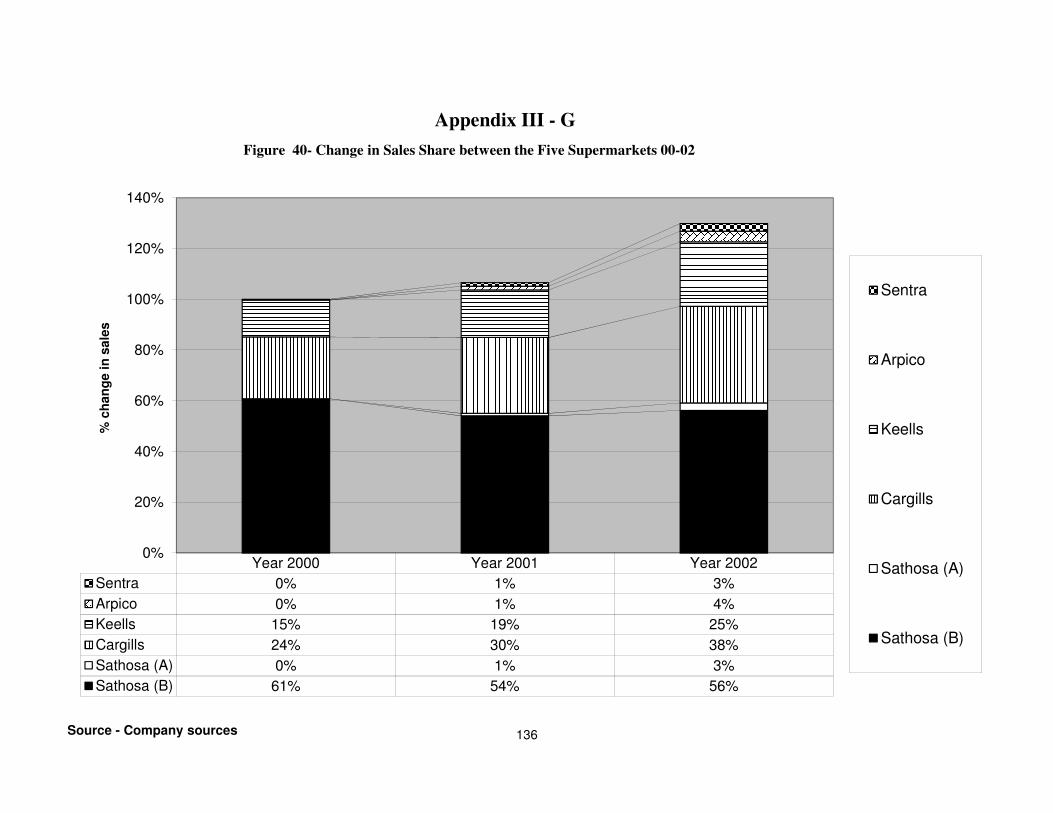
Year 2000 Year 2001 Year 2002
Sentra 0% 1% 3%
Arpico 0% 1% 4%
Keells 15% 19% 25%
Cargills 24% 30% 38%
Sathosa (A) 0% 1% 3%
Sathosa (B) 61% 54% 56%
0%
20%
40%
60%
80%
100%
120%
140%
% c
han
ge in
sale
s
136
Sentra
Arpico
Keells
Cargills
Sathosa (A)
Sathosa (B)
Source - Company sources
Appendix III - G
Figure 40- Change in Sales Share between the Five Supermarkets 00-02
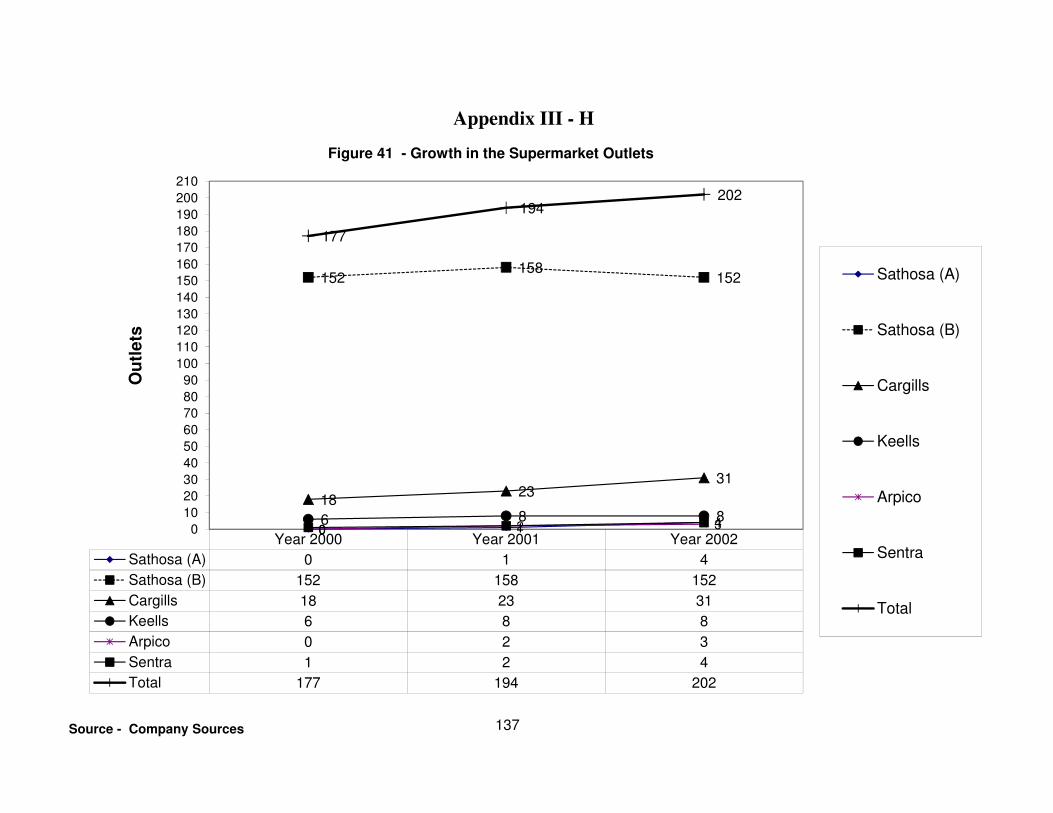
Year 2000 Year 2001 Year 2002
Sathosa (A) 0 1 4
Sathosa (B) 152 158 152
Cargills 18 23 31
Keells 6 8 8
Arpico 0 2 3
Sentra 1 2 4
Total 177 194 202
0 1 4
152158
152
1823
31
6 8 80 2 3
177
194202
0
10
20
30
40
50
60
70
80
90
100
110
120
130
140
150
160
170
180
190
200
210
Ou
tle
ts
137
Sathosa (A)
Sathosa (B)
Cargills
Keells
Arpico
Sentra
Total
Source - Company Sources
Appendix III - H
Figure 41 - Growth in the Supermarket Outlets
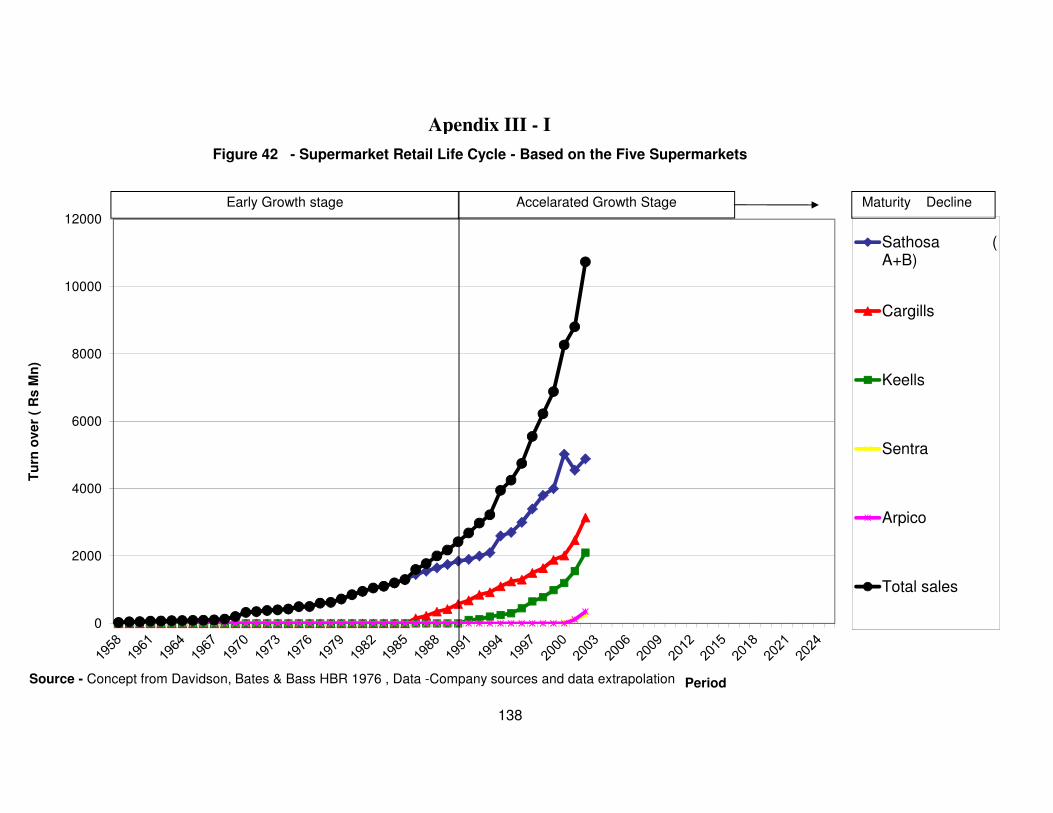
0
2000
4000
6000
8000
10000
12000
Tu
rn o
ve
r (
Rs
Mn
)
Period
Sathosa (A+B)
Cargills
Keells
Sentra
Arpico
Total sales
Early Growth stage Accelarated Growth Stage Maturity Decline
Source - Concept from Davidson, Bates & Bass HBR 1976 , Data -Company sources and data extrapolation
Apendix III - I
Figure 42 - Supermarket Retail Life Cycle - Based on the Five Supermarkets
138
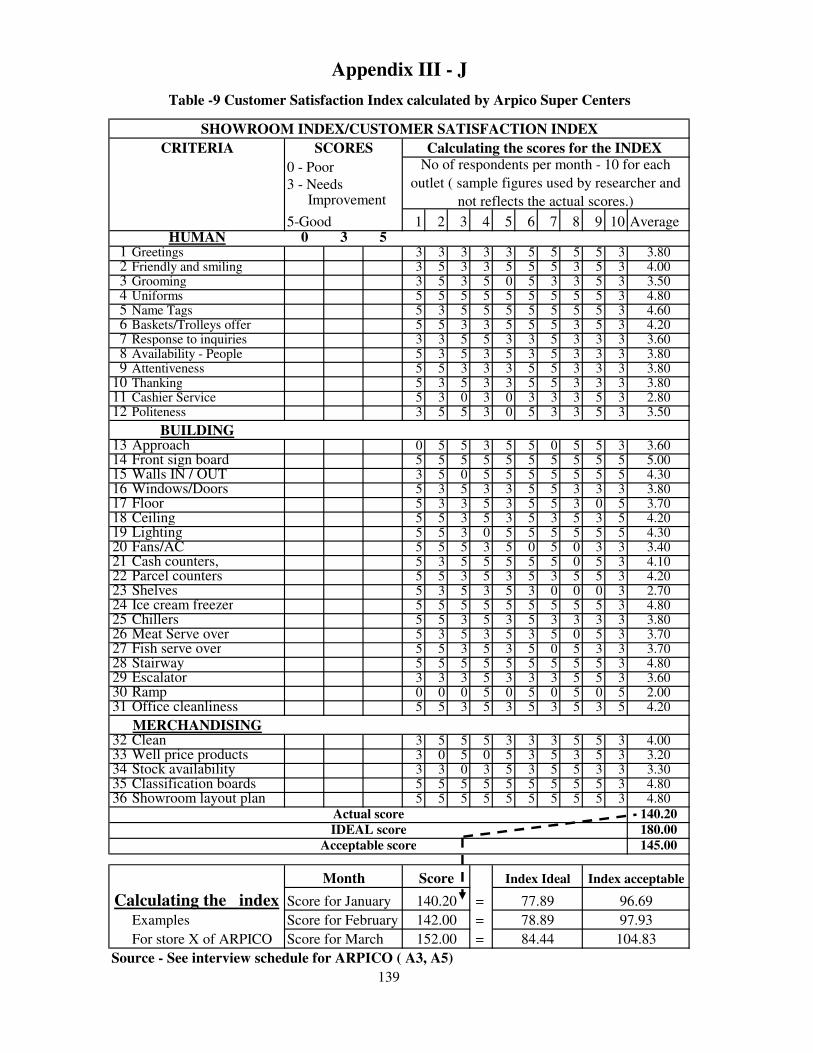
1 2 3 4 5 6 7 8 9 10 Average0 3 5
1 Greetings 3 3 3 3 3 5 5 5 5 3 3.802 Friendly and smiling 3 5 3 3 5 5 5 3 5 3 4.003 Grooming 3 5 3 5 0 5 3 3 5 3 3.504 Uniforms 5 5 5 5 5 5 5 5 5 3 4.805 Name Tags 5 3 5 5 5 5 5 5 5 3 4.606 Baskets/Trolleys offer 5 5 3 3 5 5 5 3 5 3 4.207 Response to inquiries 3 3 5 5 3 3 5 3 3 3 3.608 Availability - People 5 3 5 3 5 3 5 3 3 3 3.809 Attentiveness 5 5 3 3 3 5 5 3 3 3 3.80
10 Thanking 5 3 5 3 3 5 5 3 3 3 3.8011 Cashier Service 5 3 0 3 0 3 3 3 5 3 2.8012 Politeness 3 5 5 3 0 5 3 3 5 3 3.50
13 Approach 0 5 5 3 5 5 0 5 5 3 3.6014 Front sign board 5 5 5 5 5 5 5 5 5 5 5.0015 Walls IN / OUT 3 5 0 5 5 5 5 5 5 5 4.3016 Windows/Doors 5 3 5 3 3 5 5 3 3 3 3.8017 Floor 5 3 3 5 3 5 5 3 0 5 3.7018 Ceiling 5 5 3 5 3 5 3 5 3 5 4.2019 Lighting 5 5 3 0 5 5 5 5 5 5 4.3020 Fans/AC 5 5 5 3 5 0 5 0 3 3 3.4021 Cash counters, 5 3 5 5 5 5 5 0 5 3 4.1022 Parcel counters 5 5 3 5 3 5 3 5 5 3 4.2023 Shelves 5 3 5 3 5 3 0 0 0 3 2.7024 Ice cream freezer 5 5 5 5 5 5 5 5 5 3 4.8025 Chillers 5 5 3 5 3 5 3 3 3 3 3.8026 Meat Serve over 5 3 5 3 5 3 5 0 5 3 3.7027 Fish serve over 5 5 3 5 3 5 0 5 3 3 3.7028 Stairway 5 5 5 5 5 5 5 5 5 3 4.8029 Escalator 3 3 3 5 3 3 3 5 5 3 3.6030 Ramp 0 0 0 5 0 5 0 5 0 5 2.0031 Office cleanliness 5 5 3 5 3 5 3 5 3 5 4.20
32 Clean 3 5 5 5 3 3 3 5 5 3 4.0033 Well price products 3 0 5 0 5 3 5 3 5 3 3.2034 Stock availability 3 3 0 3 5 3 5 5 3 3 3.3035 Classification boards 5 5 5 5 5 5 5 5 5 3 4.8036 Showroom layout plan 5 5 5 5 5 5 5 5 5 3 4.80
140.20
180.00
145.00
Score for January =
Examples Score for February =
For store X of ARPICO Score for March =
Source - See interview schedule for ARPICO ( A3, A5)
139
Appendix III - J
Calculating the index
HUMAN
BUILDING
MERCHANDISING
Actual score
Index acceptable
3 - Needs Improvement
No of respondents per month - 10 for each
outlet ( sample figures used by researcher and
not reflects the actual scores.)
CRITERIA SCORES
0 - Poor
Table -9 Customer Satisfaction Index calculated by Arpico Super Centers
77.89
Index Ideal
140.20
IDEAL score
Acceptable score
Month Score
SHOWROOM INDEX/CUSTOMER SATISFACTION INDEX
104.83
142.00
152.00
78.89
84.44
97.93
5-Good
Calculating the scores for the INDEX
96.69
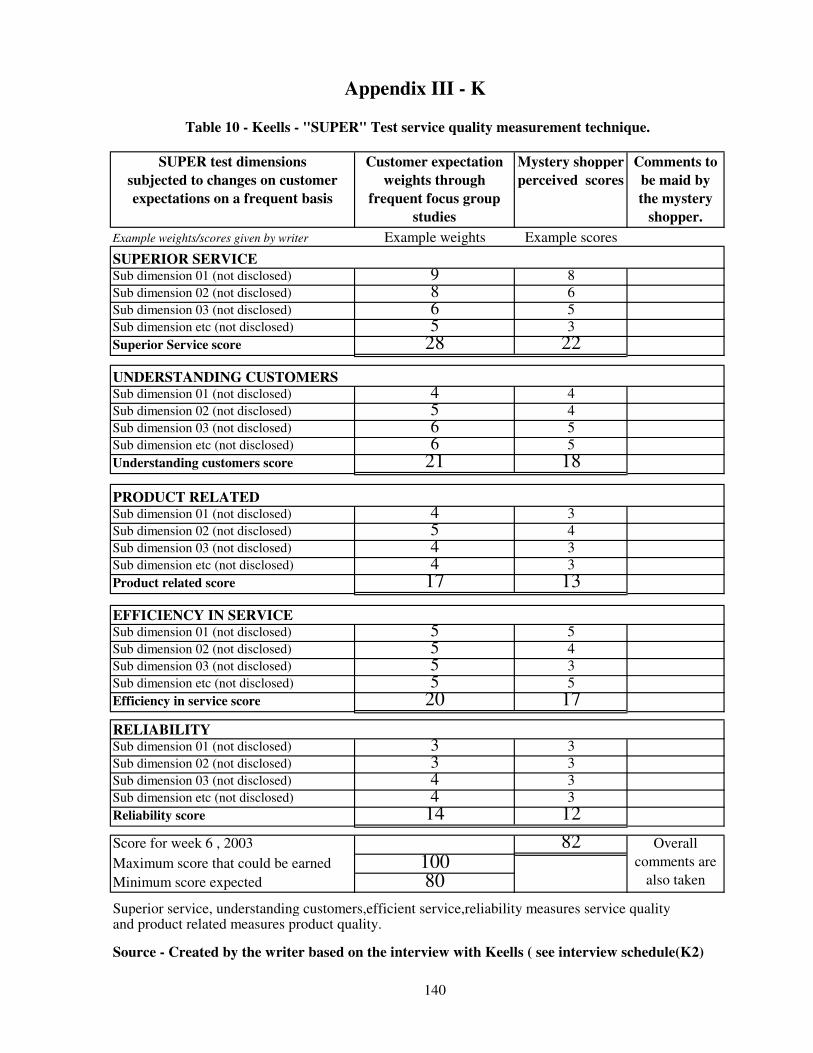
SUPER test dimensions
subjected to changes on customer
expectations on a frequent basis
Customer expectation
weights through
frequent focus group
studies
Mystery shopper
perceived scores
Comments to
be maid by
the mystery
shopper.
Example weights/scores given by writer Example weights Example scores
Sub dimension 01 (not disclosed) 9 8
Sub dimension 02 (not disclosed) 8 6
Sub dimension 03 (not disclosed) 6 5
Sub dimension etc (not disclosed) 5 3
Superior Service score 28 22
Sub dimension 01 (not disclosed) 4 4
Sub dimension 02 (not disclosed) 5 4
Sub dimension 03 (not disclosed) 6 5
Sub dimension etc (not disclosed) 6 5
Understanding customers score 21 18
Sub dimension 01 (not disclosed) 4 3
Sub dimension 02 (not disclosed) 5 4
Sub dimension 03 (not disclosed) 4 3
Sub dimension etc (not disclosed) 4 3
Product related score 17 13
Sub dimension 01 (not disclosed) 5 5
Sub dimension 02 (not disclosed) 5 4
Sub dimension 03 (not disclosed) 5 3
Sub dimension etc (not disclosed) 5 5
Efficiency in service score 20 17
Sub dimension 01 (not disclosed) 3 3
Sub dimension 02 (not disclosed) 3 3
Sub dimension 03 (not disclosed) 4 3
Sub dimension etc (not disclosed) 4 3
Reliability score 14 12
Score for week 6 , 2003 82Maximum score that could be earned 100Minimum score expected 80
Superior service, understanding customers,efficient service,reliability measures service qualityand product related measures product quality.
Source - Created by the writer based on the interview with Keells ( see interview schedule(K2)
140
Appendix III - K
RELIABILITY
Overall
comments are
also taken
SUPERIOR SERVICE
UNDERSTANDING CUSTOMERS
PRODUCT RELATED
EFFICIENCY IN SERVICE
Table 10 - Keells - "SUPER" Test service quality measurement technique.
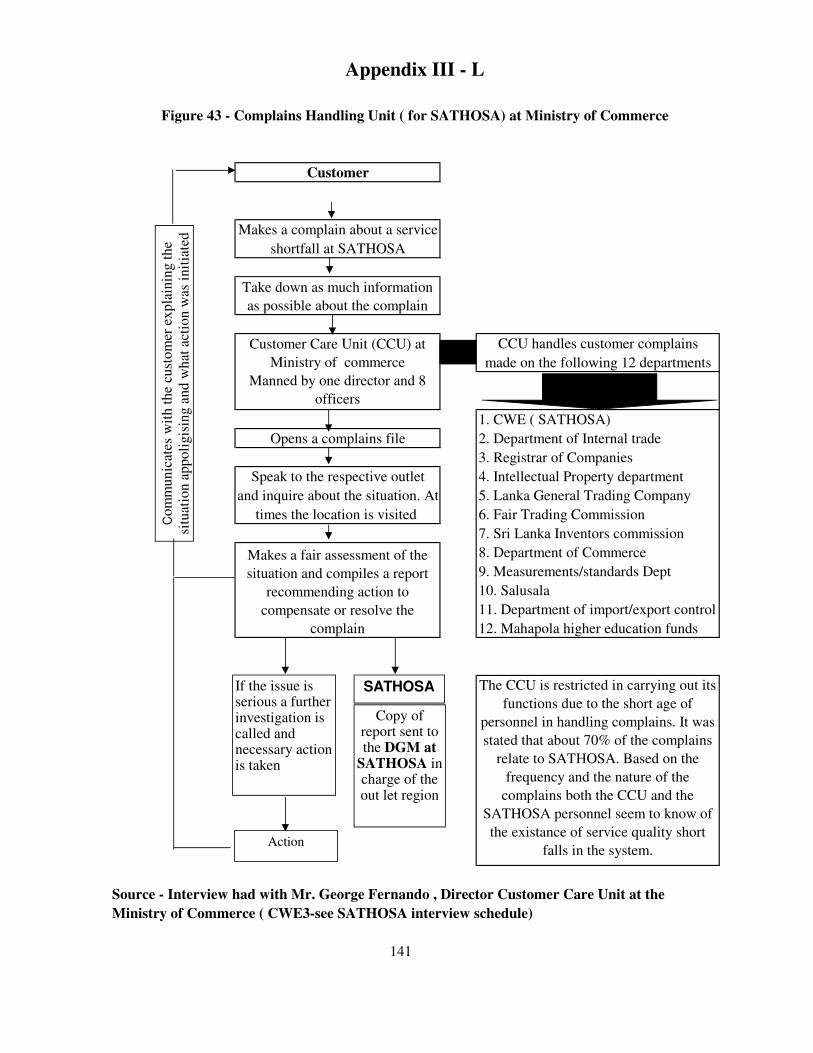
1. CWE ( SATHOSA)
2. Department of Internal trade
3. Registrar of Companies
4. Intellectual Property department
5. Lanka General Trading Company
6. Fair Trading Commission
7. Sri Lanka Inventors commission
8. Department of Commerce
9. Measurements/standards Dept
10. Salusala
11. Department of import/export control
12. Mahapola higher education funds
Source - Interview had with Mr. George Fernando , Director Customer Care Unit at the
Ministry of Commerce ( CWE3-see SATHOSA interview schedule)
141
Makes a fair assessment of the
situation and compiles a report
recommending action to
compensate or resolve the
complain
The CCU is restricted in carrying out its
functions due to the short age of
personnel in handling complains. It was
stated that about 70% of the complains
relate to SATHOSA. Based on the
frequency and the nature of the
complains both the CCU and the
SATHOSA personnel seem to know of
the existance of service quality short
falls in the system.
Opens a complains file
Speak to the respective outlet
and inquire about the situation. At
times the location is visited
Figure 43 - Complains Handling Unit ( for SATHOSA) at Ministry of Commerce
shortfall at SATHOSA
Makes a complain about a service
Customer Care Unit (CCU) at
Ministry of commerce
Manned by one director and 8
officers
Take down as much information
as possible about the complain
Appendix III - L
Customer
CCU handles customer complains
made on the following 12 departments
Com
munic
ates
wit
h t
he
cust
om
er e
xp
lain
ing t
he
situ
atio
n a
ppoli
gis
ing a
nd w
hat
act
ion
was
in
itia
ted
If the issue is serious a further investigation is called and necessary action is taken
Copy of report sent to the DGM at
SATHOSA in charge of the out let region
Action
SATHOSA
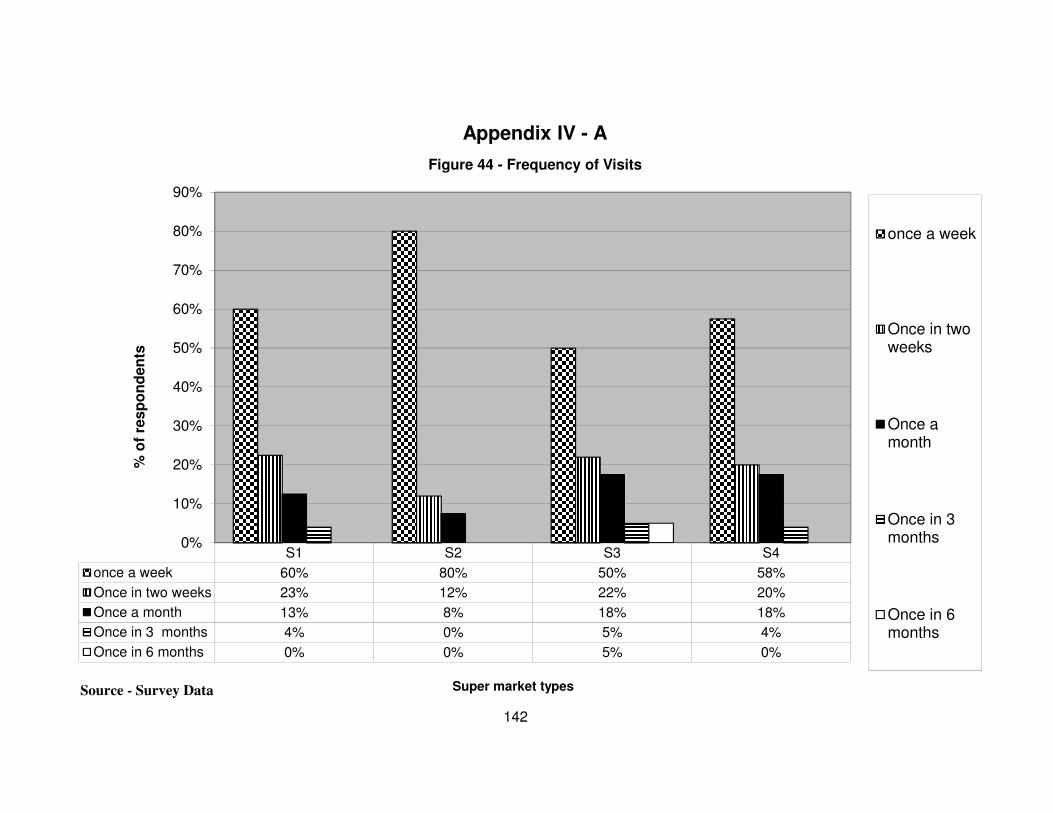
S1 S2 S3 S4
once a week 60% 80% 50% 58%
Once in two weeks 23% 12% 22% 20%
Once a month 13% 8% 18% 18%
Once in 3 months 4% 0% 5% 4%
Once in 6 months 0% 0% 5% 0%
0%
10%
20%
30%
40%
50%
60%
70%
80%
90%
% o
f re
sp
on
den
ts
Super market types
Figure 44 - Frequency of Visits
once a week
Once in two
weeks
Once a
month
Once in 3
months
Once in 6
months
Appendix IV - A
Source - Survey Data
142
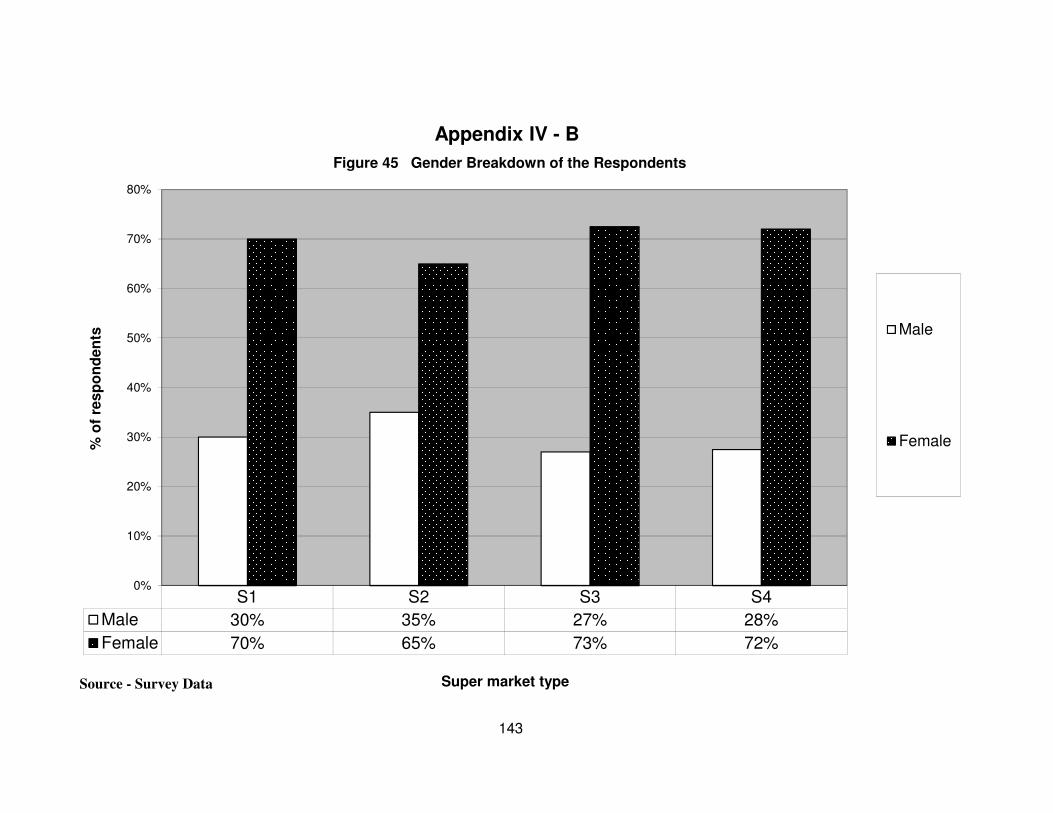
S1 S2 S3 S4
Male 30% 35% 27% 28%
Female 70% 65% 73% 72%
0%
10%
20%
30%
40%
50%
60%
70%
80%
% o
f re
sp
on
den
ts
Super market type
Figure 45 Gender Breakdown of the Respondents
Male
Female
Appendix IV - B
Source - Survey Data
143
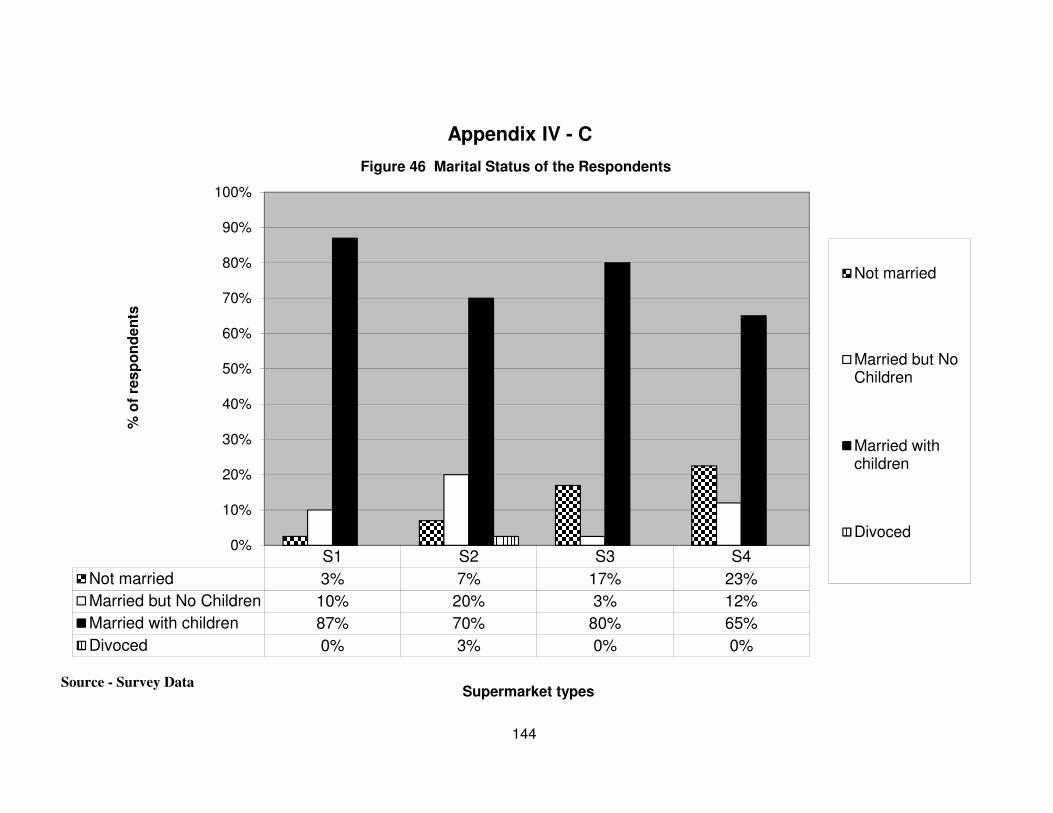
S1 S2 S3 S4
Not married 3% 7% 17% 23%
Married but No Children 10% 20% 3% 12%
Married with children 87% 70% 80% 65%
Divoced 0% 3% 0% 0%
0%
10%
20%
30%
40%
50%
60%
70%
80%
90%
100%
% o
f re
sp
on
den
ts
Supermarket types
Figure 46 Marital Status of the Respondents
Not married
Married but No
Children
Married with
children
Divoced
Appendix IV - C
Source - Survey Data
144
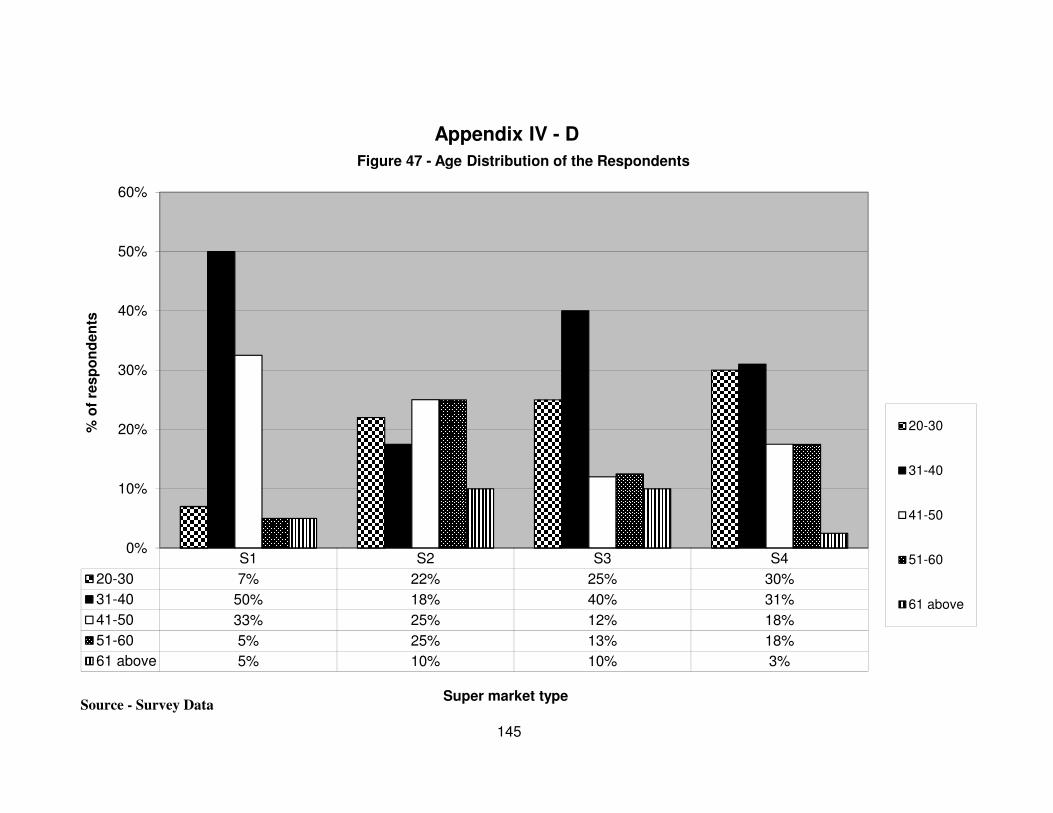
S1 S2 S3 S4
20-30 7% 22% 25% 30%
31-40 50% 18% 40% 31%
41-50 33% 25% 12% 18%
51-60 5% 25% 13% 18%
61 above 5% 10% 10% 3%
0%
10%
20%
30%
40%
50%
60%
% o
f re
sp
on
den
ts
Super market type
Figure 47 - Age Distribution of the Respondents
20-30
31-40
41-50
51-60
61 above
Appendix IV - D
Source - Survey Data
145
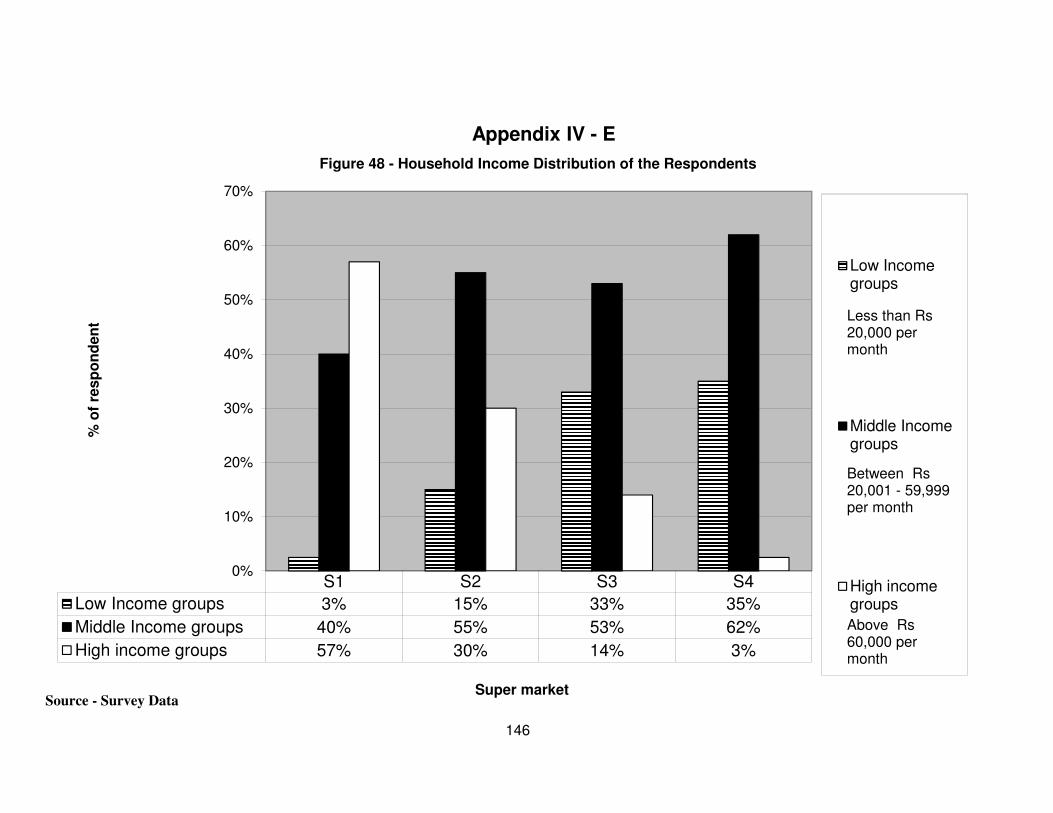
S1 S2 S3 S4
Low Income groups 3% 15% 33% 35%
Middle Income groups 40% 55% 53% 62%
High income groups 57% 30% 14% 3%
0%
10%
20%
30%
40%
50%
60%
70%
% o
f re
sp
on
den
t
Super market
Figure 48 - Household Income Distribution of the Respondents
Low Incomegroups
Middle Incomegroups
High incomegroups
Appendix IV - E
Less than Rs 20,000 per month
Between Rs 20,001 - 59,999 per month
Above Rs 60,000 per month
Source - Survey Data
146

1 5.00 50,000 4.00 50,000 6.00 30,000 6.00 30,000
2 3.00 70,000 4.00 50,000 4.00 50,000 7.00 10,000
3 5.00 30,000 4.00 70,000 1.00 150,000 6.00 30,000
4 4.00 50,000 4.00 90,000 5.00 30,000 7.00 10,000
5 3.00 150,000 4.00 150,000 3.00 50,000 7.00 10,000
6 4.00 50,000 6.00 10,000 6.00 10,000 5.00 30,000
7 3.00 70,000 4.00 30,000 5.00 50,000 6.00 50,000
8 5.00 30,000 6.00 10,000 4.00 30,000 6.00 10,000
9 4.00 90,000 4.00 70,000 6.00 30,000 5.00 10,000
10 5.00 50,000 5.00 30,000 7.00 10,000 6.00 10,000
11 4.00 90,000 5.00 30,000 4.00 70,000 3.00 90,000
12 4.00 30,000 5.00 30,000 6.00 10,000 4.00 50,000
13 3.00 90,000 2.00 150,000 5.00 30,000 4.00 70,000
14 2.00 150,000 2.00 150,000 6.00 10,000 6.00 50,000
15 4.00 50,000 5.00 30,000 5.00 30,000 7.00 10,000
16 3.00 150,000 5.00 30,000 6.00 10,000 4.00 70,000
17 3.00 90,000 4.00 50,000 6.00 30,000 5.00 50,000
18 4.00 90,000 4.00 90,000 6.00 10,000 7.00 10,000
19 3.00 90,000 4.00 70,000 6.00 10,000 6.00 30,000
20 4.00 70,000 4.00 50,000 6.00 30,000 6.00 30,000
21 5.00 50,000 5.00 10,000 6.00 10,000 6.00 10,000
22 4.00 50,000 4.00 50,000 5.00 30,000 6.00 30,000
23 5.00 30,000 4.00 50,000 6.00 10,000 6.00 50,000
24 5.00 30,000 4.00 10,000 5.00 30,000 5.00 30,000
25 4.00 70,000 4.00 10,000 5.00 50,000 5.00 50,000
26 5.00 50,000 5.00 90,000 6.00 30,000 4.00 70,000
27 5.00 50,000 1.00 150,000 4.00 30,000 6.00 50,000
28 6.00 30,000 5.00 50,000 5.00 50,000 6.00 10,000
29 5.00 50,000 4.00 30,000 4.00 50,000 6.00 30,000
30 4.00 70,000 4.00 50,000 3.00 30,000 6.00 30,000
31 4.00 70,000 4.00 30,000 4.00 70,000 6.00 10,000
32 3.00 90,000 4.00 50,000 5.00 50,000 7.00 10,000
33 4.00 70,000 3.00 150,000 6.00 10,000 5.00 30,000
34 4.00 90,000 4.00 10,000 6.00 10,000 7.00 10,000
35 4.00 70,000 4.00 30,000 3.00 70,000 6.00 30,000
36 6.00 10,000 2.00 150,000 5.00 50,000 5.00 30,000
37 2.00 150,000 4.00 50,000 2.00 90,000 4.00 70,000
38 3.00 90,000 4.00 50,000 7.00 10,000 6.00 30,000
39 4.00 70,000 5.00 30,000 6.00 10,000 5.00 70,000
40 4.00 70,000 5.00 30,000 5.00 50,000 7.00 10,000
Averages 4.03 70,000 4.10 58,000 5.03 35,128 5.68 33,000
Correlation
Significance
r2
Source - Survey Data
SignificantSignificant
69%
Av
erag
e
inco
me
-0.8321 -0.7606
58%
-0.8450
Significant
71%
Significant
65%
S1 S2
Pri
ce
exp
ecta
tio
ns
Av
erag
e
inco
me
S3 S4
Pri
ce
exp
ecta
tio
ns
Pri
ce
exp
ecta
tio
ns
Appendix IV - F
Table 11 - Correlation between Income Levels and Price Expectations
-0.8057
Res
po
nd
ent
nu
mb
ers
Av
erag
e
inco
me
Pri
ce
exp
ecta
tio
ns
Av
erag
e
inco
me
147
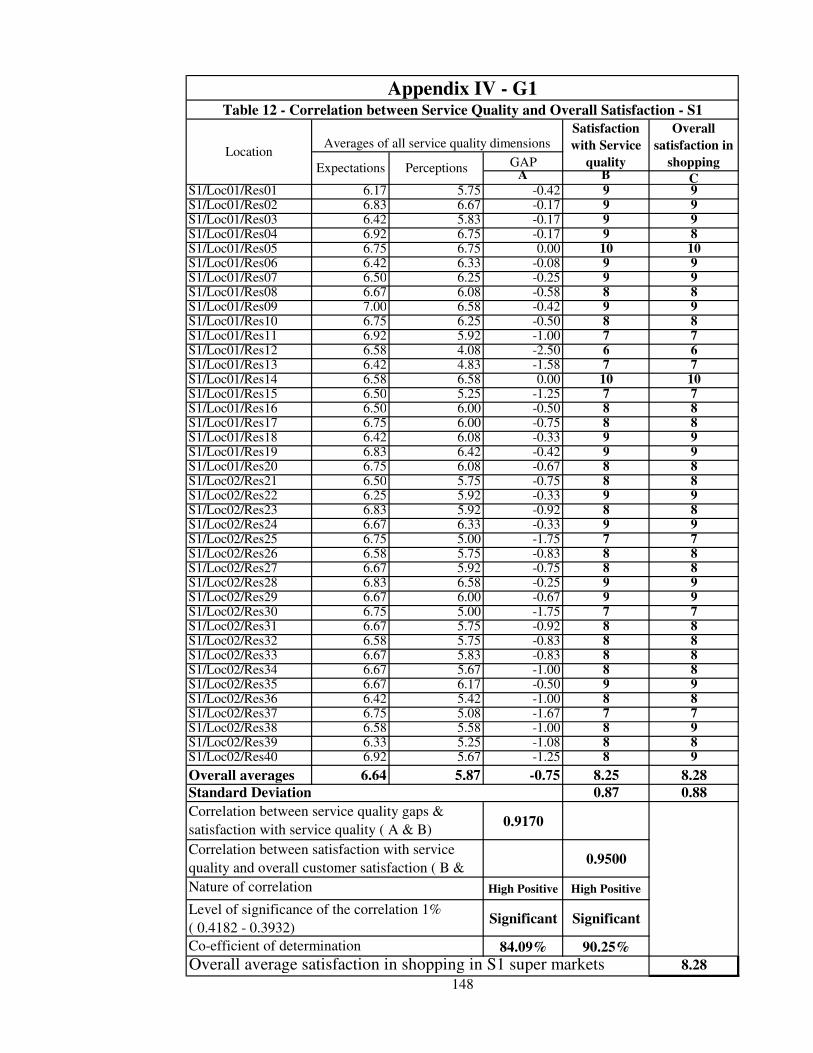
GAPA B C
S1/Loc01/Res01 6.17 5.75 -0.42 9 9S1/Loc01/Res02 6.83 6.67 -0.17 9 9S1/Loc01/Res03 6.42 5.83 -0.17 9 9S1/Loc01/Res04 6.92 6.75 -0.17 9 8S1/Loc01/Res05 6.75 6.75 0.00 10 10S1/Loc01/Res06 6.42 6.33 -0.08 9 9S1/Loc01/Res07 6.50 6.25 -0.25 9 9S1/Loc01/Res08 6.67 6.08 -0.58 8 8S1/Loc01/Res09 7.00 6.58 -0.42 9 9S1/Loc01/Res10 6.75 6.25 -0.50 8 8S1/Loc01/Res11 6.92 5.92 -1.00 7 7S1/Loc01/Res12 6.58 4.08 -2.50 6 6S1/Loc01/Res13 6.42 4.83 -1.58 7 7S1/Loc01/Res14 6.58 6.58 0.00 10 10S1/Loc01/Res15 6.50 5.25 -1.25 7 7S1/Loc01/Res16 6.50 6.00 -0.50 8 8S1/Loc01/Res17 6.75 6.00 -0.75 8 8S1/Loc01/Res18 6.42 6.08 -0.33 9 9S1/Loc01/Res19 6.83 6.42 -0.42 9 9S1/Loc01/Res20 6.75 6.08 -0.67 8 8S1/Loc02/Res21 6.50 5.75 -0.75 8 8S1/Loc02/Res22 6.25 5.92 -0.33 9 9S1/Loc02/Res23 6.83 5.92 -0.92 8 8S1/Loc02/Res24 6.67 6.33 -0.33 9 9S1/Loc02/Res25 6.75 5.00 -1.75 7 7S1/Loc02/Res26 6.58 5.75 -0.83 8 8S1/Loc02/Res27 6.67 5.92 -0.75 8 8S1/Loc02/Res28 6.83 6.58 -0.25 9 9S1/Loc02/Res29 6.67 6.00 -0.67 9 9S1/Loc02/Res30 6.75 5.00 -1.75 7 7S1/Loc02/Res31 6.67 5.75 -0.92 8 8S1/Loc02/Res32 6.58 5.75 -0.83 8 8S1/Loc02/Res33 6.67 5.83 -0.83 8 8S1/Loc02/Res34 6.67 5.67 -1.00 8 8S1/Loc02/Res35 6.67 6.17 -0.50 9 9S1/Loc02/Res36 6.42 5.42 -1.00 8 8S1/Loc02/Res37 6.75 5.08 -1.67 7 7S1/Loc02/Res38 6.58 5.58 -1.00 8 9S1/Loc02/Res39 6.33 5.25 -1.08 8 8S1/Loc02/Res40 6.92 5.67 -1.25 8 9
Overall averages 6.64 5.87 -0.75 8.25 8.28
0.87 0.88
0.9170
0.9500
High Positive High Positive
Significant Significant
84.09% 90.25%
8.28
148
Appendix IV - G1Table 12 - Correlation between Service Quality and Overall Satisfaction - S1
Overall average satisfaction in shopping in S1 super markets
Location
Level of significance of the correlation 1%
( 0.4182 - 0.3932)
Correlation between service quality gaps &
satisfaction with service quality ( A & B)
Correlation between satisfaction with service
quality and overall customer satisfaction ( B &
Nature of correlation
Co-efficient of determination
Overall
satisfaction in
shopping
Satisfaction
with Service
qualityPerceptions
Standard Deviation
Expectations
Averages of all service quality dimensions
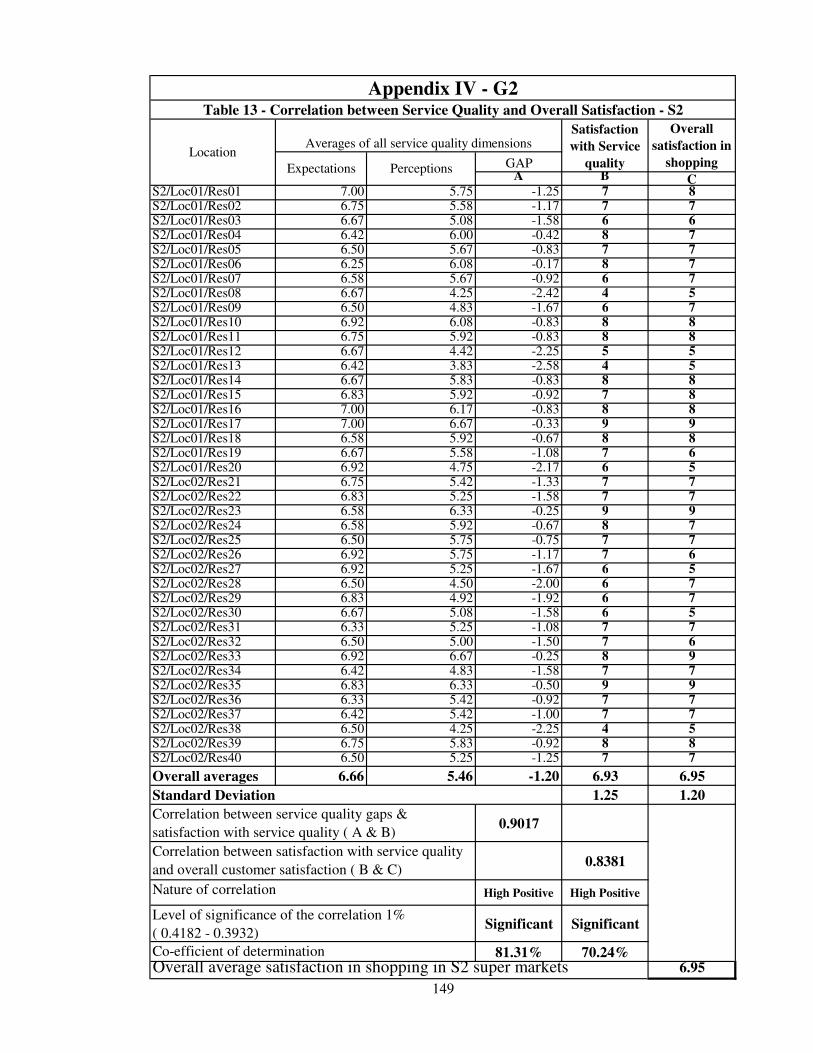
GAPA B C
S2/Loc01/Res01 7.00 5.75 -1.25 7 8S2/Loc01/Res02 6.75 5.58 -1.17 7 7S2/Loc01/Res03 6.67 5.08 -1.58 6 6S2/Loc01/Res04 6.42 6.00 -0.42 8 7S2/Loc01/Res05 6.50 5.67 -0.83 7 7S2/Loc01/Res06 6.25 6.08 -0.17 8 7S2/Loc01/Res07 6.58 5.67 -0.92 6 7S2/Loc01/Res08 6.67 4.25 -2.42 4 5S2/Loc01/Res09 6.50 4.83 -1.67 6 7S2/Loc01/Res10 6.92 6.08 -0.83 8 8S2/Loc01/Res11 6.75 5.92 -0.83 8 8S2/Loc01/Res12 6.67 4.42 -2.25 5 5S2/Loc01/Res13 6.42 3.83 -2.58 4 5S2/Loc01/Res14 6.67 5.83 -0.83 8 8S2/Loc01/Res15 6.83 5.92 -0.92 7 8S2/Loc01/Res16 7.00 6.17 -0.83 8 8S2/Loc01/Res17 7.00 6.67 -0.33 9 9S2/Loc01/Res18 6.58 5.92 -0.67 8 8S2/Loc01/Res19 6.67 5.58 -1.08 7 6S2/Loc01/Res20 6.92 4.75 -2.17 6 5S2/Loc02/Res21 6.75 5.42 -1.33 7 7S2/Loc02/Res22 6.83 5.25 -1.58 7 7S2/Loc02/Res23 6.58 6.33 -0.25 9 9S2/Loc02/Res24 6.58 5.92 -0.67 8 7S2/Loc02/Res25 6.50 5.75 -0.75 7 7S2/Loc02/Res26 6.92 5.75 -1.17 7 6S2/Loc02/Res27 6.92 5.25 -1.67 6 5S2/Loc02/Res28 6.50 4.50 -2.00 6 7S2/Loc02/Res29 6.83 4.92 -1.92 6 7S2/Loc02/Res30 6.67 5.08 -1.58 6 5S2/Loc02/Res31 6.33 5.25 -1.08 7 7S2/Loc02/Res32 6.50 5.00 -1.50 7 6S2/Loc02/Res33 6.92 6.67 -0.25 8 9S2/Loc02/Res34 6.42 4.83 -1.58 7 7S2/Loc02/Res35 6.83 6.33 -0.50 9 9S2/Loc02/Res36 6.33 5.42 -0.92 7 7S2/Loc02/Res37 6.42 5.42 -1.00 7 7S2/Loc02/Res38 6.50 4.25 -2.25 4 5S2/Loc02/Res39 6.75 5.83 -0.92 8 8S2/Loc02/Res40 6.50 5.25 -1.25 7 7
Overall averages 6.66 5.46 -1.20 6.93 6.95
1.25 1.20
0.9017
0.8381
High Positive High Positive
Significant Significant
81.31% 70.24%6.95
149
Appendix IV - G2
Overall average satisfaction in shopping in S2 super markets
Correlation between service quality gaps &
satisfaction with service quality ( A & B)
Correlation between satisfaction with service quality
and overall customer satisfaction ( B & C)
Nature of correlation
Level of significance of the correlation 1%
( 0.4182 - 0.3932)
Co-efficient of determination
Standard Deviation
Table 13 - Correlation between Service Quality and Overall Satisfaction - S2
Location
Overall
satisfaction in
shopping
Averages of all service quality dimensionsSatisfaction
with Service
qualityExpectations Perceptions
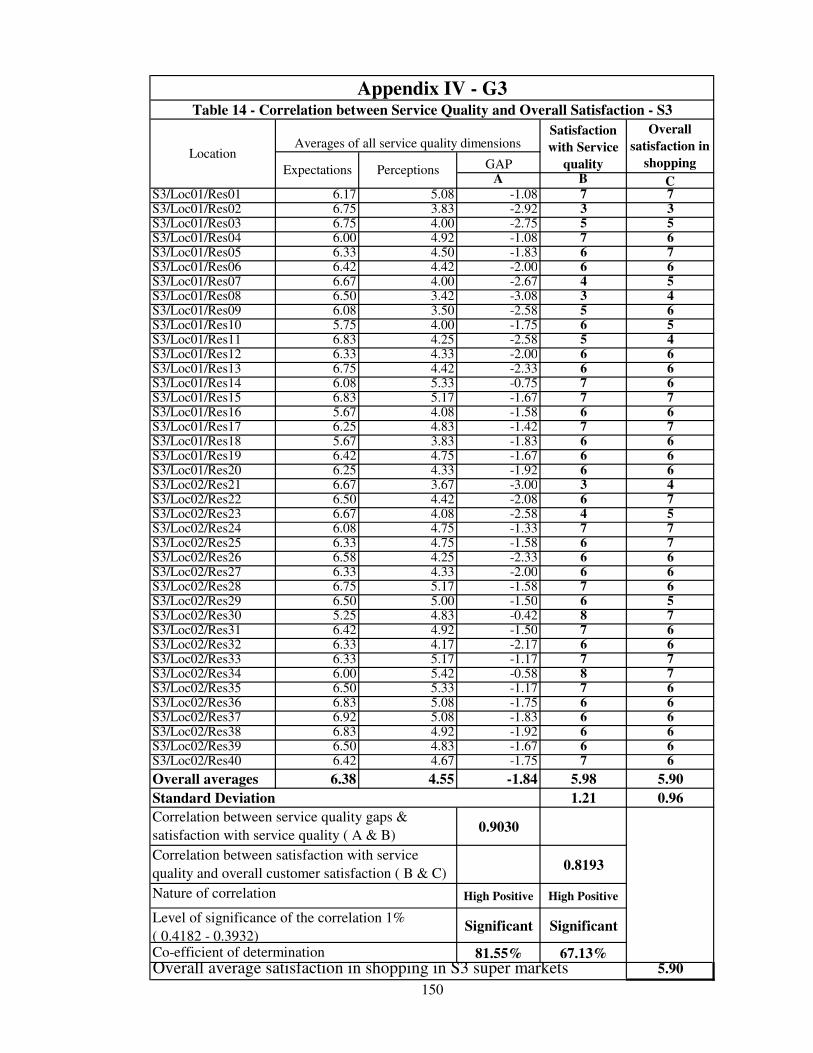
GAPA B C
S3/Loc01/Res01 6.17 5.08 -1.08 7 7S3/Loc01/Res02 6.75 3.83 -2.92 3 3S3/Loc01/Res03 6.75 4.00 -2.75 5 5S3/Loc01/Res04 6.00 4.92 -1.08 7 6S3/Loc01/Res05 6.33 4.50 -1.83 6 7S3/Loc01/Res06 6.42 4.42 -2.00 6 6S3/Loc01/Res07 6.67 4.00 -2.67 4 5S3/Loc01/Res08 6.50 3.42 -3.08 3 4S3/Loc01/Res09 6.08 3.50 -2.58 5 6S3/Loc01/Res10 5.75 4.00 -1.75 6 5S3/Loc01/Res11 6.83 4.25 -2.58 5 4S3/Loc01/Res12 6.33 4.33 -2.00 6 6S3/Loc01/Res13 6.75 4.42 -2.33 6 6S3/Loc01/Res14 6.08 5.33 -0.75 7 6S3/Loc01/Res15 6.83 5.17 -1.67 7 7S3/Loc01/Res16 5.67 4.08 -1.58 6 6S3/Loc01/Res17 6.25 4.83 -1.42 7 7S3/Loc01/Res18 5.67 3.83 -1.83 6 6S3/Loc01/Res19 6.42 4.75 -1.67 6 6S3/Loc01/Res20 6.25 4.33 -1.92 6 6S3/Loc02/Res21 6.67 3.67 -3.00 3 4S3/Loc02/Res22 6.50 4.42 -2.08 6 7S3/Loc02/Res23 6.67 4.08 -2.58 4 5S3/Loc02/Res24 6.08 4.75 -1.33 7 7S3/Loc02/Res25 6.33 4.75 -1.58 6 7S3/Loc02/Res26 6.58 4.25 -2.33 6 6S3/Loc02/Res27 6.33 4.33 -2.00 6 6S3/Loc02/Res28 6.75 5.17 -1.58 7 6S3/Loc02/Res29 6.50 5.00 -1.50 6 5S3/Loc02/Res30 5.25 4.83 -0.42 8 7S3/Loc02/Res31 6.42 4.92 -1.50 7 6S3/Loc02/Res32 6.33 4.17 -2.17 6 6S3/Loc02/Res33 6.33 5.17 -1.17 7 7S3/Loc02/Res34 6.00 5.42 -0.58 8 7S3/Loc02/Res35 6.50 5.33 -1.17 7 6S3/Loc02/Res36 6.83 5.08 -1.75 6 6S3/Loc02/Res37 6.92 5.08 -1.83 6 6S3/Loc02/Res38 6.83 4.92 -1.92 6 6S3/Loc02/Res39 6.50 4.83 -1.67 6 6S3/Loc02/Res40 6.42 4.67 -1.75 7 6
Overall averages 6.38 4.55 -1.84 5.98 5.90
1.21 0.96
0.9030
0.8193
High Positive High Positive
Significant Significant
81.55% 67.13%5.90
150
Appendix IV - G3
Overall average satisfaction in shopping in S3 super markets
Correlation between service quality gaps &
satisfaction with service quality ( A & B)
Correlation between satisfaction with service
quality and overall customer satisfaction ( B & C)
Nature of correlation
Level of significance of the correlation 1%
( 0.4182 - 0.3932)Co-efficient of determination
Standard Deviation
Table 14 - Correlation between Service Quality and Overall Satisfaction - S3
Location
Overall
satisfaction in
shopping
Averages of all service quality dimensionsSatisfaction
with Service
qualityExpectations Perceptions
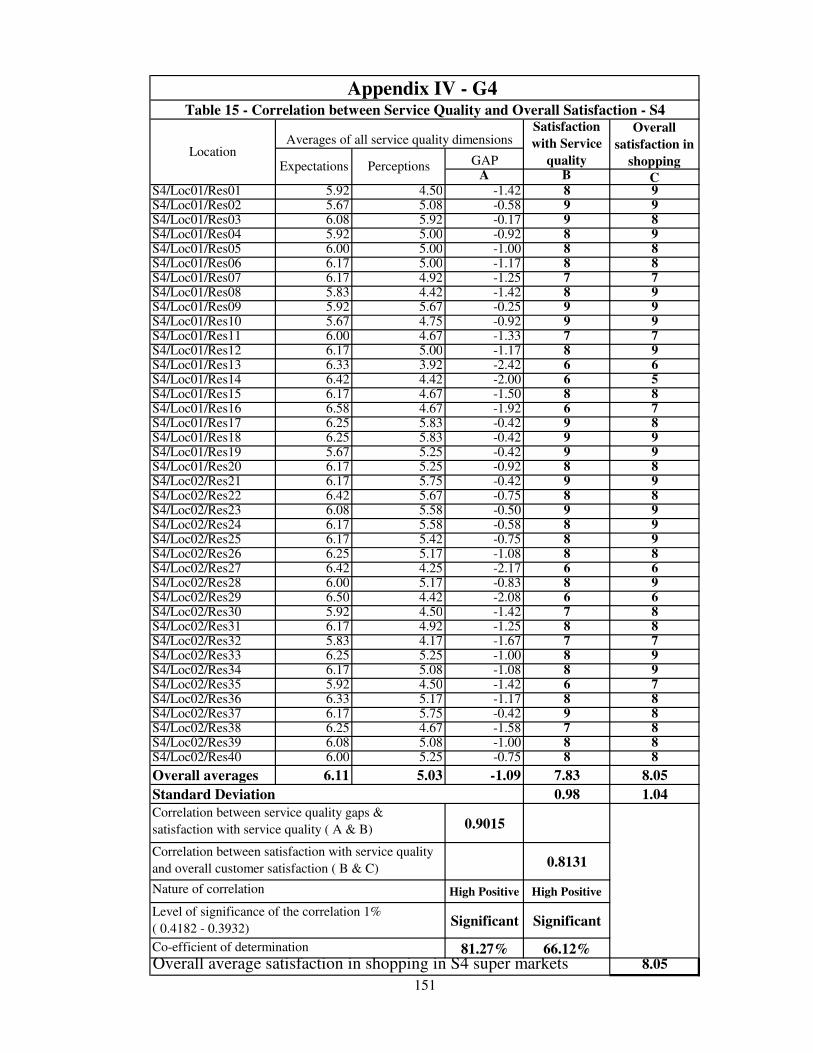
GAPA B C
S4/Loc01/Res01 5.92 4.50 -1.42 8 9S4/Loc01/Res02 5.67 5.08 -0.58 9 9S4/Loc01/Res03 6.08 5.92 -0.17 9 8S4/Loc01/Res04 5.92 5.00 -0.92 8 9S4/Loc01/Res05 6.00 5.00 -1.00 8 8S4/Loc01/Res06 6.17 5.00 -1.17 8 8S4/Loc01/Res07 6.17 4.92 -1.25 7 7S4/Loc01/Res08 5.83 4.42 -1.42 8 9S4/Loc01/Res09 5.92 5.67 -0.25 9 9S4/Loc01/Res10 5.67 4.75 -0.92 9 9S4/Loc01/Res11 6.00 4.67 -1.33 7 7S4/Loc01/Res12 6.17 5.00 -1.17 8 9S4/Loc01/Res13 6.33 3.92 -2.42 6 6S4/Loc01/Res14 6.42 4.42 -2.00 6 5S4/Loc01/Res15 6.17 4.67 -1.50 8 8S4/Loc01/Res16 6.58 4.67 -1.92 6 7S4/Loc01/Res17 6.25 5.83 -0.42 9 8S4/Loc01/Res18 6.25 5.83 -0.42 9 9S4/Loc01/Res19 5.67 5.25 -0.42 9 9S4/Loc01/Res20 6.17 5.25 -0.92 8 8S4/Loc02/Res21 6.17 5.75 -0.42 9 9S4/Loc02/Res22 6.42 5.67 -0.75 8 8S4/Loc02/Res23 6.08 5.58 -0.50 9 9S4/Loc02/Res24 6.17 5.58 -0.58 8 9S4/Loc02/Res25 6.17 5.42 -0.75 8 9S4/Loc02/Res26 6.25 5.17 -1.08 8 8S4/Loc02/Res27 6.42 4.25 -2.17 6 6S4/Loc02/Res28 6.00 5.17 -0.83 8 9S4/Loc02/Res29 6.50 4.42 -2.08 6 6S4/Loc02/Res30 5.92 4.50 -1.42 7 8S4/Loc02/Res31 6.17 4.92 -1.25 8 8S4/Loc02/Res32 5.83 4.17 -1.67 7 7S4/Loc02/Res33 6.25 5.25 -1.00 8 9S4/Loc02/Res34 6.17 5.08 -1.08 8 9S4/Loc02/Res35 5.92 4.50 -1.42 6 7S4/Loc02/Res36 6.33 5.17 -1.17 8 8S4/Loc02/Res37 6.17 5.75 -0.42 9 8S4/Loc02/Res38 6.25 4.67 -1.58 7 8S4/Loc02/Res39 6.08 5.08 -1.00 8 8S4/Loc02/Res40 6.00 5.25 -0.75 8 8
Overall averages 6.11 5.03 -1.09 7.83 8.05
0.98 1.04
0.9015
0.8131
High Positive High Positive
Significant Significant
81.27% 66.12%8.05
151
Appendix IV - G4
Overall average satisfaction in shopping in S4 super markets
Correlation between service quality gaps &
satisfaction with service quality ( A & B)
Correlation between satisfaction with service quality
and overall customer satisfaction ( B & C)
Nature of correlation
Level of significance of the correlation 1%
( 0.4182 - 0.3932)
Co-efficient of determination
Standard Deviation
Table 15 - Correlation between Service Quality and Overall Satisfaction - S4
Location
Overall
satisfaction in
shopping
Averages of all service quality dimensionsSatisfaction
with Service
qualityExpectations Perceptions
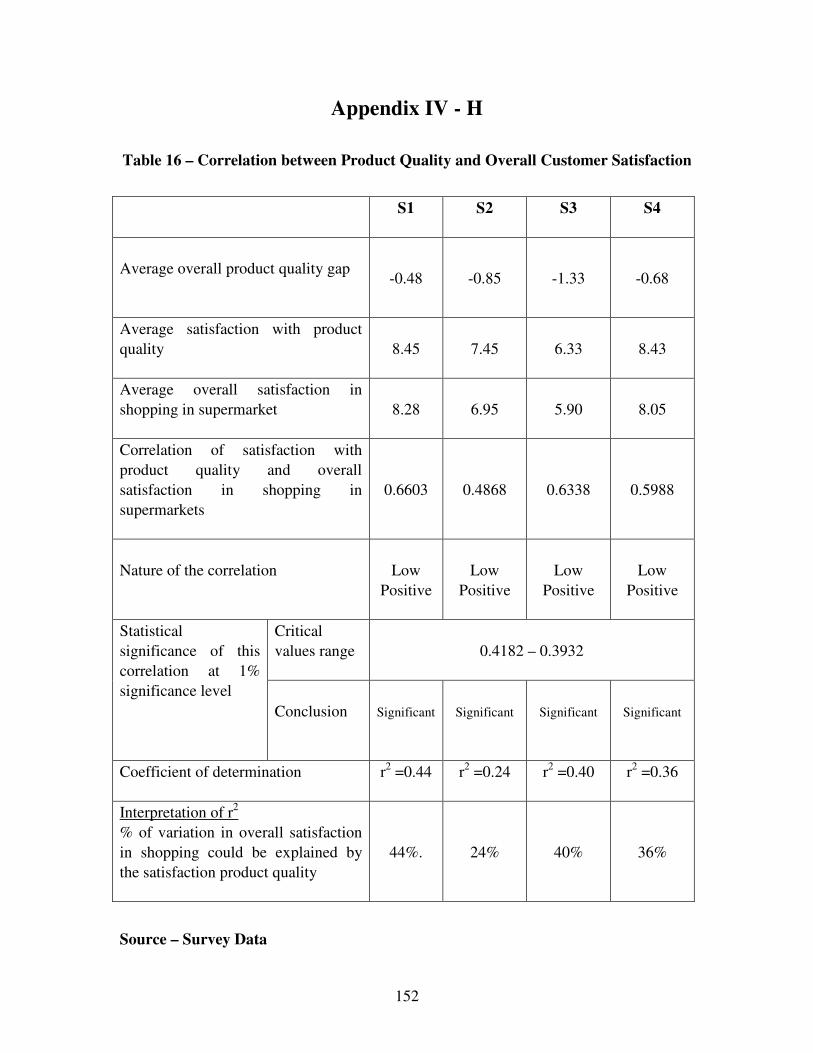
152
Appendix IV - H
Table 16 – Correlation between Product Quality and Overall Customer Satisfaction
S1 S2 S3 S4
Average overall product quality gap
-0.48 -0.85 -1.33 -0.68
Average satisfaction with product
quality
8.45 7.45 6.33 8.43
Average overall satisfaction in
shopping in supermarket
8.28 6.95 5.90 8.05
Correlation of satisfaction with
product quality and overall
satisfaction in shopping in
supermarkets
0.6603 0.4868 0.6338 0.5988
Nature of the correlation
Low
Positive
Low
Positive
Low
Positive
Low
Positive
Statistical
significance of this
correlation at 1%
significance level
Critical
values range
0.4182 – 0.3932
Conclusion
Significant
Significant
Significant
Significant
Coefficient of determination
r2 =0.44 r
2 =0.24 r
2 =0.40 r
2 =0.36
Interpretation of r2
% of variation in overall satisfaction
in shopping could be explained by
the satisfaction product quality
44%. 24% 40% 36%
Source – Survey Data
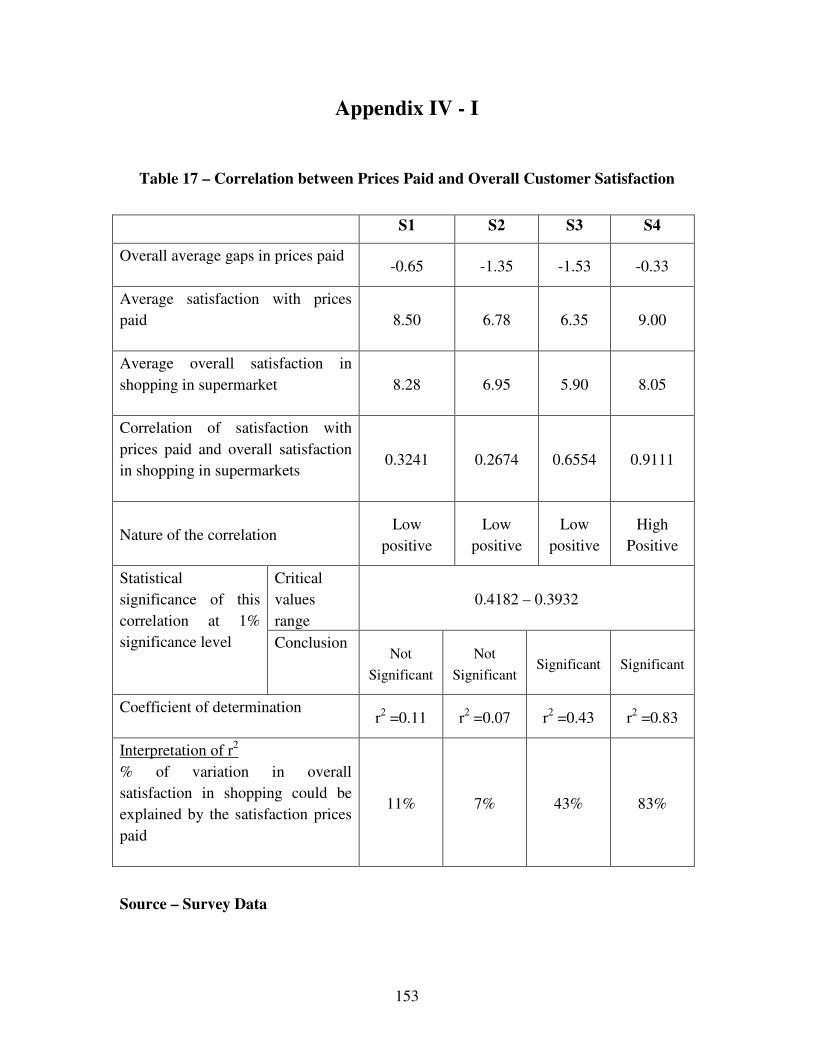
153
Appendix IV - I
Table 17 – Correlation between Prices Paid and Overall Customer Satisfaction
S1 S2 S3 S4
Overall average gaps in prices paid
-0.65 -1.35 -1.53 -0.33
Average satisfaction with prices
paid
8.50 6.78 6.35 9.00
Average overall satisfaction in
shopping in supermarket
8.28 6.95 5.90 8.05
Correlation of satisfaction with
prices paid and overall satisfaction
in shopping in supermarkets
0.3241 0.2674 0.6554 0.9111
Nature of the correlation
Low
positive
Low
positive
Low
positive
High
Positive
Statistical
significance of this
correlation at 1%
significance level
Critical
values
range
0.4182 – 0.3932
Conclusion
Not
Significant
Not
Significant Significant Significant
Coefficient of determination
r2 =0.11 r
2 =0.07 r
2 =0.43 r
2 =0.83
Interpretation of r2
% of variation in overall
satisfaction in shopping could be
explained by the satisfaction prices
paid
11% 7% 43% 83%
Source – Survey Data
154
Appendix IV - J
Results of the Regression Analysis done using Mini Tab
Computer Package.
Note to the reader
1. For each super market the regression analysis is done separately
2. Satisfaction with service quality, Satisfaction with product quality
and satisfaction with prices paid would be the independent variables
3. Overall satisfaction in shopping in the supermarket would be the
dependent variable
4. For S1, S2 and S3 super markets several regression models ( S1-2,
S2-3 & S4-2 ) have been done where in subsequent models omitting the
least important independent variable in further checking the
explanatory power of the balance variables in explaining overall
satisfaction.
5. For S3 super markets only one model was done as all the variables
was significant enough in explaining the relationship with overall
satisfaction
Line of best fit
For each model if r-sq > 75% it would be a good fit. Based on the results
the comment of the best of the regression line is as follows.
Super market Model 01
S1 � Done for service, product& prices
� R-sq > 91.3%
� Very good fit
S2 � Done for service, product& prices
� R-sq > 71.7%
� Not a good fit
S3 � Done for service, product& prices
� R-sq > 74.9%
� A Good fit
S4 � Done for service, product& prices
� R-sq > 88.4%
� Very good fit
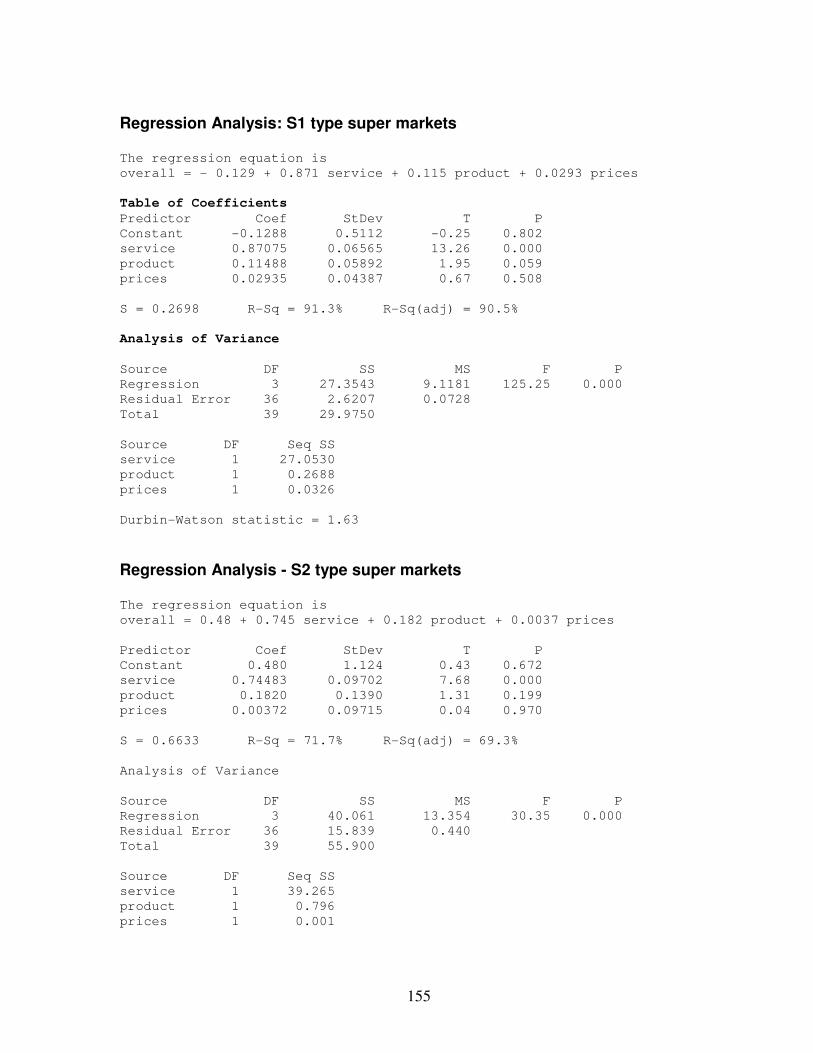
155
Regression Analysis: S1 type super markets The regression equation is
overall = - 0.129 + 0.871 service + 0.115 product + 0.0293 prices
Table of Coefficients
Predictor Coef StDev T P
Constant -0.1288 0.5112 -0.25 0.802
service 0.87075 0.06565 13.26 0.000
product 0.11488 0.05892 1.95 0.059
prices 0.02935 0.04387 0.67 0.508
S = 0.2698 R-Sq = 91.3% R-Sq(adj) = 90.5%
Analysis of Variance
Source DF SS MS F P
Regression 3 27.3543 9.1181 125.25 0.000
Residual Error 36 2.6207 0.0728
Total 39 29.9750
Source DF Seq SS
service 1 27.0530
product 1 0.2688
prices 1 0.0326
Durbin-Watson statistic = 1.63
Regression Analysis - S2 type super markets The regression equation is
overall = 0.48 + 0.745 service + 0.182 product + 0.0037 prices
Predictor Coef StDev T P
Constant 0.480 1.124 0.43 0.672
service 0.74483 0.09702 7.68 0.000
product 0.1820 0.1390 1.31 0.199
prices 0.00372 0.09715 0.04 0.970
S = 0.6633 R-Sq = 71.7% R-Sq(adj) = 69.3%
Analysis of Variance
Source DF SS MS F P
Regression 3 40.061 13.354 30.35 0.000
Residual Error 36 15.839 0.440
Total 39 55.900
Source DF Seq SS
service 1 39.265
product 1 0.796
prices 1 0.001

156
Durbin-Watson statistic = 1.86
Regression Analysis - S3 type super markets The regression equation is
overall = 0.650 + 0.428 service + 0.259 product + 0.185 prices
Predictor Coef StDev T P
Constant 0.6499 0.6989 0.93 0.359
service 0.42842 0.09424 4.55 0.000
product 0.2592 0.1009 2.57 0.015
prices 0.18550 0.09167 2.02 0.050
S = 0.4980 R-Sq = 74.9% R-Sq(adj) = 72.8%
Analysis of Variance
Source DF SS MS F P
Regression 3 26.6709 8.8903 35.84 0.000
Residual Error 36 8.9291 0.2480
Total 39 35.6000
Source DF Seq SS
service 1 23.8984
product 1 1.7568
prices 1 1.0157
Durbin-Watson statistic = 1.29
Regression Analysis - S4 type super markets
The regression equation is
overall = - 1.06 + 0.331 service + 0.162 product + 0.573 prices
Predictor Coef StDev T P
Constant -1.0591 0.6313 -1.68 0.102
service 0.33077 0.08964 3.69 0.001
product 0.16240 0.08198 1.98 0.055
prices 0.57252 0.09097 6.29 0.000
S = 0.3676 R-Sq = 88.4% R-Sq(adj) = 87.4%
Analysis of Variance
Source DF SS MS F P
Regression 3 37.036 12.345 91.37 0.000
Residual Error 36 4.864 0.135
Total 39 41.900
Source DF Seq SS
service 1 27.704
product 1 3.980
prices 1 5.352
Durbin-Watson statistic = 1.61
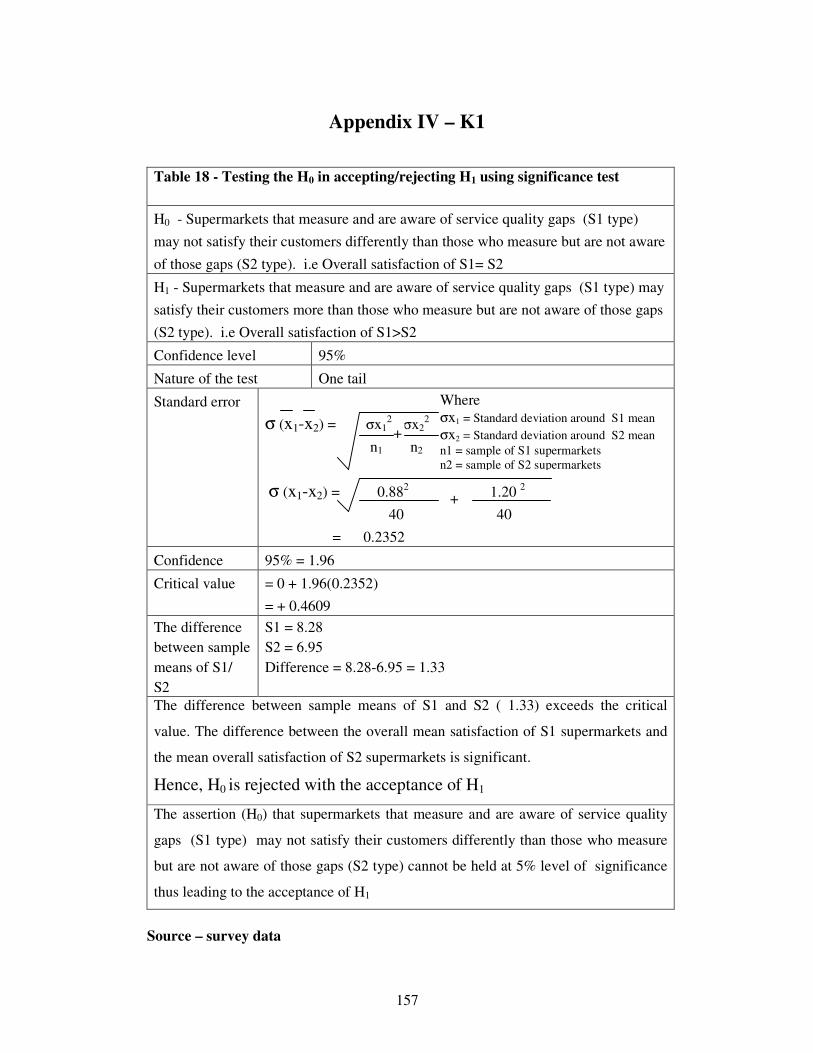
157
Appendix IV – K1
Table 18 - Testing the H0 in accepting/rejecting H1 using significance test
H0 - Supermarkets that measure and are aware of service quality gaps (S1 type)
may not satisfy their customers differently than those who measure but are not aware
of those gaps (S2 type). i.e Overall satisfaction of S1= S2
H1 - Supermarkets that measure and are aware of service quality gaps (S1 type) may
satisfy their customers more than those who measure but are not aware of those gaps
(S2 type). i.e Overall satisfaction of S1>S2
Confidence level 95%
Nature of the test One tail
Standard error
σ (x1-x2) = σx12 σx2
2
n1 n2
σ (x1-x2) = 0.882
1.20 2
40 40
= 0.2352
Confidence 95% = 1.96
Critical value = 0 + 1.96(0.2352)
= + 0.4609
The difference
between sample
means of S1/
S2
S1 = 8.28
S2 = 6.95
Difference = 8.28-6.95 = 1.33
The difference between sample means of S1 and S2 ( 1.33) exceeds the critical
value. The difference between the overall mean satisfaction of S1 supermarkets and
the mean overall satisfaction of S2 supermarkets is significant.
Hence, H0 is rejected with the acceptance of H1
The assertion (H0) that supermarkets that measure and are aware of service quality
gaps (S1 type) may not satisfy their customers differently than those who measure
but are not aware of those gaps (S2 type) cannot be held at 5% level of significance
thus leading to the acceptance of H1
Source – survey data
+
Where
σx1 = Standard deviation around S1 mean
σx2 = Standard deviation around S2 mean
n1 = sample of S1 supermarkets
n2 = sample of S2 supermarkets
+
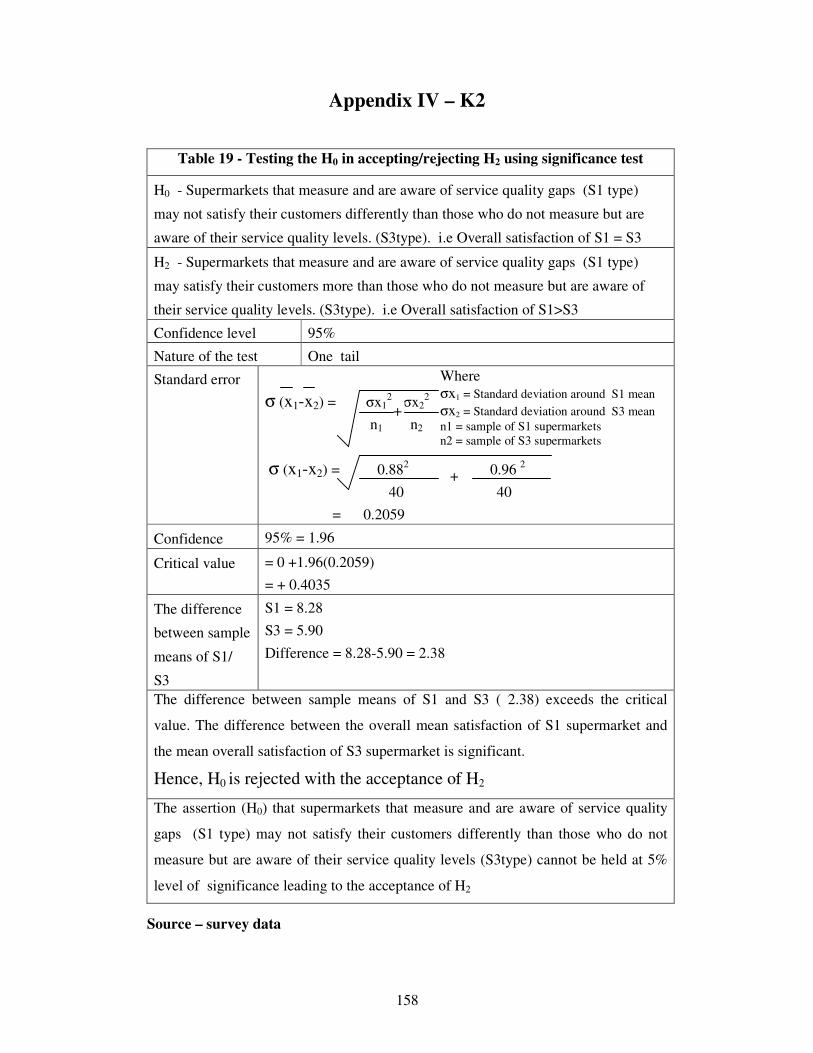
158
Appendix IV – K2
Table 19 - Testing the H0 in accepting/rejecting H2 using significance test
H0 - Supermarkets that measure and are aware of service quality gaps (S1 type)
may not satisfy their customers differently than those who do not measure but are
aware of their service quality levels. (S3type). i.e Overall satisfaction of S1 = S3
H2 - Supermarkets that measure and are aware of service quality gaps (S1 type)
may satisfy their customers more than those who do not measure but are aware of
their service quality levels. (S3type). i.e Overall satisfaction of S1>S3
Confidence level 95%
Nature of the test One tail
Standard error
σ (x1-x2) = σx12 σx2
2
n1 n2
σ (x1-x2) = 0.882
0.96 2
40 40
= 0.2059
Confidence 95% = 1.96
Critical value = 0 +1.96(0.2059)
= + 0.4035
The difference
between sample
means of S1/
S3
S1 = 8.28
S3 = 5.90
Difference = 8.28-5.90 = 2.38
The difference between sample means of S1 and S3 ( 2.38) exceeds the critical
value. The difference between the overall mean satisfaction of S1 supermarket and
the mean overall satisfaction of S3 supermarket is significant.
Hence, H0 is rejected with the acceptance of H2
The assertion (H0) that supermarkets that measure and are aware of service quality
gaps (S1 type) may not satisfy their customers differently than those who do not
measure but are aware of their service quality levels (S3type) cannot be held at 5%
level of significance leading to the acceptance of H2
Source – survey data
+
Where
σx1 = Standard deviation around S1 mean
σx2 = Standard deviation around S3 mean
n1 = sample of S1 supermarkets
n2 = sample of S3 supermarkets
+
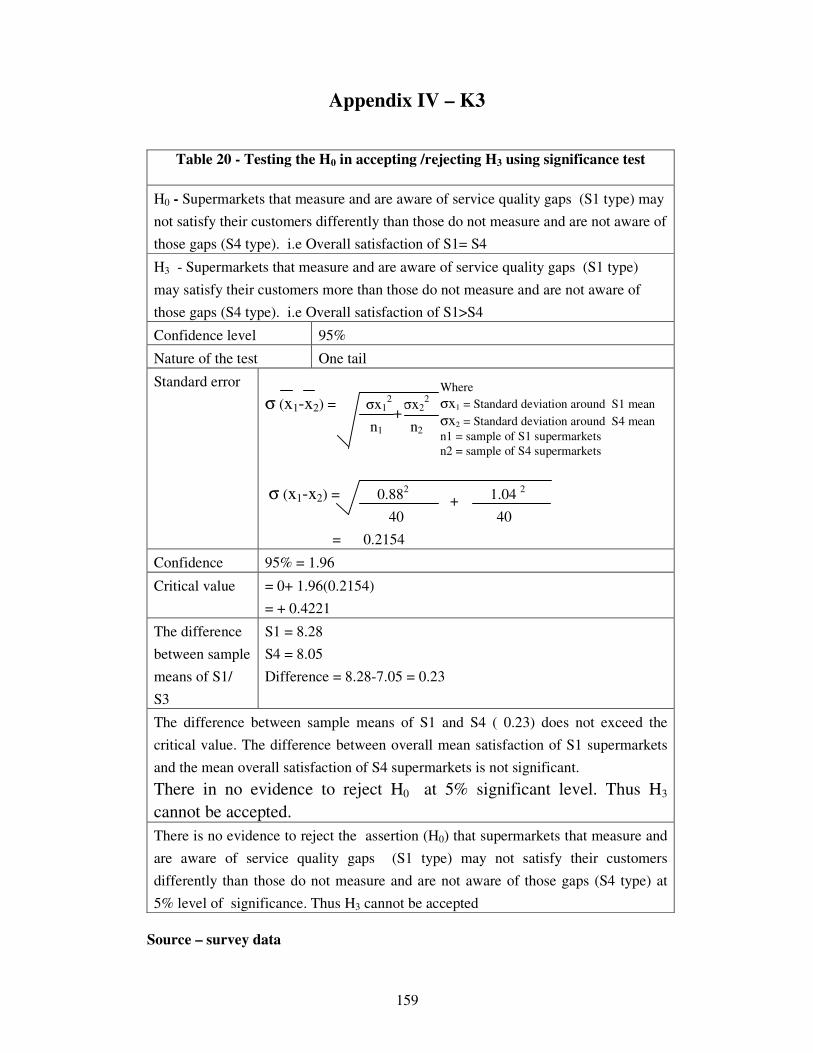
159
Appendix IV – K3
Table 20 - Testing the H0 in accepting /rejecting H3 using significance test
H0 - Supermarkets that measure and are aware of service quality gaps (S1 type) may
not satisfy their customers differently than those do not measure and are not aware of
those gaps (S4 type). i.e Overall satisfaction of S1= S4
H3 - Supermarkets that measure and are aware of service quality gaps (S1 type)
may satisfy their customers more than those do not measure and are not aware of
those gaps (S4 type). i.e Overall satisfaction of S1>S4
Confidence level 95%
Nature of the test One tail
Standard error
σ (x1-x2) = σx12 σx2
2
n1 n2
σ (x1-x2) = 0.882
1.04 2
40 40
= 0.2154
Confidence 95% = 1.96
Critical value = 0+ 1.96(0.2154)
= + 0.4221
The difference
between sample
means of S1/
S3
S1 = 8.28
S4 = 8.05
Difference = 8.28-7.05 = 0.23
The difference between sample means of S1 and S4 ( 0.23) does not exceed the
critical value. The difference between overall mean satisfaction of S1 supermarkets
and the mean overall satisfaction of S4 supermarkets is not significant.
There in no evidence to reject H0 at 5% significant level. Thus H3
cannot be accepted.
There is no evidence to reject the assertion (H0) that supermarkets that measure and
are aware of service quality gaps (S1 type) may not satisfy their customers
differently than those do not measure and are not aware of those gaps (S4 type) at
5% level of significance. Thus H3 cannot be accepted
Source – survey data
+
Where
σx1 = Standard deviation around S1 mean
σx2 = Standard deviation around S4 mean
n1 = sample of S1 supermarkets
n2 = sample of S4 supermarkets
+

160
Appendix IV - L
Table 21 - Summary of Regression Model for all Super Markets
Super
Mar
ket
s ty
pe
Nat
ure
of
the
segm
ents
(Y)
Ov
era
ll
sati
sfa
ctio
n
R -sq
>
75%
(X1) Service quality (X3 ) Prices paid (X2) Product quality
Sat
isfa
ctio
n
wit
h S
Q
Reg
ress
ion
coef
fici
ent Significance
of X3 for y
P<0.05
Sat
isfa
ctio
n
wit
h P
rice
s
Reg
ress
ion
coef
fici
ent Significance
of X3 for y
P<0.05
Sat
isfa
ctio
n
wit
h P
Q
Reg
ress
ion
coef
fici
ent
Significance
of X2 for y
P<0.05
S1
In
elastic 8.28 91.3% 8.25 0.871
0.0000 Significant
8.50 0.029
0.5080
Not significant
8.45
110%
0.115
0.5900
Slightly
Significant
S2
In
elastic 6.95 71.7% 6.93 0.745
0.0000
Significant
6.78 0.004 0.9700
Not significant
7.45 97%
0.182
0.1990
Not
significant
S3
Elastic 5.90 74.4% 5.98 0.428 0.0000
Significant
6.35 0.185
0.0500 Significant
6.33 83%
0.259 0.0150
Significant
S4
Elastic 8.05 88.4% 7.83 0.331
0.0001
Significant
9.00 0.573 0.0000 Significant
8.43 110%
0.162
0.0550
Slightly
significant
7.67
100% Source – Survey Data
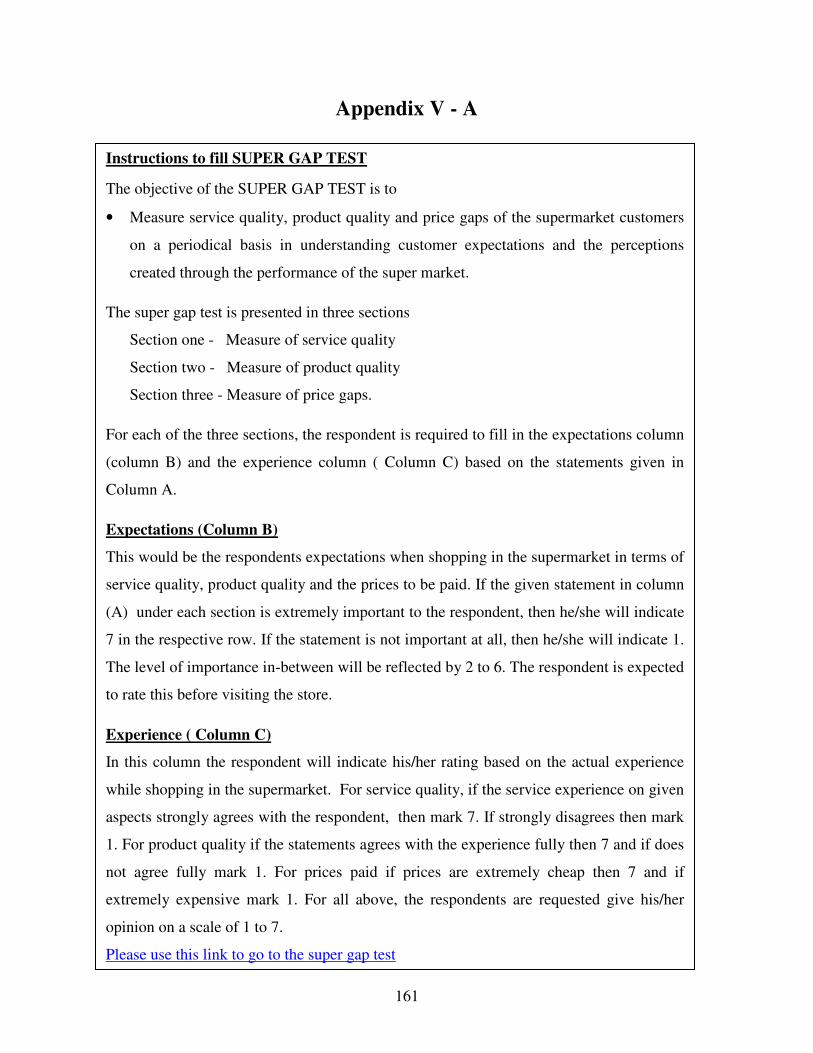
161
Appendix V - A
Instructions to fill SUPER GAP TEST
The objective of the SUPER GAP TEST is to
• Measure service quality, product quality and price gaps of the supermarket customers
on a periodical basis in understanding customer expectations and the perceptions
created through the performance of the super market.
The super gap test is presented in three sections
Section one - Measure of service quality
Section two - Measure of product quality
Section three - Measure of price gaps.
For each of the three sections, the respondent is required to fill in the expectations column
(column B) and the experience column ( Column C) based on the statements given in
Column A.
Expectations (Column B)
This would be the respondents expectations when shopping in the supermarket in terms of
service quality, product quality and the prices to be paid. If the given statement in column
(A) under each section is extremely important to the respondent, then he/she will indicate
7 in the respective row. If the statement is not important at all, then he/she will indicate 1.
The level of importance in-between will be reflected by 2 to 6. The respondent is expected
to rate this before visiting the store.
Experience ( Column C)
In this column the respondent will indicate his/her rating based on the actual experience
while shopping in the supermarket. For service quality, if the service experience on given
aspects strongly agrees with the respondent, then mark 7. If strongly disagrees then mark
1. For product quality if the statements agrees with the experience fully then 7 and if does
not agree fully mark 1. For prices paid if prices are extremely cheap then 7 and if
extremely expensive mark 1. For all above, the respondents are requested give his/her
opinion on a scale of 1 to 7.
Please use this link to go to the super gap test
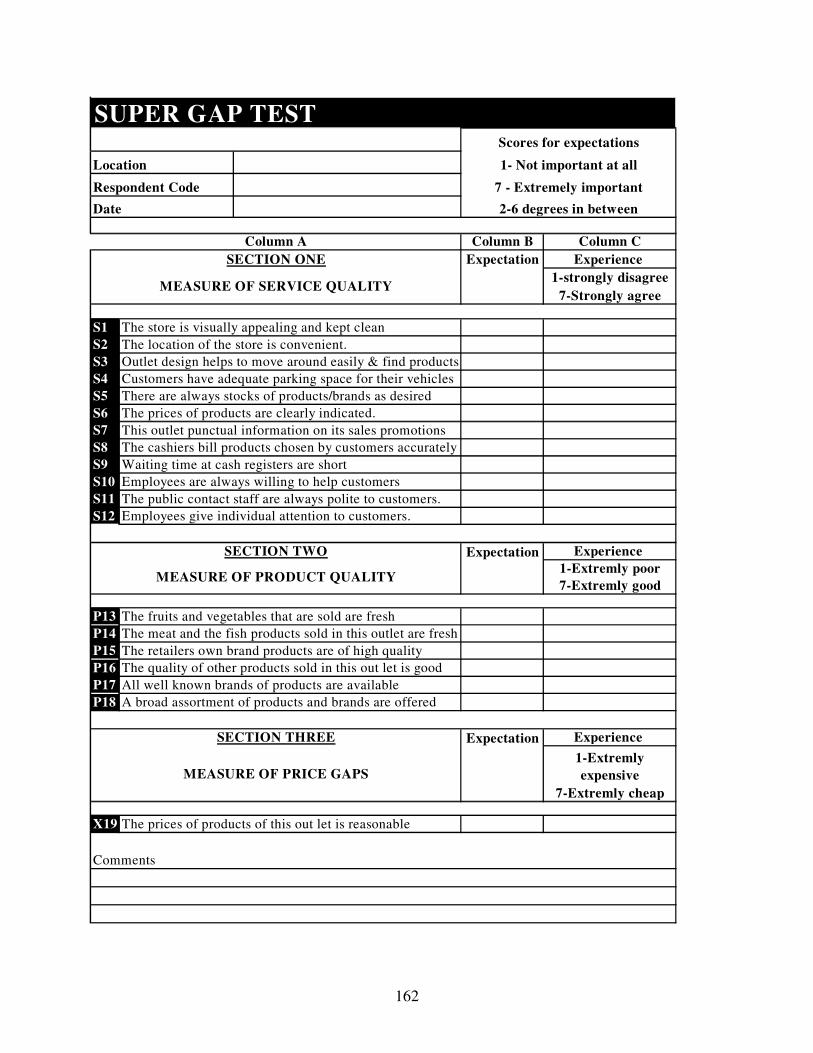
162
Column B Column C
Experience
1-strongly disagree
7-Strongly agree
S1
S2
S3
S4
S5
S6
S7
S8
S9
S10
S11
S12
Experience
1-Extremly poor
7-Extremly good
P13
P14
P15
P16
P17
P18
Experience
1-Extremly
expensive
7-Extremly cheap
X19
Comments
Employees are always willing to help customers
The public contact staff are always polite to customers.
Employees give individual attention to customers.
The fruits and vegetables that are sold are fresh
The meat and the fish products sold in this outlet are fresh
Expectation
The store is visually appealing and kept clean
The location of the store is convenient.
Outlet design helps to move around easily & find products
There are always stocks of products/brands as desired
The prices of products are clearly indicated.
This outlet punctual information on its sales promotions
The cashiers bill products chosen by customers accurately
Waiting time at cash registers are short
7 - Extremely important
2-6 degrees in between
Column A
The prices of products of this out let is reasonable
Customers have adequate parking space for their vehicles
MEASURE OF PRICE GAPS
The retailers own brand products are of high quality
The quality of other products sold in this out let is good
SECTION ONE
MEASURE OF SERVICE QUALITY
SECTION TWO
MEASURE OF PRODUCT QUALITY
SECTION THREE
All well known brands of products are available
A broad assortment of products and brands are offered
Expectation
Expectation
SUPER GAP TEST
Location
Respondent Code
Date
Scores for expectations
1- Not important at all
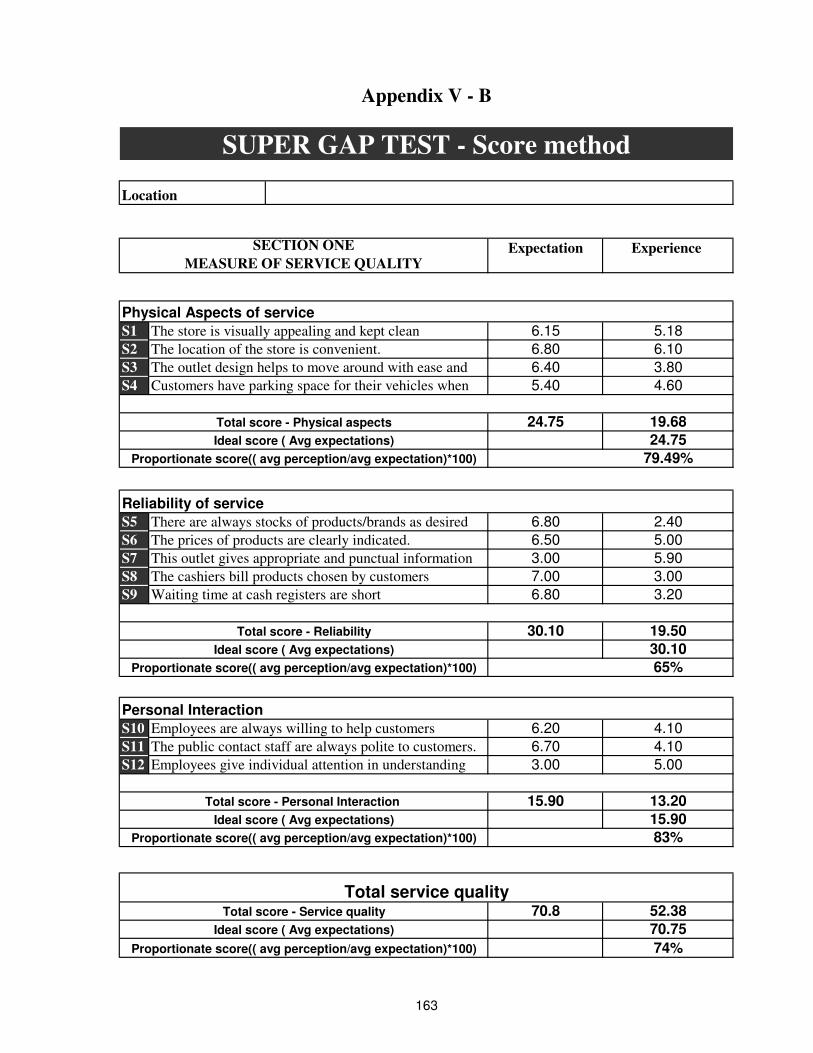
Expectation Experience
S1 6.15 5.18
S2 6.80 6.10
S3 6.40 3.80
S4 5.40 4.60
24.75 19.68
24.75
79.49%
S5 6.80 2.40
S6 6.50 5.00
S7 3.00 5.90
S8 7.00 3.00
S9 6.80 3.20
30.10 19.50
30.10
65%
S10 6.20 4.10
S11 6.70 4.10
S12 3.00 5.00
15.90 13.20
15.90
83%
70.8 52.38
70.75
74%
Appendix V - B
The location of the store is convenient.
Ideal score ( Avg expectations)
The prices of products are clearly indicated.
Employees are always willing to help customers
The public contact staff are always polite to customers.
Employees give individual attention in understanding
163
Ideal score ( Avg expectations)
Proportionate score(( avg perception/avg expectation)*100)
This outlet gives appropriate and punctual information
The cashiers bill products chosen by customers
Waiting time at cash registers are short
Reliability of service
There are always stocks of products/brands as desired
SUPER GAP TEST - Score method
Total score - Reliability
Ideal score ( Avg expectations)
Total service quality
The store is visually appealing and kept clean
Physical Aspects of service
Location
Total score - Personal Interaction
Proportionate score(( avg perception/avg expectation)*100)
Total score - Service quality
Ideal score ( Avg expectations)
Proportionate score(( avg perception/avg expectation)*100)
SECTION ONE
MEASURE OF SERVICE QUALITY
Total score - Physical aspects
The outlet design helps to move around with ease and
Customers have parking space for their vehicles when
Proportionate score(( avg perception/avg expectation)*100)
Personal Interaction
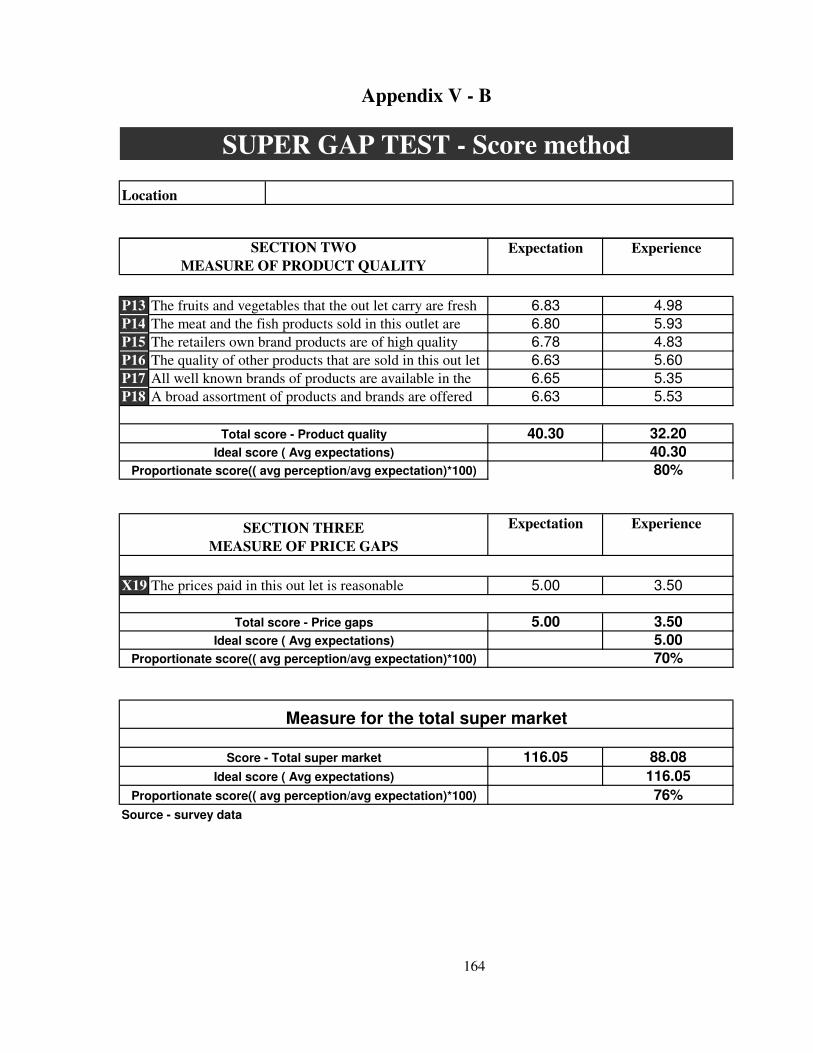
Appendix V - B
SUPER GAP TEST - Score method
Location
Expectation Experience
P13 6.83 4.98
P14 6.80 5.93
P15 6.78 4.83
P16 6.63 5.60
P17 6.65 5.35
P18 6.63 5.53
40.30 32.20
40.30
80%
Expectation Experience
X19 5.00 3.50
5.00 3.50
5.00
70%
116.05 88.08
116.05
76%
Source - survey data
164
Measure for the total super market
Total score - Price gaps
Ideal score ( Avg expectations)
Proportionate score(( avg perception/avg expectation)*100)
Ideal score ( Avg expectations)
Proportionate score(( avg perception/avg expectation)*100)
Score - Total super market
A broad assortment of products and brands are offered
SECTION THREE
MEASURE OF PRICE GAPS
Total score - Product quality
Ideal score ( Avg expectations)
Proportionate score(( avg perception/avg expectation)*100)
The prices paid in this out let is reasonable
The fruits and vegetables that the out let carry are fresh
The meat and the fish products sold in this outlet are
The retailers own brand products are of high quality
The quality of other products that are sold in this out let
All well known brands of products are available in the
SECTION TWO
MEASURE OF PRODUCT QUALITY
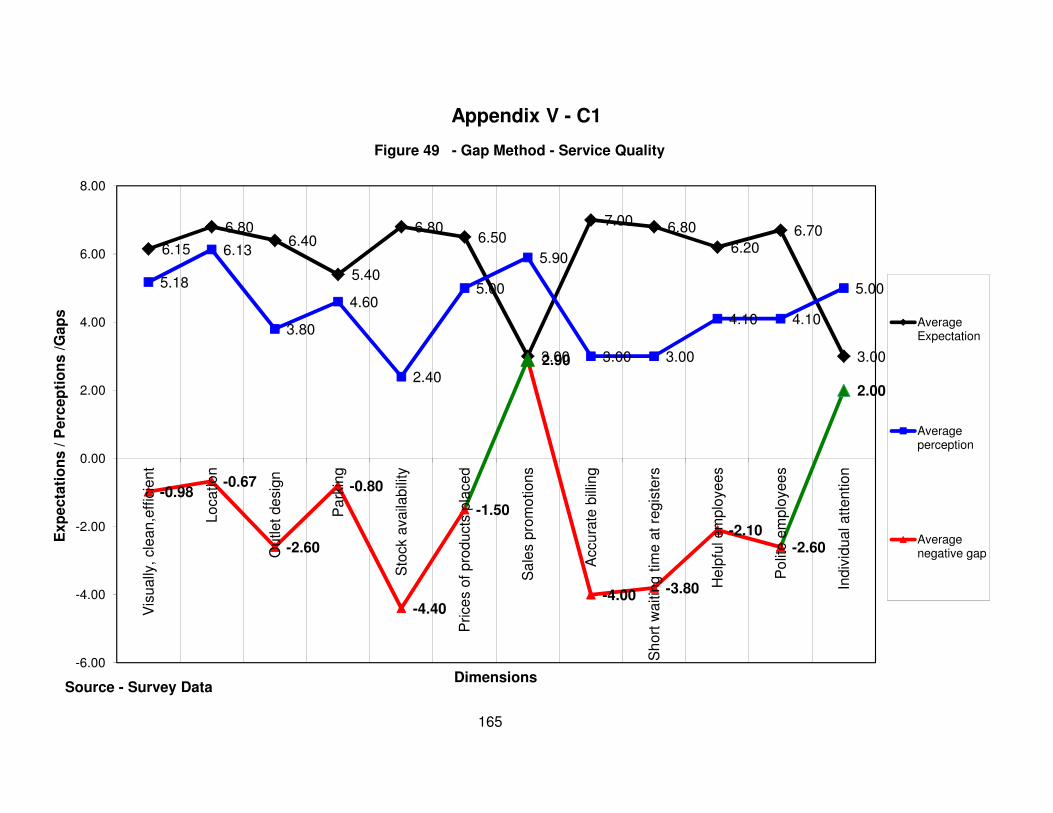
6.15
6.806.40
5.40
6.806.50
3.00
7.00 6.80
6.206.70
3.00
5.18
6.13
3.80
4.60
2.40
5.00
5.90
3.00 3.00
4.10 4.10
5.00
-0.98-0.67
-2.60
-0.80
-4.40
-1.50
2.90
-4.00 -3.80
-2.10-2.60
2.00
-6.00
-4.00
-2.00
0.00
2.00
4.00
6.00
8.00
Vis
ually
, cle
an,e
ffic
ient
Loca
tion
Outlet desig
n
Pa
rkin
g
Sto
ck a
vaila
bili
ty
Price
s o
f p
rod
ucts
pla
ced
Sa
les p
rom
otions
Accu
rate
bill
ing
Sh
ort
waitin
g tim
e a
t re
gis
ters
He
lpfu
l em
plo
yees
Po
lite e
mplo
yee
s
Indiv
idual att
ention
Exp
ecta
tio
ns /
Perc
ep
tio
ns /
Gap
s
Dimensions
Figure 49 - Gap Method - Service Quality
AverageExpectation
Averageperception
Averagenegative gap
Appendix V - C1
Source - Survey Data
165
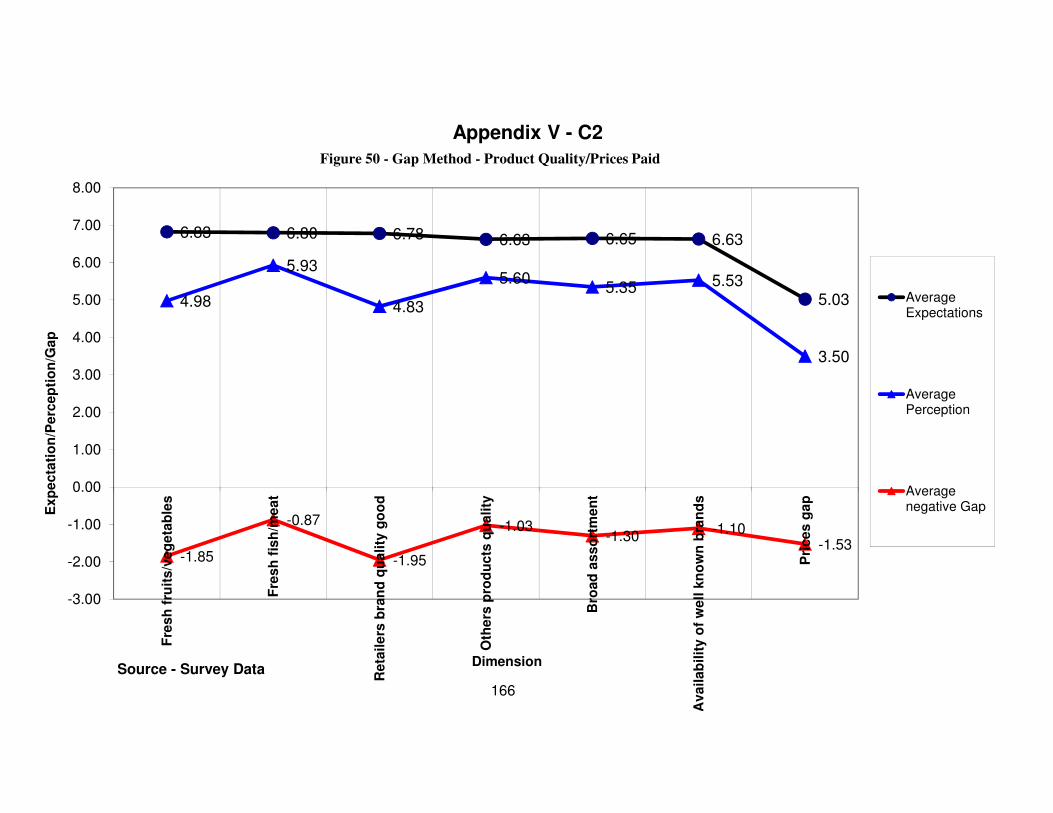
6.83 6.80 6.78 6.63 6.65 6.63
5.034.98
5.93
4.83
5.605.35 5.53
3.50
-1.85
-0.87
-1.95
-1.03 -1.30
-1.10 -1.53
-3.00
-2.00
-1.00
0.00
1.00
2.00
3.00
4.00
5.00
6.00
7.00
8.00
Fre
sh
fru
its
/ve
ge
tab
les
Fre
sh
fis
h/m
ea
t
Re
tail
ers
bra
nd
qu
ali
ty g
oo
d
Oth
ers
pro
du
cts
qu
ali
ty
Bro
ad
as
so
rtm
en
t
Av
ail
ab
ilit
y o
f w
ell
kn
ow
n b
ran
ds
Pri
ce
s g
ap
Ex
pe
cta
tio
n/P
erc
ep
tio
n/G
ap
Dimension
AverageExpectations
AveragePerception
Averagenegative Gap
Source - Survey Data
Appendix V - C2
166
Figure 50 - Gap Method - Product Quality/Prices Paid
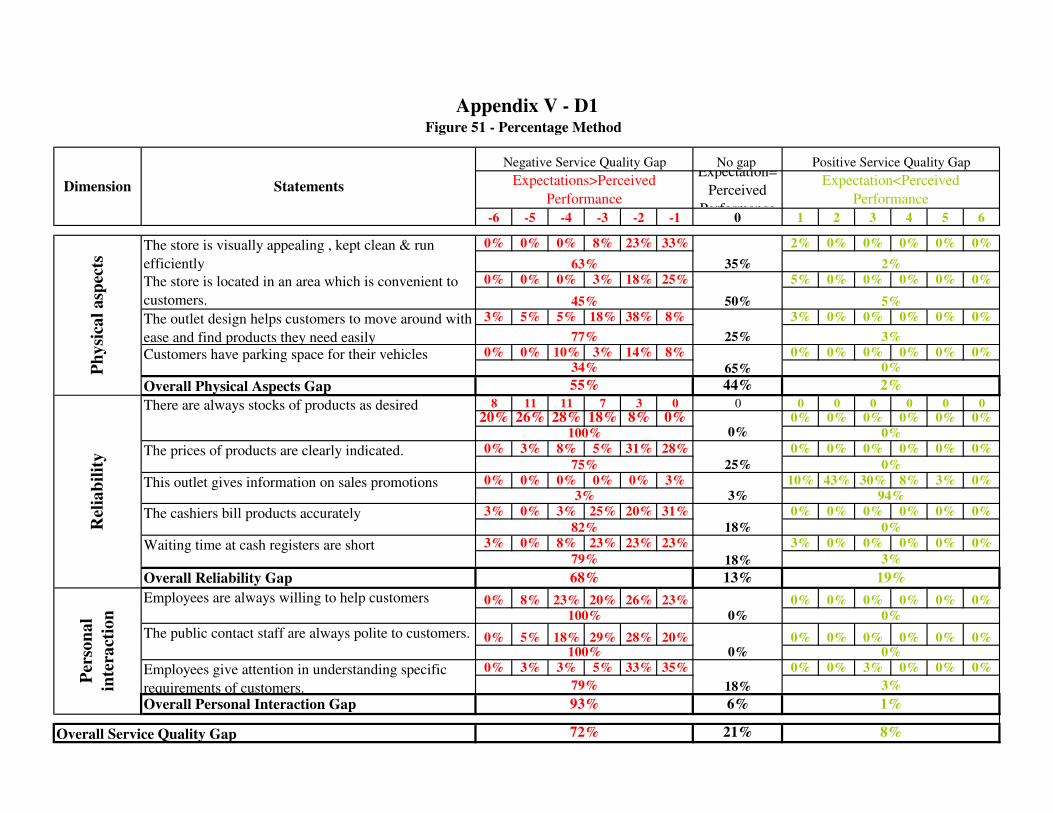
No gap Expectation=
Perceived
Performance-6 -5 -4 -3 -2 -1 0 1 2 3 4 5 6
0% 0% 0% 8% 23% 33% 2% 0% 0% 0% 0% 0%
0% 0% 0% 3% 18% 25% 5% 0% 0% 0% 0% 0%
3% 5% 5% 18% 38% 8% 3% 0% 0% 0% 0% 0%
0% 0% 10% 3% 14% 8% 0% 0% 0% 0% 0% 0%
Overall Physical Aspects Gap 44%
8 11 11 7 3 0 0 0 0 0 0 0 0
20% 26% 28% 18% 8% 0% 0% 0% 0% 0% 0% 0%
0% 3% 8% 5% 31% 28% 0% 0% 0% 0% 0% 0%
0% 0% 0% 0% 0% 3% 10% 43% 30% 8% 3% 0%
3% 0% 3% 25% 20% 31% 0% 0% 0% 0% 0% 0%
3% 0% 8% 23% 23% 23% 3% 0% 0% 0% 0% 0%
Overall Reliability Gap 13%
0% 8% 23% 20% 26% 23% 0% 0% 0% 0% 0% 0%
0% 5% 18% 29% 28% 20% 0% 0% 0% 0% 0% 0%
0% 3% 3% 5% 33% 35% 0% 0% 3% 0% 0% 0%
Overall Personal Interaction Gap 6%
21%
Expectation<Perceived
Performance
Figure 51 - Percentage Method
50%45% 5%
35% 2%
The store is visually appealing , kept clean & run
efficiently
Ph
ysi
cal
asp
ects
The store is located in an area which is convenient to
customers.
63%
Appendix V - D1
Dimension Statements
Negative Service Quality Gap Positive Service Quality Gap
Expectations>Perceived
Performance
The outlet design helps customers to move around with
ease and find products they need easily 25%77% 3%
Customers have parking space for their vehicles
55%
The prices of products are clearly indicated.25%75% 0%
65%34% 0%
This outlet gives information on sales promotions3%3% 94%
2%
Rel
iab
ilit
y
There are always stocks of products as desired
0%100% 0%
18%79% 3%
The cashiers bill products accurately18%82% 0%
3%
19%
0%100% 0%
0%100% 0%
1%
Overall Service Quality Gap 72% 8%
Per
son
al
inte
ract
ion
Employees are always willing to help customers
The public contact staff are always polite to customers.
18%79%
93%
68%
Waiting time at cash registers are short
Employees give attention in understanding specific
requirements of customers.
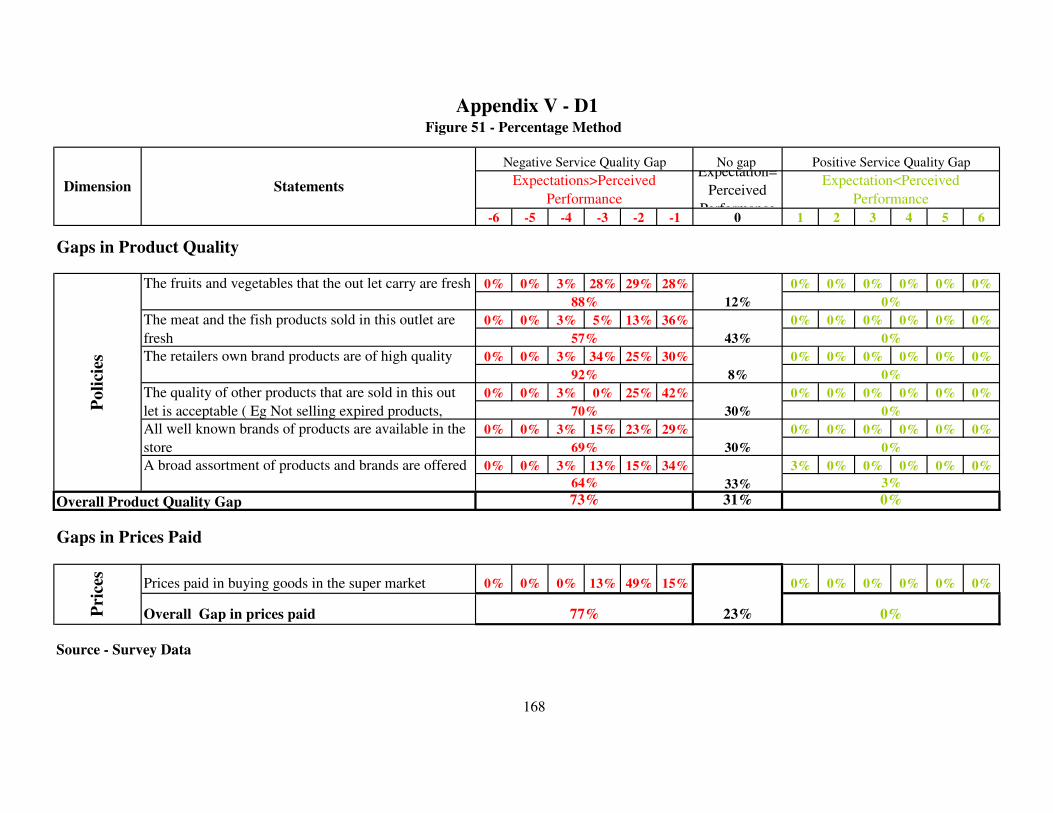
No gap Expectation=
Perceived
Performance-6 -5 -4 -3 -2 -1 0 1 2 3 4 5 6
Expectation<Perceived
Performance
Figure 51 - Percentage Method
Appendix V - D1
Dimension Statements
Negative Service Quality Gap Positive Service Quality Gap
Expectations>Perceived
Performance
Gaps in Product Quality
0% 0% 3% 28% 29% 28% 0% 0% 0% 0% 0% 0%
0% 0% 3% 5% 13% 36% 0% 0% 0% 0% 0% 0%
0% 0% 3% 34% 25% 30% 0% 0% 0% 0% 0% 0%
0% 0% 3% 0% 25% 42% 0% 0% 0% 0% 0% 0%
0% 0% 3% 15% 23% 29% 0% 0% 0% 0% 0% 0%
0% 0% 3% 13% 15% 34% 3% 0% 0% 0% 0% 0%
31%
Gaps in Prices Paid
Prices paid in buying goods in the super market 0% 0% 0% 13% 49% 15% 0% 0% 0% 0% 0% 0%
Overall Gap in prices paid
Source - Survey Data
168
8%92%
0%
The meat and the fish products sold in this outlet are
fresh 43%57% 0%
The fruits and vegetables that the out let carry are fresh
12%88%
3%
All well known brands of products are available in the
store 30%69%
0%
The quality of other products that are sold in this out
let is acceptable ( Eg Not selling expired products, 30%70% 0%
The retailers own brand products are of high quality
Pri
ces
23%77% 0%
Overall Product Quality Gap 73%
Po
lici
es
0%
0%
A broad assortment of products and brands are offered
33%64%
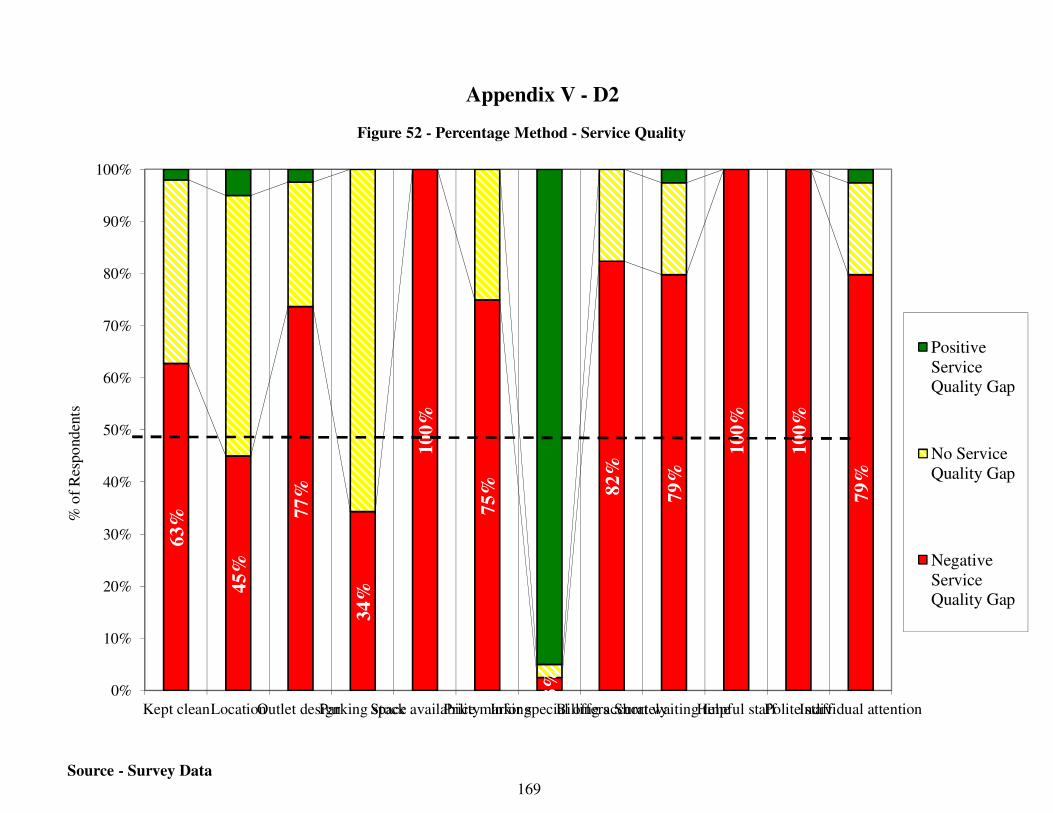
63
%
45
%
77
%
34
%
10
0%
75
%
3%
82
%
79
%
10
0%
10
0%
79
%
0%
10%
20%
30%
40%
50%
60%
70%
80%
90%
100%
Kept cleanLocationOutlet designParking spaceStock availabilityPrice markingInfor special offersBilling accuratelyShort waiting timeHelpful staffPolite staffIndividual attention
% o
f R
espo
nden
ts
Figure 52 - Percentage Method - Service Quality
Positive
ServiceQuality Gap
No Service
Quality Gap
Negative
ServiceQuality Gap
Source - Survey Data
Appendix V - D2
169

88
%
57
%
92
%
70
%
69
%
64
% 77
%
0%
10%
20%
30%
40%
50%
60%
70%
80%
90%
100%
Freshfruits/vegetables
Fresh fish/meats Quality of retailersbrands
Quality of othergoods
Availability of wellknown brands
Broad assortment Price gaps
% o
f re
sp
on
de
nts
Figure 53 - Percentage Method -Product Quality and Price Gaps
PositiveServiceQuality Gap
No ServiceQuality Gap
NegativeServiceQuality Gap
Appendix V - D3
170Source - Survey Data

0.0
1.0
2.0
3.0
4.0
5.0
6.0
7.0
8.0
0.0 1.0 2.0 3.0 4.0 5.0 6.0 7.0 8.0
Imp
ort
an
ce
Perceived Performance
Figure 54 - Importance Perception Matrix for individual aspects of Service Quality
Location
Outlet design findproducts
Parking
Stock availability
Prices of productsplaced
Sales promotions
Accurate billing
Short waiting time atregisters
Helpful employees
Polite employees
Individual attention
Visually,clean,efficient
Relative indifferenceREDUCE effort
Irrelavent SuperiorityMAINTAIN with out
Effort
Competitive strengthMAINTAIN
Competitive Vulnerability
IMPROVE
Source - Survey Data
Appendix V - E1
171
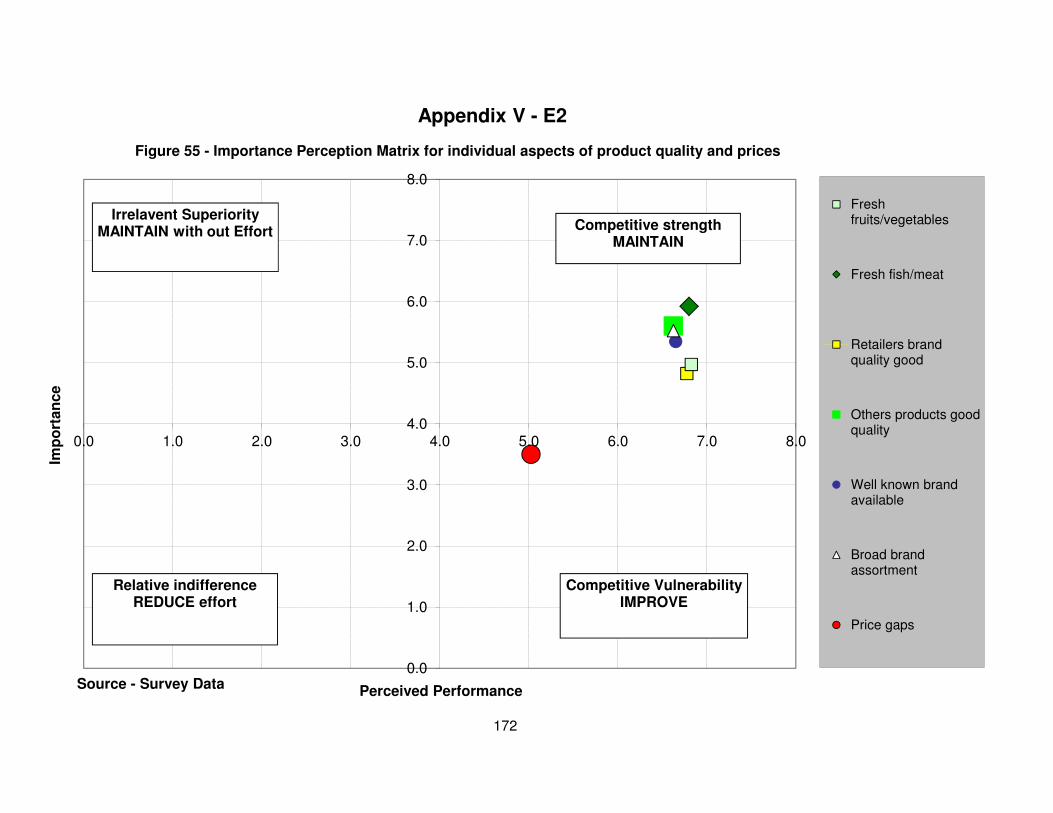
0.0
1.0
2.0
3.0
4.0
5.0
6.0
7.0
8.0
0.0 1.0 2.0 3.0 4.0 5.0 6.0 7.0 8.0
Imp
ort
an
ce
Perceived Performance
Figure 55 - Importance Perception Matrix for individual aspects of product quality and prices
Freshfruits/vegetables
Fresh fish/meat
Retailers brandquality good
Others products goodquality
Well known brandavailable
Broad brandassortment
Price gaps
Relative indifferenceREDUCE effort
Irrelavent SuperiorityMAINTAIN with out Effort Competitive strength
MAINTAIN
Competitive VulnerabilityIMPROVE
Source - Survey Data
Appendix V - E2
172
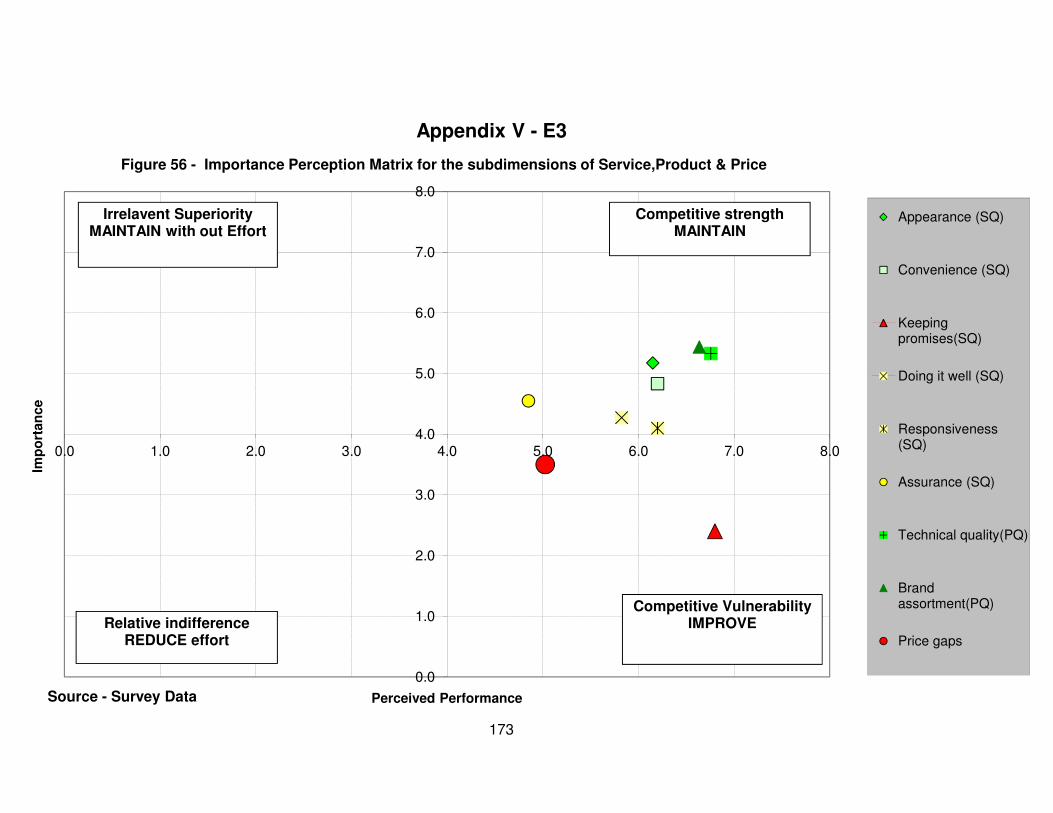
0.0
1.0
2.0
3.0
4.0
5.0
6.0
7.0
8.0
0.0 1.0 2.0 3.0 4.0 5.0 6.0 7.0 8.0
Imp
ort
an
ce
Perceived Performance
Figure 56 - Importance Perception Matrix for the subdimensions of Service,Product & Price
Appearance (SQ)
Convenience (SQ)
Keepingpromises(SQ)
Doing it well (SQ)
Responsiveness(SQ)
Assurance (SQ)
Technical quality(PQ)
Brandassortment(PQ)
Price gaps
Competitive strengthMAINTAIN
Competitive VulnerabilityIMPROVERelative indifference
REDUCE effort
Irrelavent SuperiorityMAINTAIN with out Effort
Appendix V - E3
Source - Survey Data
173
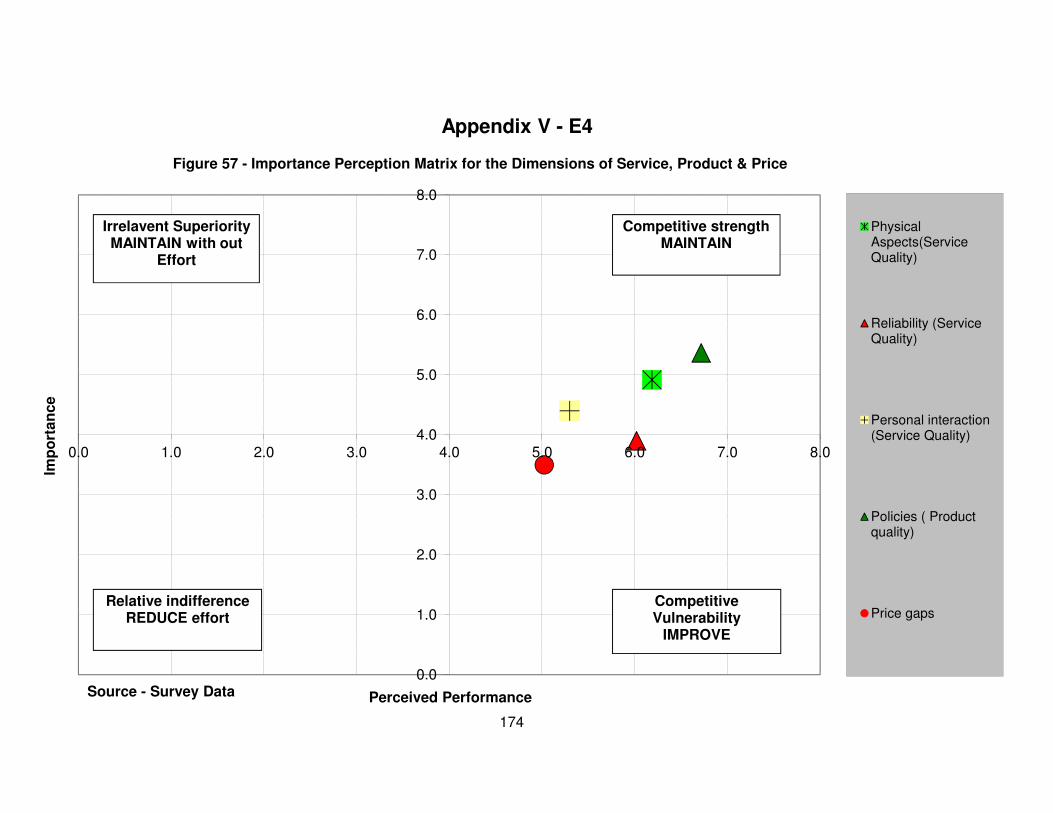
0.0
1.0
2.0
3.0
4.0
5.0
6.0
7.0
8.0
0.0 1.0 2.0 3.0 4.0 5.0 6.0 7.0 8.0
Imp
ort
an
ce
Perceived Performance
Figure 57 - Importance Perception Matrix for the Dimensions of Service, Product & Price
PhysicalAspects(ServiceQuality)
Reliability (ServiceQuality)
Personal interaction(Service Quality)
Policies ( Productquality)
Price gaps
Competitive strengthMAINTAIN
Competitive Vulnerability
IMPROVE
Relative indifferenceREDUCE effort
Irrelavent SuperiorityMAINTAIN with out
Effort
Appendix V - E4
Source - Survey Data
174
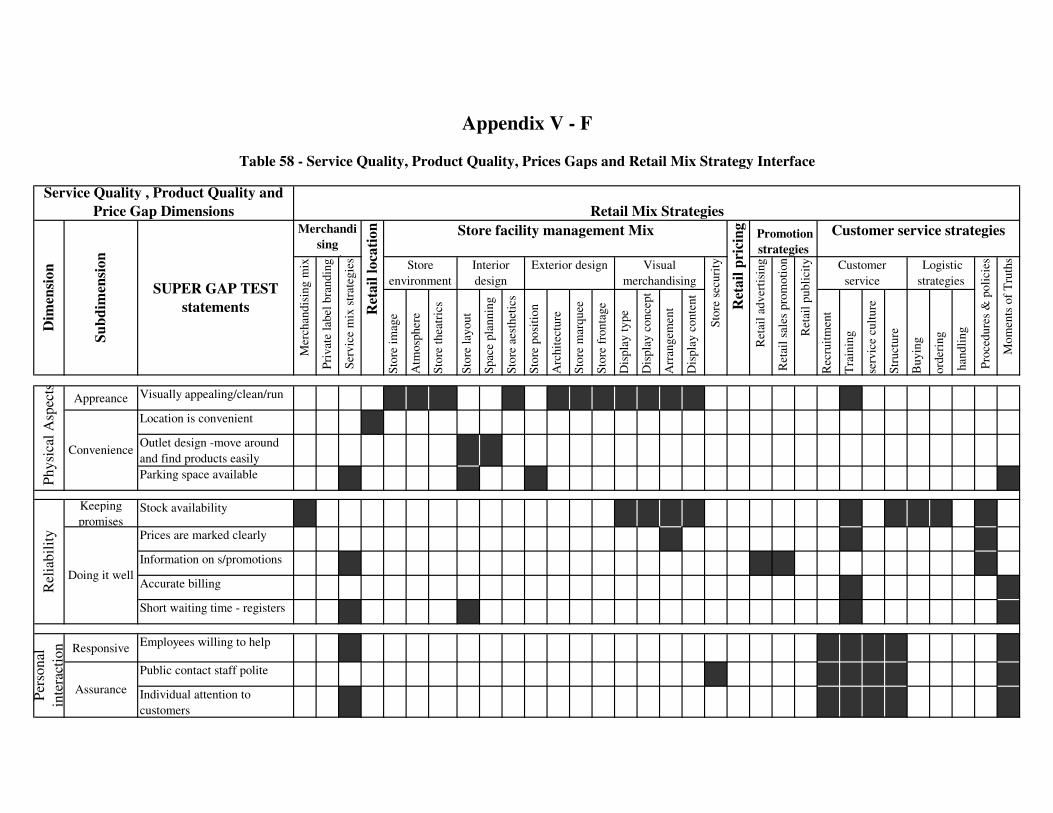
Sto
re i
mag
e
Atm
osp
her
e
Sto
re t
hea
tric
s
Sto
re l
ayout
Spac
e pla
nnin
g
Sto
re a
esth
etic
s
Sto
re p
osi
tion
Arc
hit
ectu
re
Sto
re m
arquee
Sto
re f
ronta
ge
Dis
pla
y t
ype
Dis
pla
y c
once
pt
Arr
angem
ent
Dis
pla
y c
onte
nt
Rec
ruit
men
t
Tra
inin
g
serv
ice
cult
ure
Str
uct
ure
Buyin
g
ord
erin
g
han
dli
ng
Appreance Visually appealing/clean/run
Location is convenient
Outlet design -move around
and find products easily
Parking space available
Keeping
promisesStock availability
Prices are marked clearly
Information on s/promotions
Accurate billing
Short waiting time - registers
ResponsiveEmployees willing to help
Public contact staff polite
Individual attention to
customers
Interior
design
Exterior design Visual
merchandising
Store facility management Mix
Assurance
Appendix V - F
Ser
vic
e m
ix s
trat
egie
s
Customer
service
Pro
cedure
s &
poli
cies
Sto
re s
ecuri
tyStore
environment
Ret
ail
publi
city
Ph
ysi
cal
Asp
ects
Convenience
Rel
iab
ilit
y
Doing it well
Per
son
al
inte
ract
ion
Promotion
strategies
Customer service strategies
Ret
ail
pri
cin
g
Ret
ail
lo
cati
on
Mom
ents
of
Tru
ths
Mer
chan
dis
ing m
ix
Logistic
strategies
Pri
vat
e la
bel
bra
ndin
g
Ret
ail
adver
tisi
ng
Ret
ail
sale
s pro
moti
on
Table 58 - Service Quality, Product Quality, Prices Gaps and Retail Mix Strategy Interface
Retail Mix Strategies
Service Quality , Product Quality and
Price Gap Dimensions
Dim
ensi
on
Su
bd
imen
sio
n
SUPER GAP TEST
statements
Merchandi
sing
strategies
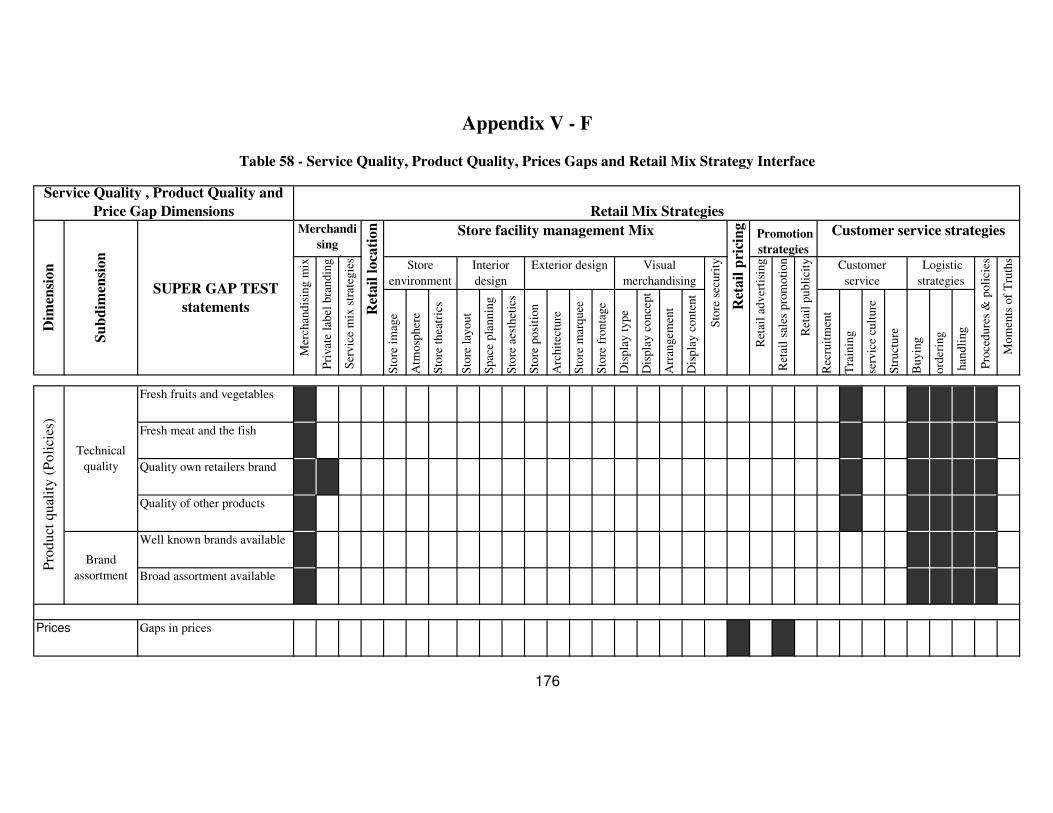
Sto
re i
mag
e
Atm
osp
her
e
Sto
re t
hea
tric
s
Sto
re l
ayout
Spac
e pla
nnin
g
Sto
re a
esth
etic
s
Sto
re p
osi
tion
Arc
hit
ectu
re
Sto
re m
arquee
Sto
re f
ronta
ge
Dis
pla
y t
ype
Dis
pla
y c
once
pt
Arr
angem
ent
Dis
pla
y c
onte
nt
Rec
ruit
men
t
Tra
inin
g
serv
ice
cult
ure
Str
uct
ure
Buyin
g
ord
erin
g
han
dli
ng
Interior
design
Exterior design Visual
merchandising
Store facility management Mix
Appendix V - F
Ser
vic
e m
ix s
trat
egie
s
Customer
service
Pro
cedure
s &
poli
cies
Sto
re s
ecuri
tyStore
environment
Ret
ail
publi
city
Promotion
strategies
Customer service strategies
Ret
ail
pri
cin
g
Ret
ail
lo
cati
on
Mom
ents
of
Tru
ths
Mer
chan
dis
ing m
ix
Logistic
strategies
Pri
vat
e la
bel
bra
ndin
g
Ret
ail
adver
tisi
ng
Ret
ail
sale
s pro
moti
on
Table 58 - Service Quality, Product Quality, Prices Gaps and Retail Mix Strategy Interface
Retail Mix Strategies
Service Quality , Product Quality and
Price Gap Dimensions
Dim
ensi
on
Su
bd
imen
sio
n
SUPER GAP TEST
statements
Merchandi
sing
strategies
Fresh fruits and vegetables
Fresh meat and the fish
Quality own retailers brand
Quality of other products
Well known brands available
Broad assortment available
Gaps in prices
Pro
du
ct q
ual
ity
(P
oli
cies
)
Technical
quality
Brand
assortment
Prices
176
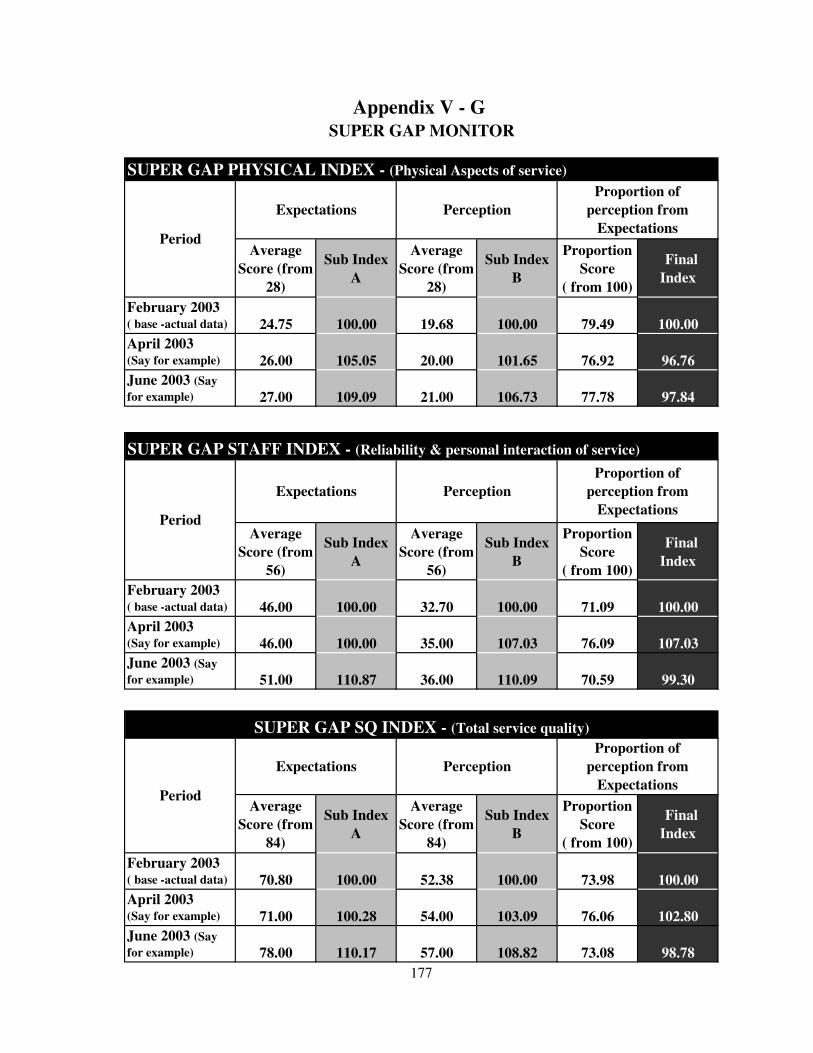
Average
Score (from
28)
Sub Index
A
Average
Score (from
28)
Sub Index
B
Proportion
Score
( from 100)
Final
Index
February 2003 ( base -actual data) 24.75 100.00 19.68 100.00 79.49 100.00
April 2003 (Say for example) 26.00 105.05 20.00 101.65 76.92 96.76
June 2003 (Say
for example) 27.00 109.09 21.00 106.73 77.78 97.84
Average
Score (from
56)
Sub Index
A
Average
Score (from
56)
Sub Index
B
Proportion
Score
( from 100)
Final
Index
February 2003 ( base -actual data) 46.00 100.00 32.70 100.00 71.09 100.00
April 2003 (Say for example) 46.00 100.00 35.00 107.03 76.09 107.03
June 2003 (Say
for example) 51.00 110.87 36.00 110.09 70.59 99.30
Average
Score (from
84)
Sub Index
A
Average
Score (from
84)
Sub Index
B
Proportion
Score
( from 100)
Final
Index
February 2003 ( base -actual data) 70.80 100.00 52.38 100.00 73.98 100.00
April 2003 (Say for example) 71.00 100.28 54.00 103.09 76.06 102.80
June 2003 (Say
for example) 78.00 110.17 57.00 108.82 73.08 98.78
Expectations Perception
Proportion of
perception from
Expectations
177
Proportion of
perception from
ExpectationsPeriod
SUPER GAP SQ INDEX - (Total service quality)
Appendix V - G
Period
SUPER GAP MONITOR
SUPER GAP PHYSICAL INDEX - (Physical Aspects of service)
Period
Expectations Perception
Proportion of
perception from
Expectations
SUPER GAP STAFF INDEX - (Reliability & personal interaction of service)
Expectations Perception
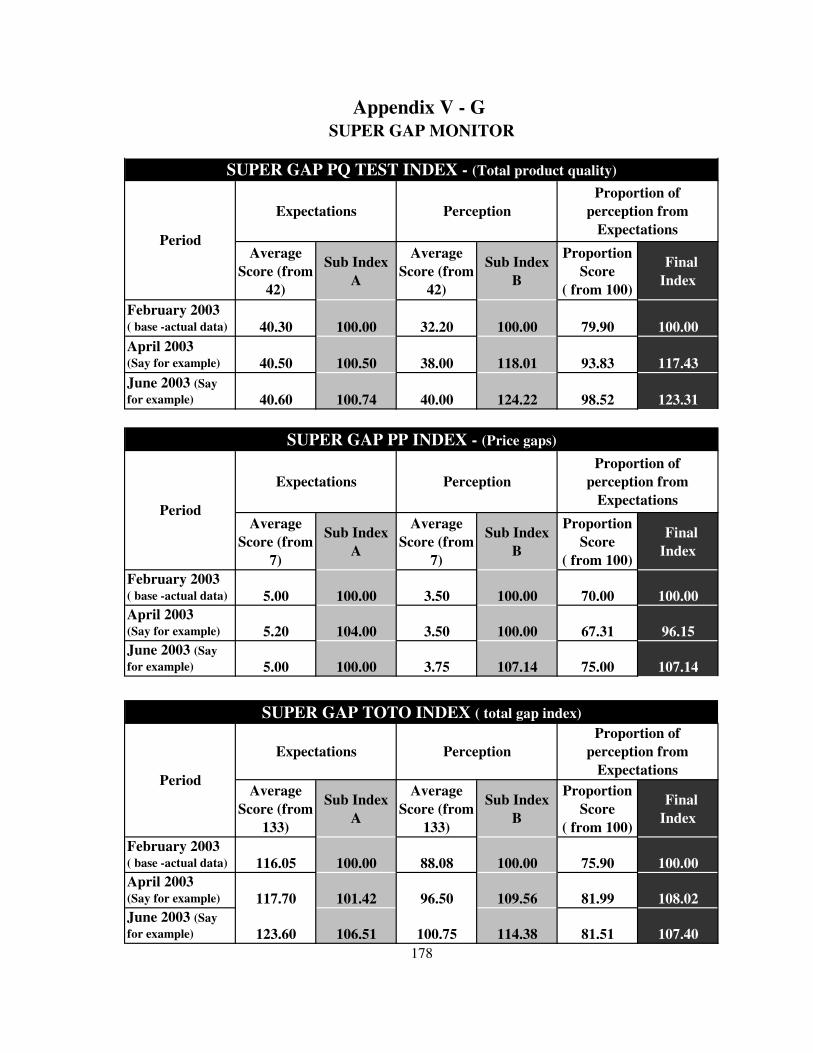
Appendix V - G
SUPER GAP MONITOR
Average
Score (from
42)
Sub Index
A
Average
Score (from
42)
Sub Index
B
Proportion
Score
( from 100)
Final
Index
February 2003 ( base -actual data) 40.30 100.00 32.20 100.00 79.90 100.00
April 2003 (Say for example) 40.50 100.50 38.00 118.01 93.83 117.43
June 2003 (Say
for example) 40.60 100.74 40.00 124.22 98.52 123.31
Average
Score (from
7)
Sub Index
A
Average
Score (from
7)
Sub Index
B
Proportion
Score
( from 100)
Final
Index
February 2003 ( base -actual data) 5.00 100.00 3.50 100.00 70.00 100.00
April 2003 (Say for example) 5.20 104.00 3.50 100.00 67.31 96.15
June 2003 (Say
for example) 5.00 100.00 3.75 107.14 75.00 107.14
Average
Score (from
133)
Sub Index
A
Average
Score (from
133)
Sub Index
B
Proportion
Score
( from 100)
Final
Index
February 2003 ( base -actual data) 116.05 100.00 88.08 100.00 75.90 100.00
April 2003 (Say for example) 117.70 101.42 96.50 109.56 81.99 108.02
June 2003 (Say
for example) 123.60 106.51 100.75 114.38 81.51 107.40
178
SUPER GAP TOTO INDEX ( total gap index)
Period
Expectations Perception
Proportion of
perception from
Expectations
SUPER GAP PP INDEX - (Price gaps)
Period
Expectations Perception
Proportion of
perception from
Expectations
SUPER GAP PQ TEST INDEX - (Total product quality)
Period
Expectations Perception
Proportion of
perception from
Expectations

179
LIST OF REFERENCES
BPP, Marketing Fundamentals, CIM, BPP Text, 2001.
Brady, Michael and Cronin J. Joseph Jr, “ Some New Thoughts on Conceptualizing
Perceived Service Quality: A Hierarchical Approach”, Journal of Marketing July 2001,
Cargills ( Ceylon) Limited , Annual Reports 1999,2000,2001,2002
Co-operative Wholesale Establishment , Corporate Plan 1999-2002
Department of Census and Statistics, Ministry of Finance, Sri Lanka Census on Population
and Housing 2001,
Cook, David and Walters David, Retail Marketing, Theory & Practice, Prentice Hall, 1991.
Cox, R. Britain, “ Retail Management”, Pitman Publishing, 1993
Davies, R.L. and Rogers, D.S., Store Location and Store Assessment Research” John
Willey and Sons, 1984.
DelVecchio Devon, “Consumer Perceptions of Private Label Quality: The Role of Product
Category Characteristics and Consumer use of Heuristics, Journal of Retailing & Consumer
Services, 2001.
Finn, David & Lamb, Charles, An Evaluation of the SERVQUAL Scales in a Retailing
Setting, Advances in Consumer Research, 1991.
Fournier, Susan and Glen Mick, David, Rediscovering Satisfaction, Journal of Marketing,
October 1999.
Gronroos, Christian, Innovative Marketing Strategies and Organizational Structures for
Service Firms, Prentice Hall International Editions, 1991.
Hasty, Ron, and Reardon, James, “ Retailing Management”, Irwin McGraw Hill, 1997.
Jansen, H. Rask, “Antecedents and Consequences of Consumer Value Assessments:
Implications for Marketing Strategy and Future Research” , Journal of Retailing &
Consumer Services, 2001.
180
Davison, John, et.el, “Developing Competence in Retailing : Strategic Advantages” , Journal
of Retailing & Consumer Services, 1998.
Jones, M.A. “Entertaining Shopping Experiences : An Investigation , Journal of Retailing &
Consumer Services , 999.
Keegan, Warren, et.el, “ Marketing” , Prentice Hall , 1992 .
Kostecki, M., “Marketing Strategies for Services”, Pergamon Press, 1994.
Kotler, Philip, et.el, Marketing Management , An Asian Perspective” Prentice Hall, 1996.
Lewison, Dale M. , “ Retailing” , Prentice Hall International, 1997.
Lusch, Robert and Dunne Patrick, “ Retailing Management”, South Western Publishing
Company, 1990.
Pine, Joseph II and Gilmore, James “ Welcome to the Experienced Economy”, Harvard
Business Review , July August, 1998.
Richard Pieris and Company Limited, Annual Reports 1998/99, 1999/00, 2000/01, 2001/02
Rouwendal, Jan and Rietveld, Piet “An Economic Analysis of Opening Hours for Shops”,
Journal of Retailing & Consumer Services , 1998.
Rust, Roland and Oliver, Richard,. Service Quality, Insights and Managerial Implications
from the Frontier, Service Quality, 1994.
Spreng, Richard A. and Droge Cornelia, “The Impact on Satisfaction of Managing Attribute
Expectations : Should Performance be Understated or Overstated, Journal of Retailing &
Consumer Services , 2001.
Sweeney Jillian, et.el “ Retail Service Quality and Perceived Value, A comparison of Two
Models”, Journal of Retailing and Consumer Services , 1997.
Vazquez, Rodolfo, et. el, Service Quality in Supermarket Retailing – Identifying Critical
Service Experiences, Journal of Retailing and Consumer Services, 2001.
181
Verhoef, Peter C. and Langerak Fred, “ Possible Determinants of Consumer’s Adaptation of
Electronic Grocery Shopping in the Netherlands, Journal of Retailing and Consumer
Services, 2001.
Voss, Glen, et. el, The Roles of Price, Performance and Expectations in Determining
Satisfaction in Service Exchanges, Journal of Marketing, October, 1998.
Zeithamal, Valerie A. and Bitner, Mary Jo, Services Marketing, Integrating Customer
Across the Firm, Tata McGrow Hill, 2000.
Zeithaml, Valerie, et. el, Delivering Quality Service, Balancing Customer Perceptions and
Expectations” The Free Press, 1990
Zenor Michael J., et. el, “The Impact of Marketing Policy on Promotional Price Elasticities
and Baseline Sales, Journal of Retailing & Consumer Services , 2001.
182
BIBILIOGRAPHY
1. Berry, Leonard, et.el, “ Understanding Service Convenience”, Journal of Marketing,
July 2002.
2. Davidson, William R., et.el “ Retail Life Cycle” Harvard Business Review, November –
December, 1976.
3. Fornell, Claes, et,el “ The American Customer Satisfaction Index : Nature, Purpose and
Findings”, Journal of Marketing, October 1996.
4. Liyanage P. Uditha, Goods – Services Dichotomy : The Place of the Tangibility
Construct, Sri Lanka Journal of Management , July – December.
5. Liyanage P. Uditha, Profiling the Emerging Sri Lankan Consumer, Sri Lanka Journal
of Management, April – June.
6. Nanayakkara, G, “Guidelines for the Presentation of Academic and Professional
Work” Postgraduate Institute of Management (PIM), 1987
7. Ranasinghe, Sudatta and Fonseka, Mangala “ Research Methods in Management”
Postgraduate Institute of Management (PIM), 1988
8. Wirtz Jochen “ An Examination of the Presence, Magnitude and the Impact of Halo on
Consumer Satisfaction Measures”, Journal of Retailing and Consumer Services, 2000.
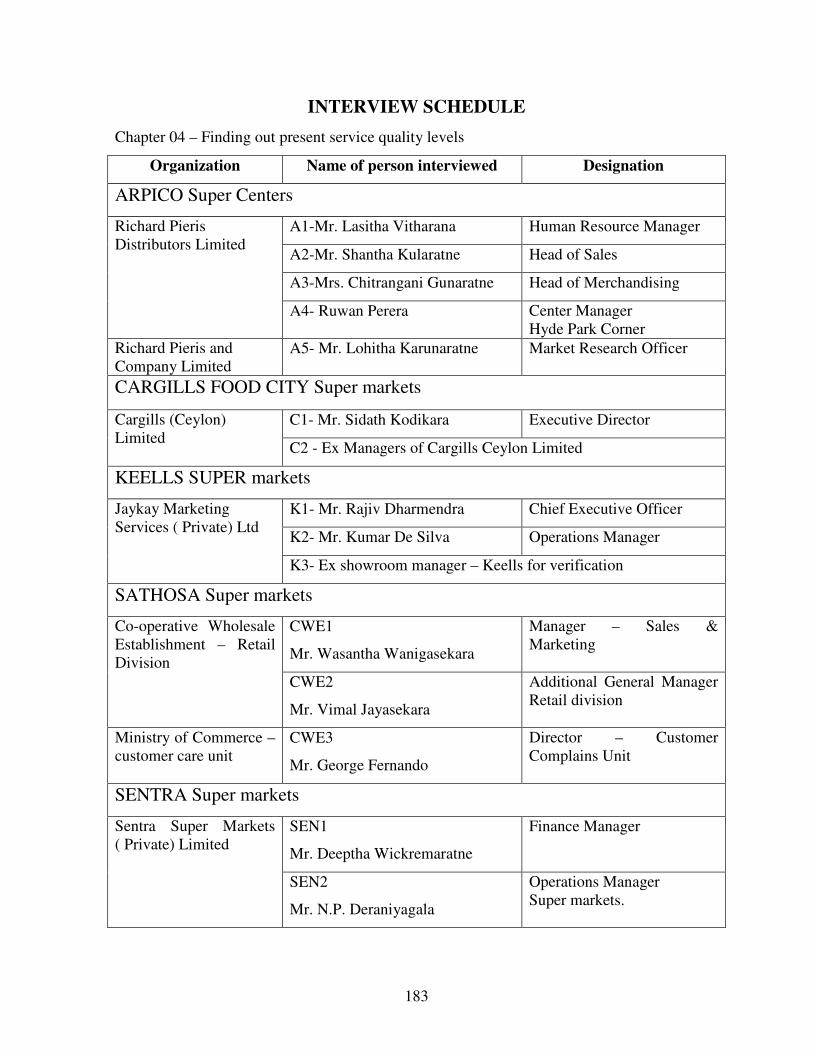
183
INTERVIEW SCHEDULE
Chapter 04 – Finding out present service quality levels
Organization Name of person interviewed Designation
ARPICO Super Centers
Richard Pieris
Distributors Limited
A1-Mr. Lasitha Vitharana Human Resource Manager
A2-Mr. Shantha Kularatne Head of Sales
A3-Mrs. Chitrangani Gunaratne Head of Merchandising
A4- Ruwan Perera Center Manager
Hyde Park Corner
Richard Pieris and
Company Limited
A5- Mr. Lohitha Karunaratne Market Research Officer
CARGILLS FOOD CITY Super markets
Cargills (Ceylon)
Limited
C1- Mr. Sidath Kodikara Executive Director
C2 - Ex Managers of Cargills Ceylon Limited
KEELLS SUPER markets
Jaykay Marketing
Services ( Private) Ltd
K1- Mr. Rajiv Dharmendra Chief Executive Officer
K2- Mr. Kumar De Silva Operations Manager
K3- Ex showroom manager – Keells for verification
SATHOSA Super markets
Co-operative Wholesale
Establishment – Retail
Division
CWE1
Mr. Wasantha Wanigasekara
Manager – Sales &
Marketing
CWE2
Mr. Vimal Jayasekara
Additional General Manager
Retail division
Ministry of Commerce –
customer care unit
CWE3
Mr. George Fernando
Director – Customer
Complains Unit
SENTRA Super markets
Sentra Super Markets
( Private) Limited
SEN1
Mr. Deeptha Wickremaratne
Finance Manager
SEN2
Mr. N.P. Deraniyagala
Operations Manager
Super markets.