measuring synchronization of stochastic oscillators in...
TRANSCRIPT
This content has been downloaded from IOPscience. Please scroll down to see the full text.
Download details:
IP Address: 128.192.112.103
This content was downloaded on 27/10/2016 at 16:09
Please note that terms and conditions apply.
You may also be interested in:
Measure Synchronization of High-Cycle Islets in CoupledHamiltonian Systems
Chen Shao-Ying, Wang Guang-Rui and Chen Shi-Gang
Nonlocal Measure Synchronization in Coupled Bosonic Josephson Junctions
Tian Jing, Qiu Hai-Bo and Chen Yong
Measure synchronization in coupled Duffing Hamiltonian systems
U E Vincent
Role of inter-well tunnelling strength on coherence dynamics of two-species Bose-Einstein
condensates
Li-Hua Lu, Xiao-Qiang Xu and You-Quan Li
Synchronization and phase transition in the Frenkel–Kontorova-type model system
Jian-Rong Zhang, Hong Jiang, Yang Yang et al.
Synchronization during atrial fibrillation
Michela Masè, Luca Faes, Renzo Antolini et al.
Measuring synchronization of stochastic oscillators in biology
View the table of contents for this issue, or go to the journal homepage for more
2016 J. Phys.: Conf. Ser. 750 012001
(http://iopscience.iop.org/1742-6596/750/1/012001)
Home Search Collections Journals About Contact us My IOPscience

Measuring synchronization of stochastic oscillators in biology
Z Deng1, S Arsenault2 , L Mao2, and J. Arnold3
1College of Engineering, University of Georgia 2Institute of Bioinformatics and Entomology Department, University of Georgia
3Genetics Department, University of Georgia
Abstract. A fundamental problem in physics is measuring and modeling the synchronization of coupled stochastic oscillators. The problem is relatively recent in biology, where it has become possible to measure stochastic oscillators in single cells. A variety of synchronization measures have been proposed to describe a field of coupled stochastic oscillators. We introduce a synchronization measure new to this problem (but old to Genetics) called the intraclass correlation (ICC). The ICC is simple to interpret and has a statistical framework for inference. We illustrate ICC behaviour in the Kuramoto phase-locking model and on a field of over 25,000 oscillators in single cells measured every half-hour over a ten day interval.
1. Introduction The following paper is dedicated to H.-Bernd Schuttler on his 60th birthday in honor of his contributions in systems biology drawn from statistical physics(1-4). His introduction of ensemble methods into systems biology constituted a sea change for the field, one now that many of us take for granted. The focus today is on a new problem on which Bernd is working that is central to physics and more recently in biology, namely measuring and modeling the synchronization of coupled stochastic oscillators. The problem arises in physics in the synchronization of lasers, Josephson-Junction arrays, relativistic magnetrons, and the coupled signals of two interferometers measuring gravitational waves (5, 6). Only recently has the problem come to the attention of biologists, particularly in the context of circadian rhythms(7). With the advent of new technologies for measuring the clocks in single cells(8), it is now possible to make progress on how the clocks of individual cells become synchronized. Being able to measure the clocks of individual cells fundamentally changes the scale of measurement usually performed on mass cultures of 107 cells. Because of the change in scale, new behaviors are evident that demand new models for the stochastic oscillations of single cells(9). Many of the new stochastic models describing the behavior of individual cells have been have been drawn from physics(10). The problem to be described here is simple. Each cell has its own oscillator, and the average behavior of these oscillators has been successfully described with ensemble methods applied to deterministic models at the level of 107 cells (2, 3). The challenge today is to measure individually
CSP16 IOP PublishingJournal of Physics: Conference Series 750 (2016) 012001 doi:10.1088/1742-6596/750/1/012001
Content from this work may be used under the terms of the Creative Commons Attribution 3.0 licence. Any further distributionof this work must maintain attribution to the author(s) and the title of the work, journal citation and DOI.
Published under licence by IOP Publishing Ltd 1

each of the oscillators of >25,000 cells over a ten day period and determine how the cells synchronize over time. In contrast to earlier experiments, these new measurements are done at the single cell level. The data are the trajectories of each cell’s oscillator over a ten day window measured every half hour (h). The data for one time point are shown in Figure 1 for one field of view and resemble a star field observed at one of successive time points. All of the data at one time point is the union of many fields of view (~30). We will introduce measures of synchronization between the oscillators (stars) drawn from physics and genetics. We will illustrate their behavior in a physical model. Then we will examine these synchronization measures and their behavior on >25,000 individual cells over a 10 day window.
Figure 1. One field of view on oscillators in single cells at a single time point.
2. Synchronization measures A good synchronization measure should have a number of properties. One, it should capture the similarity between oscillator trajectories as summarized in their phase, amplitude, and period. Second, any measurement of similarity should be done relative to the variability in the measurements between replicates. This will allow an assessment of significance of trajectory similarities found. Three, the measure should have a simple interpretation. Finally, the measure should have well known statistical properties to facilitate inference about synchronization of stochastic oscillators. A variety of synchronization measures have been introduced to describe the coupled behavior of stochastic oscillators in physics. These include the cross-correlation between cellular trajectories (with respect to frequency), mutual information shared between trajectories, the phase synchronization from either the Hilbert or Wavelet transform of individual cellular trajectories, and an index based on the circular variance known as the phase-locking value(11).
CSP16 IOP PublishingJournal of Physics: Conference Series 750 (2016) 012001 doi:10.1088/1742-6596/750/1/012001
2

Of these methods, we chose to utilize the phase synchronization statistic (or phase locking index) extracted using the Hilbert Transform. By taking the Hilbert Transform of the data
1∗ . . ′
It is possible to define the analytic signal
and consequently extract the phase with respect to time.
An index of phase locking can then be calculated to compare the synchronization of two signals.
1
One additional measure has been recently introduced for the study of biological oscillators(12).
Garcio-Ojalvo et al.(12) have suggested one measure of synchronization (RG), the variance in the measured mean of the oscillator Xij along a trajectory (in time) divided the variance in Xij of an individual trajectory:
RG = <[(n-1•Xij)2> - <(n-1•Xij)>
2]/(<[Xij]2> - <[Xij]>
2), (1) where n is the number of cell trajectories observed. If the cells are out of phase, then the numerator of RG will be small relative to the denominator due to phase cancellation. On the other hand, a high degree of synchronization will essentially reduce observations on n cells to the same as looking at one cell, and the measure R will then be near 1. This measure does have then a simple interpretation. There is also one time-tested measure of similarity that has been used in genetics for over 150 years, the intraclass correlation(13). Let us suppose the measurements on the state of oscillator i within the jth neighborhood at one time point are denoted by Xij. A neighborhood is collection of cells that are neighbors. Only oscillators within a neighborhood can be coupled. We observe each cell within a neighborhood every half hour over a ten day period. We can think of neighborhoods of the same size a as replicate experiments. The measurements on the cells are assumed to have the following covariance structure
COV(Xij, Xkl) = 0, i ≠ k (different neighborhoods) = ρσ����i = k, j ≠ l (different cells within a neighborhood) (2) = σ��� �i = k, j = l (same cell within a neighborhood) Stochastic oscillators within a neighborhood under this model can communicate and are coupled. The parameter �is the intraclass correlation and is a direct measure of the coupling of oscillators. The intraclass correlation has a distinguished history in genetics(13) as a heritability measure (in which neighborhoods are families) and two simple interpretations. Firstly, the intraclass correlation is the correlation between measurements on different cells within the same neighborhood. Second, the intraclass correlation can also be interpreted as the fraction of variation in the oscillator explained within neighborhoods relative to that between neighborhoods. In this way the intraclass correlation has a built-in internal control to compare the communication between oscillators within neighborhoods relative to the variance in oscillators across replicate neighborhoods of the same size (a). We will denote the sample estimate of the intraclass correlation by R. This estimate will depend not only on the size of the neighborhoods (a), but will also vary with time. So, the intraclass correlation should be thought of as a synchronization surface varying both in time and neighborhood size. In other words, there will be trios, quartets, and quintets all singing different pieces simultaneously and over time, and these ensembles of musicians will be replicated. There is a substantial body of theory for inference about the intraclass correlation(13). The total variation in oscillator behavior (Xij) at any particular time point can be partitioned into a between
CSP16 IOP PublishingJournal of Physics: Conference Series 750 (2016) 012001 doi:10.1088/1742-6596/750/1/012001
3

neighborhood sum of squares (SSB) and a within neighborhood sum of squares (SSW) in Table 1 such that the total sum of squares SST = SSB + SSW. The ratio of Estimated Mean Squares (EMS) provide a test of the significance of the intraclass correlation �known as an F-test.
Table 1. Analysis of Variance (ANOVA) of oscillators between and within neighborhoods is used to estimate the intraclass correlation. The model in (2) is a balanced variance components model with cells grouped by neighborhoods(13). The number of cells in a neighborhood is denoted by a; the number of neighborhoods is denoted by n. The variance in a single oscillator measurement is ���and the intraclass correlation is ��The intraclass correlation is a measure of the fraction of total variation (SST) within neighborhoods as well as the correlation between oscillator measurements on different cells within the same neighborhood. The quantities, XBARi and XBAR, are sample means over neighborhood i and over cells and neighborhoods, respectively. The estimated mean square (EMS) is a sum of squares (SS) divided by its degrees of freedom. The EMS estimates its expectation in the last column. Setting the EMS equal to their expectations allows the solution for . Source degrees of
freedom (df) Sums of Squares (SS)
Estimated Mean Square (EMS)
Expectation of EMS
Between neighborhoods
n-1 SSB = aXBARi – XBAR)2
SSB/(n-1) a-1)
Within neighborhoods
n(a-1) SSW = ij(Xij – XBARi)2 SSW/n(a-1) (1-
Corrected total na-1 SST = ij(Xij – XBAR)2
From the Analysis of Variance (ANOVA) Table 1, an estimator of the intraclass correlation can be constructed by setting the Estimated Mean Squares (EMS) equal to their expectations. The result is two equations in two unknowns, and ����Solving these two equations yields the estimator R:
R = (EMSB – EMSW)/(EMSB + (a-1)EMSW) (3)
The estimator R defines a surface describing the synchronization of the oscillators in the system as a function of time (t) and neighborhood size (a). This synchronization measure has the four properties desired of a synchronization measure outlined earlier.
3. Kuramoto phase locking model
Kreuz et al.(11) concluded from a comparative analysis of varied synchronization measures in different physical systems that no one synchronization measure was to be preferred in different physical systems, but the modeling context determined the appropriate synchronization measure to be used in a particular physical system. One of the classic physical models of phase locking is the Kuramoto model(14). If the oscillators within cells are constrained to a ring indexed by r, then neighboring oscillators communicate. The model is defined by the following equations. For ∈1, ,
CSP16 IOP PublishingJournal of Physics: Conference Series 750 (2016) 012001 doi:10.1088/1742-6596/750/1/012001
4
∗ sin
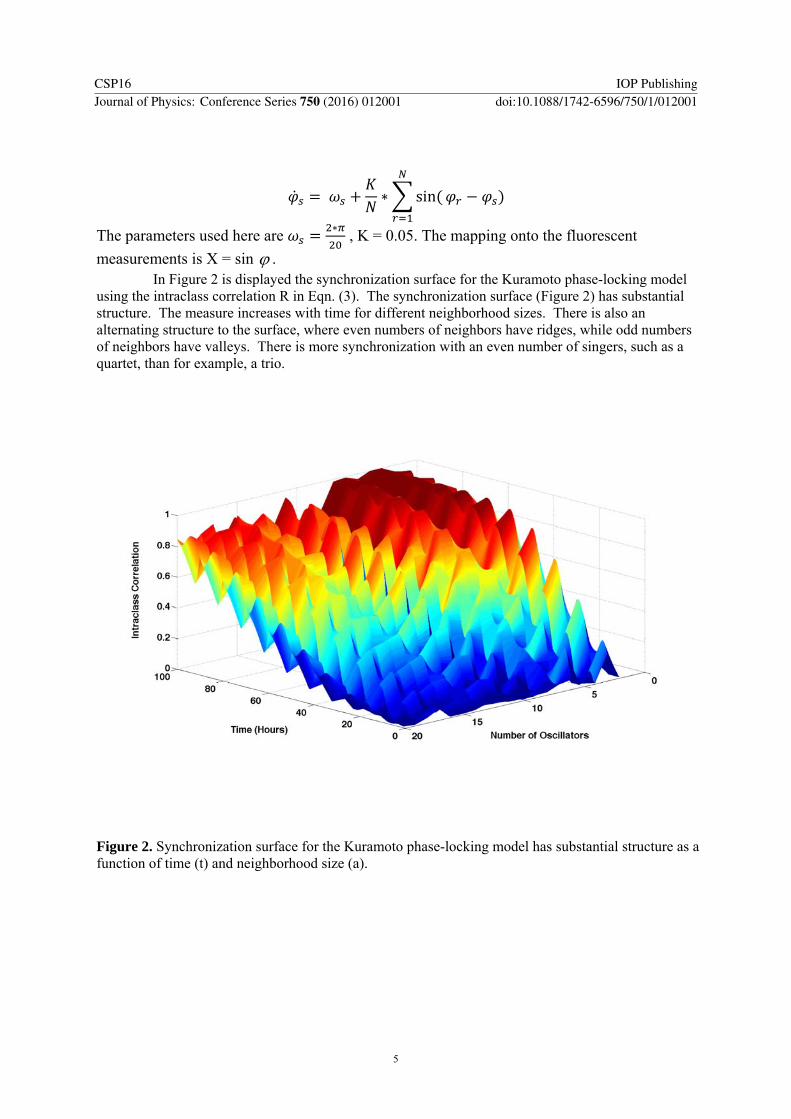
The parameters used here are ∗
, K = 0.05. The mapping onto the fluorescent
measurements is X = sin . In Figure 2 is displayed the synchronization surface for the Kuramoto phase-locking model
using the intraclass correlation R in Eqn. (3). The synchronization surface (Figure 2) has substantial structure. The measure increases with time for different neighborhood sizes. There is also an alternating structure to the surface, where even numbers of neighbors have ridges, while odd numbers of neighbors have valleys. There is more synchronization with an even number of singers, such as a quartet, than for example, a trio.
Figure 2. Synchronization surface for the Kuramoto phase-locking model has substantial structure as a function of time (t) and neighborhood size (a).
CSP16 IOP PublishingJournal of Physics: Conference Series 750 (2016) 012001 doi:10.1088/1742-6596/750/1/012001
5
4. Measuring synchronization
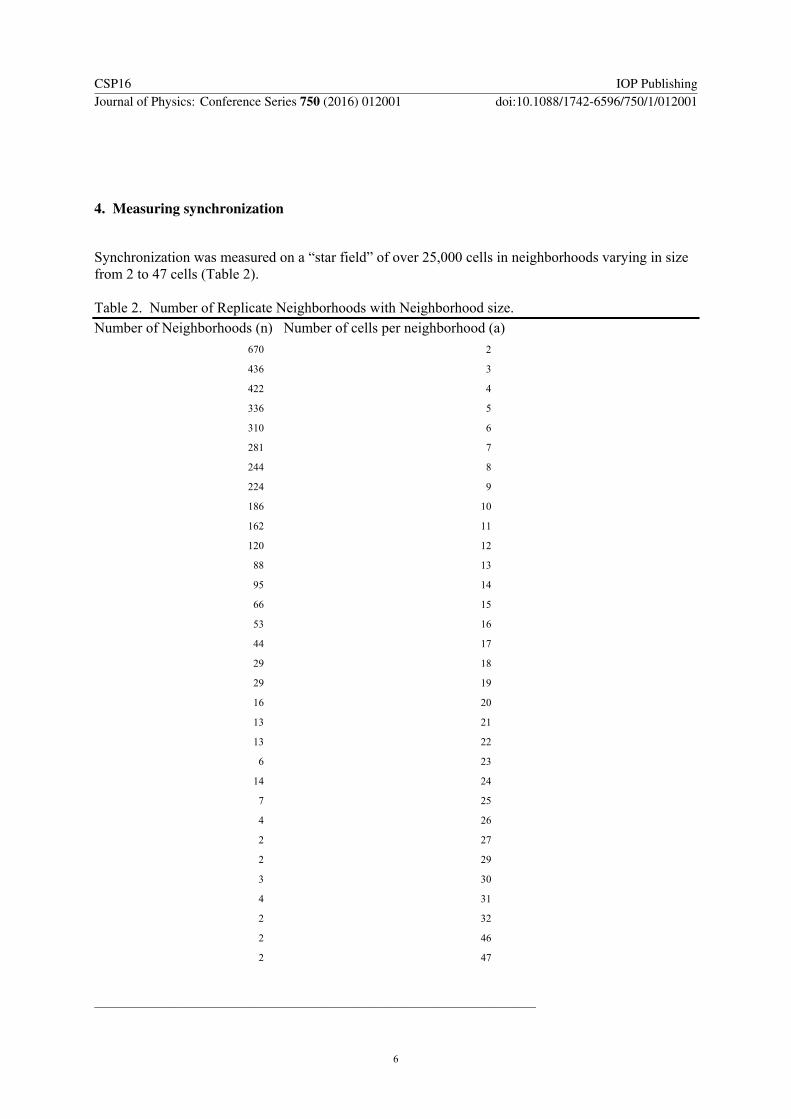
Synchronization was measured on a “star field” of over 25,000 cells in neighborhoods varying in size from 2 to 47 cells (Table 2).
Table 2. Number of Replicate Neighborhoods with Neighborhood size. Number of Neighborhoods (n) Number of cells per neighborhood (a)
670 2
436 3
422 4
336 5
310 6
281 7
244 8
224 9
186 10
162 11
120 12
88 13
95 14
66 15
53 16
44 17
29 18
29 19
16 20
13 21
13 22
6 23
14 24
7 25
4 26
2 27
2 29
3 30
4 31
2 32
2 46
2 47
___________________________________________________________________________________
CSP16 IOP PublishingJournal of Physics: Conference Series 750 (2016) 012001 doi:10.1088/1742-6596/750/1/012001
6
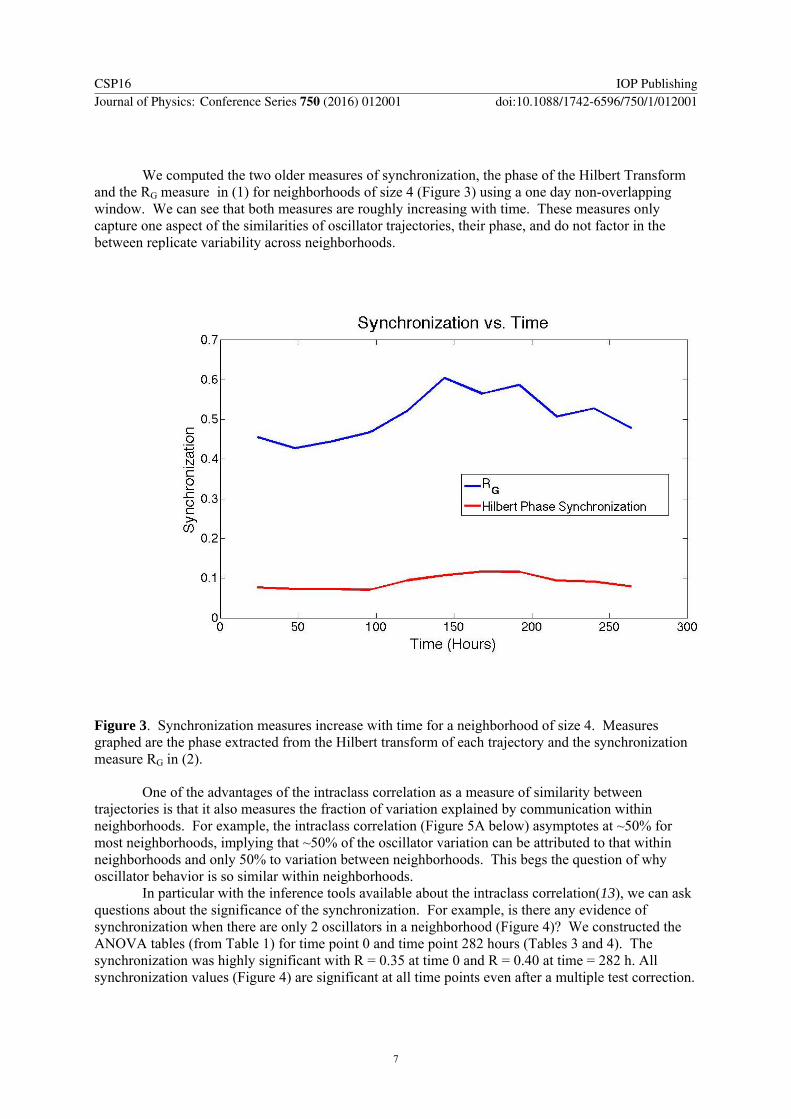
We computed the two older measures of synchronization, the phase of the Hilbert Transform and the RG measure in (1) for neighborhoods of size 4 (Figure 3) using a one day non-overlapping window. We can see that both measures are roughly increasing with time. These measures only capture one aspect of the similarities of oscillator trajectories, their phase, and do not factor in the between replicate variability across neighborhoods.
Figure 3. Synchronization measures increase with time for a neighborhood of size 4. Measures graphed are the phase extracted from the Hilbert transform of each trajectory and the synchronization measure RG in (2).
One of the advantages of the intraclass correlation as a measure of similarity between trajectories is that it also measures the fraction of variation explained by communication within neighborhoods. For example, the intraclass correlation (Figure 5A below) asymptotes at ~50% for most neighborhoods, implying that ~50% of the oscillator variation can be attributed to that within neighborhoods and only 50% to variation between neighborhoods. This begs the question of why oscillator behavior is so similar within neighborhoods.
In particular with the inference tools available about the intraclass correlation(13), we can ask questions about the significance of the synchronization. For example, is there any evidence of synchronization when there are only 2 oscillators in a neighborhood (Figure 4)? We constructed the ANOVA tables (from Table 1) for time point 0 and time point 282 hours (Tables 3 and 4). The synchronization was highly significant with R = 0.35 at time 0 and R = 0.40 at time = 282 h. All synchronization values (Figure 4) are significant at all time points even after a multiple test correction.
CSP16 IOP PublishingJournal of Physics: Conference Series 750 (2016) 012001 doi:10.1088/1742-6596/750/1/012001
7

Figure 4. The intraclass correlation R is significant for all time points for neighborhoods with 2 oscillators even after a multiple test correction. This is a slice through Figure 5A.
Table 3. Analysis of Variance (ANOVA) of oscillators between and within neighborhoods is used to test the significance of the intraclass correlation � for neighborhoods of size 2 at time point 0. The method of computation of the ANOVA is given in Table 1. The value is significant at least the 0.001 level (***). Source degrees of
freedom (df) Sums of Squares (SS)
Estimated Mean Square (EMS)
Expectation of EMS
F
Between neighborhoods
670-1 84639.67452
126.5167033 a-1)
Within neighborhoods
670(2-1) 40642.82316
60.66093009 (1- 0.48***
Corrected total (670)(2)-1 125282.4977
Table 4. Analysis of Variance (ANOVA) of oscillators between and within neighborhoods is used to test the significance of the intraclass correlation � for neighborhoods of size 2 at time point 282 h. The method of computation of the ANOVA is given in Table 1. Source degrees of
freedom (df) Sums of Squares (SS)
Estimated Mean Square (EMS)
Expectation of EMS
F
Between neighborhoods
670-1 26295.44231
39.30559389 a-1)
Within neighborhoods
670(2-1) 11364.75646
16.96232307 (1- 0.43***
Corrected total (670)(2)-1 37660.19877
As an alternative, we constructed the synchronization surface as described in Table 1 and (3) for varying time and neighborhood size (Figure 5A) We can see that the synchronization surface highly resembles that produced by the Kuramoto phase-locking model (Figure 2). The ridges and
CSP16 IOP PublishingJournal of Physics: Conference Series 750 (2016) 012001 doi:10.1088/1742-6596/750/1/012001
8

valleys are evident. The ridges in synchronization become higher as time advances. As a comparison we also constructed RG (Figure 5B). There appears to be an increase of synchronization with time and drop off with neighborhood size.
Figure 5. The measured synchronization surface of >25,000 oscillators resembles that of the Kuramoto phase-locking model. (A) Synchronization surface for R in (3). (B) Synchronization surface for RG in (1) using a one day window.
5. DiscussionThe degree of synchronization not only varies with time, but also with the number of neighbors. There is a social environment that affects the behaviour of oscillators. There is structure to the synchronization surface as well (Figure 5). Whether there are an odd or even number of neighbors has an impact on the extent of synchronization. The synchronization will be hard to measure unless the observer controls for neighborhood size (Figure 5).
The intraclass correlation in (3) is readily interpreted in two ways. One, the synchronization measure R asymptoting in time at ~50% is the correlation in individual trajectories within a neighborhood. The final correlation between trajectories is quite high relative to the variation between neighborhoods. The ~50% is also the fraction of variation in oscillator trajectories captured within neighborhoods measured relative to the variation between replicate neighborhoods. The measure also allowed us to test how synchronization arises (Figure 4).
As synchronization takes place with time, there is not a sharp transition as in many physical and chemical systems(15). The synchronization is gradual as captured in the intraclass correlation. There is not an abrupt transition to synchronization as seen in some physical systems. It is possible that there is another state of the system as determined by cell density and the degree of coupling of cell oscillators that a sharp phase transition would occur(15). The neighborhoods, such as a =2 or the large neighborhoods (a=42), display non-monotone synchronization because of noise or the small number of replicate neighborhoods to average over to produce the surface value. For the other neighborhoods, the synchronization surface is increasing in time.
The synchronization surface (Figure 5) is also a rich source for testing various physical and biological models of communication. The Kuramoto phase locking model reproduces the structure in the synchronization surface, implying that there is a local phase-locking mechanism in operation between oscillators in cells within neighborhoods. Further information could be obtained by ensemble fitting of the Kuramoto model to the trajectories of individual oscillators(2, 16).
The problem of measuring synchronization in physics and biology is a general one. The collective behavior of individual actors and their synchronization is observed in a variety of biological and physical systems. One recent example is the highly synchronized marching of locusts or the behavior of human crowds(16, 17). The study of synchronization in physical and biological problems will continue to be challenging experimentally and discerning its underlying mechanism(s), a fundamental problem in both physics and biology.
CSP16 IOP PublishingJournal of Physics: Conference Series 750 (2016) 012001 doi:10.1088/1742-6596/750/1/012001
9

References
1. D. Battogtokh, D. K. Asch, M. E. Case, J. Arnold, H. B. Schuttler, An ensemble method foridentifying regulatory circuits with special reference to the qa gene cluster of Neurosporacrassa. Proceedings of the National Academy of Sciences of the United States of America 99,16904-16909 (2002).
2. Y. Yu et al., A genetic network for the clock of Neurospora crassa. Proceedings of theNational Academy of Sciences of the United States of America 104, 2809-2814 (2007).
3. W. Dong et al., Systems biology of the clock in Neurospora crassa. PloS one 3, e3105 (2008).4. A. Al-Omari et al., Discovering Regulatory Network Topologies Using Ensemble Methods on
GPGPUs With Special Reference to the Biological Clock of Neurospora crassa. IEEE Access3, 27-42 (2015).
5. S. H. Strogatz, Exploring complex networks. Nature 410, 268-276 (2001).6. B. Abbott et al., Observation of Gravitational Waves from a Binary Black Hole Merger.
Physical Review Letters 116, 061102 (2016).7. A. T. Winfree, On emerging coherence. Science 298, 2336-2337 (2002).8. O. Mondragon-Palomino, T. Danino, J. Selimkhanov, L. Tsimring, J. Hasty, Entrainment of a
population of synthetic genetic oscillators. Science 333, 1315-1319 (2011).9. Z. Deng et al., Single cell measurements on the biological clock by microfluidics. Proc. of the
18nth International Conference on Miniaturized Systems for Chemistry and Life Sciences(MicroTAS). San Antonio, TX 18, 881-883 (2014).
10. J. D. Challenger, A. J. McKane, Synchronization of stochastic oscillators in biochemicalsystems. Physical Review E 88, 012107 (2013).
11. T. Kreuz et al., Measuring synchronization in coupled model systems: A comparison ofdifferent approaches. Physica D: Nonlinear Phenomena 225, 29-42 (2007).
12. J. Garcia-Ojalvo, M. B. Elowitz, S. H. Strogatz, Modeling a synthetic multicellular clock:repressilators coupled by quorum sensing. Proceedings of the National Academy of Sciencesof the United States of America 101, 10955-10960 (2004).
13. S. R. Searle, G. Casella, C. E. McCulloch, Variance Components. (John Wiley & Sons,2009), vol. 391.
14. Y. Kuramoto, Chemical oscillations, waves, and turbulence. (Springer Science & BusinessMedia, 2012), vol. 19.
15. A. F. Taylor, M. R. Tinsley, F. Wang, Z. Huang, K. Showalter, Dynamical quorum sensingand synchronization in large populations of chemical oscillators. Science 323, 614-617 (2009).
16. D. J. Sumpter, Collective animal behavior. (Princeton University Press, 2010).17. J. Buhl et al., From disorder to order in marching locusts. Science 312, 1402-1406 (2006).
CSP16 IOP PublishingJournal of Physics: Conference Series 750 (2016) 012001 doi:10.1088/1742-6596/750/1/012001
10