measuring the changes in renal blood flow due to ... · measuring the changes in renal blood flow...
TRANSCRIPT
Measuring the changes in renal blood flow due to unbalanced and balanced crystalloid infusions Eleanor F Cox1, Abeed H Chowdhury2, Dileep N Lobo2, and Susan T Francis1
1SPMMRC, School of Physics & Astronomy, University of Nottingham, Nottingham, Nottinghamshire, United Kingdom, 2Nottingham Digestive Diseases Centre BRU, University of Nottingham, Nottingham, Nottinghamshire, United Kingdom
Background Saline (0.9% w/v) is one of the most commonly used intravenous crystalloids1, however the infusion of large volumes of saline can cause hyperchloremic acidosis2-5, which may affect renal function adversely. It has been shown in canine experiments that intra-renal infusions of chloride containing solutions, such as 0.9% saline, led to reductions in renal blood flow and glomerular filtration rate (GFR)6. Such problems may be less pronounced with the use of a balanced crystalloid which has an electrolyte composition closer to that of human plasma.
Aim This study aimed to assess changes in renal artery blood flow velocity and renal cortex tissue perfusion due to intravenous infusion of unbalanced (0.9% saline) and balanced (Plasma-Lyte® 148) crystalloids using phase contrast angiography (PCA) MRI and arterial spin labeling (ASL) respectively.
Methods The study was approved by the UK National Research Ethics Service, and Medicines and Healthcare Regulatory Agency. 12 healthy male volunteers (mean age ± SEM = 22.7 ± 0.7 years) were recruited and attended each session (at least 7 days apart) having fasted overnight. Images were acquired on a 1.5T Philips Achieva MRI scanner (body transmit/4-element SENSE torso receive coil. Multi-slice balanced Turbo Field Echo (bTFE) images were initially acquired in 3 orthogonal planes to locate the kidney and vessels of interest to aid slice positioning. The MR protocol (Figure 1) consisted of a series of non-invasive MR measurements to assess renal tissue perfusion (using arterial spin labeling7,8) and renal artery blood flow velocity (using phase contrast angiography9). A base equilibrium scan was also acquired for quantification of renal tissue perfusion. During the 60 min infusion, scans were repeated at 7 min intervals to assess the time-course of the response to each crystalloid. Additional PCA measurements were also collected at 82 and 90 min. Infusion: Two litres of an unbalanced crystalloid (0.9% saline) or balanced crystalloid (Plasma-Lyte® 148) (both Baxter Healthcare, Thetford, UK) were infused over 1 hour in a double-blinded cross-over study, using infusion pumps to control the flow rate, the starting time defined to be 0 min. ASL: Respiratory-triggered ASL data (288×300 mm FOV, 3×3x8 mm3 voxel, 5 slices, label delay (TI) = 1100 ms, in-plane pre-saturation) were collected with a True-FISP readout (TE/TR 2.1/4.1 ms, SENSE 2, FA 60°, centric acquisition, half-Fourier acquisition)8. 30 pairs were collected per ASL scan in a total time ~5 mins. PCA: A single slice TFE sequence with the imaging slice placed perpendicular to the right renal artery (RA) was used to collect 15 phases across the cardiac cycle (TR/TE 6.9/3.7 ms, FA 25°, NEX 2, reconstructed resolution 1.17 x 1.17 x 6 mm3, TFE factor 4-6 (dependent on the subjects’ heart rate), VENC = 100 cm/s). Each PCA measurement was acquired during a single 15-20 s breath hold. Data Analysis: For the ASL data, images were motion corrected to the base image using FSL (FMRIB Software Library) and difference images (label-control) calculated9 and averaged to create a single difference map (ΔM). A perfusion (f) map was then formed using a kinetic model10 using the individuals’ ΔM, base image and known tissue T1
11. Mean renal cortical perfusion was estimated by segmenting the kidney into tissue type and averaging across both kidneys. In a separate scan session, the within-session coefficient of variance (CV) of the measured renal cortical perfusion was assessed in 10 subjects and was measured to be 3.3%. The PCA data were analyzed using the Philips Q-flow software (Philips Medical Systems). A region of interest (ROI) was drawn over the RA, and the mean flow velocity (cm/s) over the cardiac cycle, across the vessel, calculated. In a separate scan session, the within-session reproducibility of measured mean RA flow velocity was assessed in a single subject and the CV found to be 2.7%. Data sets were normalized to the baseline value for each session to assess the time-course of the response to each of the crystalloids.
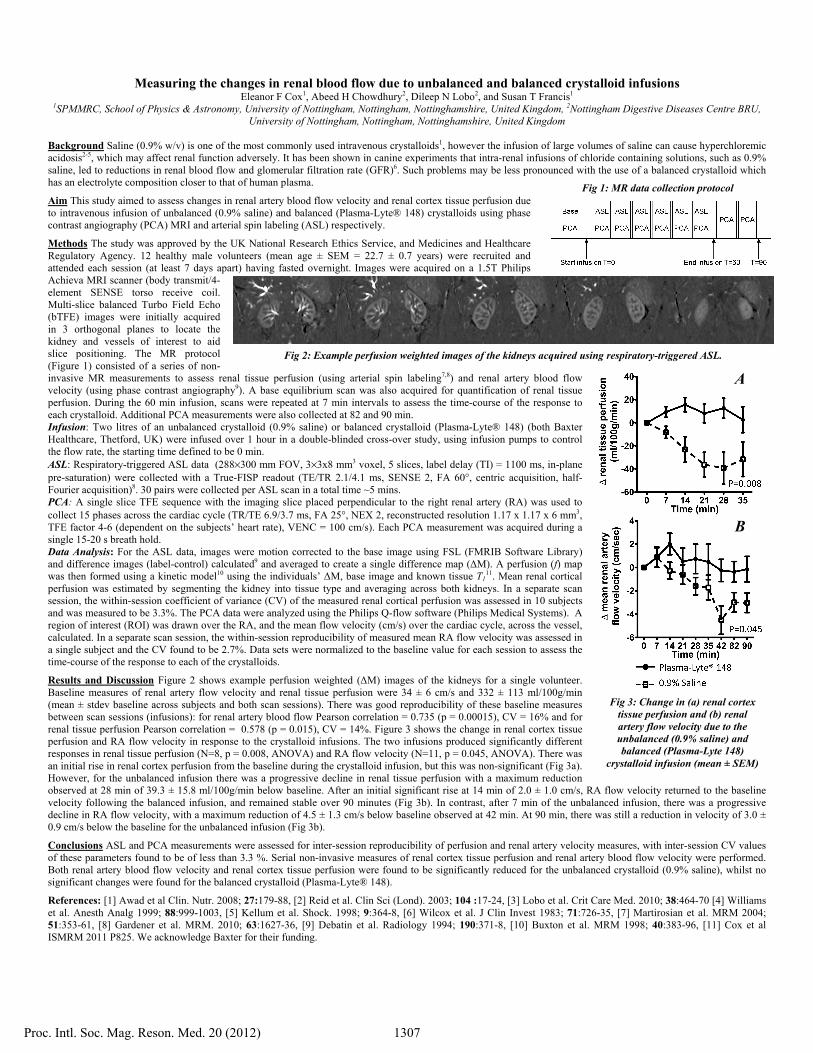
Results and Discussion Figure 2 shows example perfusion weighted (ΔM) images of the kidneys for a single volunteer. Baseline measures of renal artery flow velocity and renal tissue perfusion were 34 ± 6 cm/s and 332 ± 113 ml/100g/min (mean ± stdev baseline across subjects and both scan sessions). There was good reproducibility of these baseline measures between scan sessions (infusions): for renal artery blood flow Pearson correlation = 0.735 (p = 0.00015), CV = 16% and for renal tissue perfusion Pearson correlation = 0.578 (p = 0.015), CV = 14%. Figure 3 shows the change in renal cortex tissue perfusion and RA flow velocity in response to the crystalloid infusions. The two infusions produced significantly different responses in renal tissue perfusion (N=8, p = 0.008, ANOVA) and RA flow velocity (N=11, p = 0.045, ANOVA). There was an initial rise in renal cortex perfusion from the baseline during the crystalloid infusion, but this was non-significant (Fig 3a). However, for the unbalanced infusion there was a progressive decline in renal tissue perfusion with a maximum reduction observed at 28 min of 39.3 ± 15.8 ml/100g/min below baseline. After an initial significant rise at 14 min of 2.0 ± 1.0 cm/s, RA flow velocity returned to the baseline velocity following the balanced infusion, and remained stable over 90 minutes (Fig 3b). In contrast, after 7 min of the unbalanced infusion, there was a progressive decline in RA flow velocity, with a maximum reduction of 4.5 ± 1.3 cm/s below baseline observed at 42 min. At 90 min, there was still a reduction in velocity of 3.0 ± 0.9 cm/s below the baseline for the unbalanced infusion (Fig 3b).
Conclusions ASL and PCA measurements were assessed for inter-session reproducibility of perfusion and renal artery velocity measures, with inter-session CV values of these parameters found to be of less than 3.3 %. Serial non-invasive measures of renal cortex tissue perfusion and renal artery blood flow velocity were performed. Both renal artery blood flow velocity and renal cortex tissue perfusion were found to be significantly reduced for the unbalanced crystalloid (0.9% saline), whilst no significant changes were found for the balanced crystalloid (Plasma-Lyte® 148).
References: [1] Awad et al Clin. Nutr. 2008; 27:179-88, [2] Reid et al. Clin Sci (Lond). 2003; 104 :17-24, [3] Lobo et al. Crit Care Med. 2010; 38:464-70 [4] Williams et al. Anesth Analg 1999; 88:999-1003, [5] Kellum et al. Shock. 1998; 9:364-8, [6] Wilcox et al. J Clin Invest 1983; 71:726-35, [7] Martirosian et al. MRM 2004; 51:353-61, [8] Gardener et al. MRM. 2010; 63:1627-36, [9] Debatin et al. Radiology 1994; 190:371-8, [10] Buxton et al. MRM 1998; 40:383-96, [11] Cox et al ISMRM 2011 P825. We acknowledge Baxter for their funding.
Fig 2: Example perfusion weighted images of the kidneys acquired using respiratory-triggered ASL.
Fig 1: MR data collection protocol
Fig 3: Change in (a) renal cortex tissue perfusion and (b) renal artery flow velocity due to the unbalanced (0.9% saline) and balanced (Plasma-Lyte 148)
crystalloid infusion (mean ± SEM)
A
B
1307Proc. Intl. Soc. Mag. Reson. Med. 20 (2012)