measuring the economic impact of water quality initiatives · measuring the economic impact of ......
TRANSCRIPT

Measuring the Economic Impact of
Water Quality Initiatives
A study of the Fund for Lake Michigan: 2014-2015 Update
University of Wisconsin – Whitewater Fiscal and Economic Research Center Institute for Water Business
August 1, 2016

Authors
Russell Kashian, PhD University of Wisconsin – Whitewater
800 W Main Street Whitewater, WI 53190
Benjamin Kelly University of Wisconsin – Whitewater
Samuel Cordova-Soto University of Wisconsin – Whitewater

Table of Contents
Fund for Lake Michigan Economic Impact................................................................................1
Executive Summary.......................................................................................................................2
Introduction....................................................................................................................................3
Background ...................................................................................................................................4
Literature Review .........................................................................................................................5
Methodology ..................................................................................................................................8
Data ................................................................................................................................................8
Results.............................................................................................................................................9
Conclusion ...................................................................................................................................10
Appendices....................................................................................................................................11
Appendix A: Tables................................................................................................................11
Appendix B: List of 2014-2015 Approved FFLM-Funded Projects...................................12
References.....................................................................................................................................19

1
Fund for Lake Michigan Economic Impact
The primary finding of this study is that the Fund for Lake Michigan (“FFLM” or “the Fund) has
had a very positive, demonstrable economic impact in the southeastern region of Wisconsin. Our
findings also suggest that, if funded in the same manner, the Fund should continue to have a
similar level of economic impact for the foreseeable future. This paper is an update of the
original paper which discussed the economic impact findings between 2011 and 2013. Based on
the outcomes of both studies, the following represents the total economic impact the Fund for
Lake Michigan has provided in its first five years of grant making (2011-2015):
• Creation of over 822 full-time equivalent jobs, providing employees with $25 million in labor income
• Stimulating the economy with over $65 million in economic output • Increase in property values by over $131 million • Leveraging of an additional $26 million from private and public sources for Fund-
supported projects
The following economic impacts were from the original paper which found that the Fund’s grant
making between 2011 and 2013 had the following economic impact:
• Creation of over 480 full-time equivalent jobs, providing employees with $13 million in labor income
• Stimulating the economy with over $35 million in economic output • Increase in property values by over $45 million • Leveraging of an additional $13 million from private and public sources for Fund-
supported projects
This updated paper is based on projects the Fund for Lake Michigan supported between 2014
and 2015. The following economic impacts were derived from the new projects:
• Creation of over 342 full-time equivalent jobs, providing employees with $12 million in labor income
• Stimulating the economy with over $30 million in economic output • Increase in property values by over $86 million • Leveraging of an additional $13 million from private and public sources for Fund-
supported projects

2
While the main focus of this report is on the economic impact of the Fund for Lake
Michigan’s grants on southeast Wisconsin, these benefits are not limited to that
region. Noting that our economic infrastructure and environmental infrastructure are
ultimately interconnected, projects that promote environmental benefits in the southeastern
part of the state will ultimately help the rest of Wisconsin as they encourage tourism and
contribute to economic development throughout the state. Furthermore, the Fund for Lake
Michigan has begun to expand its grant making beyond southeast Wisconsin to include a
number of projects in Dane County, the Green Bay area, Door County and other
communities along the Lake Michigan coastline. As the Fund expands its programming,
the direct economic benefits extend to these and other communities and areas. Finally,
these investments will have a statewide impact as tourists will travel throughout Wisconsin
to visit these sites.
Executive Summary
Although the Clean Water Act1 is over 40 years old, there is still work left to be done on
restoring many of the United States’ waterways. The Great Lakes, an area close to home for
many of us, has been improving over the years, but there are still concerns with the “leveling off
or even reversal of reductions in toxic chemicals such as mercury and nutrient loadings in the
past decade and earlier”.2 In Wisconsin, for instance, there are plenty of new bodies of water
being listed as “impaired” based on standards set by the Department of National Resources. The
cost of improving these waterways is estimated to be $4 billion over the next 20 years.3 This is a
1 For more information on the Clean Water Act, see http://www2.epa.gov/laws-regulations/summary-clean-wateract 2 Source: Egan, D. (2013, May 14). Great Lakes water quality improved, but there are still issues, report says. Milwaukee Journal Sentinel. 3 Source: Bergquist, L. (2013, June 12). Wisconsin set to list 150 more water bodies as impaired. Milwaukee Journal Sentinel.

3
challenging proposition, as waterway restoration can take many years for the initial plans to
come to fruition. This is where organizations, such as the Fund for Lake Michigan, come in.
The Fund for Lake Michigan provides grants to nonprofit and government organizations
to conduct projects aimed at improving water quality. The main goal of the Fund for Lake
Michigan is to enhance the health of Lake Michigan and the life of its communities. By
providing funding to achieve this goal, the Fund for Lake Michigan can help us achieve higher
standards of water quality in the southeastern Wisconsin region.
The University of Wisconsin-Whitewater’s Fiscal and Economic Research Center
(FERC) and the Institute for Water Business were tasked with conducting an analysis of the total
economic impact of all FFLM-funded projects between 2014 and 2015. In order to do this, we
used IMPLAN, an input-output method of analysis. Both primary impacts (those impacts that are
directly caused by the Fund for Lake Michigan) and secondary impacts (those impacts that are
indirectly caused by the Fund for Lake Michigan) were considered.
Introduction
The University of Wisconsin-Whitewater’s Fiscal and Economic Research Center
(FERC) and the Institute for Water Business analyzed and estimated the economic impact that all
Fund for Lake Michigan grants awarded in 2014 and 2015 had in the southeastern Wisconsin.
This was done using IMPLAN, an input-output method of economic modeling that will be
discussed in detail later in this report.
Main findings indicate the Fund had, and will continue to have, a tremendous impact on
the southeastern Wisconsin area. Grants awarded by the Fund in 2014 and 2015 created over 342
jobs, provided employees with over $12 million in labor income, increased property values by
over $86 million and generated over $30 million in economic output in the region.

4
Background
The mission of the Fund for Lake Michigan is to support efforts, in particular those in
southeastern Wisconsin, that improve the water quality of Lake Michigan, its shoreline and
tributary river systems for the benefit of the people and communities that depend upon the
system for water, recreation and commerce. When possible, the Fund invests in projects that
provide multiple community benefits, such as economic development, job creation, enhanced
recreational opportunities for local residents, and increased tourism. The vast majority of the
Fund’s grants support on-the-ground projects that have direct, near-term and quantifiable impacts
on water quality and the communities served by the Fund.
The Fund for Lake Michigan awarded 79 grants totaling roughly $4.4 million in 2014 and
2015. The Fund generally solicits grants twice a year. Grants are highly competitive; the Fund
has received more than $55 million in grant requests since 2011. Roughly half of the Fund’s
grants have supported local governments. Other grantees include: not-for-profit organizations,
state agencies, utilities, and faith groups. While for-profit businesses are not directly eligible for
grants, many local companies have partnered with government agencies or non-profit
organizations to advance projects or have otherwise benefitted from Fund-supported projects.
Grants in 2014 and 2015 ranged from $9,375 to $200,000 with an average grant award of
roughly $56,000. The Fund’s grantees were able to leverage an additional $13 million for Fund-
supported projects.
The Fund requires grantees to submit both interim and final reports and tracks qualitative
and quantitative accomplishments for each project. Overall, the Fund’s grants have provided a
variety of environmental benefits.

5
These benefits include:
• Improving state and local parks, swimming beaches and other tourist destinations along
the Lake Michigan coastline
• Transforming miles of degraded waterways into popular locations for fishing, boating
and other recreational activities
• Restoring hundreds of acres of wetland creating high-quality habitat and reducing
flooding downstream
• Revitalizing waterfronts and transforming polluted and neglected land into parks and
sites for new development
• Advancing locally-developed technologies and products to reduce flooding and keep
polluted runoff from entering our waterways.
Literature Review
In order to properly measure the total economic impact of the FFLM, it is necessary to
analyze the impact that the completion of every FFLM-funded project is expected to have. Many
of the FFLM’s projects have ancillary benefits to their surrounding areas; an example being the
increase in the value of affected properties. A review of academic studies is necessary in order to
put numeric values on the benefits from the outcomes realized once each FFLM-funded project
is completed. After each individual outcome was measured and assigned a dollar amount, a total
dollar amount was calculated by adding up the dollar amount each outcome provided. This is the
dollar amount that was used to estimate the impact of project outcomes based on FFLM
investment. In the rest of this section, we give a brief summary of each study employed and
apply the study to one or more of FFLM’s projects. For brevity’s sake, only the most impactful

6
studies are discussed below. However, all studies employed are properly cited at the end of this
report (see References).
Lutzenhiser and Netusil (Contemporary Economic Policy, 2001) studied the relationship
between a home’s sale price and its proximity to different types of open land, such as parks.
They found that housing prices of properties within a 1,500-foot radius of open land were
positively affected. This radius is used to determine how many properties were affected by an
FFLM-funded project. Once we determined where the project took place, we used the 1,500-foot
radius measure to determine which properties were affected; i.e., had property values increase.
Projects with the expected outcome of increasing native plantings in an area were
measured in a study titled “Integrating Valuation Methods to Recognize Green Infrastructure’s
Multiple Benefits,” by the Center for Neighborhood Technology. In this study, property values
were estimated to increase by 2-10% in areas where new plantings took place. For the purpose of
measuring outcomes of FFLM’s projects, we scaled down this range to 2-8% and averaged it out
to 5%. We found average property value and the number of properties affected in each area,
which enabled us to determine the increase in property values realized by the completion of
native plantings projects.
Stormwater management is the biggest project grouping of all FFLM-funded project
outcomes. The goal of these projects is to improve and/or prevent stormwater runoff. Braden and
Johnston (Journal of Water Resources Planning and Management, 2004) estimate that property
owners who undertake stormwater management improvement projects increase their property
value by 2-5%. This range was averaged to 3.5% in efforts to conservatively address home
values in the FFLM project area.

7
Leggett and Bockstael conducted a study using hedonic techniques to show that water
quality has a significant effect on property values (Journal of Environmental Economics and
Management, 2000). They determined that an increase in the water quality of an area led to a 2%
increase in the values of properties in that area; we used this estimate to calculate a total impact
value for all projects planned for water quality improvement in a given area. We began by
determining the average property value and the number of properties affected. Following these
calculations, the number of properties impacted was multiplied by the average property value in
the area. This result was multiplied by 0.02 (2%) in order to determine the final impact number
for all FFLM projects leading to improved water quality.
The FFLM also funded a few projects with the goal of riparian buffer installation. Yang
and Weersink (Canadian Journal of Agricultural Economics, 2004) estimated the economic
return on riparian buffers to be 14% on the investment; i.e. $1,000 invested is expected to return
$140. This return on investment estimate was used to calculate a total dollar amount of the
benefit associated with installing riparian buffers. Projects that installed riparian buffers were
analyzed by taking their FFLM funding and multiplying it by 0.14 (14%) to calculate the return
on FFLM’s investment.
Thibodeau and Ostro (Journal of Environmental Management, 1981) studied the effects
of wetlands on property values. Since wetlands provide natural water storage, they often act as a
flood prevention measure in nearby areas. Thibodeau and Ostro estimated the savings from
flood damage to properties near wetlands to be approximately $2,000 per acre. We determined
the number of acres affected by a FFLM wetland restoration project in order to calculate the total
dollar amount saved.

8
After the monetary value of each outcome category was calculated, the categories were
aggregated together to determine the numerical dollar value of all FFLM-funded project
outcomes. We then used IMPLAN analysis to determine the total economic impact of FFLM.
Methodology
To calculate the economic impact of all Fund for Lake Michigan project funding, an
IMPLAN input-output model economy was utilized. The IMPLAN model is designed to
determine the ultimate economic impact that initial spending by the organization has on the local
economy using the funding data obtained by this research. IMPLAN estimates to what extent
different spending categories affect the local economy in terms of direct spending, indirect
spending, and induced spending. These categories are defined as follows:
• Direct Spending: Initial FFLM-provided funds. • Indirect Spending: Spending brought on by organizations that received those FFLM
funds.
• Induced Spending The additional spending by employees of the organizations who have more labor income due to putting in more hours.
Determining the extent of each of the spending categories is critical to measuring the extent of
the impact that various forms of funding have on the local economy.
Data
There were two datasets used in our impact analysis of the Fund for Lake Michigan’s
projects. These two datasets were used in order to differentiate between the impact of FFLM
funding and the impact that FFLM-funded projects had on their surroundings once completed.
From the first dataset, a measure of the total amount of money the Fund granted was
calculated. This number was used to estimate the economic impact of the Fund’s grant making.
The second dataset used was comprised of each FFLM-funded project’s intended outcomes. In

9
order to conduct this type of analysis, the data were further broken down into the expected
outcomes each project intended to yield upon completion. Included in this dataset are things like
how many acres of land were restored or were expected to be restored, how many native species
were planted, how many stream miles of waterway were restored or were expected to be
restored, etc. From these outcomes, a total dollar amount of the effects of these projects was
calculated. This number was used to determine the total economic impact that would be realized
upon completion of all FFLM-funded projects.
Results
Table 1 displays the economic impact of the funding provided by the Fund for Lake
Michigan only. No outcome measures or leveraged funds are included. By helping fund 79
projects, the FFLM is responsible for creating over 57 jobs, providing these employees with over
$2 million in total income, and infusing the economy of southeastern Wisconsin with over $6
million in economic output.
In Table 2, estimates are provided for the impact that completing all FFLM-funded
projects will have on the southeastern Wisconsin region. Once completed, all of the FFLM-
funded projects will have combined to create over 195 jobs, provide their employees with over
$4 million in total income, and generate over $14 million in economic output4. The main driving
force of the economic impacts due to FFLM project outcomes is the increase in property values.
In addition to analyzing the funding provided by the FFLM only, Table 3 also displays
the funding all organizations were able to obtain due to the initial FFLM-funding. This act, also
known as leveraging, created over 90 jobs, provided over $4 million in labor income, and created
4 It should be noted that some of the project outcomes could not be quantified; therefore, these estimates represent just over 80% of all FFLM project outcomes.

10
over $9 million in economic output. The funds analyzed in Table 3 represent the funds that
would not have been obtained without direct funding of the FFLM.5
Conclusion
The total economic impact of the Fund for Lake Michigan is displayed in Table 4. This
was measured by adding together all estimates of the previous three tables. When analyzed as a
whole, the FFLM is responsible for creating over 342 jobs, providing employees over $12
million in labor income, increasing property values by over $86 million, and stimulating the
economy of southeastern Wisconsin with over $30 million of economic output. These estimates
represent all FFLM-funded projects from 2014 until 2015, with the assumption that they will be
completed on time.
Projecting the future is always difficult, as there are inherent uncertainties in doing so.
However, if the Fund for Lake Michigan continues, it is anticipated the return on the FFLM’s
investment will be similar to the returns of the projects analyzed for this report. Overall, the
Fund for Lake Michigan has had a tremendous impact on the economy of southeastern
Wisconsin.
Estimates provided in this report show the numerical values of the Fund’s projects, but it
is often forgotten that there is a “double bottom line” in the outcomes of these projects. Not only
does FFLM-funding create jobs, provide labor income, and stimulate the economy, but it also
provides a better environment and a higher quality of life. These factors, although not entirely
quantifiable, must be taken into consideration when analyzing the total effect the Fund for Lake
Michigan has had, and will continue to have, on Wisconsin’s economy.
5 These are also referred to as “leveraged funds”. The funds under consideration here are non-Wisconsin and/or federal sources of funds.

11
Appendices
Appendix A: Tables
Table 1: Economic Impact of FFLM Grant-Making Impact Type Employment Labor Income Output
Direct Effect 36 $1,925,760 $3,401,538 Indirect Effect 7 $314,310 $914,696 Induced Effect 14 $586,753 $1,839,326 Total Effect
57 $2,826,822 $6,155,560
Table 2: Economic Impact of Project Outcomes based on FFLM Investment
Impact Type Employment Labor Income Output Direct Effect 150 $3,016,661 $8,515,408 Indirect Effect 20 $942,158 $3,184,980 Induced Effect 25 $1,038,811 $3,256,049 Total Effect 195 $4,997,632
Table 3: Economic Impact of Leveraged Funds from Federal and Non-WI Sources
$14,956,435
Impact Type Employment Labor Income Output Direct Effect 57 $3,040,415 $5,370,392 Indirect Effect 10 $496,237 $1,444,133 Induced Effect 22 $926,373 $2,903,951 Total Effect 90
Table 4: Total Impact of FFLM Monies
$4,463,024 $9,718,479
Impact Type Employment Labor Income Output Direct Effect 243 $7,982,835 $17,287,337 Indirect Effect 37 $1,752,705 $5,543,809 Induced Effect 62 $2,551,936 $7,999,327 Total Effect 342 $12,287,476 $30,830,473
Note: These numbers are a summation of Tables 1, 2, and 3.

12
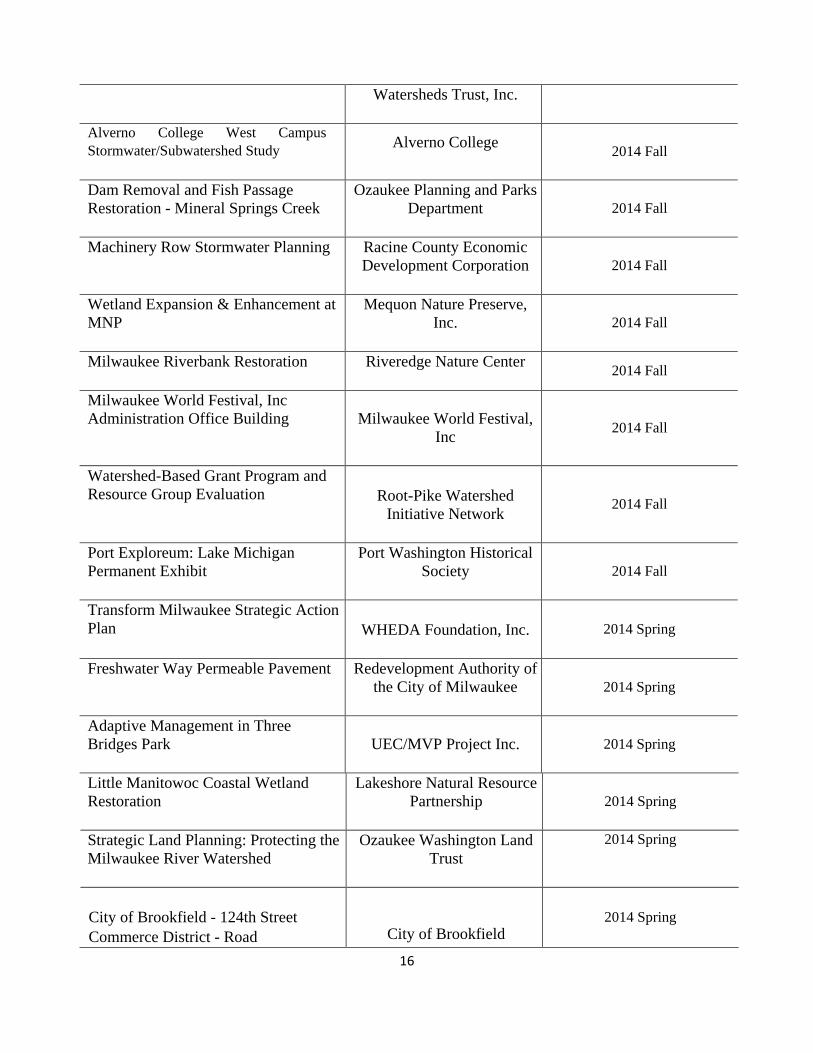
Appendix B: List of Approved 2014-2015 FFLM-Funded Projects
Project Title Organization Cycle
Veterans Memorial Park Milwaukee Riverbank Restoration
Village of Grafton 2015 Fall
Design Services & Plan Preparation for Pike River Bank Stabilization and Restoration
Kenosha County Division of Parks
2015 Fall
Building the Capacity and Delivery of LNRP's Stewardship Fund
Lakeshore Natural Resource Partnership
2015 Fall
Coastal Assessment of Southeastern Wisconsin Lake Michigan Shoreline
Natural Resources Foundation of Wisconsin
2015 Fall
Root River Floodplain Restoration Project
Hunger Task Force 2015 Fall
Next-Generation Water Conservationists
Great Lakes Community Conservation Corps
2015 Fall
Mequon Preservation Partners
Ozaukee Washington Land Trust
2015 Fall
Milwaukee River Greenway bluff and trail project
River Revitalization Foundation
2015 Fall
Harrington Beach - E.coli Source Identification & Assessment
Ozaukee County 2015 Fall
Sweet Water Mini-Grant Program: Improving Water Quality Through Local, Grassroots Efforts
Sweet Water: The Southeastern Wisconsin Watersheds Trust, Inc.
2015 Fall
Production of the Milwaukee Harbor Habitat Map
UWM Foundation on behalf of the UWM School
of Freshwater Sciences
2015 Fall
Oak Creek Watershed Restoration Plan
The Milwaukee County Department of Parks, Recreation & Culture
2015 Fall

13
The Forest Exploration Center - Phase 1 Site Development
Forest Exploration Center 2015 Fall
A Collaborative Effort to Restore Urban Green Spaces Through Expanded Community-based Stewardship
The Milwaukee County Department of Parks, Recreation & Culture
2015 Fall
Envisioning the Future of Milwaukee's Harbor District
Harbor District, Inc. 2015 Fall
North Avenue Corridor Restoration: GI Implementation Solution for Privately-Owned Parking Lots
City of Milwaukee Office of Environmental
Sustainability
2015 Fall
Water Quality Impact of Windrow Manure Composting
Clean Lakes Alliance 2015 Fall
Woodland Dunes Forget Me Not Creek Restoration 1
Woodland Dunes Nature Center and Preserve, Inc.
2015 Fall
Corporate Water Stewardship Demonstration Site
The Water Council 2015 Fall
Bioswale BMP at Glendale Nicolet Recreational Park
City of Glendale 2015 Fall
Crescent Beach - Storm Water Collection and Outfall Redesign - Algoma, WI
City of Algoma 2015 Fall
Racine County Harbor Monitoring Study
Racine County Department of Public Works
2015 Fall
Keeping Tabs on the Sturgeon of the Menominee River
River Alliance of Wisconsin
2015 Fall
Evaluating the Effectiveness of Beach Redesign and Remediation Projects
University of Wisconsin - Sea Grant Institute
2015 Fall
Beerline Trail Neighborhood Development Project in the Riverworks area
Greater Milwaukee Committee
2015 Fall

14
The Ridges Sanctuary's Living Laboratory for Protection & Sustainability Along Lake Michigan
The Ridges Sanctuary 2015 Spring
Green Schools Consortium of Milwaukee
Reflo: Sustainable Water
Solutions
2015 Spring
Galvanizing Water Stewardship in Milwaukee Neighborhoods
Milwaukee Environmental Consortium
2015 Spring
Breakwater Gateway Water Quality Improvement & Habitat Restoration
City of Port Washington 2015 Spring
Tractor Road Stormwater Diversion
Friends of Hawthorn Hollow
2015 Spring
Milwaukee River Watershed: Planning for Watershed Restoration
Sweet Water: The Southeastern Wisconsin Watersheds Trust, Inc.
2015 Spring
Camp Evelyn Dam Removal and River Restoration
Girl Scouts of Manitou Council
2015 Spring
Amsterdam Dunes Restoration Planning, Design & Implementation
Sheboygan County Planning & Conservation
2015 Spring
Alverno College West Campus Stormwater/Subwatershed Study
Alverno College
2015 Spring
Stormwater Management Planning at Schlitz Audubon Nature Center
Schlitz Audubon Nature Center
2015 Spring
Putting Milwaukee’s Rivers on a Low-Salt Diet
Milwaukee Riverkeeper 2015 Spring
Farmstead to Wetlands at MNP
Mequon Nature Preserve, Inc.
2015 Spring
Milwaukee River Lake Sturgeon Rehabilitation
Wisconsin Department of Natural Resources
2015 Spring
North Point Lighthouse Green Infrastructure Treatment Train
North Point Lighthouse Friends 2015 Spring

15
Implementing Near Term Priorities of the Pulaski Park Neighborhood Stormwater Plan
Sixteenth Street Community Health Center
2015 Spring
City of Oak Creek Lake Vista Green Infrastructure
City of Oak Creek 2015 Spring
Innovation through Implementation: Creating a Green Infrastructure Campus in Milwaukee's Central Ci
Walnut Way Conservation
Corp.
2015 Spring
Lake Michigan Wildlife and Water Quality Improvement Project
Ducks Unlimited Inc. 2015 Spring
Freshwater Sustainability Lab Educational Outreach
Discovery World 2015 Spring
Prioritization of Restoration in the Oak Creek Watershed via Water Quality and Habitat Assessment
City of Racine 2015 Spring
Great Rivers / Great Lakes
Ozaukee Washington Land Trust
2015 Spring
Enhancing Utilities’ Water Efficiency: A Water Loss Audit Pilot Training Program
City of Cudahy Water Utility
2015 Spring
Restoring Silver Creek for the Health of Green Bay and Lake Michigan
The Nature Conservancy 2015 Spring
Developing a Framework for Prioritization of Action Areas Suitable for the AMO in LFR
Alliance for the Great Lakes 2015 Spring
Addressing storm water impact on public safety, dune habitat, and water quality at KASP
Friends of Kohler-Andrae Inc.
2015 Spring
Samuel Myers Park Restoration
City of Racine 2015 Spring
Sweet Water's 2014 Water Quality Mini-Grant Program
Sweet Water: The Southeastern Wisconsin 2014 Fall
16
Watersheds Trust, Inc.
Alverno College West Campus Stormwater/Subwatershed Study Alverno College
2014 Fall
Dam Removal and Fish Passage Restoration - Mineral Springs Creek
Ozaukee Planning and Parks Department
2014 Fall
Machinery Row Stormwater Planning
Racine County Economic Development Corporation
2014 Fall
Wetland Expansion & Enhancement at MNP
Mequon Nature Preserve, Inc.
2014 Fall
Milwaukee Riverbank Restoration
Riveredge Nature Center 2014 Fall
Milwaukee World Festival, Inc Administration Office Building
Milwaukee World Festival,
Inc
2014 Fall
Watershed-Based Grant Program and Resource Group Evaluation
Root-Pike Watershed
Initiative Network
2014 Fall
Port Exploreum: Lake Michigan Permanent Exhibit
Port Washington Historical Society
2014 Fall
Transform Milwaukee Strategic Action Plan
WHEDA Foundation, Inc.
2014 Spring
Freshwater Way Permeable Pavement
Redevelopment Authority of the City of Milwaukee
2014 Spring
Adaptive Management in Three Bridges Park
UEC/MVP Project Inc.
2014 Spring
Little Manitowoc Coastal Wetland Restoration
Lakeshore Natural Resource Partnership
2014 Spring
Strategic Land Planning: Protecting the Milwaukee River Watershed
Ozaukee Washington Land Trust
2014 Spring
City of Brookfield - 124th Street Commerce District - Road
City of Brookfield 2014 Spring

17
Reconstruction/Stormwater Project
Fund for Lake Michigan Freshwater Sustainability Lab
Discovery World
2014 Spring
Harrington Beach Stormwater Remediation
Ozaukee County
2014 Spring
Rain Garden Initiative - An Effort to Improve Water Quality
Ozaukee County
2014 Spring
Scenario-Based Green Infrastructure Planning and Implementation in the KK Watershed
Sixteenth Street Community
Health Center
2014 Spring
Addressing Fish Passage Impediments in the Menomonee River Watershed
Milwaukee Riverkeeper
2014 Spring
Implementation of recommended reclamation directives from the eco-hydrological analysis
Somers Town Park Committee
2014 Spring
Green Infrastructure for Johnsons Park
Center for Resilient Cities 2014 Spring
RootWorks 2014 Projects - Belle Harbor
Racine County Economic Development Corporation
2014 Spring
MES Stormwater Re-Use Project
Milwaukee Teacher
Education Center (MTEC)
2014 Spring
Bradley Lake Water Quality Improvement & Habitat Restoration
City of Sturgeon Bay 2014 Spring
United Watershed AmeriCorps Project
Great Lakes Community
Conservation Corps
2014 Spring

18
Reducing Watershed Pollution Through Dynamic Stormwater Retention on the Roof
The Water Council
2014 Spring
Ecological Restoration of Lake Michigan Wetlands
Ducks Unlimited Inc.
2014 Spring

19
References
Bin, O., & Polasky, S. Effects of Flood Hazards on Property Values: Evidence Before and After Hurricane Floyd. Bolitzer, B., & Netusil, N. R. (2000). The impact of open spaces on property values in Portland, Oregon. Journal of Environmental Management, 59, 185-193. Braden, J. B., & Johnston, D. M. (2004). Downstream Economic Benefits from Storm-Water
Management. Journal of Water Resources Planning and Management, 130, 498-505 Brander, L. M., Florax, R. J. G. M., & Vermaat, J. E. (2006). The Empirics of Wetland Valuation: A Comprehensive Summary and a Meta-Analysis of the Literature. Environmental & Resource Economics, 33, 223-250. Collins, A., Rosenberger, R., & Fletcher, J. (2005). The economic value of stream restoration. Water Resources Research, 41. Doss, C. R., & Taff, S. J. (1996). The Influence of Wetland Type and Wetland Proximity on Residential Property Values. Journal of Agricultural and Resource Economics, 21, 120-
129. Hanley, N., Bell, D., & Alvarez-Farizo, B. (2003). Valuing the Benefits of Coastal Water Quality Improvements Using Contingent and Real Behaviour. Environmental and Resource Economics, 24, 273-285. Legget, C. G., & Bockstael, N. E. (2000). Evidence of the Effects of Water Quality on Residential Land Prices. Journal of Environmental Economics and Management, 39, 121-144. Loomis, J., Kent, P., Strange, L., Fausch, K., & Covich, A. (2000). Measuring the total economic value of restoring ecosystem services in an impaired river basin: results from a contingent valuation survey. Ecological Economics, 33, 103-117. Lutzenhiser, M., & Netusil, N. R. (2001). The Effect of Open Spaces on a Home's Sale Price. Contemporary Economic Policy, 19, 291-298. Murray, C., Sohngen, B., & Pendleton, L. (2001). Valuing water quality advisories and beach
amenities in the Great Lakes. Water Resources Research, 37, 2583-2590. O'Gorman, S., Bann, C., & Caldwell, V. (2009). The Benefits of Inland Waterways.
Pimentel, D., et al (1995). Environmental and Economic Costs of Soil Erosion and Conservation Benefits. Science, 267, 1117-1122.
Pimentel, D., Zuniga, R., & Morrison, D. (2005). Update on the environmental and economic costs associated with alien-invasive species in the United States. Ecological Economics, 52, 273-288. Sheeran, K., & Hesselgrave, T. (2012). Analysis of the Economic Benefits of Salmon Restoration Efforts on the Lower Coquille River and Associated Economic Impacts. Report to the Nature Conservancy. Sumaila, U. R., & Suatoni, E. (2005). Fish Economics: The Benefits of Rebuilding U.S.
Ocean Fish Populations.Fisheries Economics Research Unit.

20
The Wisconsin Department of Natural Resources. (2012). Phosphorus Reduction in Wisconsin Water Bodies: An Economic Impact Analysis. Thibodeau, F. R., & Ostro, B. D. (1981). An Economic Analysis of Wetland Protection. Journal of Environmental Management, 12, 19-30. Whitelaw, E., & MacMullan, E. (2002). A Framework for Estimating the Costs and Benefits of Dam Removal.BioScience, 52, 724-730. Retrieved February 16, 2014 Wise, S., Braden, J., Ghalayini, D., Grant, J., Kloss, C., MacMullan, E., Morse, S., & al. (2008). Integrating Valuation Methods to Recognize Green Infrastructure's Multiple Benefits. Chicago, IL: Center for Neighborhood Technology. Yang, W., & Weersink, A. (2004). Cost-effective Targeting of Riparian Buffers. Canadian Journal of Agricultural Economics, 52, 17-34. Young, R. F. (2011). Planting the Living City. Journal of the American Planning Association, 77, 368-381.