measuring the effect of earthquake recovery loans …measuring the effect of earthquake recovery...
TRANSCRIPT

Measuring the Effect of Earthquake Recovery Loans
for SMEs from Japan Finance Corporation
Lead Economist Hikaru Fukanuma*
Senior Economist Hiroshi Ishihara
Researcher Yuji Matsui
Researcher Tomoyuki Ota
Japan Finance Corporation Research Institute
Over two years have passed since the Great East Japan Earthquake occurred. Since
the earthquake, the government has implemented many policies for recovery and rehabilitation.
Japan Finance Corporation (JFC) has also supported SMEs that suffered direct or indirect
damage from the earthquake as much as possible, making special earthquake recovery loans
available to them. Now, JFC continues to provide its special loans.
Currently, more than a few damaged areas are still in the process of recovery and
rehabilitation. However, concern about the effects brought about by the various political
packages is also increasing. In this situation, it seems important to verify the effectiveness of
JFC’s earthquake recovery loans for SMEs across Japan during the early stage while the
memories and records of those days remain intact. Hence, in this paper, we attempt to calculate
the effects of the JFC loans during the period of approximately one year after the earthquake
disaster.
This paper would not have been possible without the cooperation of the SMEs that
responded to the “Questionnaire concerning the Effects of the Great East Japan Earthquake on
SMEs” in June 2012 and their participation in subsequent direct interviews. We hereby express
our hearty gratitude to those who shared their precious time for the survey.
-Abstract-
The Great East Japan Earthquake affected the economy not only in the directly damaged areas but also across all of Japan. To promote recovery from the disaster, Japan Finance Corporation made special loans available to SMEs damaged by the earthquake with more favorable interest rates and loan conditions than usual. One of the important roles of government is to support recovery from large disasters. However, on the other hand, a suitable effect should be created by policies funded by the governmental budget. Hence, in this paper, we attempt to calculate the effect on SMEs of JFC’s earthquake recovery loans. Although our calculations are tentative due to the many assumptions that need to be made, as a result of the loans during the period of approximately one year from the occurrence of the earthquake until March 2012, we estimate the employment retention effect at 601,887 persons, the sales retention effect at 7,360,300 million yen, and the value added retention effect at 1,711,100 million yen. Although it is necessary to examine the numbers with a certain amount of leeway, we can say that the loans engendered certain economic effects. In addition, the value added retention effect that we calculated exceeds the FY2011 supplementary budget of 486,900 million yen which JFC (through its Loan Sub Unit of the SME Unit, and the Micro and Individual Unit) received mainly for earthquake disaster countermeasures.
*Corresponding author: Hikaru Fukanuma (Mr.), Lead Economist, Japan Finance Corporation Research Institute, Otemachi Financial City North Tower, 1-9-4 Otemachi, Chiyoda-ku, Tokyo 100-0004 JAPAN e-mail: [email protected]
Note: This paper was originally published in Japanese on [Quarterly Research Report] 日本政策金融公庫論集 20 (Aug. 2013): 1-23 (Japan Finance Corporation Research Institute).
1
February 10, 2014

2
1 The Earthquake and the Action of JFC
The Great East Japan Earthquake
affected the economy not only in the directly
damaged areas but also across Japan. The
Cabinet Office (2011) estimated that the damage
to capital stock amounted to between 16 trillion
and 25 trillion yen.1 The size of the disaster can
be grasped if one considers that it far exceeds the
9.6 trillion yen loss due to the Great Hanshin
Awaji Earthquake in 1995.2 The Cabinet Office
(2011) also calculated the one-year GDP decrease
due to the loss of capital stock at 1.25 trillion yen
to 2.25 trillion yen and the half-year GDP
decrease due to the damaged supply chain at 0.25
trillion yen. Given this, the total decrease would
be 1.5 to 2.5 trillion yen, or 0.3% to 0.6% of the
annual GDP. 3 However, this figure does not
include the effects of the consumption decrease
due to the depressed mood of the people after the
earthquake, the electric power shortage, economic
damage caused by rumors, and the accident at
the Fukushima Daiichi Nuclear Power Plant.4 In
reality, the GDP growth rate was minus 0.9%
YOY (minus 3.7% annually) during January to
March 2011, and minus 0.5% YOY (minus 2.1%
annually) during April to June 2011.
Given this situation, as a government
1 The original data was produced on May 23, 2011, by
Economic Research, Cabinet Office. In addition, Disaster
Management, Cabinet Office produced the estimation of
16.9 trillion yen on June 24, 2011. 2 Estimation by Natural Land Agency in February 1995. 3 The original data is the same as in footnote 1. As for the
effects of the supply chain damage, it was assumed that
there was no substitute production of parts by other
companies. 4 The Cabinet Secretariat National Policy Unit (2011)
estimated the amount of damage due to the accident at
Fukushima Daiichi Nuclear Power Plant to be about 5,800
billion yen as of December 19, 2011.
financial institution, Japan Finance Corporation5
(JFC) opened “Special Consultation Counters
regarding the Great East Japan Earthquake” at
152 branches all over Japan so as to enable
thorough and rapid consultations on loans and
repayment plans for SMEs affected by the
disaster. These counters were opened on the day
when the earthquake occurred.
Also, until the end of March 2012, JFC
held special sessions for consultations and
explanation of the loan schemes outside the
branch offices 1,474 times, and JFC consulted
with 261,000 SMEs at the branches and other
locations. To support the operations, over 300
officers were dispatched to branches in heavily
damaged areas from the headquarters in Tokyo
and branches in other areas.
Regarding the loan schemes, JFC
prepared special earthquake recovery loans such
as the “Great East Japan Earthquake Special
Recovery Loan” with more favorable interest
rates and loan conditions than usual for SMEs
damaged by the earthquake6 (Table 1). Not only
SMEs that suffered damage directly but also
5 JFC was established in October 2008. The Micro and
Individual Unit of JFC succeeded the operation of National
Life Finance Corporation (NLFC), the Small and Medium
Enterprise Unit succeeded the Japan Finance Corporation
for Small and Medium Enterprises (JASME), and the
Agriculture, Forestry, Fisheries and Food Business Unit
succeeded the Agriculture Forestry and Fisheries Finance
Corporation (AFC). 6 “The Great East Japan Earthquake Recovery Special
Loans” started from May 23, 2011. From March 11 to May
22, JFC executed loans for SMEs damaged by the
earthquake, utilizing the scheme of existing “Disaster
Recovery Loans” and “Safety-Net Loans” with slightly
different loan terms and conditions. The special
earthquake recovery loans for SMEs, which JFC
announced and which are the analysis target of this paper,
include those loans made before May 22. For details about
the action of JFC in response to the earthquake, refer to
Japan Finance Corporation (2012a) p.10.

3
SMEs with indirect damage, caused by damage to
customers or suppliers and by rumors, were
included among the SMEs eligible for loans. In
addition, loans were made not only to SMEs in
the areas that suffered heavy direct damage but
also to SMEs all over Japan. 7 Those special
earthquake recovery loans for SMEs from JFC
amounted to 2,667 billion yen as of March 2012
and another 767 billion yen from April 2012 to
March 2013. Currently, JFC continues to provide
these special loans8,9 (Table 2).
2 Problem Setting
It cannot be overemphasized that one of
the important roles of government is to support
recovery and restoration following a large
disaster such as a massive earthquake. However,
on the other hand, a suitable effect should be
created by the policies funded by the
governmental budget. Verification is necessary
concerning what effects were achieved by JFC’s
special earthquake recovery loans for SMEs, and
how these effects were achieved, so that we can
provide much more effective support for SMEs
7 In Okinawa Prefecture, where JFC does not have a
branch office, the Okinawa Development Finance
Corporation made similar loans (Okinawa Development
Finance Corporation, 2011). However, the loans provided
by the corporation are not included in the analysis of this
paper. 8 JFC provides not only loans to SMEs but also special
business loans to the agriculture and fishery industries
and special education loans to households which were
damaged by the earthquake. As this paper concentrates on
the effects of SME loans, those loans are not included in
this paper. 9 Since April 2013, JFC has made the special earthquake
recovery loans only to the SMEs that have business
establishments in the Special Disaster Area. For these
loans, the Special Disaster Area is defined by a special law
and is not equivalent to the “disaster prefectures” in this
paper.
and local economies in case another disaster
occurs. Hence, in this paper, we attempt to
calculate the effects of the JFC loans on the local
and national economies, estimating the
cumulative positive effects for each SME.
3 Previous Literature
In Japan, government financial
institutions and credit guarantee corporations
have released the amounts of loans and
guarantees, and the number of loans, as an index
which shows the effect of public finance. In their
analyses referring to economic effects at a macro
level, Higano (1984) and Fukuda et al. (1995)
showed the cowbell effect, i.e., when the
Development Bank of Japan made loans to a
company, the loan amount from commercial
financial institutions to the company increased.
Moreover, Ookusa (2002) found that public
support had a significant effect in easing
procurement of equipment loans under the
situation of a credit crunch. However, attempts to
assess each policy effect seldom progressed in the
early 2000s. Iwamoto (2004) noted “public
financial institutions are just starting to
introduce policy review systems, but there is no
satisfying evaluation method of the benefit of the
policy.”
Corresponding to requests for
improvement of the review of public programs,
some scales, such as public finance’s contribution
to the foundation and maintenance of SMEs and
to the employment and sales growth of SMEs
that received loans, have been used in reports of

4
public finance institutions.
For example, National Life Finance
Corporation (NLFC) (2006) calculated that,
during one year, it made loans for 28,032 new
business startups employing 4.3 persons
including entrepreneurs and created jobs for
102,000 persons in total. In addition, NLFC
(2006) showed that 11.3% of the customer SMEs
were able to avoid closure of their businesses
using NLFC loans, and the benefit of saving the
jobs of the workers was estimated to be 21 billion
yen to 111 billion yen. 10 Japan Finance
Corporation for Small and Medium Enterprises
(JASME) (2003) estimated that a 742 billion yen
capital investment made using the equipment
loans of JASME created 1,606 billion yen of
production-induced effects and 89,000 persons
worth of the employment-induced effects in
FY2001.11 Also, it noted that JASME’s safety-net
loans prevented the loss of employment of
755,000 persons who work for its customer
SMEs.12 Furthermore, as a positive impact of the
policy, the Ministry of Finance (2006) pointed out
not only the loans themselves but also the
creation of job opportunities and sales growth due
to projects implemented with loans from the
Development Bank of Japan. Those indexes are
continuously used in the current Annual Reports
10 Data was generated by the questionnaire sent to the
customers of NLFC in 2004. Benefits are calculated using
the average salary data. 11 The estimation was made on the assumption that SMEs
would cancel the projects if there were no JASMEC loans,
using the Input-Output Table. 12 The calculation was made under the assumption that
the customers would abandon their business operations
(i.e., employment would become zero) without the
Safety-Net Loans. Hence, the effects were comparably
larger than those of Fukanuma and Inoue (2007) or those
of this paper, where it was assumed that SMEs did not
necessarily stop operations without the NLFC loans.
of JFC.13
On the other hand, Yamori (2010) did an
analysis similar to that in NLFC (2006) on credit
guarantees by the credit guarantee corporation.
Using the data from the questionnaire sent to
SMEs in Aichi Prefecture which supposed a
situation where there were no special credit
guarantees for the Lehman financial crisis
recovery, Yamori showed that 12.0% of SMEs
that obtained the special guarantees would have
given up their business operations without the
special guarantees. Keeping these businesses in
operation saved 88,000 jobs. Lastly, considering
that another 10.7% of SMEs answered that they
might have sold important assets or that they
would have been forced to restructure their
businesses, and considering the existence of the
ripple effect of discontinuance of a business,
Yamori concluded that the effect of the special
guarantees was actually much larger.
In addition to the analysis on the
probability of giving up businesses, projects, or
startups seen in the above papers, Fukanuma
and Inoue (2007) estimated the effect of loans
using value added as a measure, considering the
change in the businesses size and ripple effects on
other companies caused by the discontinuance of
the businesses, in the situation without public
finance. Using questionnaire data and financial
statement information from NLFC customers,
Fukanuma and Inoue showed that 6.2% of SMEs
answered that they might have given up their
businesses, and 72.9% answered that the number
of employees and/or the sales amount would have
13 Ministry of Finance (2012b) contains similar data.

5
been affected if they could not have procured
loans from NLFC. Then, the paper calculated
that the employment retention effect was
1,200,000 persons (380,000 persons, if considering
re-entry to other companies), and the salary
retention effect was 2,030 billion yen (1,046
billion yen, if considering the existence of re-entry
to other companies). Moreover, calculating that
the value added retention effect other than salary
was 1,164 billion yen for one year and that the
value added decrease of other companies due to
the ripple effect of the SMEs’ operation stoppage
was 280 billion yen, Fukanuma and Inoue
concluded that the total value added retention
effect was 2,490 billion yen.
However, if other companies
immediately find substitutes for the products or
services no longer produced by the SMEs, the
effect in total would be 1,046 billion yen, or just
the amount of the lost salary, as reduction of the
value added and the ripple effects would not
appear. Because immediate substitution is not so
easy in the real world, Fukanuma and Inoue
concluded that the value added retention effects
of NLFC loans would be between 1,046 billion yen
and 2,490 billion yen. 14 We utilize a similar
analytical method in this paper.
Furthermore, other empirical studies
have been conducted. Takezawa, Matsuura, and
Hori (2005) examined the effect of the special
credit guarantee by the government based on
panel data classified by all prefectures. They
insisted that the special guarantee decreased
14 Also, the authors admitted that the economic effect was
tentative because it was calculated based on many
assumptions.
bankruptcy temporarily but increased the
bankruptcy in the next term and thereafter, and
that it is highly probable that the effect was to
postpone bankruptcy. On the other hand, in the
analysis of Uesugi (2008) and Uesugi, Sakai and
Yamashiro (2010) using questionnaire data for
SMEs, the special guarantee had the effect of
easing credit crunches. Using a similar data set,
Fukanuma, Nemoto, and Watanabe (2008)
showed that loans from government finance
institutions have a positive effect on company
growth in their start-up stage.
Lastly, although it is not a direct
evaluation of the public finance, Hosono et al.
(2012) showed that even if the companies are
outside of the core disaster area, the capital
investment rate was lower when the main bank
was in the disaster area compared to when the
main bank was out of that area, utilizing
company data following the Great Hanshin Awaji
Earthquake. They insist that bank damage due to
the disaster further restricted financing for
SMEs.
4 Questionnaire
The data for measuring the economic
effect of the earthquake recovery loans by JFC
was collected using the “Questionnaire
concerning the Effect of the Great East Japan
Earthquake on SMEs” distributed in June 2012.
The methodology is noted in Table 3. The main
results are summarized at the end of this paper
for reference purposes. The sample consisted of
the SMEs to which the SME Unit and the Micro

6
and Individual Unit of JFC provided special
earthquake recovery loans from March 11, 2011,
to March 31, 2012.
It was expected that answers would
differ greatly by the location and the damage
situation of a company. Therefore, defining the
five prefectures of Aomori, Iwate, Miyagi,
Fukushima, and Ibaraki as “disaster prefectures”,
the sample was extracted from eight sub-samples,
consisting of “Micro and Individual Unit
customers” 15 from “disaster prefectures” or
“other than disaster prefectures”16 “with direct
damage” or “with indirect damage” 17 , and
respectively, “SME Unit customers” from
“disaster prefectures” or “other than disaster
prefectures” “with direct damage” or “with
indirect damage” (Table 4).
Since the number of loans differs in
every category, there were large differences
among the sub-samples in the extraction rate and
in the return rate to the population. Hence, we
display the result by the weighted average,
estimating the number of answers in the
sub-sample by the return rate and the population
size in the category.
For reference, among the SMEs to
which JFC extended special loans, the number of
15 As upper limit of loan amount of SME Unit is larger
than that of Micro and Individual Unit, the average size of
the companies of the former unit is larger than that of the
latter unit. Thus, as the attribute of SMEs in each unit
may be different, we divide them into the other
sub-samples. 16 Of course, also many of SMEs in “other than disaster
prefectures” suffer from the direct or indirect damages of
the earthquake. 17 The sort of the disaster was defined according to what
damage recovery the JFC loans were made for. Hence,
“with direct damage” SMEs might suffer direct damage,
and vice versa. Here, if the SME used the loan for the both
kinds of damage recovery, we categorized them as “with
direct damage” SMEs.
“with direct damage” SMEs was 13,127 in
“disaster prefectures” and 2,825 in “other than
disaster prefectures.” The former accounted for
over 80%. On the other hand, the number of “with
indirect damage” SMEs was 6,423 in “disaster
prefectures” and 123,683 in “other than disaster
prefectures.” These data show that there were
areas where the damage from the earthquake
was comparatively serious in “other than disaster
prefectures” such as Chiba Prefecture and that
the influence of the earthquake disaster,
especially indirect damage, pervaded across the
country. 18 In the results, 86.6% of the population
of SMEs was in “other than disaster prefectures.”
Therefore, the economic effect estimated in this
paper, which we show later, was larger in “other
than disaster prefectures” than in “disaster
prefectures.”
The attributes of respondent companies
are shown in Figure 1. The size of the companies
by the number of workers (employees and one
entrepreneur) is as follows: “1 - 4 persons”
accounts for 29.7%, “5 - 9 persons” 29.9%, and “10
- 19 persons” 20.4%. In total, small companies
with 19 or fewer persons account for 80%. The
average number of workers is 17.8 persons. As for
the type of industry, “manufacturing” accounts for
18.9%, “construction” 18.5%, “service” 15.9%, and
so on.
In addition, in order to supplement the
questionnaire, we carried out direct interviews
from August 2012 to October 2012 with SMEs
18 Since companies’ locations were defined according to the
address of the headquarters, companies were classified as
being in “other than disaster prefectures” when a branch
office in the “disaster prefectures” suffered damage and the
headquarters was in “other than disaster prefectures.”

7
damaged by the earthquake, including SMEs
that replied to the questionnaire. We visited 25
SMEs in Miyagi Prefecture (Sendai City,
Shiogama City, and Ishinomaki City) and
Fukushima Prefecture (Fukushima City and
Koriyama City), which we categorized as
“disaster prefectures,” and in Yamagata
Prefecture (Yamagata City, Sakata City, and
Tsuruoka City) which we categorized as “other
than disaster prefectures” but which nonetheless
appeared to have suffered considerable damage.
We will introduce some of the comments from
them later.
5 Methodology of the Measurement
5.1 Concept for Measurement
The basic technique used in this paper
to measure the economic effect of the special
earthquake recovery loans from JFC is based on
Fukanuma and Inoue (2007). As measures of
evaluation, we used employment, sales, and value
added, which were enabled by the loan. The
concept for measurement is shown in Figure 2.
Because of the earthquake, the
performance of the companies (employment, sales,
and value added) declined from point A, defined
as the level expected prior to the earthquake, to
point B. Although some companies may have
experienced improvement in their performance
due to damage to their rivals or additional
demand for products following the earthquake,
we do not take into consideration such situations
here. However, in reality, using JFC special loans,
the companies’ performance recovered to point C.
Hence, “C - B” was assumed to be the effect of the
JFC loan.
Thus, the data at point C were real data.
On the other hand, the data at point A and point
B were imaged. In the questionnaire, SMEs were
asked to answer questions assuming that “the
company could not procure special earthquake
recovery loans from JFC.” 19
Estimation was made by dividing
companies in two groups: “SMEs that might have
stopped operations without JFC loans” and
“SMEs that might have continue operations but
at a lower performance level without JFC loans.”
The concepts for calculation of employment, sales,
and value added are shown in Figure 3.
First, as for employment, we add the
number of workers at SMEs that stopped
operation and the amount of employment
reduction at SMEs continuing operation.
Similarly for sales, we add the sales of SMEs that
stopped operation and the sales reduction of
SMEs continuing operation; For value added, we
summed the value added of SMEs that stopped
operation and the reduction in value added of
SMEs continuing operation.
5.2 Formula
The formulas are as follow. Details are
shown on Table 5. For calculation, we first
19 Theoretically, if we were to evaluate the effect in a
statistically precise manner, we could, for example, have
divided the areas with a similar level of damage into two,
one where we made public support available and one
where we did not make public support available, and could
have observed the subsequent differences in these two
groups’ recovery situations. However, of course, such a
method could not be executed in reality.

8
calculate the average data for each of 8
sub-samples, then sum up considering the
population of each classification. In other words,
actual calculation of Σ in the formula shown
below is finished by totaling not the addition of
the data of each SME but the estimation values of
eight populations.
5.2.1 Retained Employment
The definition of retained employment is
as stated in (i). All data is from the
questionnaire.20
Retained Employment
= Σ(Employment real – Employment imagined )
= Σ(Employment of SMEs stopping operation real)
+ Σ(Employment of SMEs reducing employment real
– Employment of SMEs reducing employment imagined)
・・・(i)
5.2.2 Retained Sales
The definition of retained employment is
as stated in (ii) and is based on the same concept
as retained employment. Here, as well, all data is
20 The data is from the FY2011 yearend (the end of March
2012). The “Real” employment is the sum of “the number
of executives and full-time employees (except
entrepreneur/CEO)” and “the number of part timers,” both
from the questionnaire, and “1 (entrepreneur/CEO).” The
“assumed” number of employees of continuing operations
but reduced employees was calculated from the real
number of the employees and the reduction of “the number
of executives and full-time employees (except
entrepreneur/CEO)” and “the number of part timers,”
when JFC had not made loans were calculated from the
data from the questionnaire. Also, the “assumed” number
of employees of SMEs that stopped operations is defined as
zero.
from the questionnaire.21
Retained Sales
= Σ (Sales real – Sales imagined)
= Σ (Sales of SMEs stopping operation real)
+ Σ (Sales of SMEs reduced sales real
– Sales of SMEs reduced sales imagined)
・・・(ii)
5.2.3 Retained Value Added
The definition of retained value added is
as stated in (iii) and is based on the same concept
as (i) and (ii).22
However, here, because of the
limitations of the data from the questionnaire, we
used the average value of the customer database
of JFC for the net profit before tax, the
depreciation expense, and the personnel expenses
of the SMEs that stopped operations.
Moreover, for the calculation of SMEs
which continue operations but decrease their
value added, we directly asked not the level of
profit but the amount of decrease of profit (or
increase of loss) on the questionnaire.
Also, we did not take the change in
depreciation into account because the question
would be much too complicated to answer on the
paper questionnaire. We used the JFC database
average for personnel expenses as well. Lastly, we
21 Data was from FY2011 (April 2011 – March 2012).
“Real” sales data was directly asked on the questionnaire
(unit: 10 thousand yen). “Supposed” sales of the continuing
operation but reducing sales SMEs was calculated with
the sales and the percentage of the reduction of the sales
when JFC loan did not exist. Sales of the stopped
operation SMEs were supposed to be zero. 22 Data was based on those of the fiscal year 2011 (April
2011 – March 2012).

9
did not consider the personnel expense reductions
without reductions in employment (e.g., salary
cuts for executives or employees).
Retained Value Added
= Σ(Value Added real – Value Added imagined )
= Σ(Value Added of SMEs stopping operation real )
+ Σ(Value Added of SMEs reducing value added real
– Value Added of SMEs reducing value added imagined)
・・・(iii)
5.3 Assumptions for Calculation
For calculation purposes, we set the
following assumptions.
5.3.1 Term of Calculation (time period)
Here, we assumed that the influence of
the earthquake continued for one year and
calculated the effect of the JFC loans during that
time. Calculation of employment was based on
the point in time about one year after the
earthquake (the end of March 2012). Data on
Sales and Value Added were collected for one year
after the earthquake (from April 2011 to March
2012). In addition, personnel expenses are
calculated as of the end of March 2012. A business
that has stopped operation is defined as one that
has not actively conducted business during the
above-mentioned period.
5.3.2 Substitution of Production and Employment
We assumed that other companies
would not substitute production (or create sales or
value added) even if SMEs stopped operation or
decreased production.23 Also, we supposed that
workers who lost their jobs would not work for
other companies.
5.3.3. Ripple Effect
We assumed that there was no ripple
effect on other companies from stopping operation
or decreasing production.
5.3.4 Data
As already explained, because of the
limitations of the data, we utilized the JFC
database instead of the questionnaire answers for
several calculations; however, we supposed that
there was no compatibility problem with the data.
Also, for calculations involving SMEs
which continued operation but decreased their
value added, we assumed that there was no
change in depreciation expense and that there
was no personnel expense reduction without
reduction in employment. Furthermore, we
assumed that the sample reflected the population
correctly and that the answers to the questions
including the data for the “supposed situations”
were correct.
6 Results
According to the questionnaire, 27.8% of
23 Substitutions by the SMEs which answered the
questionnaire were taken into account because the “Real”
data collected by the questionnaire include the increased
sales or values added by the substitution of SMEs’ other
damaged production.

10
SMEs replied they would have “stopped
operations,” 12.0% replied they would have
“decreased employees,” 28.2% replied they would
have “decreased sales,” and 26.8% replied they
would have “decreased profit” if JFC had not
extended the special earthquake recovery loans to
them.24
Figure 4 displays the result of the
calculation of the effect of the special earthquake
recovery loans by JFC in combination with other
questionnaire data.
We estimate an employment retention
effect amounting to 107,349 persons in the
“disaster prefectures,” 494,538 persons in “other
than disaster prefectures,” and 601,887 persons.
Comparing these numbers with the data on
estimated employed persons from the Statistic
Bureau’s “Labor Force Survey (FY2011),” the
employment retention effect of JFC loans
amounted to 2.2% of the employment in the
“disaster prefectures,” 0.9% in “other than
disaster prefectures,” and 1.0% in total.
The sales retention effect was calculated
as 1,205,500 million yen in the “disaster
prefectures,” 6,1548,00 million yen in “other than
disaster prefectures,” and 7,360,300 million yen
in total. If we compare this with the production
data in “Prefectural Accounts (FY2009)” from the
Cabinet Office, the effect amounts to 2.1% of
production in the “disaster prefectures,” 0.8% in
“other than disaster prefectures,” and 0.9% in
total.
24 The weighted average of the data was used. Multiple
answers were possible for “decreased employees,”
“decreased sales,” and “decreased profit,” thus some SMEs
selected two or three of these options. Moreover, 34.3% of
SMEs did not select any of them.
Lastly, we estimated that the value
added retention effect of the loans was 267,900
million yen in the “disaster prefectures,”
1,443,200 million yen in “other than disaster
prefectures,” and 1,711,100 million yen in total.
Also comparing the value added data of the
Cabinet Office’s “Prefectural Accounts (FY2009),”
the share of the value added retention effect
against the entire value added was 0.9% of
production in the “disaster prefectures,” 0.3% in
“other than disaster prefectures,” and 0.4% in
total.
The reason why the percentages of the
value added retention effect were small compared
with those of employment or sales was
supposedly because SMEs’ average salary and
value added rate are lower than large companies
in general.
In addition, as described already, over
80% of the effect occurred at SMEs in “other than
disaster prefectures,” since 86.6% of the
population was in those prefectures.
It would be difficult to evaluate the
numbers themselves; however, we will compare
them with other JFC data already published. For
example, JFC (2012a) estimated that the job
creation effect of its business start-up loans is
64,213 jobs per year.25 The employment retention
effect of 601,887 persons obtained in this paper
is approximately nine times that figure.
Moreover, Fukanuma and Inoue (2007)
estimated that an employment retention effect of
1,200,000 people and a value added retention
25 FY2011 data from the Micro and Individual Unit
(16,465 companies × average number of workers (3.9
persons)).

11
effect of 3,194,700 million yen was provided by
the NLFC loans for 1,330,000 26 companies, or
all the customers of NLFC. The earthquake
recovery loans accounted for about half of the
effect, although we calculated the effect using
146,000 SMEs, which is only about 10% of the
1,330,000 companies in the survey above.
7 Contributions and Biases of the Estimation
The estimation in this paper was done
utilizing data collected directly from SMEs which
were damaged by the earthquake through a
questionnaire distributed approximately one year
and three months after the disaster, when
memories of those days were still clear. Also, the
sample size is adequate for analysis, and we
made the database more precise by importing
data which are difficult to obtain by questionnaire
from the JFC customer database.
We can say that this paper made a
certain contribution as research that verifies the
positive effect of public finance because it
calculated numerical values for the special
earthquake recovery loans in terms of the three
scales of employment, sales, and value added,
using the data described above.
On the other hand, since our
estimations were made under several
assumptions, it is necessary to examine the
numbers with a certain amount of leeway. Below,
we list the biases of the estimation which should
be considered.
26 Data as of the end of March 2006. Loans outstanding
amounted to 7,843,900 million yen.
7.1 Validity of the Term of the Calculation
We calculated the one-year effect of the
disaster and JFC loans in this estimation.
However, for example, among those SMEs that
answered that they would have stopped operation,
some might have abandoned the business
completely and some might have restarted
operation after six months. The estimated value
would be larger if companies stopped business
operation more than one year and smaller if less
than one year. Thus, depending on the situation,
there is a possibility of a bias in either a positive
or negative direction to be considered.
7.2 Substitution of Production and Sales by Other
Companies
Because the supply chains suffered huge
damage from the earthquake, many companies
tried to find substitutes for products formerly
produced by companies that stopped production
by procuring them from other suppliers or
producing them within the company itself.
The Ministry of Economy, Trade, and
Industry (2011) reported that, one month after
the earthquake, 65% of material manufacturing
industry companies and 76% of processing
manufacturing industry companies were finding
substitute suppliers of raw materials, parts, or
components, which they had difficulty procuring
just after the earthquake.27
27 Survey conducted during April 8 to 15, 2011.
Respondents consisted of 55 manufacturing companies
and 25 retail and service companies. The size of the
companies was not indicated; however, they seem to have
been large companies considering the contents of the

12
Through direct interviews with SMEs,
we gathered many comments about substitution,
such as “because some other laundries stopped
operation, we got new customers (Miyagi
Prefecture, Laundry Business, 3 Workers)”, and
“the company owner who decided to give up the
business and retire because of the tsunami
disaster asked me to provide the necessary
commodities to his former customers (Miyagi
Prefecture, Food Wholesaler, 25 workers).”28
Increases in sales or value added of
SMEs that responded to the questionnaire were
taken into account; however, substitutions by the
other companies were not taken into account.
Hence, if the substitutions were made smoothly,
the macroeconomic effect might be smaller than
indicated by the estimation in this paper.
7.3 Workers’ Reentry to Other Companies
Even if employees or entrepreneurs
themselves lost their jobs because of the stopped
operation or restructuring of SMEs, when they
could get jobs at other companies, additional
value added was created in the form of their new
salary (personnel expenses).29 In this case, the
effect of the special loan from JFC is less than
estimated.
However, in reality, it seems that it was
difficult to find new jobs immediately, especially
report. 28 However, their sales did not always exceed those before
the earthquake. 29 Fukanuma and Inoue (2007) used the data on the
average time period before reentry from the Ministry of
Health, Labor and Welfare “Survey on Employment
Trends.” The average was 2.3 to 4.1 months depending on
age and gender.
in the area heavily damaged by the earthquake.
They might be jobless for an extended period of
time, or some people, especially older workers,
might give up finding new jobs.30
7.4 Ripple Effect
In the estimation in this paper, we did
not sum up the ripple effect on other companies of
stopped operation or decreasing production. If a
ripple effect existed, the amount of the effect
would be added on the effect of JFC loans
estimated herein. 31 However, Fukanuma and
Inoue (2007) calculated that the value added
retention effect on other companies due to the
stopped operation of SMEs would be about 10% of
the total value added retention effect without the
ripple effect.32 Thus, the ripple effect does not
seem to change the estimated values significantly.
7.5 Reliability of the Answers for an Assumed
Situation
In the questionnaire, we asked SMEs to
reply assuming “a situation in which JFC had not
made the special earthquake recovery loans to
your company,” and 27.8% of SMEs replied that
they would have stopped their operations.
In fact, through the direct interviews
with SMEs, we gathered many comments about
30 We did not ask ages of employees on the questionnaire.
The average age of the entrepreneur/CEO was 57.6 years,
and 47.6% of all were age 60 or older. 31 Yamori (2010) commented on the existence of the ripple
effect although he did not calculate it. 32 It estimated that the ripple effect was 279,500 million
yen and was 12.6% of the value added retention effect of
2,210,100 million yen.

13
substitution, such as “I rented a new shop and
bought furniture and commodities with the
special loan. If there had been no loan, I could not
have restarted the business at that time (Miyagi
Prefecture, Sporting Goods Retailer, 3 workers).”
However, of course, the responses were
in reply to an assumed situation. Because the
sample SMEs were customers of JFC and the
JFC Research Institute conducted this survey,
they might have an incentive to evaluate the
effect of the loan more positively. Hence, it is
possible that the effect might be overestimate.
For reference, examining similar
research, the probability that operations would
have stopped without the loans (or guarantees)
was as follows. In Fukanuma and Inoue (2007),
6.2% of NLFC customers replied that operations
would have stopped, and in Yamori (2010), 18.4%
of SMEs replied that they used the special
guarantees following the Lehman Shock.33 The
number produced by this paper is larger than
those figures.
7.6 Imperfectness of the Data
Since the survey was sent to SMEs that
were damaged in some way by the earthquake,
we constructed a questionnaire that was as short
as possible. Hence, we did not procure data such
as “profiles of employees (age, gender, etc.),” or
“expected change in the period of stopped
operation,” “probability of substitution,” and
“change in depreciation” when they could not
33 The data was for SMEs with fewer than five workers.
It was 12.0% for all SMEs. Moreover, for SMEs fewer than
five workers that used usual, or not special, guarantees,
the percentage was 14.9%, and for all SMEs was 7.3%.
have received JFC loans.
Therefore, we omitted some part of the
calculations because of the shortage of data, but
on the other hand, we imported some data from
the JFC database to raise the accuracy.
Of course, we could make more precise
estimation if we procured more detailed data by,
for example, directly interviewing every SME.
However, considering the cost and time of the
survey both for the sample SMEs and us, the
dataset for this paper may be considered to be
suitable.
7.7 Deviation of Population and Respondent
Companies
Looking at the difference in the response
rate by the company attributes, there is a
possibility that the data, such as the average
value, etc., deviated slightly from the population.
For example, as the larger companies tend to
reply more than the smaller ones, the average
size of the respondent companies was larger than
the average of the population. Hence, the effect
could be slightly overestimated.
In order to reduce such bias, we could
have divided the categories into more than eight,
for example by the size of the companies.
However, because the smallest category had only
40 respondent SMEs, the errors may have been
magnified if we further divided them. For those
reasons, we utilized the original eight
sub-samples for calculation purposes.
7.8 Possibility of Alternative Financing

14
On the questionnaire, we asked about
the hypothetical situation in which special loans
from JFC did not exist. Even in such a situation,
the lack of JFC loans would have been smaller if
companies could have received loans from other
finance institutions.
In fact, SMEs replied that, of the
additional money that they needed due to the
earthquake, 55.2% was procured from JFC,
31.6% from private finance institutions, and 6.2%
from public institutions other than JFC, etc. Thus,
we observe that they used financial resources
other than JFC loans.
Moreover, 14.9% of SMEs replied that
they “could procure the same amount of
financing” even if they could not obtain JFC loans.
However, from direct interviews, we observed
several cases in which SMEs chose JFC loans
when where they could not foresee the future,
such as “in March and April, tourists decreased
sharply and the company cash decreased as well.
Although the (regional) bank credit line remained,
as we did not know when sales would recover, we
obtained JFC loans to maintain the the bank
credit lines. Subsequently, sales recovered, and
we could have survived with only bank loans.
However, we believe that it was the best
managerial choice to ask JFC to make the special
loan at that time (Yamagata Prefecture,
Restaurant, 28 Workers).”
7.9 Comparison with Other Support Schemes
Although we do not refer to them in this
paper, there are many potential means to support
SMEs damaged by disasters, not only loans, but
also credit guarantees and subsidies. It will be
necessary to make ex-post assessments of the
schemes in order to realize effective
reconstruction and recovery from disasters with a
limited budget.
For reference, only 1.6% of respondent
SMEs in the entire sample procured a subsidy.
However, this includes 10.3% of the SMEs “with
direct damage” in “disaster prefectures,” which is
larger than in other categories. On the other hand,
the figure was 0.5% for SMEs “with indirect
damage” even in “disaster prefectures.”34
7.10 Continuing Special Earthquake Recovery
Loans
For more than a few SMEs damaged by
the earthquake, the damage due to the disaster is
still continuing. There are companies that have
just managed to restart their business operations.
Now, JFC still continues to provide its special
loans although the amount and the number of
loans has decreased in recent years.
The estimation covers the special loans
until March 2012; however, JFC has continued to
make special loans after April 2012. The loan
amount from April 2012 to March 2013 was
767,200 million yen, which was 28.8% of the
amount until March 2012. Thus, the effect by the
34 In the sample, some of the SMEs categorized as “with
indirect damage” suffered direct damage. If subsidies were
mainly paid for recovery from direct damage, the portion of
the subsidies which supported recovery from indirect
damages might have been much smaller.
15
JFC loans after the estimation period could be
added, as well.
8 Conclusion
In this paper, we attempted to measure
the effect of the earthquake recovery loans
extended to SMEs by Japan Finance Corporation.
As a result, we produced certain numbers
concerning the employment retention effect, the
sales retention effect, and the value added
retention effect.
As described, although it cannot be
denied that the estimated values contain biases
due to the limitations of the questionnaire and
the estimation methodology, we believe that we
employed the best possible methodology
considering the conditions at the time. We
understand that the calculated numbers may
contain both positive and negative biases.
However, it can be agreed that there were certain
economic effects.
Nonetheless, in order to fully evaluate
the validity of a policy like the government
earthquake recovery loans that we analyzed in
this paper, we probably should consider not only
the positive economic effect or benefit but also the
cost incurred by the government to execute the
policy.
The issue of how the total cost should be
integrated also arises. For instance, if we assume
a cost of 486,900 million yen, which was the
amount of the FY2011 supplementary budget
that JFC (through its Loan Sub Unit of the SME
Unit, and the Micro and Individual Unit) received
mainly for the purpose of earthquake disaster
countermeasures, then the value added retention
effect we calculate exceeds the cost.35
Detailed data is still lacking on
companies and areas that suffered significant
damage from the earthquake. It is our hope that
future research will focus on the effects of the
earthquake disaster, the tools for restoration and
recovery from it, and so on, by utilizing
government statistics or other questionnaire
data.
We would like to thank Professor Masao
Nakata of Seijo University, who provided
abundant beneficial advice on the plan and
execution of the survey and the preparation of
this paper. Also, Professor Tadanobu Nemoto of
Chuo University, Professor Wako Watanabe of
Keio University, and Associate Professor Satoshi
Miwa of Tohoku University kindly provided us
with assistance on methodological matters.
Moreover, at the Informal Research Meeting on
Financial Intermediation hosted by the JFC
Research Institute and Hitotsubashi University
on March 21, 2013, we received many comments
from an economic perspective from participants
including Professor Gregory Udell of Indiana
University, Professor Alberto Zazzaro of Marche
Institute of Technology, Dr. Arito Ono, Senior
Economist at Mizuho Research Institute, and Dr.
Daisuke Miyakawa, Associate Senior Economist
at Research Institute of Capital Formation,
35 The cost is the total amount of the first through fourth
Supplementary Budget for Fiscal Year 2011. For details,
refer to Japan Finance Corporation (2012b) and Ministry
of Finance (2012a).

16
Development Bank of Japan. We hereby thank
these academicians and economists for their kind
and sincere assistance.
17
【References】
Note: Materials denoted with titles in Japanese are written in Japanese. Official English titles are also given if they exist; for
materials with no official English title, the author provides a tentative translation.
Cabinet Office. 2011. [Local economies 2011 – Recovery from the earthquake and rehabilitation of local areas] 地域の
経済2011-震災からの復興、地域の再生.
Cabinet Secretariat (National Policy Unit). 2011. [Cost analysis committee report] コスト等検証委員会報告書 (Dec.
19, 2011).
Fukanuma, Hikaru, and Koji Inoue. 2007. [Evaluation of the positive effect of loans from National Life Finance
Corporation – Preliminary calculations using questionnaire data and government statistics] 国民生活金融公庫融
資の効果測定 ―公庫調査と官公庁統計をもとにした試算―. [Quarterly Research Report] 調査季報 81 (May 2007):
1-15 (National Life Finance Corporation Research Institute).
Fukanuma, Hikaru , Tadanobu Nemoto, and Wako Watanabe. 2008. “Do Governmental Financial Institutions Help
Startups Grow More than Private Lenders?” [Quarterly Research Report]日本政策金融公庫論集 1 (Nov. 2008):
69-100 (Japan Finance Corporation Research Institute).
Fukuda, Shinichi, Hiroshi Teruyama, Akihiro Kamiya, and Cong Ji. 1995. [The cowbell effects of government credit
policy in Japanese manufacturing industries] 製造業における政策金融の誘導効果―情報生産機能からのアプロー
チ―. [Economic Analysis] 経済分析 140: 1-55 (Economic Research Institute, Economic Planning Agency).
Higano, Mikiya. 1984. [Syndicate loan and financing examination ability – The case of the Development Bank of
Japan]『協調』融資と審査能力―日本開発銀行のケース. [Economic Research] 経済学論集 50-1: 70-82 (Society of
Economy, University of Tokyo).
Hosono, Kaoru, Daisuke Miyakawa, Taisuke Uchino, Makoto Hazama, Arito Ono, Hirofumi Uchida, and Iichiro
Uesugi. 2012. “Natural Disasters, Damage to Banks, and Firm Investment.” RIETI Discussion Paper Series
12-E-062.
Iwamoto, Yasushi. 2004. [Social benefit of government financial institutions] 公的金融機関の社会的便益. Japan
Bankers Association.
Japan Finance Corporation. 2012a. Annual Report 2012.
Japan Finance Corporation. 2012b. [Securities report] 株式会社日本政策金融公庫有価証券報告書.
Japan Finance Corporation for Small and Medium Enterprises. 2003. [Annual report 2003] 中小企業金融公庫 ディ
スクロージャー誌 2003.
Ministry of Economy, Trade and Industry. 2011. [Urgent survey on the industries after the Great East Japan
Earthquake] 東日本大震災後の産業実態緊急調査 (Apr. 26, 2011).
Ministry of Finance. 2006. [Policy cost analysis of institutions procuring funds from fiscal investment and loan
programs] 財政投融資対象事業に関する政策コスト分析 (平成 18年度).

18
Ministry of Finance. 2012a. [The Fourth Supplementary Budget of FY2011] 平成 23年度一般会計補正予算(第 4号).
Ministry of Finance. 2012b. “FILP Report 2012 Appendix.”
National Life Finance Corporation. 2006. [Policy evaluation report FY2005] 国民生活金融公庫 平成 17年度政策実施
報告書.
Ookusa, Yasushi. 2002. [The credit crunch and the effect of the pubic intervention on it] 貸し渋りとその公的対策の効
果. In [Economic analysis of micro businesses] マイクロビジネスの経済分析. Edited by Naoki Mitani and Akira
Wakisaka, 161-178. University of Tokyo Press.
Okinawa Development Finance Corporation. 2011. [News release on the Great East Japan Earthquake special
recovery loans for SMEs] 中小・小規模企業向け『東日本大震災復興特別貸付』の創設等について (May 23, 2011).
Takezawa, Yasuko, Katusmi Matsuura, and Masahiro Hori. 2005. [Facilitation of fund supply and small business
failures] 中小企業金融円滑化策と倒産・代位弁済の相互関係 ―2変量固定効果モデルによる都道府県別パネル分析
―. [Economic Analysis] 経済分析 176: 4-17 (Economic and Social Research Institute).
Uesugi, Iichiro. 2008. [Did the special credit guarantees have an effect?] 政府による特別信用保証には効果があったの
か?. In [Verification: SME Finance] 検証中小企業金融 –『根拠なき通説』の実証研究–. Edited by Tsutomu
Watanabe and Iichiro Uesugi, 169-202. Nikkei Publishing.
Uesugi, Iichiro, Koji Sakai, and Guy M. Yamashiro. 2010. “The Effectiveness of Public Credit Guarantees in the
Japanese Loan Market.” Journal of the Japanese and International Economies 24: 457-480.
Yamori, Nobuyoshi. 2010. [The role of the credit guarantee system in the world financial crisis – Analysis of the
questionnaire issued by the Aichi Credit Guarantee Corporation] グローバル金融危機下の信用保証制度の役割 ―
愛知県信用保証協会アンケートの分析. In [Local SMEs and the credit guarantee system – Road to recovery in
Aichi Prefecture following the Lehman Crisis] 地域の中小企業と信用保証制度 ―金融危機からの愛知経済復活への
道. Edited by Nobuyoshi Yamori, 133-157. Chuo-Keizaisha.

Table 1 The Great East Japan Earthquake Recovery Special Loans from JFC
Maximum of 720 million yen Equipment loan:Maximum 15 years, grace period upto 3 years(maximum of 20 years for separateloan amount, grace period up to 5years)
Reduction of up to 0.5%from the standard rate
(plus a separate loanlimit of 300 million yen)
Working Capital Loan:Maximum 8 years, grace period upto 3 years (maximumof 15 years for separate loanamount, grace period up to 5years)
(reduction by 1.4% fromthe standard rate for amaximum of 100 millionyen for the first 3years)
Loan Amount Interest rateLoan period
Source: JFC Website
Target
Note: Loan conditions differ depending on the extent of the damage. Application of an expansion measure may require submissionof a Disaster Certificate or other documents.
(including SMEs within thecaution zone, plannedevacuation zone, andemergency evacuationpreparation zone of thenuclear power accident, andthose damaged by harmfulrumors.)
SMEs that suffered direct orindirect damage
19

Table 2 JFC Earthquake Recovery Loans for SMEs
Source: The author.
Note: 1 The upper figure is the number of loans, and the lower figure is the amount of the loans (Unit: 100 million yen).
of SMEs, because some customers procured two or more loans.
18,236 3,650
12,240 2,950
2 The number of loans are not equal to the number
Term
Micro andIndividual
Unit
SME Unit
Total
From Mar. 11, 2011,to Mar. 31, 2012
From Apr. 1, 2012,to Mar. 31, 2013
145,361
14,432
163,597 51,611
26,672 7,672
47,961
4,721
20

Table 3 Methodology of the "Questionnaire concerning the Effect of the Great East JapanEarthquake on SMEs"
Date
Sample
Method
Responses
June 2012
SMEs that procured Earthquake Recovery Loans from JFCduring Mar. 11, 2011, to Mar. 31, 2012.
Questionnaires were sent and returned by mail
3,207 (Response rate: 22.9%)
21

Table 4 Sample and Population
Upper figure: Number of SMEs in the population.
Middle figure: Number of SMEs that were sent the Questionnaire. Figure in ( ) is
the sampling fraction.
Lower figure: Number of respondents. Figure in ( ) is the sampling fraction against
the population. Figure in [ ] is the response rate.
Source: The author.
Notes: 1 The data does not represent the number of loans but the number of SMEs. Hence, it differs
from that on Table 2.
2 We extracted SMEs to send questionnaires to each sub-sample. The results are calculated
with weights according to the population data estimated using the sample fraction
against the population.
3 "Disaster Prefectures" are the prefectures of Aomori, Iwate, Miyagi, Fukushima, and Ibaraki.
"Other than Disaster Prefectures" include all other prefectures. Okinawa Prefecture
is not included in the sample.
4 "Direct damage" and "Indirect Damage" refer to the type of damage to which the JFC loan
was applied. When companies used the loan for both types of damage, they were categorized
as SMEs with direct damage.
Micro and Individual Unit SME Unit Total
DisasterPrefectures
Other thanDisaster
Prefectures
DisasterPrefectures
Other thanDisaster
Prefectures
DisasterPrefectures
Other thanDisaster
Prefectures
WithDirectDamage
12,166 2,372 961
587 (4.8%) [19.6%] 230 (9.7%)[11.5%] 151 (15.7%)[38.5%]
453 13,127 2,825
3,000 (24.7%) 2,000 (84.3%) 392 (40.8%) 204 (45.0%) 3,392 (25.8%) 2,204 (78.0%)
76 (16.8%)[37.3%] 738 (5.6%)[21.8%] 306 (10.8%)[13.9%]
WithIndirectDamage
6,161 115,052 262 8,631 6,423 123,683
1,561 (1.3%)[24.8%]
2,000 (32.5%) 3,000 (2.6%) 98 (37.4%) 3,306 (38.3%) 2,098 (32.7%) 6,306 (5.1%)
562 (9.1%)[28.1%] 654 (0.6%)[21.8%] 40 (15.3%)[40.8%] 907 (10.5%)[27.4%] 602 (9.4%)[28.7%]
Total
135,751 10,307 146,058
10,000 (7.4%) 4,000 (38.8%) 14,000 (9.6%)
2,033 (1.5%) [20.3%] 1,174 (11.4%) [29.4%] 3,207 (2.2%) [22.9%]
22

Figure 1 Attributes of Respondent SMEs
Source: Japan Finance Corporation Research Institute's "Questionnaire concerning the Effect of the Great East Japan
Earthquake on SMEs" (June 2012)
Note: Workers include employees and the entrepreneur/CEO.
1~4
29.7
5~9
29.9
10~19
20.4
20~49
13.4
50 or
more
(Unit: %)
Manufactur-
ing 18.9
Construction
18.5
Service
15.9
Retail 14.4
Wholesale
11.1
Restaurant,
Hotel 7.3
Transporta-
tion 3.5
Barber,
Hair-
dressing,
Laundry 1.9
Medical,
Healthcare,
Welfare
1.8
Real Estate
Rental 1.4
Others
5.4
(Unit: %)
Average:17.8 persons
Size (number of workers) Type of Industry
23

Figure 2 Concept of Measurement
Source: The author.
Effect of the
Earthquake
【 C: Current Situation (Real)】
【 A: Expected Situation before the Earthquake 】
【 B: Expected Current Situation without JFC Loans
Effect of JFC Loans (Effect on SMEs without JFC loans)
Employment Retention Effect : Lost employment without JFC loans
Sales Retention Effect :Lost sales without JFC loans
24

Figure 3 Concept of Calculation
Source: The author.Notes: 1 Calculations are based on the assumption that the effect of the earthquake continued for one year. 2 It is assumed that there is no substitutional production by the other companies, and no workers find employment at other compaines. 3 The assumptions below are made when calculating the value added of the SMEs continuing operation. ① No change in depreciation (the amount of reduction is "0"). ② Reduction of salary is the amount of the salaries of employees who were reducted. There was no change in the salary of the employees who were not reducted.
Employment (Employees
and Entrepreneur/CEO)
of the SMEs that
stopped operation
Employment reduction of
the SMEs continuing
operation (but with
reduced employment)
Lost Employment
( = Employment
Retention Effect)
Sales of the SMEs that
stopped operation
Sales reduction of
the SMEs continuing
operation (but with
reduced sales)
Value added reduction of
of the SMEs continuing
operation (but with
reduced value added)
Vale added of the SMEs
that stopped operation
Lost Sales
( = Sales Retention
Effect)
Net
Profit Salary
Deprecia-
tion
Reduction
of net
profit
Reduction of
depreciation,
see note3①
Reduction of
salary,
see note 3②
Lost Value Added
( = Value Added
Retention Effect)
25

26
Table 5 Formula
① Retained Employment
Retained Employment = Σ(Employment real – Employment imagined )
= Σ(Employment of SMEs stopping operation real )+Σ(Employment of SMEs reducing employment real
–Employment of SMEs reducing employment imagined ) ・・・(i)
where
Σ(Employment of SMEs stopping employment real )
= Σ{( number of SMEs in the Population×percentage of SMEs stopping operation)
×Average(number of employees of SMEs stopping operation real ) } ・・・(ia)
Σ(Employment of SMEs with reduced employment real –Employment of SMEs with reduced employment imagined )
= Σ{( number of SMEs in the Population ×percentage of SMEs reducing employment)
×Average (number of employees of SMEs reducing employment real
– number of employees of SMEs reducing employment imaged) }・・・(ib)
Here, employment / employees is the total number of hired employees plus the entrepreneur/CEO.
② Retained Sales
Retained Sales = Σ(Sales real – Sales imagined )
= Σ(Sales of SMEs stopping operation real) + Σ(Sales of SMEs with reduced sales real
– Sales of SMEs with reduced sales imagined) ・・・(ii)
where
Σ(Sales of SMEs stopping operation real )
= Σ{( number of SMEs in the Population×percentage of SMEs stopping operation)
×Average (Sales of SMEs stopping operation real ) } ・・・(iia)
Σ(Sales of SMEs reducing sales real – Sales of SMEs reducing sales imagined )
= Σ{( number of SMEs in the Population×percentage of SMEs reducing sales)
×{Average (Sales of SMEs reducing sales real – Sales of SMEs reducing sales imagined )}
=Σ{( number of SMEs in the Population×percentage of SMEs reducing sales)
×Average (Sales of SMEs reducing sales real×Average percentage of sales reduction imagined )} ・・・(iib)
③ Retained Value Added
Retained Value Added = Σ(Value Added real – Value Added imagined )
= Σ(Value Added of SMEs stopping operation real )
+ Σ(Value Added of SMEs reducing value added real – Value Added of SMEs reducing value added imagined ) ・・・(iii)
where
Σ(Value Added of SMEs stopping operation real )
= Σ(Revenue of SMEs stopping operation real ) +Σ(Depreciation of SMEs stopping operation real )
+ Σ(Total Salary of SMEs stopping operation real )
= Σ[(number of SMEs in the Population×percentage of SMEs stopping operation)
×{Average (Revenue of SMEs stopping operation real ) +Average (Depreciation of SMEs stopping operation real )
+ Average (Total Salary of SMEs stopping operation real ) }] ・・・(iiia)
Σ(Value Added of SMEs reducing value added real –Value Added of SMEs reducing value added imagined )
=Σ(Revenue of SMEs reducing value added real – Revenue of SMEs reducing value added imagined )
+Σ(Depreciation of SMEs reducing value added real – Depreciation of SMEs reducing value added imagined )
+Σ(Total Salary of SMEs reducing value added real – Total Salary of SMEs reducing value added imagined )}
=Σ[(number of SMEs in the Population×percentage of SMEs reducing value added)
×{Average (Revenue of SMEs reducing value added real – Revenue of SMEs reducing value added imagined )
+Average (Depreciation of SMEs reducing value added real – Depreciation of SMEs reducing value added imagined)
+Average (Total Salary of SMEs reducing value added real – Total Salary of SMEs reducing value added imagined )}] ・・・(iiib)
27
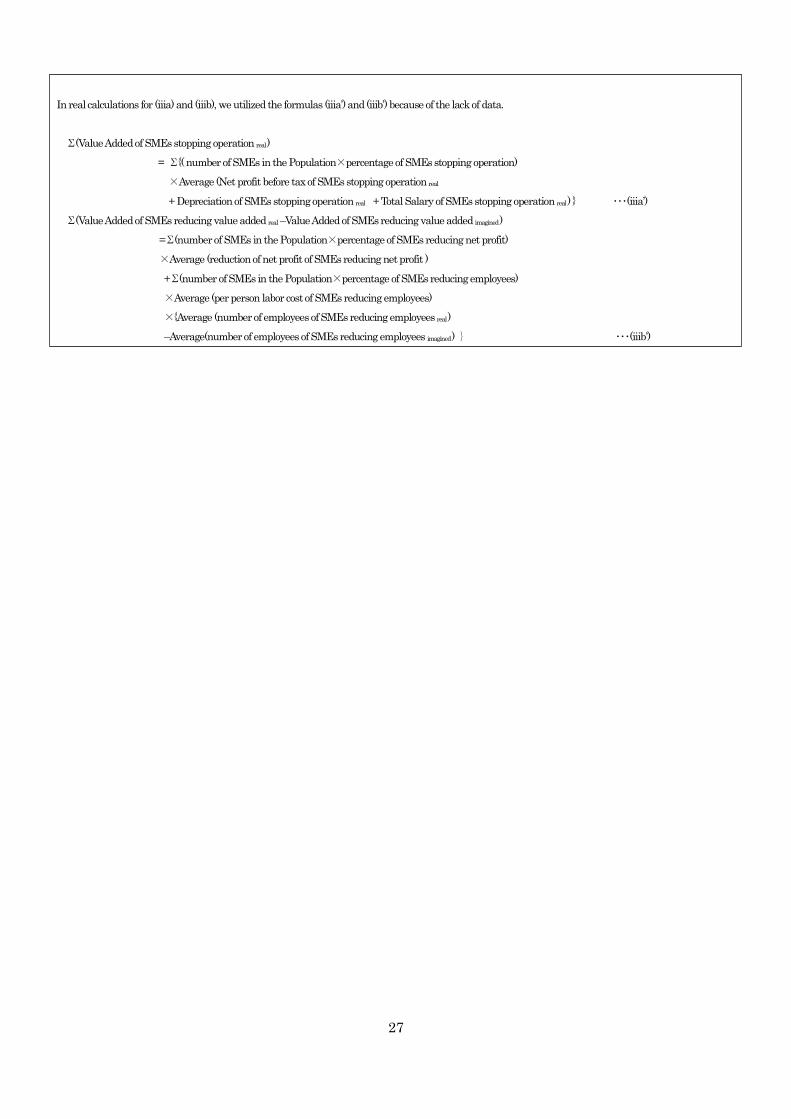
In real calculations for (iiia) and (iiib), we utilized the formulas (iiia’) and (iiib’) because of the lack of data.
Σ(Value Added of SMEs stopping operation real )
= Σ{( number of SMEs in the Population×percentage of SMEs stopping operation)
×Average (Net profit before tax of SMEs stopping operation real
+ Depreciation of SMEs stopping operation real + Total Salary of SMEs stopping operation real ) } ・・・(iiia’)
Σ(Value Added of SMEs reducing value added real –Value Added of SMEs reducing value added imagined )
=Σ(number of SMEs in the Population×percentage of SMEs reducing net profit)
×Average (reduction of net profit of SMEs reducing net profit )
+Σ(number of SMEs in the Population×percentage of SMEs reducing employees)
×Average (per person labor cost of SMEs reducing employees)
×{Average (number of employees of SMEs reducing employees real )
–Average(number of employees of SMEs reducing employees imagined ) } ・・・(iiib’)

Figure 4 Result of the Calculation
Source: Calculated by the author. Macro data are from the Ministry of Internal Affairs and Communication's
"Labor Force Survey" (FY2011) and the Cabinet Office's "Prefectural Account"(FY2010).
【Lost Employment = Employment Retention Effect】
Disaster Prefectures 107,349 persons (2.2% of the employment in the area: 4,776,000 persons)
Other than Disaster Prefectures 494,538 persons (0.9% of the employment in the area: 58,166,000 persons)
Total 601,887 persons (1.0% of the total employment: 6,2942,000 persons)
【Lost Sales = Sales Retention Effect】
Disaster Prefectures 1,205,500 million yen (1.8% of the sales in the area: 65,194,700 million yen)
Other than Disaster Prefectures 6,154,800 million yen (0.7% of the sales in the area: 864,249,600 million yen)
Total 7,360,300 million yen (0.8% of the total sales: 929,444,300 million yen)
【Lost Value Added = Value Added Retention Effect】
Disaster Prefectures 267,900 million yen (0.8% of the gross product of the area 34,931,800 million yen)
Other than Disaster Prefectures 1,443,200 million yen (0.3% of the gross product of the area 460,705,900 million yen)
Total 1,711,100 million yen (0.3% of GDP: 495,637,700 million yen)
28

29
For reference purposes, we present data
on SMEs such as the level of damage due to the
earthquake, performance before and after the
earthquake, and financing, etc., collected through
the “Questionnaire concerning the Effect of the
Great East Japan Earthquake on SMEs,” which
is the source of data used for analysis in this
paper.
The methodology is noted in Table 3, the
sample is shown in Table 4, and the attributes of
respondent companies are shown in Figure 1 of
this paper.
Herein, we present data in four
categories: “A: disaster prefectures & with direct
damage,” “B: disaster prefectures & with indirect
damage,” “C: other than disaster prefectures &
with direct damage,” and “D: other than disaster
prefectures & with indirect damage.” All data in
the appendix is the weighted average, the same
as in the main body of the paper.
1 Level of Damage due to the Earthquake
The percentage of SMEs with direct
damage due to the earthquake is shown in
Appendix Figure 1. The average amount of direct
damage is in Appendix Figure 2. According to the
definition, the percentage is 100% for “A: disaster
prefectures & with direct damage,” and “C: other
than disaster prefectures & with direct damage.”
However, 15.9% of respondents under “B: disaster
prefectures & with indirect damage,” and 3.9% of
respondents under “D: other than disaster
prefectures & with indirect damage” answered
that they suffered some direct damage due to the
earthquake, although JFC loans were made for
the recovery from indirect damage.
The average amount of direct damage of
category A was 35.5 million yen and that of C was
37.9 million yen. There was no significant
difference in where they were situated in terms of
how much direct damage they suffered. This is
because, as described later, although category C
received less damage at the headquarters (the
location is defined based on the headquarters’
location), some companies have branch offices or
factories in the disaster area that received direct
damage that was relatively large scale.
On the other hand, the amount of direct
damage in categories B and D, to which JFC
made loans for recovery from the indirect damage,
is relatively small.
In answer to the question of what
specific direct damage they received, 42.8%
answered “equipment at the headquarters,”
35.4% answered “headquarters’ building,” and
22.0% answered “equipment outside the
headquarters.”
Examining each category, we find that
“A: disaster prefectures & with direct damage”
suffered a higher level of damage to equipment or
headquarters’ buildings than other categories. On
the other hand, “C: other than disaster
prefectures & with direct damage” suffered
relatively more damage outside the headquarters
Appendix: Main Results of the “Questionnaire concerning the Effect of the Great East Japan
Earthquake on SMEs”

30
(Appendix Figure 3). It is supposed that some
SMEs situated in the “other than disaster
prefectures” have branch offices or factories in the
disaster prefectures.
As for indirect damage, 47.4%
experienced “effects from the direct or indirect
damage to customers or suppliers,” 37.1%
experienced “lack of commodities or materials”,
and 33.4% experienced “reluctance of consumers
to buy ” (Appendix Figure 4).
Looking at categories, SMEs in disaster
prefectures tend to more often select each specific
indirect damage; however, SMEs in other than
disaster prefectures more often select “reluctance
of consumers to buy ” and “lack of electric power”.
Concerning damage to customer
companies, directly damaged SMEs have more
customer companies with direct damage than do
indirectly damaged SMEs, and SMEs in disaster
prefectures have more customer companies with
direct damage than those in other than disaster
prefectures (Appendix Figure 5). This tendency is
the same for the direct damage to suppliers
(Appendix Figure 6). In other words, the data
show that SMEs with a large amount of damage
tend to have customers or suppliers with a large
amount of damage.
2 Business Performance before and after the
Earthquake
Next, we examine the business
performance of SMEs utilizing sales, number of
workers (employees and the entrepreneur/CEO),
and profit level (percentage of SMEs with positive
profit) during the three fiscal years before and
after the earthquake. The periods are FY2010
(April 2010 to March 2011) (actual figures),
FY2011 (April 2011 to March 2012) (actual
figures), and FY2012 (April 2012 to March 2013)
(forecast figures).
Because the earthquake occurred on
March 11, 2011, most of the period in FY2010 is
before the earthquake; however, some earthquake
effects may appear in the data. FY2011 is the
year just after the earthquake and corresponds to
the period during which we calculated the JFC
loan effect in the main body of the paper. The data
for FY 2012 is forecast data as of June 2012,
when the questionnaire was prepared.
Although not every company ends its
accounting period in March, we asked every
respondent SME, including sole proprietors, to
provide answers for the three periods above so
that we could compare and collate the data.
As for number of workers, we set the
reference periods “just before the earthquake,”
“the end of March 2012,” and “the end of March
2013.”
Sales in each category tend to increase
in every period except for category D in FY2011
(Appendix Figure 7). On the other hand, the
number of workers decreased in FY2011 (or at the
end of March 2012) for every category. However, it
is forecast that FY2012 figures will almost
recover to the level of FY2010 (Appendix Figure
8).
The profit level showed a clearer
negative effect from the earthquake. The
percentage of SMEs with positive profit declined

31
to 49.0% in FY2011, from 62.6% in FY2010
(Appendix Figure 9). However, from another
perspective, half of SMEs increased profit even
though they suffered from the earthquake.
Moreover, in FY2012, the percentage is forecast to
recover to 60.4%, almost the same level as in
FY2010.
3 Funding
We ask the amount of cash needed from
outside because of the earthquake damage.
Category A answered that, on average, they
needed 16.6 million yen for equipment
procurement and 19.2 million yen for additional
working capital, or 35.8 million yen in total
(Appendix Table 1). Also, category C replied 20.1
million yen for equipment procurement and 30.1
million yen for additional working capital, or 50.2
million yen in total. These data show that SMEs
with direct damage need not only to fund
equipment but also almost an equal or
significantly larger amount of additional working
capital. On the other hand, the cash demand from
SMEs with indirect damage is mainly for working
capital.
So, how they procure the money they
needed? Because every respondent SME received
special loans from JFC, on average 55.2% of the
cash needed was procured from JFC (Appendix
Table 2). Of the remaining, 31.6% was procured
from “private financial institutions,” and 6.2%
was procured from “public sector bodies besides
JFC.” The contributions of “subsidies” (1.6%) and
“insurance benefits” (0.8 %) were very small.
By category, category A received
significantly more “subsidies” (10.3%) and
“insurance benefits” (3.4%) than the other
categories.

Appendix Figure 1 Percentage of SMEs with Direct Damage due to the Earthquake
Source: Japan Finance Corporation Research Institute's "Questionnaire concerning the Effect of the Great Eastern Japan
Earthquake on SMEs" (June 2012) The source is the same for the figures below.
3 Sample size is omitted because we use weight values. The same shall apply hereafter.
Appendix Figure 2 Average Amount of Direct Damage
Note: Figures represent the average of the data of SMEs that suffered direct damage.
Notes: 1 Categories A and C are 100 % according to the definition.
2 The categories are defined by the type of damage for which the recovery loans were made. Hence,
categories B & D may have suffered direct damage.
100.0
15.9
100.0
3.9
15.0
0 20 40 60 80 100
A: Disaster Prefectures & With Direct Damage
B: Disaster Prefectures & With Indirect Damage
C: Other than Disaster Prefectures & With
Direct Damage
D: Other than Disaster Prefectures & With
Indirect Damage
Total (weighted average)
(%)
3,552
1,055
3,785
336
723
0 1,000 2,000 3,000 4,000 5,000
A: Disaster Prefectures & With Direct
Damage
B: Disaster Prefectures & With
Indirect Damage
C: Other than Disaster Prefectures &
With Direct Damage
D: Other than Disaster Prefectures &
With Indirect Damage
Total (weighted average)
(10 thousand yen)
32

Appendix Figure 3 Specific Direct Damage (multiple answers possible)
Notes: 1 The answers are from SMEs that suffered direct damage.
2 The definitions of categories A through D are the same as those for Appendix Figure 1. The same shall
apply hereafter.
3 The total may exceed 100% because multiple answers are possible.
69.3
62.4
20.7
22.7
1.8
26.0
11.2
41.9
55.8
6.4
15.9
1.4
11.8
15.0
47.6
34.5
31.4
28.3
3.0
8.3
15.2
31.1
40.2
17.8
22.1
0.2
0.7
15.9
35.4
42.8
17.8
22.0
0.4
3.6
15.5
0 20 40 60 80 100
Headquarters Building
Equipment at
Headquarters
Buildings other than the
Headquarters
Equipment outside of the
Headquarters
Housing (owned by the
company)
Vehicles
Others
A
B
C
D
Total
(%)
33

Appendix Figure 4 Specific Indirect Damage (multiple answers possible)
Notes: 1 Figures include SMEs with no indirect damage.
2 The total may exceed 100 % because multiple answers are possible.
Appendix Figure 5 Percentage of SMEs Whose Customer Companies Suffered
Direct Damage
Notes: 1 Answers are from SMEs that sell to companies, in addition to or rather than consumers.
2 The figures in [ ] represent the percentage of the respondents' sales amounts to customer companies
with direct damage out of total sales.
73.9
52.6
68.2
31.6
37.0
0 20 40 60 80 100
A: Disaster Prefectures & With Direct Damage
B: Disaster Prefectures & With Indirect Damage
C: Other than Disaster Prefectures & With
Direct Damage
D: Other than Disaster Prefectures & With
Indirect Damage
Total (weighted average)
(%)
[27.1]
[39.6]
[31.9]
[27.2]
[25.5]
51.6
33.9
23.7
28.6
10.6
22.7
24.9
32.7
6.0
10.2
53.9
39.8
26.3
26.4
9.6
20.1
25.5
15.6
10.4
5.5
44.4
28.3
31.9
18.8
30.4
22.5
22.7
19.4
6.5
14.1
46.7
37.5
34.8
24.8
16.4
13.7
13.1
7.9
9.5
6.3
47.4
37.1
33.4
25.1
15.9
15.0
14.9
10.7
9.2
6.8
0 20 40 60 80 100
Effect from Direct or
Indirect Damage to
Customers or Suppliers
Lack of Commodities or
Materials
Reluctance of Consumers
to Buy
Retail Price Hike
Lack of Electric Power
Effect of Rumors
Effect from Damage to
Transportation or
Infrastructure
Decrease of Consumers in
the Area
Others
No Indirect Damage
A
B
C
D
Total
(%)
34

Appendix Figure 6 Percentage of SMEs Whose Supplier Companies Suffered Direct Damage
Note: The figures in [ ] represent the percentage of the respondents' procurement amount from the supplier companies
with direct damage out of total procurement.
Appendix Figure 7 Average Sales
Appendix Figure 8 Average Number of Workers
Note: Workers include employees and the entrepreneur/CEO.
58.5
38.4
50.5
21.8
26.4
0 20 40 60 80 100
A: Disaster Prefectures & With Direct Damage
B: Disaster Prefectures & With Indirect Damage
C: Other than Disaster Prefectures & With
Direct Damage
D: Other than Disaster Prefectures & With
Indirect Damage
Total (weighted average)
(%)
[31.1]
[30.1]
[31.5]
[29.3]
[41.1]
24,789
15,856
66,951
26,934
27,028
25,509
16,231
68,595
26,558
26,822
25,897
17,133
68,952
27,106
27,368
0 50,000 100,000
A: Disaster Prefectures & With Direct
Damage
B: Disaster Prefectures & With Indirect
Damage
C: Other than Disaster Prefectures & With
Direct Damage
D: Other than Disaster Prefectures & With
Indirect Damage
Total (weighted average)
FY 2010
FY 2011
FY 2012 (expectation)
(10 thousand yen)
17.5
12.7
38.7
17.7
17.8
16.9
12.6
35.0
17.4
17.5
17.6
12.8
35.8
17.7
17.8
0 10 20 30 40 50
A: Disaster Prefectures & With Direct
Damage
B: Disaster Prefectures & With Indirect
Damage
C: Other than Disaster Prefectures & With
Direct Damage
D: Other than Disaster Prefectures & With
Indirect Damage
Total (weighted average)
FY 2010
FY 2011
FY 2012 (expectation)
(persons)
35

Appendix Figure 9 Percentage of Companies with Positive Profit
61.8
61.6
71.5
62.6
62.6
51.7
55.5
48.2
48.4
49.0
62.6
62.8
63.4
60.0
60.4
0 20 40 60 80 100
A: Disaster Prefectures & With Direct
Damage
B: Disaster Prefectures & With Indirect
Damage
C: Other than Disaster Prefectures & With
Direct Damage
D: Other than Disaster Prefectures & With
Indirect Damage
Total (weighted average)
FY 2010
FY 2011
FY 2012 (expectation)
(%)
36

Appendix Table 1 Amount of Money Needed Additionally due to the Earthquake
(Unit: 10 thousand yen)
Equipment
Procurement
Working
CapitalTotal
A: Disaster Prefectures &
With Direct Damage1,661 1,916 3,577
B: Disaster Prefectures &
With Indirect Damage267 1,456 1,723
C: Other than Disaster
Prefectures & With Direct
Damage
2,006 3,013 5,020
D: Other than Disaster
Prefecture & With Indirect
Damage
159 2,201 2,360
Total (weighted average) 334 2,159 2,493
Appendix Table 2 Procurement Money Needed Additionally due to the Earthquake
(Amount and Proportion)
(Unit: 10 thousand yen, %)
Japan
Finance
Corporation
(JFC)
Private
Finance
Institutions
Public
Sectors
besides JFC
SubsidiesInsurance
Benefits
Managers /
ExecutivesOthers Total
A: Disaster Prefectures &
With Direct Damage1,651 1,393 253 410 135 119 15 3,976
(41.5) (35.0) (6.4) (10.3) (3.4) (3.0) (0.4) (100.0)
B: Disaster Prefectures &
With Indirect Damage1,079 775 76 11 7 102 7 2,056
(52.5) (37.7) (3.7) (0.5) (0.4) (5.0) (0.3) (100.0)
C: Other than Disaster
Prefectures & With Direct
Damage
2,775 1,595 355 156 49 111 39 5,081
(54.6) (31.4) (7.0) (3.1) (1.0) (2.2) (0.8) (100.0)
D: Other than Disaster
Prefectures & With Indirect
Damage
1,605 864 174 9 12 111 23 2,797
(57.4) (30.9) (6.2) (0.3) (0.4) (4.0) (0.8) (100.0)
Total (weighted average) 1,609 922 180 48 24 111 22 2,915
(55.2) (31.6) (6.2) (1.6) (0.8) (3.8) (0.7) (100.0)
Note: The data here are not necessarily equal to the data on Appendix Table 1.
37