measuring the effects of congestion and request location on transit signal priority matt dorado erin...
Post on 22-Dec-2015
219 views
TRANSCRIPT

Measuring the Effects of
Congestion and Request Location
onTransit Signal
Priority
Matt Dorado Erin Qureshi River Hwang
Portland State University

OutlineIntroduction
Objective
Study Design
Test Scenarios
Results
Conclusions/Future Research
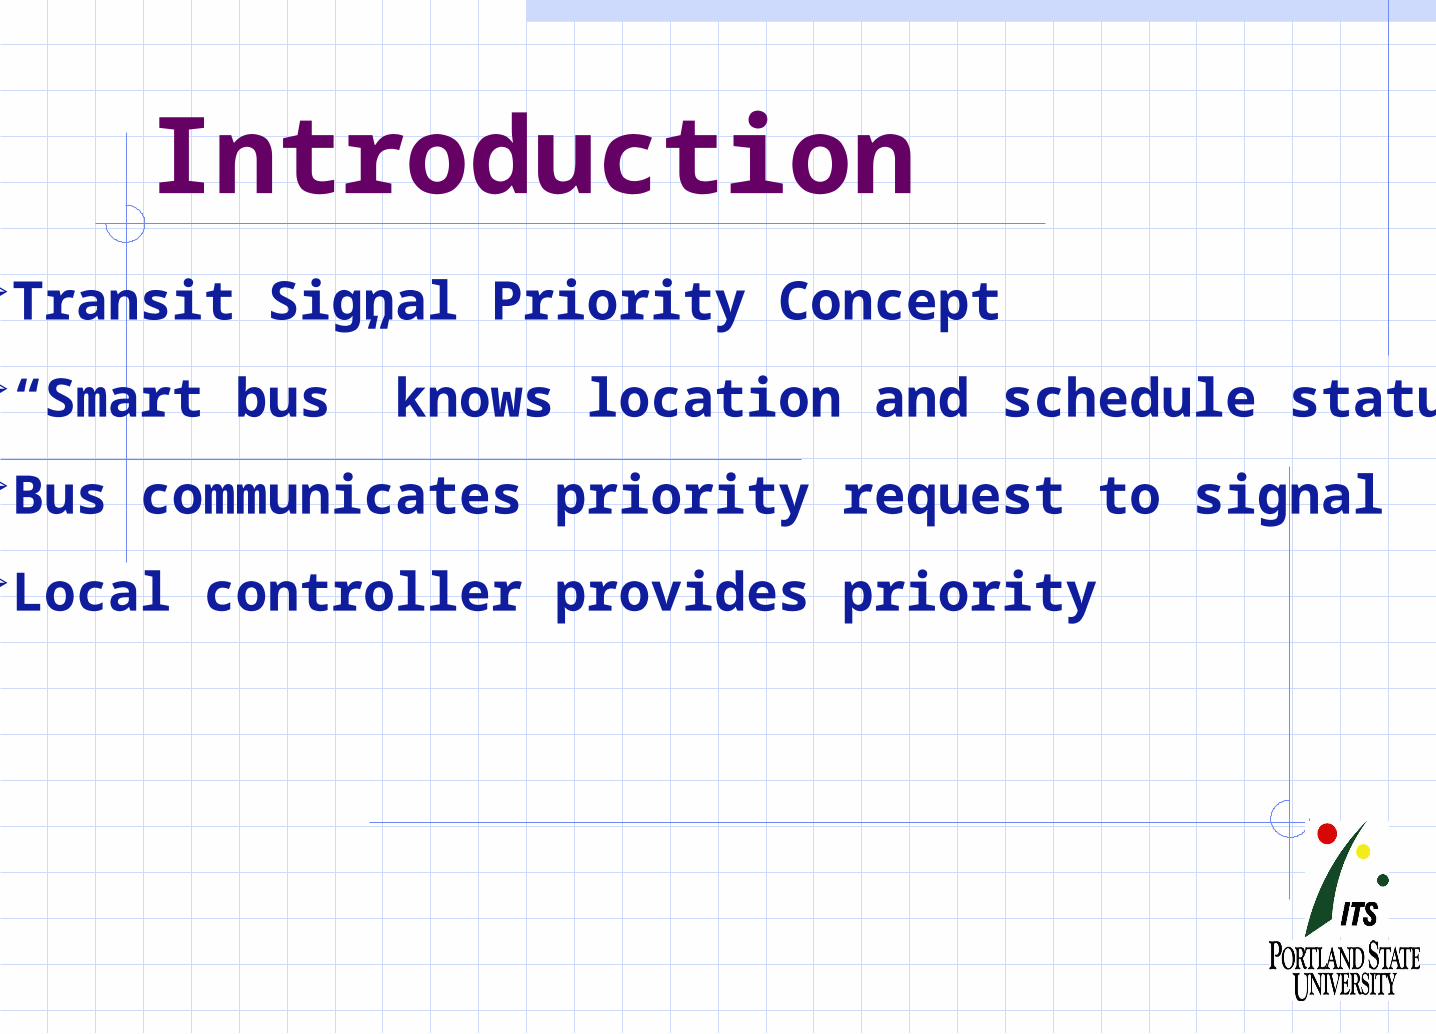
IntroductionTransit Signal Priority Concept
“Smart bus” knows location and schedule status
Bus communicates priority request to signal
Local controller provides priority

Onboard System
PCMIA
CardControl Head

Priority Call Sequence

TSP CriteriaIs the bus within Portland city limits?
Is the bus on route?
Are the bus doors closed?
Has the request already been sent?
Is the bus behind schedule?
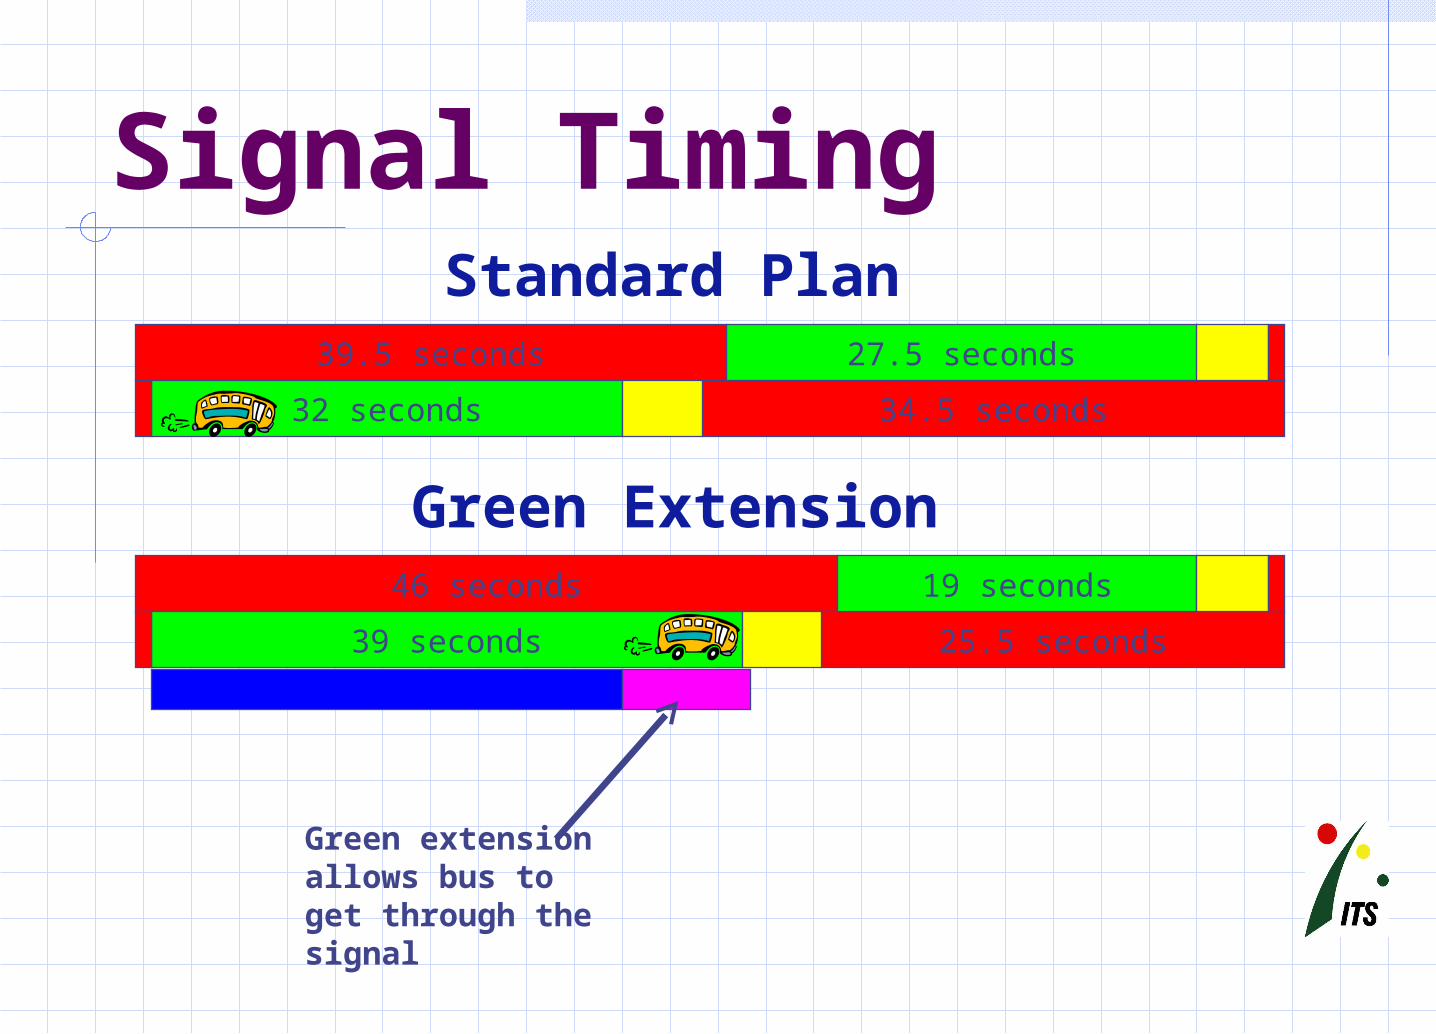
Signal Timing
Green Extension
Standard Plan
46 seconds
25.5 seconds39 seconds
19 seconds
39.5 seconds
34.5 seconds32 seconds
27.5 seconds
Green extension allows bus to get through the signal

Signal Timing
Red Truncation
39.5 seconds
34.5 seconds 32 seconds
27.5 seconds
29.5 seconds
42 seconds23 seconds
35 seconds
Standard Plan
Red truncation allows bus to get started through the intersection sooner

ObjectiveTo evaluate the relationship
between
Congestion
and the distance at which a bus calls
for Signal Priority.

Modeling
Single intersection
Intersection of NE 33rd Ave and Sandy Blvd Portland ,Oregon

Hardware-in-the-Loop
Set up showing desktop
computer,CID, and 170
Controller
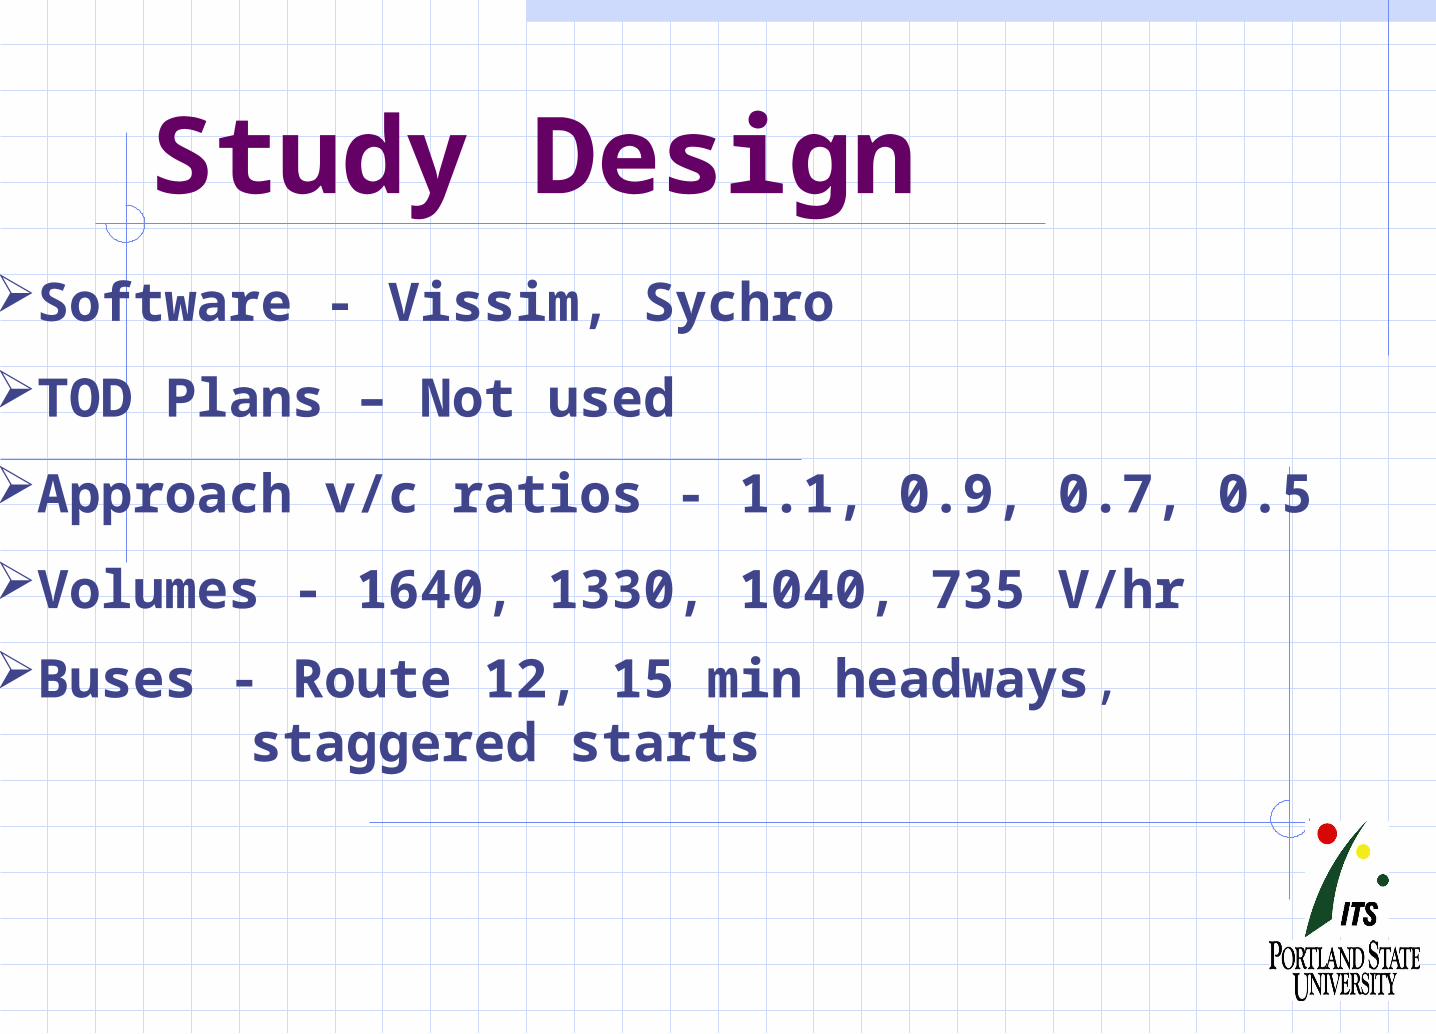
Study DesignSoftware - Vissim, Sychro
TOD Plans – Not used
Approach v/c ratios - 1.1, 0.9, 0.7, 0.5
Volumes - 1640, 1330, 1040, 735 V/hr
Buses - Route 12, 15 min headways, staggered starts

Study DesignData Collection
Three Categories – Travel Time, Waiting Time, Delay
Travel Times – Fixed 1000 ft section
Waiting time
Delay – Buses only

Signal Timing
Red Truncation
39.5 seconds
34.5 seconds 32 seconds
27.5 seconds
29.5 seconds
42 seconds23 seconds
35 seconds
Standard Plan

ScenariosBus stop locations – Far and Near
Call distance vs v/c
Call Distance v/c Ratio 420 feet 1.1 0.9 0.7 0.5350 feet 1.1 0.9 0.7 0.5280 feet 1.1 0.9 0.7 0.5

Results-Avg Travel Times
Table 1 Average Travel Times
Detector Length
v/c Direction 280 ft 350 ft 420 ft
1.1East 66.7 64.8 64.1
West 75.6 76.3 80.9
0.9East 62.5 62.2 61.8
West 75.4 70.1 73.0
0.7East 61.4 62.1 59.3
West 70.0 68.0 69.3
0.5East 62.5 60.8 60.2
West 64.9 64.7 67.3

Results – FarsideFigure 1-Eastbound Travel T imes
54
56
58
60
62
64
66
68
1.1 0.9 0.7 0.5
v/c Ratio
Tra
ve
l Tim
e (
se
c)
280 f t
350 f t
420 f t

Results - NearsideFigure 2-Westbound Travel T ime
60
65
70
75
80
85
1.1 0.9 0.7 0.5
v/c Ratio
Tra
ve
l T
ime
(s
ec
)
280ft
350ft
420ft

Results – Delay Farside
Figure 3-Eastbound Delay
15
17
19
21
23
25
27
1.1 0.9 0.7 0.5
v/c Ratio
Del
ay (
sec)
280 ft
350 ft
420 ft

Results – Delay Nearside
Figure 4-Westbound Delay
20
25
30
35
40
45
1.1 0.9 0.7 0.5
v/c Ratio
Del
ay (
sec)
280 ft
350 ft
420 ft

Results - Wait Time Farside
Figure 5-Eastbound Wait T ime
6
7
8
9
10
11
12
1.1 0.9 0.7 0.5
v/c Ratio
Wa
it T
ime
(s
ec
)
280 ft
350 ft
420 ft

Results - Wait Time Nearside
Figure 6-Westbound Wait T imes
10
12
14
16
18
20
22
1.1 0.9 0.7 0.5
v/c Ratio
Wai
t T
ime
(sec
)
280 ft
350 ft
420 ft

Conclusions/Further ResearchNear side
Far side
Call button
2 Hour Cycles

AcknowledgmentsTriMet
Paul Zebell, Willie Rotich, Bill Kloos - City of Portland
Connie Hotard - PTV America
Peter Koonce, Selman Altun - Kittelson and Associates
Dr. Robert Bertini, Dr. Chris Monsere, Erin Qureshi,
River Hwang, Neil Byrne, and Office of Academic Affairs - Portland State University

Thank You