measuring the impact of local hosting trends in the asia
TRANSCRIPT
Measuring the Impact of Local IXPs: Understanding Hosting Trends in the Asia-Pacific Region From the Regional Domain PerspectiveAustralia, Bangladesh, Indonesia, India, Japan, Malaysia, Nepal, Philippines, Singapore, and Thailand
By Terry Sweetser

Abstract
The technical objective of this study is to measure the impact of local Internet exchanges across the Asia-Pacific region. Data was gathered from locally hosted machines in ten countries using a complete list of local ccTLD1 domains. Performance data for latency and hop counts was gathered from the ten locations as IPv4 and IPv6 addresses of the remote servers, providing HTTPS for each domain. Further data was generated to geolocate the remote IP addresses and check the Resource Public Key Infrastructure (RPKI) (secured routing) status of each address. Analysis and visualization of the data set is presented alongside commentary and interpretation of the technical and business impact of those observations.
By Terry Sweetser about.me/terry.sweetser [email protected]
1 Country code top level domains (Wikipedia, 2021)
Measuring the Impact of Local IXPs: Understanding Hosting Trends in the Asia-Pacific Region From the Regional Domain Perspective 2
CC BY-NC-SA 4.0internetsociety.org
@internetsociety
Table of ContentsTable of Figures . . . . . . . . . . . . . . . . . . . . . . . . . . . . . . . . . . . . . . . . . . . . . . . . . . . . . . . . . . . . 5
List of Acronyms . . . . . . . . . . . . . . . . . . . . . . . . . . . . . . . . . . . . . . . . . . . . . . . . . . . . . . . . . . . 6
Introduction . . . . . . . . . . . . . . . . . . . . . . . . . . . . . . . . . . . . . . . . . . . . . . . . . . . . . . . . . . . . . . . 7
Data Summary . . . . . . . . . . . . . . . . . . . . . . . . . . . . . . . . . . . . . . . . . . . . . . . . . . . . . . . . . . . . . 9
Data Quality . . . . . . . . . . . . . . . . . . . . . . . . . . . . . . . . . . . . . . . . . . . . . . . . . . . . . . . . . . . . . . . 9
Provider Peering . . . . . . . . . . . . . . . . . . . . . . . . . . . . . . . . . . . . . . . . . . . . . . . . . . . . . . . . . . . . . . . . . 10
Hop Counts . . . . . . . . . . . . . . . . . . . . . . . . . . . . . . . . . . . . . . . . . . . . . . . . . . . . . . . . . . . . . . . . . . . . . . 10
Latency . . . . . . . . . . . . . . . . . . . . . . . . . . . . . . . . . . . . . . . . . . . . . . . . . . . . . . . . . . . . . . . . . . . . . . . . . . 11
Geolocations . . . . . . . . . . . . . . . . . . . . . . . . . . . . . . . . . . . . . . . . . . . . . . . . . . . . . . . . . . . . . . . . . . . . 12
RPKI . . . . . . . . . . . . . . . . . . . . . . . . . . . . . . . . . . . . . . . . . . . . . . . . . . . . . . . . . . . . . . . . . . . . . . . . . . . . . 12
Visual Analysis . . . . . . . . . . . . . . . . . . . . . . . . . . . . . . . . . . . . . . . . . . . . . . . . . . . . . . . . . . . . . 13
Hosting Locations (Nations) . . . . . . . . . . . . . . . . . . . . . . . . . . . . . . . . . . . . . . . . . . . . . . . . . . . . . 13
Hosting Organizations . . . . . . . . . . . . . . . . . . . . . . . . . . . . . . . . . . . . . . . . . . . . . . . . . . . . . . . . . . . 14
Hop Count Versus Latency (Australia) . . . . . . . . . . . . . . . . . . . . . . . . . . . . . . . . . . . . . . . . . . . 16
Multi-Modal Analysis . . . . . . . . . . . . . . . . . . . . . . . . . . . . . . . . . . . . . . . . . . . . . . . . . . . . . . .18
Network Performance . . . . . . . . . . . . . . . . . . . . . . . . . . . . . . . . . . . . . . . . . . . . . . . . . . . . . .19
Cloudflare . . . . . . . . . . . . . . . . . . . . . . . . . . . . . . . . . . . . . . . . . . . . . . . . . . . . . . . . . . . . . . . . . . . . . . 20
Google . . . . . . . . . . . . . . . . . . . . . . . . . . . . . . . . . . . . . . . . . . . . . . . . . . . . . . . . . . . . . . . . . . . . . . . . . . 21
Wix . . . . . . . . . . . . . . . . . . . . . . . . . . . . . . . . . . . . . . . . . . . . . . . . . . . . . . . . . . . . . . . . . . . . . . . . . . . . . .22
Discussion . . . . . . . . . . . . . . . . . . . . . . . . . . . . . . . . . . . . . . . . . . . . . . . . . . . . . . . . . . . . . . . . 22
Nepal . . . . . . . . . . . . . . . . . . . . . . . . . . . . . . . . . . . . . . . . . . . . . . . . . . . . . . . . . . . . . . . . . . . . . . . . . . . .23
Bangladesh . . . . . . . . . . . . . . . . . . . . . . . . . . . . . . . . . . . . . . . . . . . . . . . . . . . . . . . . . . . . . . . . . . . . . .23
Australia . . . . . . . . . . . . . . . . . . . . . . . . . . . . . . . . . . . . . . . . . . . . . . . . . . . . . . . . . . . . . . . . . . . . . . . . 24
India . . . . . . . . . . . . . . . . . . . . . . . . . . . . . . . . . . . . . . . . . . . . . . . . . . . . . . . . . . . . . . . . . . . . . . . . . . . . 24
Philippines . . . . . . . . . . . . . . . . . . . . . . . . . . . . . . . . . . . . . . . . . . . . . . . . . . . . . . . . . . . . . . . . . . . . . . 24
Thailand . . . . . . . . . . . . . . . . . . . . . . . . . . . . . . . . . . . . . . . . . . . . . . . . . . . . . . . . . . . . . . . . . . . . . . . . 25
Singapore . . . . . . . . . . . . . . . . . . . . . . . . . . . . . . . . . . . . . . . . . . . . . . . . . . . . . . . . . . . . . . . . . . . . . . 25
Measuring the Impact of Local IXPs: Understanding Hosting Trends in the Asia-Pacific Region From the Regional Domain Perspective 3
CC BY-NC-SA 4.0internetsociety.org
@internetsociety

Malaysia . . . . . . . . . . . . . . . . . . . . . . . . . . . . . . . . . . . . . . . . . . . . . . . . . . . . . . . . . . . . . . . . . . . . . . . . 25
Indonesia . . . . . . . . . . . . . . . . . . . . . . . . . . . . . . . . . . . . . . . . . . . . . . . . . . . . . . . . . . . . . . . . . . . . . . . 26
Japan . . . . . . . . . . . . . . . . . . . . . . . . . . . . . . . . . . . . . . . . . . . . . . . . . . . . . . . . . . . . . . . . . . . . . . . . . . . 26
Localization . . . . . . . . . . . . . . . . . . . . . . . . . . . . . . . . . . . . . . . . . . . . . . . . . . . . . . . . . . . . . . . . . . . . 26
IPv6 Adoption . . . . . . . . . . . . . . . . . . . . . . . . . . . . . . . . . . . . . . . . . . . . . . . . . . . . . . . . . . . . . . . . . . .27
Routing Security . . . . . . . . . . . . . . . . . . . . . . . . . . . . . . . . . . . . . . . . . . . . . . . . . . . . . . . . . . . . . . . . 28
Business Models . . . . . . . . . . . . . . . . . . . . . . . . . . . . . . . . . . . . . . . . . . . . . . . . . . . . . . . . . . . . . . . . 28
Cultural Contexts . . . . . . . . . . . . . . . . . . . . . . . . . . . . . . . . . . . . . . . . . . . . . . . . . . . . . . . . . . . . . . . 29
Conclusion . . . . . . . . . . . . . . . . . . . . . . . . . . . . . . . . . . . . . . . . . . . . . . . . . . . . . . . . . . . . . . . 30
References . . . . . . . . . . . . . . . . . . . . . . . . . . . . . . . . . . . . . . . . . . . . . . . . . . . . . . . . . . . . . . . .31
Appendix 1: Project Brief . . . . . . . . . . . . . . . . . . . . . . . . . . . . . . . . . . . . . . . . . . . . . . . . . . 33
Appendix 2: Technical Methodology . . . . . . . . . . . . . . . . . . . . . . . . . . . . . . . . . . . . . . . . 35
Appendix 3: More Visualizations . . . . . . . . . . . . . . . . . . . . . . . . . . . . . . . . . . . . . . . . . . . 36
BD . . . . . . . . . . . . . . . . . . . . . . . . . . . . . . . . . . . . . . . . . . . . . . . . . . . . . . . . . . . . . . . . . . . . . . . . . . . . . . .36
NP . . . . . . . . . . . . . . . . . . . . . . . . . . . . . . . . . . . . . . . . . . . . . . . . . . . . . . . . . . . . . . . . . . . . . . . . . . . . . . .36
Others . . . . . . . . . . . . . . . . . . . . . . . . . . . . . . . . . . . . . . . . . . . . . . . . . . . . . . . . . . . . . . . . . . . . . . . . . . .37
Appendix 4: Provider Connectivity . . . . . . . . . . . . . . . . . . . . . . . . . . . . . . . . . . . . . . . . . 38
AS4229 . . . . . . . . . . . . . . . . . . . . . . . . . . . . . . . . . . . . . . . . . . . . . . . . . . . . . . . . . . . . . . . . . . . . . . . . . 38
AS21859 . . . . . . . . . . . . . . . . . . . . . . . . . . . . . . . . . . . . . . . . . . . . . . . . . . . . . . . . . . . . . . . . . . . . . . . . .39
AS20473 . . . . . . . . . . . . . . . . . . . . . . . . . . . . . . . . . . . . . . . . . . . . . . . . . . . . . . . . . . . . . . . . . . . . . . . . 40
AS45170 . . . . . . . . . . . . . . . . . . . . . . . . . . . . . . . . . . . . . . . . . . . . . . . . . . . . . . . . . . . . . . . . . . . . . . . . .41
AS10075 . . . . . . . . . . . . . . . . . . . . . . . . . . . . . . . . . . . . . . . . . . . . . . . . . . . . . . . . . . . . . . . . . . . . . . . . 42
Appendix 5: Regional Latency Data (Singapore) . . . . . . . . . . . . . . . . . . . . . . . . . . . . . 43
Appendix 6: Trends in the Data Using SQL . . . . . . . . . . . . . . . . . . . . . . . . . . . . . . . . . 43
Data Using SQL . . . . . . . . . . . . . . . . . . . . . . . . . . . . . . . . . . . . . . . . . . . . . . . . . . . . . . . . . . . . . . . . . 43
Top 25 Networks (IPv4) . . . . . . . . . . . . . . . . . . . . . . . . . . . . . . . . . . . . . . . . . . . . . . . . . . . . . . . . . 43
Top 25 Networks (IPv6) . . . . . . . . . . . . . . . . . . . . . . . . . . . . . . . . . . . . . . . . . . . . . . . . . . . . . . . . . 44
Top 25 Hosting ASNs . . . . . . . . . . . . . . . . . . . . . . . . . . . . . . . . . . . . . . . . . . . . . . . . . . . . . . . . . . . 45
Appendix 7: Is There Any Glue? . . . . . . . . . . . . . . . . . . . . . . . . . . . . . . . . . . . . . . . . . . . . 46
Measuring the Impact of Local IXPs: Understanding Hosting Trends in the Asia-Pacific Region From the Regional Domain Perspective 4
CC BY-NC-SA 4.0internetsociety.org
@internetsociety

Table of FiguresFigure 1 Geographic coverage of the report data by number of domains, source: Terry Sweetser, Tableau Visualization . . . . . . . . . . . . . . . . . . . . . . . . . 9
Figure 2 Hosting Locations around the globe by number of server networks, source: Terry Sweetser, Tableau Visualization . . . . . . . . . . . . . . . . . . . . . . . . 13
Figure 3 Hosting numbers as a bubble map of Domains Per ASN, source: Terry Sweetser, Tableau Visualization . . . . . . . . . . . . . . . . . . . . . . . . . . . . . . . . . .14
Figure 4 Average Latency versus Hop Count for Australian Domains, source: Terry Sweetser, Tableau Visualization . . . . . . . . . . . . . . . . . . . . . . . . . . . . . . . . . .16
Figure 5 Cloudflare network metrics, source: Terry Sweetser, Tableau Visualization . . . . . . . . . . . . . . . . . . . . . . . . . . . . . . . . . . . . . . . . . . . . . . . . . . . . . . 20
Figure 6 Google network metrics, source: Terry Sweetser, Tableau Visualization . . . . . . . . . . . . . . . . . . . . . . . . . . . . . . . . . . . . . . . . . . . . . . . . . . . . . . .21
Figure 7 Wix network metrics, source: Terry Sweetser, Tableau Visualization . . . . . 22
Figure 8 BD, Latency versus Hop Count, source: Terry Sweetser, Tableau Visualization . . . . . . . . . . . . . . . . . . . . . . . . . . . . . . . . . . . . . . . . . . . . . . . . . . . . . . 36
Figure 9 Nepal, Latency versus Hop Count, source: Terry Sweetser, Tableau Visualization . . . . . . . . . . . . . . . . . . . . . . . . . . . . . . . . . . . . . . . . . . . . . . . . . . . . . . 36
Figure 10 Various, Latency versus Hop Count, source: Terry Sweetser, Tableau Visualization . . . . . . . . . . . . . . . . . . . . . . . . . . . . . . . . . . . . . . . . . . . . . . . . . . . . . . 37
Measuring the Impact of Local IXPs: Understanding Hosting Trends in the Asia-Pacific Region From the Regional Domain Perspective 5
CC BY-NC-SA 4.0internetsociety.org
@internetsociety

List of AcronymsASN: Autonomous system number
AS path: Autonomous system path
ccTLD: Country code top-level domain
BGP: Border Gateway Protocol
CDN: Content Delivery Network
DNS: Domain Name System
HTTPS: Hypertext Transfer Protocol Secure
IP: Internet Protocol
IPv4: Internet Protocol Version 4
IPv6: Internet Protocol Version 6
ISP: Internet Service Provider
IXP: Internet Exchange Point
ROA: Route Origin Authorization
ROV: Route Origin Validation
RPKI: Resource Public Key Infrastructure
RSA: Encryption Standard
SQL: Structured Query Language
TCP: Transmission Control Protocol
Measuring the Impact of Local IXPs: Understanding Hosting Trends in the Asia-Pacific Region From the Regional Domain Perspective 6
CC BY-NC-SA 4.0internetsociety.org
@internetsociety
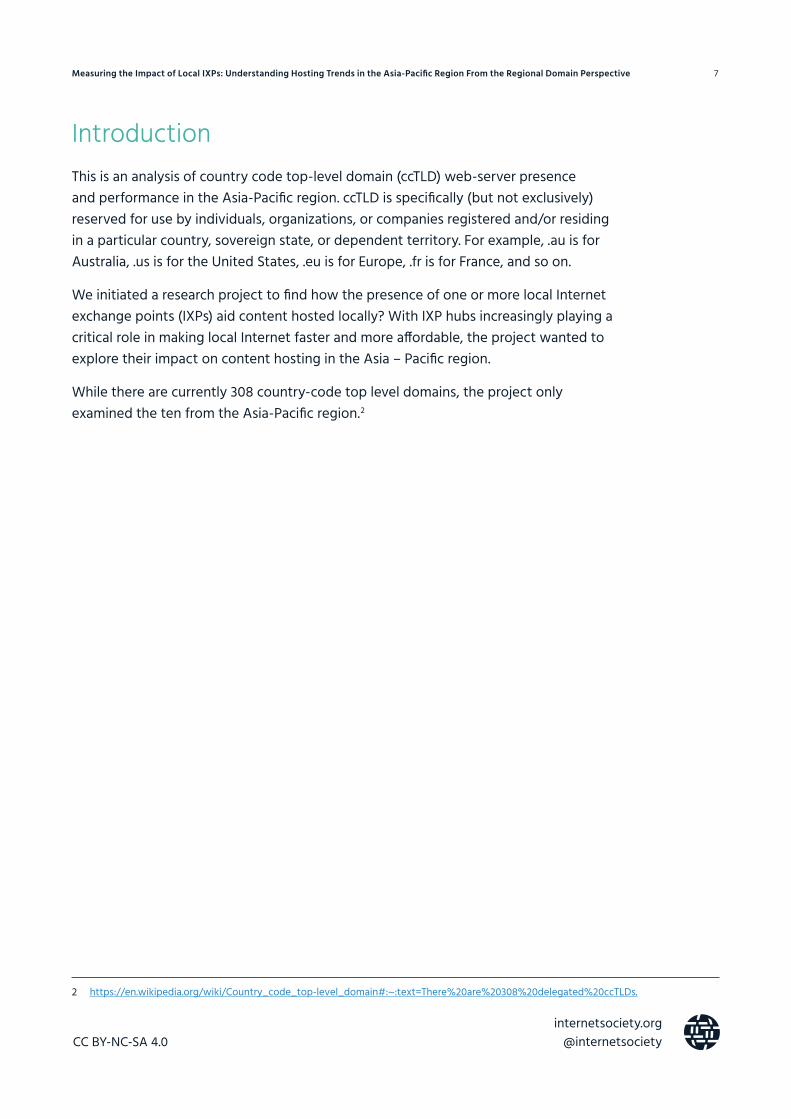
IntroductionThis is an analysis of country code top-level domain (ccTLD) web-server presence and performance in the Asia-Pacific region. ccTLD is specifically (but not exclusively) reserved for use by individuals, organizations, or companies registered and/or residing in a particular country, sovereign state, or dependent territory. For example, .au is for Australia, .us is for the United States, .eu is for Europe, .fr is for France, and so on.
We initiated a research project to find how the presence of one or more local Internet exchange points (IXPs) aid content hosted locally? With IXP hubs increasingly playing a critical role in making local Internet faster and more affordable, the project wanted to explore their impact on content hosting in the Asia – Pacific region.
While there are currently 308 country-code top level domains, the project only examined the ten from the Asia-Pacific region.2
2 https://en.wikipedia.org/wiki/Country_code_top-level_domain#:~:text=There%20are%20308%20delegated%20ccTLDs.
Measuring the Impact of Local IXPs: Understanding Hosting Trends in the Asia-Pacific Region From the Regional Domain Perspective 7
CC BY-NC-SA 4.0internetsociety.org
@internetsociety
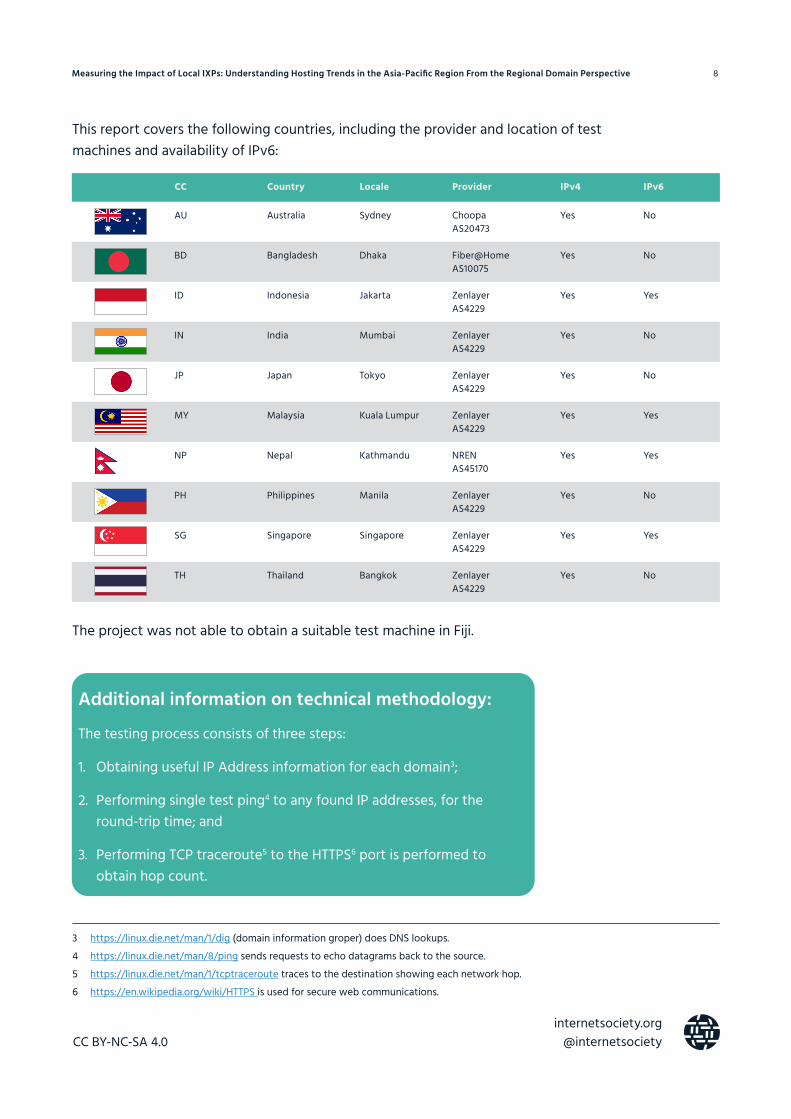
This report covers the following countries, including the provider and location of test machines and availability of IPv6:
The project was not able to obtain a suitable test machine in Fiji.
Additional information on technical methodology:
The testing process consists of three steps:
1. Obtaining useful IP Address information for each domain3;
2. Performing single test ping4 to any found IP addresses, for the round-trip time; and
3. Performing TCP traceroute5 to the HTTPS6 port is performed to obtain hop count.
3 https://linux.die.net/man/1/dig (domain information groper) does DNS lookups. 4 https://linux.die.net/man/8/ping sends requests to echo datagrams back to the source.5 https://linux.die.net/man/1/tcptraceroute traces to the destination showing each network hop.6 https://en.wikipedia.org/wiki/HTTPS is used for secure web communications.
CC Country Locale Provider IPv4 IPv6
AU Australia Sydney Choopa AS20473
Yes No
BD Bangladesh Dhaka Fiber@Home AS10075
Yes No
ID Indonesia Jakarta Zenlayer AS4229
Yes Yes
IN India Mumbai Zenlayer AS4229
Yes No
JP Japan Tokyo Zenlayer AS4229
Yes No
MY Malaysia Kuala Lumpur Zenlayer AS4229
Yes Yes
NP Nepal Kathmandu NREN AS45170
Yes Yes
PH Philippines Manila Zenlayer AS4229
Yes No
SG Singapore Singapore Zenlayer AS4229
Yes Yes
TH Thailand Bangkok Zenlayer AS4229
Yes No
Measuring the Impact of Local IXPs: Understanding Hosting Trends in the Asia-Pacific Region From the Regional Domain Perspective 8
CC BY-NC-SA 4.0internetsociety.org
@internetsociety

Data Summary
Data Quality
Figure 1 . Geographic coverage of the report data by number of domains, source: Terry Sweetser, Tableau Visualization .
Country1 AU2 BD3 ID4 IN5 JP6 MY7 NP 8 PH9 SG10 TH
2
6
8
3
5
9
7
4 10
1
Being Served Number of
Unique Domains 3,506,351
Unique Networks 15,618
Unique Autonomous Systems 4,763
IP Address (v4) Hosting Web Sites 524,611
IP Address (v6) Hosting Web Sites 128,459
Country Codes 10
Remote Hosting Country Codes 97
Average Latency 73.9 ms
Average Hops 12
Measuring the Impact of Local IXPs: Understanding Hosting Trends in the Asia-Pacific Region From the Regional Domain Perspective 9
CC BY-NC-SA 4.0internetsociety.org
@internetsociety
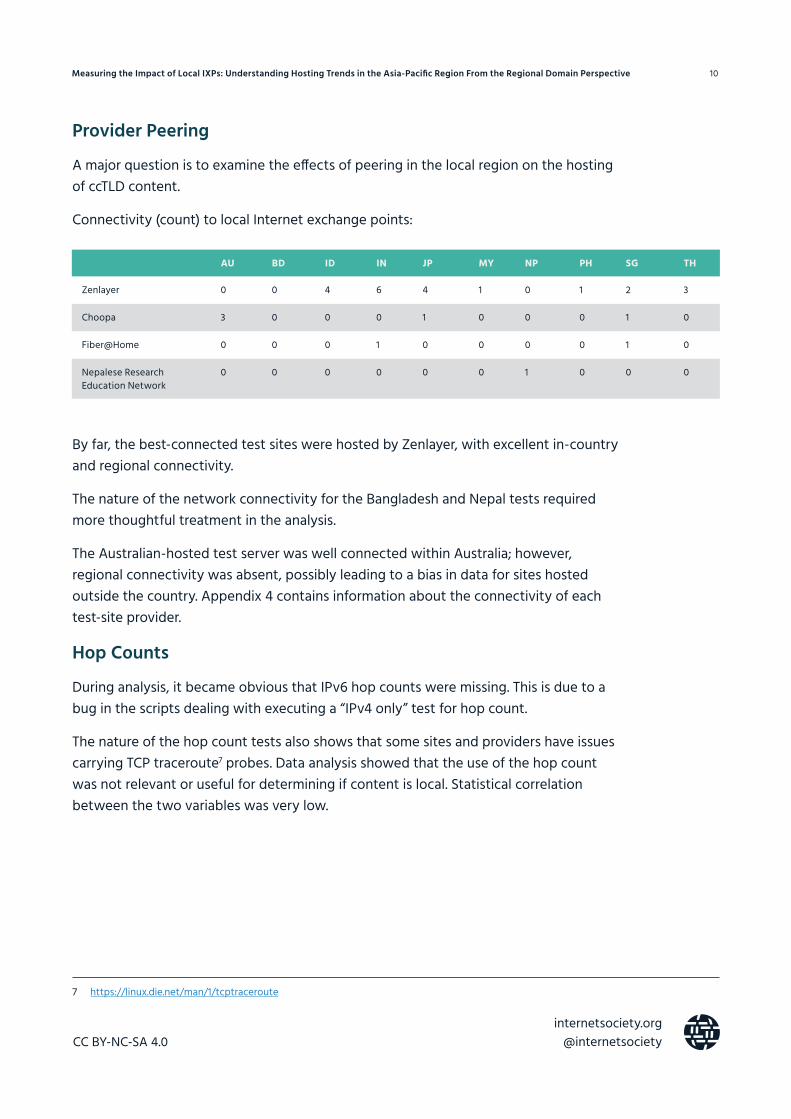
Provider Peering
A major question is to examine the effects of peering in the local region on the hosting of ccTLD content.
Connectivity (count) to local Internet exchange points:
By far, the best-connected test sites were hosted by Zenlayer, with excellent in-country and regional connectivity.
The nature of the network connectivity for the Bangladesh and Nepal tests required more thoughtful treatment in the analysis.
The Australian-hosted test server was well connected within Australia; however, regional connectivity was absent, possibly leading to a bias in data for sites hosted outside the country. Appendix 4 contains information about the connectivity of each test-site provider.
Hop Counts
During analysis, it became obvious that IPv6 hop counts were missing. This is due to a bug in the scripts dealing with executing a “IPv4 only” test for hop count.
The nature of the hop count tests also shows that some sites and providers have issues carrying TCP traceroute7 probes. Data analysis showed that the use of the hop count was not relevant or useful for determining if content is local. Statistical correlation between the two variables was very low.
7 https://linux.die.net/man/1/tcptraceroute
AU BD ID IN JP MY NP PH SG TH
Zenlayer 0 0 4 6 4 1 0 1 2 3
Choopa 3 0 0 0 1 0 0 0 1 0
Fiber@Home 0 0 0 1 0 0 0 0 1 0
Nepalese Research Education Network
0 0 0 0 0 0 1 0 0 0
Measuring the Impact of Local IXPs: Understanding Hosting Trends in the Asia-Pacific Region From the Regional Domain Perspective 10
CC BY-NC-SA 4.0internetsociety.org
@internetsociety

Latency
Latency is the round-trip response time of a user request, for example, the time required to send an Internet Control Message Protocol (ICMP), a ping request from your computer to a server IP and get a response back. One of the major reasons of network latency is because of distance between the client (your computer) and the server it is trying to access.
If your computer is in Sydney (Australia) and trying to access a server which is in San Francisco (U.S.), then the point-to-point distance between the 2 locations is more than 11,000 kilometers (KM) and the request has to go through multiple networks to reach the destination and get the response.
In the data gathered, latency has become the main measure of content presence locally or abroad. With several million rows in the data set overall, and many thousand rows per country, the measure proved far more useful for this analysis.
Multi-modal analysis (Benaglia et al., 2009) of latency also made it clear if content was in-country or not.
Latency is important as it is a good geographical indicator. Light latency on optical fiber is around eight microseconds per mile (Quigley, 2011).
Measuring the Impact of Local IXPs: Understanding Hosting Trends in the Asia-Pacific Region From the Regional Domain Perspective 11
CC BY-NC-SA 4.0internetsociety.org
@internetsociety
Geolocations
MaxMind, a geolocation tool, is not accurate for geolocating the hosts of content. The data more fairly aligns with ownership of address space. Distinguishing between where space is owned and how far away it is (in terms of latency) has provided insight into the technical operations of several hosts.
RPKI
We have a professional interest in routing security8, so Route Origin Authorization9 data has been combined with network and autonomous system numbers10 (ASN) data to measure uptake in the hosting community. Testing RPKI uptake is an important trend to analyze (Testart and Clark, 2020).
This data set specifically uses a point-in-time capture from February 9, 2021. No time-series analysis has been performed. Two possible malicious events were captured.
8 https://www.manrs.org/9 https://help.apnic.net/s/article/Resource-Public-Key-Infrastructure-RPKI10 https://blog.stackpath.com/autonomous-system-number/
Measuring the Impact of Local IXPs: Understanding Hosting Trends in the Asia-Pacific Region From the Regional Domain Perspective 12
CC BY-NC-SA 4.0internetsociety.org
@internetsociety

Visual AnalysisHosting Locations (Nations)
Figure 2 . Hosting locations around the globe by number of server networks, source: Terry Sweetser, Tableau visualization
One of the more surprising trends was the “location” of the hosted content.
As the data quality section of this report suggests, there are “locations” on the map that represent the location of the organization, not the network edge being used for content delivery.
For instance, nine domains are supposedly hosted in the Seychelles, but in fact the hosting provider is registered there only as an organization.
While the United States (U.S.) features many networks in the visualization, analysis of network metrics made it obvious that those organizations were using ARIN11 address space around the globe and not in their U.S.-registered headquarters.
11 https://www.arin.net/
Measuring the Impact of Local IXPs: Understanding Hosting Trends in the Asia-Pacific Region From the Regional Domain Perspective 13
CC BY-NC-SA 4.0internetsociety.org
@internetsociety
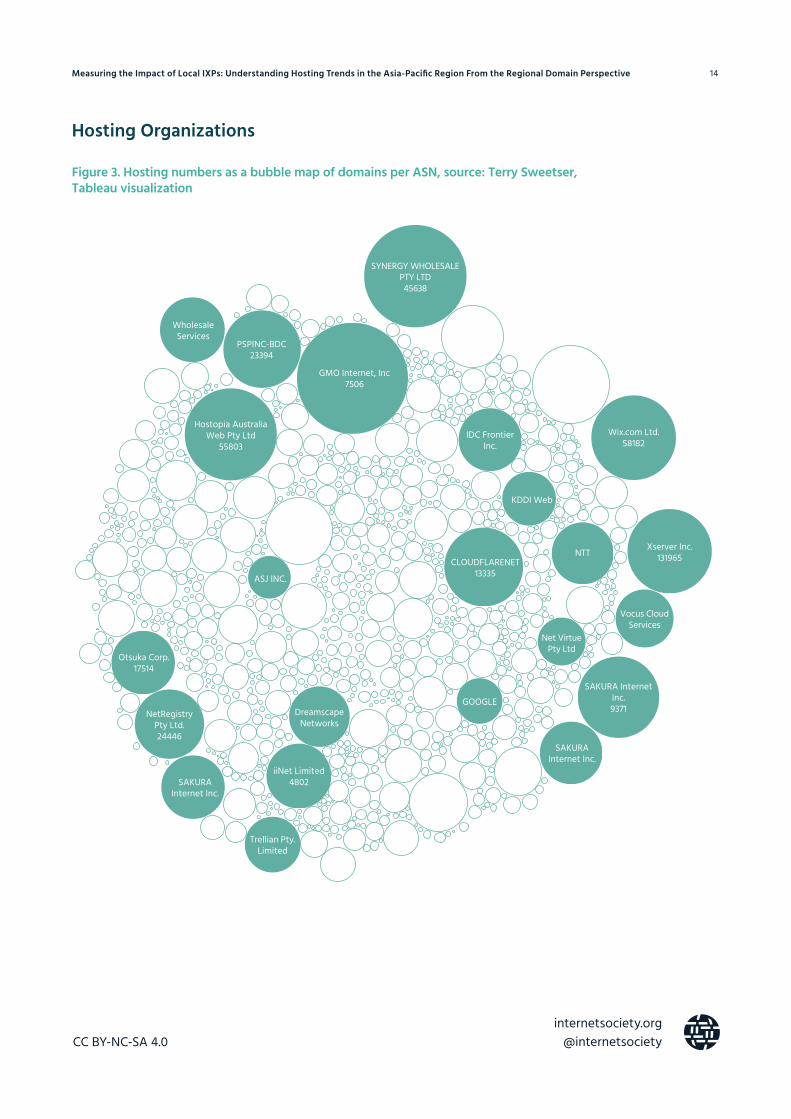
Hosting Organizations
Figure 3 . Hosting numbers as a bubble map of domains per ASN, source: Terry Sweetser, Tableau visualization
Otsuka Corp.17514
ASJ INC.
Hostopia AustraliaWeb Pty Ltd
55803
WholesaleServices
PSPINC-BDC23394
GMO Internet, Inc7506
SYNERGY WHOLESALEPTY LTD45638
IDC FrontierInc.
Wix.com Ltd.58182
KDDI Web
NTTCLOUDFLARENET
13335
Xserver Inc.131965
Vocus CloudServices
Net VirtuePty Ltd
GOOGLESAKURA Internet
Inc.9371
SAKURAInternet Inc.
DreamscapeNetworks
iiNet Limited4802SAKURA
Internet Inc.
NetRegistryPty Ltd.24446
Trellian Pty.Limited
Measuring the Impact of Local IXPs: Understanding Hosting Trends in the Asia-Pacific Region From the Regional Domain Perspective 14
CC BY-NC-SA 4.0internetsociety.org
@internetsociety

The hosting12 market is very well served by small and large firms from across the globe.
There are 224.5 domains per unique network and 736.2 domains per autonomous system number.
The top network from the data is Cloudflare, with 177,733 domains hosted and an average latency of 13.7ms.
Again, latency surfaces as a major metric, so that will be examined in detail.
12 https://en.wikipedia.org/wiki/Web_hosting_service
Measuring the Impact of Local IXPs: Understanding Hosting Trends in the Asia-Pacific Region From the Regional Domain Perspective 15
CC BY-NC-SA 4.0internetsociety.org
@internetsociety
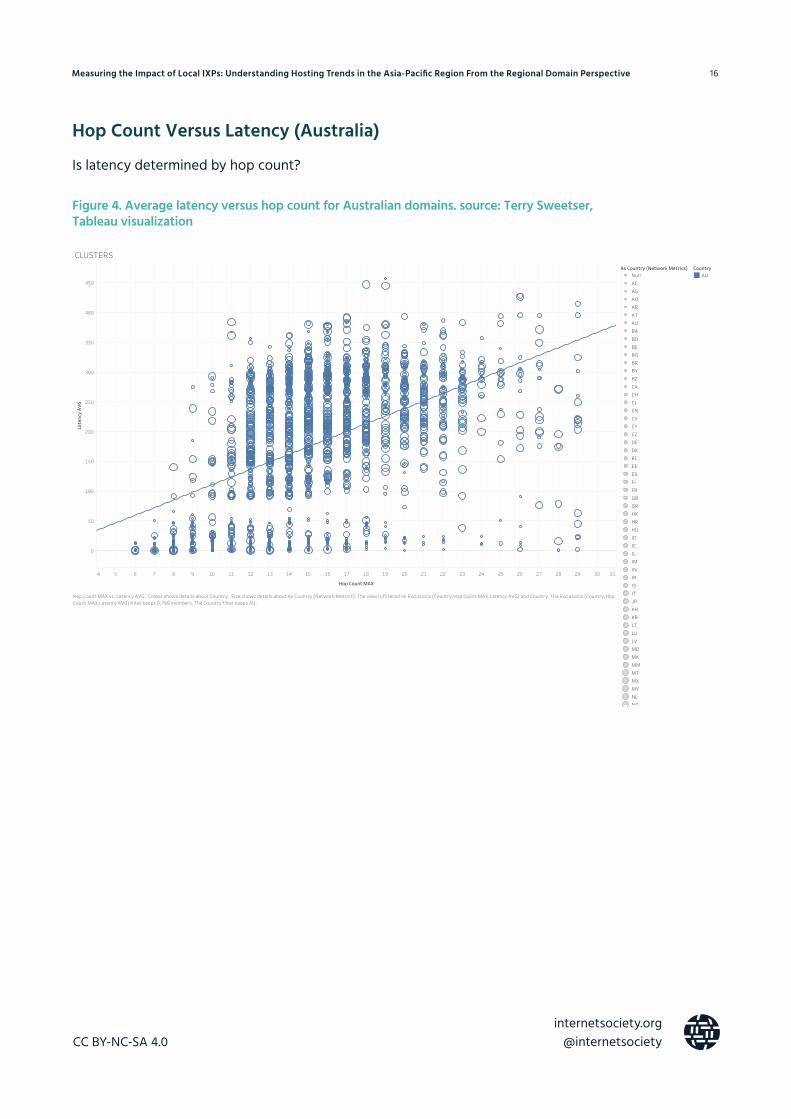
Hop Count Versus Latency (Australia)
Is latency determined by hop count?
Figure 4 . Average latency versus hop count for Australian domains . source: Terry Sweetser, Tableau visualization
4 5 6 7 8 9 10 11 12 13 14 15 16 17 18 19 20 21 22 23 24 25 26 27 28 29 30 31
Hop Count MAX
0
50
100
150
200
250
300
350
400
450
Late
ncy
AVG
CLUSTERSAs Country (Network Metrics)
NullAEAGAOARATAUBABDBEBGBRBYBZCACHCLCNCVCYCZDEDKECEEESFIFRGBGRHKHRHUIDIEILIMINIRISITJPKHKRLTLULVMDMKMMMTMXMYNLNONPNZPAPGPHPKPLPTRORSRUSASCSESGSISKSMTHTRTWUAUSVGVNZA
CountryAU
Hop Count MAX vs. Latency AVG. Colour shows details about Country. Size shows details about As Country (Network Metrics). The view is filtered on Exclusions (Country,Hop Count MAX,Latency AVG) and Country. The Exclusions (Country,HopCount MAX,Latency AVG) filter keeps 9,799 members. The Country filter keeps AU.
Measuring the Impact of Local IXPs: Understanding Hosting Trends in the Asia-Pacific Region From the Regional Domain Perspective 16
CC BY-NC-SA 4.0internetsociety.org
@internetsociety

Trend Line
Coefficients
Statistically, the conclusion is that hop count does not predict latency. It follows that hop count is not a proxy measure for the locality of hosting .
Hop count, on pure speculation, would be indicative of the number of different networks on the route between source and end user. Data gathered did not include routing information, so no specific conclusion should be drawn on hop count.
Visually, this strongly suggests clusters or multi-modal data (McLachlan et al., 2019).
Visuals for all countries show these same clusters (see Appendix 3).
P-value: < 0.0001
Equation: Latency AVG = 12.7694*Hop Count MAX + -16.981
Term Value StdErr t-value p-value
Hop Count MAX 12.7694 0.504086 25.3319 < 0.0001
Intercept -16.981 8.04546 -2.11063 0.0349164
Measuring the Impact of Local IXPs: Understanding Hosting Trends in the Asia-Pacific Region From the Regional Domain Perspective 17
CC BY-NC-SA 4.0internetsociety.org
@internetsociety

Multi-Modal Analysis13 If we take a multi-modal approach on the data by country, trends clearly emerge to indicate where hosted content is located in a country.
Noteworthy is Japan with nine out of ten ccTLD sites located within the country in the latency range of zero to twenty milliseconds at a confidence level of 99.8 percent. Follow the 1 column:
1 is substantially higher for Nepal and Bangladesh, indicating a much higher statistical error.
Doing more iterations on the Bangladesh data yielded better results for “near,” “intermediate,” “far,” and “very far” modals.
13 is mean, is standard deviation, is probability/density.
Bangladesh
Modal 1 7.79 ms 7.88 ms 18.36%
Modal 2 56.87 ms 8.68 ms 21.97%
Modal 3 132.52 ms 71.98 ms 21.22%
Model 4 274.22 ms 20.14 ms 38.45%
1 2 1 2 1 2
Japan 6.17 ms 110.03 ms 4.84 ms 59.25 ms 91.34% 8.66%
Indonesia 10.78 ms 201.86 ms 6.41 ms 90.39 ms 89.62% 10.38%
Malaysia 5.40 ms 157.86 ms 4.91 ms 86.35 ms 81.59% 18.41%
Singapore 1.98 ms 165.82 ms 0.68 ms 67.17 ms 68.00% 32.00%
Thailand 1.63 ms 73.73 ms 0.65 ms 85.31 ms 62.60% 37.40%
Nepal 35.39 ms 224.80 ms 36.66 ms 68.37 ms 59.54% 40.46%
Bangladesh 60.66 ms 272.86 ms 55.48 ms 21.50 ms 59.09% 40.91%
Philippines 21.58 ms 212.14 ms 24.64 ms 53.20 ms 42.94% 57.06%
Australia 0.80 ms 154.67 ms 0.36 ms 84.12 ms 42.78% 57.22%
India 9.95 ms 142.53 ms 10.11 ms 90.66 ms 22.53% 77.47%
Measuring the Impact of Local IXPs: Understanding Hosting Trends in the Asia-Pacific Region From the Regional Domain Perspective 18
CC BY-NC-SA 4.0internetsociety.org
@internetsociety

In Appendix 3, the attached routing data indicates that the chosen test site on AS10075 is up streamed via India and Singapore only.
Nepal has a very active local Internet exchange (NpIX - Bgp.He.Net, n.d.). A three-way split for modal analysis has far more confidence and fit.
Network PerformanceComparing the network metrics of the top ten hosts:
As discussed above, one of the major reasons for latency is distance between the host (your computer) and destination server (content). While the speed of light (in case of optical fiber cables) is constant, the only thing which can reduce the latency is if we can bring the content closer to the host by reducing the physical distance. If you are accessing content with lower latency, then it is easy to assume that the content is hosted in close vicinity but if the latency is very high then content is faraway, while “close” and “faraway” are relative terms to explain the phenomenon.
AS NAME Unique Domains Average Latency Served Countries
Cloudflarenet 177733 13.72 AU,BD,ID,IN,JP,MY,NP,PH,SG,TH
Google 164802 56.98 AU,BD,ID,IN,JP,MY,NP,PH,SG,TH
Sakura Internet Inc. 132389 8.97 AU,ID,IN,JP,MY,PH,SG,TH
GMO Internet,Inc 113085 3.24 AU,ID,IN,JP,MY,PH,SG,TH
AS-26496-GO-DADDY-COM-LLC 108045 150.15 AU,BD,ID,IN,JP,MY,NP,PH,SG,TH
Synergy Wholesale PTY LTD 99357 2.65 AU,BD,IN,JP,MY,NP,PH,SG
Hostopia Australia Web Pty Ltd 92040 2.98 AU,BD,ID,IN,JP,MY,PH,SG,TH
Dreamscape Networks Limited 81442 48.76 AU,ID,IN,JP,MY,NP,PH,SG,TH
Wix.com Ltd. 80158 158.66 AU,ID,IN,JP,MY,NP,PH,SG,TH
Unifiedlayer-AS-1 75102 211.76 AU,BD,ID,IN,JP,MY,NP,PH,SG,TH
Nepal
Modal 1 1.23 ms 0.40 ms 28.93%
Modal 2 67.67 ms 20.70 ms 31.27%
Modal 3 227.39 ms 66.03 ms 39.80%
Measuring the Impact of Local IXPs: Understanding Hosting Trends in the Asia-Pacific Region From the Regional Domain Perspective 19
CC BY-NC-SA 4.0internetsociety.org
@internetsociety

In the data for large-scale hosting operators, the first notable feature of the data is the extremes in the measures of latency. For some, it is consistently “local,” or low, in measure. For some, it is very high—so high as to indicate the content is on another continent: They are far from the local region.
Cloudflare has been using a combination of technologies in its content delivery network (CDN) service (Third Time’s the Cache, No More, 2021) to speed up site access across the globe. AS13335 is also reachable on 37 different public Internet exchanges across the region, 16 of which are in Australia alone (AS13335 Cloudflare, Inc. - bgp.he.net, n.d.).
In comparison, Wix has a presence in only three locations: San Jose (U.S.) Ashburn (U.S.), and Dublin (Ireland). All sites resolved to 29 unique IPv4 addresses, suggesting that no CDN scheme was being used. Wix is not on any public Internet exchange list.
This report used Tableau to deep dive into metrics for Cloudflare, Google, and Wix.
Cloudflare
Figure 5. Cloudflare network metrics, source: Terry Sweetser, Tableau visualizationPays en italique gras = pays des études de cas
As Country ..Country
AU BD ID IN JP MY NP PH SG THAU Hop Count (MIN)
Hop Count (AVG)Latency [ms] (MIN)Latency [ms] (AVG)
CA Hop Count (MIN)Hop Count (AVG)Latency [ms] (MIN)Latency [ms] (AVG)
US Hop Count (MIN)Hop Count (AVG)Latency [ms] (MIN)Latency [ms] (AVG)
5.45.46.06.0
27.824.1
8.58.0
15.915.9
7.07.0
0.90.46.26.0
29.627.6
7.47.0
2.31.37.17.0
1.00.96.56.0
168.6168.6
7.07.0
5.55.36.66.0
1.81.28.68.0
7.41.37.37.0
15.314.2
7.57.0
1.00.36.22.0
43.327.2
7.87.0
12.50.87.27.0
1.10.96.56.0
91.171.8
7.27.0
17.85.49.06.0
1.50.86.16.0
63.71.48.47.0
30.113.3
7.87.0
22.20.24.03.0
1.00.36.36.0
Network Metrics - CLOUDFLARENET
Hop Count (AVG), Hop Count (MIN), Latency [ms] (AVG) and Latency [ms] (MIN) broken down by Country vs. As Country (Network Metrics) on page 1 northfields av. The view is filtered on AsName (Network Metrics) and As Country (Network Metrics). The As Name (Network Metrics) filter keeps multiple members. The As Country (Network Metrics) filter keeps AU, CA and US.
Measuring the Impact of Local IXPs: Understanding Hosting Trends in the Asia-Pacific Region From the Regional Domain Perspective 20
CC BY-NC-SA 4.0internetsociety.org
@internetsociety

Figure 6 . Google network metrics, source: Terry Sweetser, Tableau visualizations
As Country ..Country
AU BD ID IN JP MY NP PH SG THAU Hop Count (MIN)
Hop Count (AVG)Latency [ms] (MIN)Latency [ms] (AVG)
BE Hop Count (MIN)Hop Count (AVG)Latency [ms] (MIN)Latency [ms] (AVG)
CH Hop Count (MIN)Hop Count (AVG)Latency [ms] (MIN)Latency [ms] (AVG)
DE Hop Count (MIN)Hop Count (AVG)Latency [ms] (MIN)Latency [ms] (AVG)
GB Hop Count (MIN)Hop Count (AVG)Latency [ms] (MIN)Latency [ms] (AVG)
HK Hop Count (MIN)Hop Count (AVG)Latency [ms] (MIN)Latency [ms] (AVG)
ID Hop Count (MIN)Hop Count (AVG)Latency [ms] (MIN)Latency [ms] (AVG)
IN Hop Count (MIN)Hop Count (AVG)Latency [ms] (MIN)Latency [ms] (AVG)
JP Hop Count (MIN)Hop Count (AVG)Latency [ms] (MIN)Latency [ms] (AVG)
SG Hop Count (MIN)Hop Count (AVG)Latency [ms] (MIN)Latency [ms] (AVG)
TW Hop Count (MIN)Hop Count (AVG)Latency [ms] (MIN)Latency [ms] (AVG)
US Hop Count (MIN)Hop Count (AVG)Latency [ms] (MIN)Latency [ms] (AVG)
2.11.6
15.015.0
174.268.523.523.0
161.142.223.322.0
243.6243.6
28.028.0
105.848.925.024.0
111.347.425.923.0
207.696.525.921.0
178.455.724.523.0
214.9131.7
24.420.0
242.8241.0
18.518.0
252.9252.9
21.021.0
121.5120.7
20.219.0
257.8257.8
20.020.0
121.7121.6
18.018.0
289.9270.1
16.016.0
143.330.321.219.0
53.41.9
21.118.0
30.59.1
23.323.0
144.674.124.222.0
177.756.422.119.0
18.714.121.919.0
74.074.019.019.0
11.80.8
15.312.0
49.016.817.9
9.0
26.21.4
14.713.0
46.626.821.410.0
11.80.7
12.89.0
66.241.116.616.0
19.26.6
18.711.0
12.71.2
14.58.0
8.41.4
17.03.0
42.513.220.910.0
52.651.920.020.0
22.40.2
14.48.0
92.235.024.121.0
42.626.621.317.0
9.00.9
20.217.0
74.921.523.211.0
113.383.921.415.0
17.16.6
22.719.0
78.22.5
22.714.0
80.954.324.416.0
29.113.521.518.0
202.862.722.318.0
78.90.7
21.112.0
102.668.723.823.0
75.942.022.219.0
78.218.922.317.0
67.047.525.224.0
12.42.1
15.210.0
192.2100.0
23.621.0
119.358.224.023.0
193.2114.3
23.819.0
73.026.415.610.0
127.10.6
19.79.0
82.816.615.8
9.0
47.037.9
8.38.0
82.56.4
18.011.0
56.81.1
16.78.0
55.81.3
13.32.0
16.513.010.5
2.0
67.523.4
7.86.0
63.50.2
13.82.0
Network Metrics - GOOGLE
Hop Count (AVG), Hop Count (MIN), Latency [ms] (AVG) and Latency [ms] (MIN) broken down by Country vs. As Country (Network Metrics) on page 1 Click Services Limited. The view is filteredon As Name (Network Metrics) and As Country (Network Metrics). The As Name (Network Metrics) filter keeps multiple members. The As Country (Network Metrics) filter keeps 12 of 98members.
Measuring the Impact of Local IXPs: Understanding Hosting Trends in the Asia-Pacific Region From the Regional Domain Perspective 21
CC BY-NC-SA 4.0internetsociety.org
@internetsociety

Wix
Figure 7 . Wix network metrics, source: Terry Sweetser, Tableau visualization
DiscussionBetween the modal analysis and visualizations of the data, there is more than sufficient evidence of both the need and the good use of peering in country for ccTLD content.
The data contains raw latency and not route paths. Each hosting firm in the region will have its own network build and peering strategy, none of which is contained in the data. Low latency is not a guarantee that the nearest Internet exchange point is in use.
Japan is by far the most successful at hosting ccTLD content in country, closely followed by Indonesia and Malaysia
ccTLD Hosted In-Country:
In Country14 Notes
Japan 91.34%
Indonesia 89.62%
Malaysia 81.59%
Singapore 68.00%
Thailand 62.60%
Philippines 42.94%
Australia 42.78% All Peering in Australia
Bangladesh 40.33% Quad-Modal; see discussion
Nepal 28.93% Tri-Modal
India 22.53%
Measuring the Impact of Local IXPs: Understanding Hosting Trends in the Asia-Pacific Region From the Regional Domain Perspective 22
CC BY-NC-SA 4.0internetsociety.org
@internetsociety

Nepal
NP-IX is the one and only IXP listed on PeeringDB in Nepal (NpIX - Bgp.He.Net, n.d.)..14
After matching data to BGP.HE.NET for Nepal, a clear example of placing ccTLD content on highly populated Internet exchange points emerges as a good technical strategy. Of the 40 networks in Nepal serving content under the ccTLD with good latency metrics, we can trace a direct relationship with NP-IX as a direct participant of the exchange and/or a downstream customer of a direct participant.
Nepal’s data exhibited a tri-model fit. Examining the central modality points to hosting providers like Digital Ocean, Google, Linode, and Cloudflare, we can see they are serving Nepal from data centers located in India and Singapore.
Bangladesh
The Sustainable Development Networking Program operates BD-IX in Dhaka. However, the test host was not connected to this local exchange (BDIX - Bgp.He.Net, n.d.)
(AS10075 Fiber@Home Global Limited - Bgp.He.Net, n.d.). Fibre@Home has upstream transit with Bangladesh Submarine Cable Company Limited (BSCCL) and Bharti Airtel. Those providers peer in Singapore and India.
As a result, in the data:
• 80 domains are hosted by BD-IX connections with an average latency of 57.84 milliseconds (ms).
• 195 domains are hosted via transit in country with an average latency of 64.89 ms.
• 489 domains are hosted abroad with an average latency of 189.13 ms.
• Foreign country hosting by ISO two-letter code: AU, CA, DE, FI, FR, GB, IN, MY, NL, PL, SG, TH, US, VG
The data analysis found distinct modals at 51.163 ms (bi-modal) and 7.79 ms and 56.87 ms latency (quad-modal), so local hosting has been classified to fit those second findings in the data.
14 The lowest mean latency that matches traffic patterns can be easily deemed “local.”
Measuring the Impact of Local IXPs: Understanding Hosting Trends in the Asia-Pacific Region From the Regional Domain Perspective 23
CC BY-NC-SA 4.0internetsociety.org
@internetsociety
Australia
Australia still operates with the gang of four paradigm (Newton, 2017). That situation continues to make business models “interesting” for local Internet providers lacking knowledge of peering.
Despite several good IXP offerings from IX Australia, Equinix, Megaport, and EdgeIX, Australians continue to host a lot of dot-AU sites outside the country.
Canada, India, Europe, Singapore, and the United States are the most popular hosting locations for ccTLD content. This very likely aligns with Australia’s cultural bias towards Singapore, the United Kingdom, and the United States (Ng & Taneja, 2019).
Australia also has a significant number of “parked” domains in the data set, where no glue exists to a website for the domain (see Appendix 7: Is There Any Glue?).
India
India has an actively developing peering ecosystem (PeeringDB, n.d.), yet ccTLD hosting is concentrated outside the country.
In the analysis, almost four of five .in domains were in the second model at 142.5 ms average latency. In distance terms, that places most ccTLD web sites outside the continent. Seventy-six foreign nations host ccTLD content for .in.
In comparison with Japan and the Philippines, India has no dominant local hosting firms or public service operators assisting to host .in locally.
Philippines
ccTLD content served from within the nation applies to two out of five websites in the data. Distinctively, the majority of those sites fall within the 22 ms latency band (50 percent of the primary modal) and are hosted on two provider networks: Cloudflare (AS13335) and PH ccTLD (AS23660).
PH ccTLD (AS23660) hosts more than 500 websites from .ph on 32 unique IPv4 addresses with a single upstream provider. Infinivan Incorporated (AS135607) is that provider, and it is present on GetaFix, PHOpenIX, HKIX, Equinix Singapore, and BBIX Tokyo, which provides good coverage for those .ph clients in the region.
Measuring the Impact of Local IXPs: Understanding Hosting Trends in the Asia-Pacific Region From the Regional Domain Perspective 24
CC BY-NC-SA 4.0internetsociety.org
@internetsociety

Thailand
Data for Thailand’s ccTLD is most notable due to the low second modal mean latency in the data, indicating that ccTLD hosting outside the country is not “far away” via regional networks.
A closer look into the data reveals a large amount of ccTLD hosting concentrated in Singapore and India. While Thailand has hosting in 42 other countries, these instances are substantially small.
Singapore
This small Southeast Asian nation is a very popular place for hosting content of all varieties, especially within the region. Many submarine cable systems land in the nation (submarine cable map, n.d.).
Singapore’s own ccTLD is 68 percent hosted in country. Malaysia and Germany appear in the data as popular locations abroad for hosting ccTLD content.
Only two local firms feature in the data for ccTLD hosting: Vodian Internet Solutions and USONYX (which also promotes .sg for hosted sites).
Malaysia
Only three nations have more than 80 percent of their ccTLD content hosted locally: Malaysia, Indonesia, and Japan. Malaysia is at 81.59 percent.
Of the top ten ccTLD hosting operations in the country, eight are Malaysian- registered firms:
CC Firm Name Domains Hosted Latency (ms)
MY Exa Bytes Network Sdn.Bhd. 14,696 1.01
US Cloudflarenet 4,644 13.90
MY IP ServerOne Solutions Sdn Bhd 3,165 2.16
MY Gigabit Hosting Sdn Bhd 2,730 1.33
MY Shinjiru Technology Sdn Bhd 2,191 2.39
MY AIMS Data Centre Sdn Bhd 2,135 5.78
MY Bigband Sdn Bhd 1,534 2.46
MY TM-VADS DC Hosting 1,513 9.87
MY SKSA Technology SDN BHD 1,166 2.12
SG Digital Ocean-ASN 980 40.79
Measuring the Impact of Local IXPs: Understanding Hosting Trends in the Asia-Pacific Region From the Regional Domain Perspective 25
CC BY-NC-SA 4.0internetsociety.org
@internetsociety
Indonesia
Indonesia has a strong local presence in the hosting industry for .id.
Seventy-five foreign AS names in country serve ccTLD content, for 34,986 domains; however, more than 600 local AS names serve up content from 42,909 domains.
The internationals are well-known operators: Hostinger International Limited, Cloudflare, Google, Digital Ocean, Linode, Amazon Web Services (AWS), and Choopa.
The leading firm in Malaysia has a local subsidiary named PT. Exabytes Network Indonesia. Otherwise, there is very little overlap between the two adjacent markets.
Japan
Japan tops the list, with 91.34 percent of ccTLD content hosted locally.
The outstanding feature of the data is the local hosting industry that dominates the .jp space:
• Sakura Internet Inc. hosting 132,062 domains.
• GMO Internet Inc hosting 112,361 domains.
• Xserver Inc. hosting 69,099 domains.
• NTT Communications Corporation hosting 25,567 domains.
• IDC Frontier Inc. hosting 17,351 domains.
Localization
The analysis of data from Indonesia, Japan and Malaysia clearly indicates that local firms that host specific content for ccTLD domains do so in country as close as possible to end users.
At the start of the project, we didn’t foresee that this would be a factor in the data. It is surprising to have found that a robust local hosting industry becomes a major facet of the ccTLD/IXP thesis.
While local IXP operators are a necessity to ensure that traffic takes a low latency route between users of the Internet and providers of content, those IXP operators are only a part of a larger business environment supporting local content delivery.
The data set strongly suggests that localization in respect of content, technical operations, and cultural factors are interdependent. This area should be examined in future research.
Measuring the Impact of Local IXPs: Understanding Hosting Trends in the Asia-Pacific Region From the Regional Domain Perspective 26
CC BY-NC-SA 4.0internetsociety.org
@internetsociety

IPv6 Adoption
The project was not able to gather IPv6 data for all parts of the data set. Several providers and several hosts were not IPv6 capable. Some comparison to global IPv6 adoption data is possible (IPv6 – Google, n.d.).
The three ccTLDs that stand out in the limited data are:
• Indonesia: far above the national rate of adoption.
• Malaysia: far below the national rate of adoption.
• Nepal: above the national rate of adoption.
Country IPv4 hosts IPv6 hosts ccTLD Google
AU 1,512,323 0 23.51%
BD 870 0 0.25%
ID 118,799 21,373 17.99% 0.99%
IN 472,042 0 57.29%
JP 531,525 0 38.64%
MY 58,209 11,097 19.06% 51.33%
NP 12,136 2,850 23.48% 13.80%
PH 25,122 0 12.74%
SG 50,101 6,697 13.37% 14.63%
TH 37,381 0 39.51%
Measuring the Impact of Local IXPs: Understanding Hosting Trends in the Asia-Pacific Region From the Regional Domain Perspective 27
CC BY-NC-SA 4.0internetsociety.org
@internetsociety

Routing Security
During data collection for the other analysis tasks on the project, Route Origin Authorization (ROA) and Route Origin Validation (ROV) were checked against gathered data and compared with the ROA snapshot.
Neither of these issues were malicious, just the result of misconfiguration (RPKI Portal, n.d.).
Business Models
For some content networks, using Internet exchange points is a key part of their business model (Cuadrado et al., 2018). Internet exchanges in general have moved from being “transit to transit” connections to “content delivery” to “eyeballs” (Carisimo et al., 2019). The way in which various hosting providers fulfill the needs of their customers is evidenced in the network metrics.
For some operators, an emphasis on technical metrics is clearly a goal of their operation, with largely distributed and very well-connected networks. Cloudflare emerges in the data for these reasons, especially for low latency. The services it offers are designed to be highly distributed and available (AS13335 Cloudflare, Inc. - Bgp.He.Net, n.d.; How Cloudflare Rocket Loader Redefines the Modern CDN, 2011).
For others, infrastructure is highly centralized in a few locations globally. Wix, with 180 million customers, has chosen to serve its content from just three discrete locations (AS58182 Wix.Com Ltd. - Bgp.He.Net, n.d.; Free Website Builder | Create a Free Website | Wix.Com, n.d.).
Country Not Found Valid Invalid
AU 2,300,593 496,963
BD 1,159 523
ID 122,324 34,597
IN 581,113 78,433
JP 570,012 201,295
MY 48,287 28,862
NP 18,625 398
PH 31,122 2,452 1
SG 49,613 16,879
TH 39,964 9,512 1
Measuring the Impact of Local IXPs: Understanding Hosting Trends in the Asia-Pacific Region From the Regional Domain Perspective 28
CC BY-NC-SA 4.0internetsociety.org
@internetsociety
The large cloud providers all feature one attribute “ubiquity”: Google, Digital Ocean, and Amazon Web Services all have global presence. Their “footprint” is mid-range on metrics and distributed across different locations. A common factor for all of the larger firms is the strategic technical priority to be well connected to the global Internet. They will peer with “eyeball” providers willingly as doing so suits their business model (Carisimo et al., 2019).
These various business models impact the metrics and the placement of the ccTLD hosting. Content placement is not actually driven by these business models but can be displaced because of the differing products purchased from each firm.
The data presented in this report shows clear evidence that a vibrant hosting industry is more likely to drive uptake of content hosting in country for any ccTLD .
Cultural Contexts
Taneja et al (2017) discuss cultural proximity and language in Internet use patterns (Ng & Taneja, 2019; Taneja, 2017):
“We had web traffic rankings available at the level of web domains. Most companies, such as Google, Amazon, eBay, Yahoo, and Microsoft, have country specific domains, but some, such as Wikipedia.org, are available worldwide as one domain, with different language subdomains. Thus, a user in Germany accesses de.wikipedia.org and a user in the United Kingdom accesses en.wikipedia.org. … Thus, we might have overestimated web use similarities between some countries, which, in turn, would mean we underestimated the role of language similarity.”
For instance, Thai websites are hosted in or near the country maybe because of differences in language and culture across borders.
While Taneja et al (2017) were able to establish patterns of usage, they were not specifically examining or testing a hypothesis on ccTLD usage. Cluster analysis did find that nations like Indonesia were alone in their cluster, but India, Sri Lanka, Maldives, Bhutan, and Bangladesh are clustered together. Interestingly, specific language groups became clusters because of their language: Brazil, Portugal, and Cape Verde, all countries where Portuguese is spoken, were a cluster (Ng & Taneja, 2019).
Measuring the Impact of Local IXPs: Understanding Hosting Trends in the Asia-Pacific Region From the Regional Domain Perspective 29
CC BY-NC-SA 4.0internetsociety.org
@internetsociety
ConclusionThe project concluded successfully with a useful data set.
A few bugs and differences in the data and methodology have led to some key learnings:
1. Data on hop count is not a useful metric for determining local hosting.
2. Latency is a key metric; however, in the future AS Path, the autonomous systems that routing information passes through to get to a specified router should be analyzed. This will formally locate the content in the global routing table.
3. Not all hosting environments are friendly toward traceroutes and other network probing.
The developed data set has clearly demonstrated that local content for ccTLD domains is best served by an ecosystem of local and international operators attached to local Internet exchange points.
In the case of Thailand, the data also supports that ccTLD operations target local populations and businesses, with the added factors of language and culture.
Comparing the top three ccTLD hosting nations and the other seven, the contrast is clear: Active IXP operations alone do not foster good local ccTLD content, and active local firms are needed to do so.
Future research needs to explore issues of culture and industry development and how they link to ccTLD and IXP utility.
Measuring the Impact of Local IXPs: Understanding Hosting Trends in the Asia-Pacific Region From the Regional Domain Perspective 30
CC BY-NC-SA 4.0internetsociety.org
@internetsociety

ReferencesAS10075 Fiber@Home Global Limited—Bgp.he.net. (n.d.). Retrieved March 27, 2021, from https://bgp.he.net/AS10075#_graph4
AS13335 Cloudflare, Inc. - Bgp.he.net. (n.d.). Retrieved March 21, 2021, from https://bgp.he.net/AS13335#_ix
AS58182 Wix.com Ltd. - Bgp.he.net. (n.d.). Retrieved March 27, 2021, from https://bgp.he.net/AS58182#_prefixes
BDIX - bgp.he.net. (n.d.). Retrieved March 27, 2021, from https://bgp.he.net/exchange/BDIX
Benaglia, T., Chauveau, D., Hunter, D., & Young, D. (2009). mixtools: An R package for analyzing finite mixture models. Journal of Statistical Software, 32(6), 1–29.
Carisimo, E., Selmo, C., Alvarez-Hamelin, J. I., & Dhamdhere, A. (2019). Studying the evolution of content providers in IPv4 and IPv6 Internet cores. Computer Communications, 145, 54–65.
Cuadrado, F., Uhlig, S., Tyson, G., & Castro, I. (2018). Open Connect Everywhere: A Glimpse at the Internet Ecosystem through the Lens of the Netflix CDN. ACM SIGCOMM Computer Communication Review.
danishahmed90. (2020, September). danishahmed90—Overview. GitHub. https://github.com/danishahmed90
Free Website Builder | Create a Free Website | Wix.com. (n.d.). Wix Hp Switch Fold. Retrieved March 27, 2021, from https://www.wix.com
Hinden, R., & Deering, S. (1995, December). Internet Protocol, Version 6 (IPv6) Specification. https://tools.ietf.org/html/rfc1883
How Cloudflare Rocket Loader Redefines the Modern CDN. (2011, June 9). The Cloudflare Blog. https://blog.cloudflare.com/how-cloudflare-rocket-loader-redefines-the-modern-cdn/
IPv6 – Google. (n.d.). Retrieved March 28, 2021, from https://www.google.com/intl/en/ipv6/statistics.html#tab=per-country-ipv6-adoption
McLachlan, G. J., Lee, S. X., & Rathnayake, S. I. (2019). Finite mixture models. Annual Review of Statistics and Its Application, 6, 355–378.
Newton, M. (2017, March 6). [AusNOG] Is there such thing as peering with Telstra in Australia. http://lists.ausnog.net/pipermail/ausnog/2017-March/038297.html
Measuring the Impact of Local IXPs: Understanding Hosting Trends in the Asia-Pacific Region From the Regional Domain Perspective 31
CC BY-NC-SA 4.0internetsociety.org
@internetsociety

Ng, Y. M. M., & Taneja, H. (2019). Mapping user-centric Internet geographies: How similar are countries in their web use patterns? Journal of Communication, 69(5), 467–489.
• NpIX - bgp.he.net. (n.d.). Retrieved March 21, 2021, from https://bgp.he.net/exchange/npIX
PeeringDB. (n.d.). Retrieved March 27, 2021, from https://peeringdb.com/search?q=India
Ping time between Singapore and other cities. (n.d.). WonderNetwork. Retrieved March 21, 2021, from https://wondernetwork.com/pings/Singapore
Quigley, B. (2011, April 7). Speed of Light in Fiber—The First Building Block of a Low-Latency Trading Infrastructure. https://www.blog.adva.com/en/speed-light-fiber-first-building-block-low-latency-trading-infrastructure
RPKI Portal. (n.d.). Retrieved March 28, 2021, from https://rpki.cloudflare.com/?view=bgp&prefix=202.171.60.0%2F24&prefixMatch=exact
Submarine Cable Map. (n.d.). https://www.Submarinecablemap.Com/. Retrieved March 27, 2021, from https://www.submarinecablemap.com/
Taneja, H. (2017). Mapping an audience-centric World Wide Web: A departure from hyperlink analysis. New Media & Society, 19(9), 1331–1348.
Testart, C., & Clark, D. D. (2020). A Data-Driven Approach to Understanding the State of Internet Routing Security. Available at SSRN 3750155.
Third Time’s the Cache, No More. (2021, March 19). The Cloudflare Blog. https://blog.cloudflare.com/third-times-the-cache-no-more/
Wikipedia. (2021). Country code top-level domain. In Wikipedia. https://en.wikipedia.org/w/index.php?title=Country_code_top-level_domain&oldid=1011213220
Measuring the Impact of Local IXPs: Understanding Hosting Trends in the Asia-Pacific Region From the Regional Domain Perspective 32
CC BY-NC-SA 4.0internetsociety.org
@internetsociety
Appendix 1: Project BriefMeasuring the Impact of Local IXPs: Understanding Hosting Trends in the Asia-Pacific Region From the Regional Domain Perspective
Background
IXPs provide an alternative to the expense of sending domestic Internet traffic abroad, only to have to return that traffic via an expensive international link. Basically, IXPs help keep local traffic local and help with cheaper, better, faster local Internet traffic exchange. The cost and quality of service that IXPs make can help ISPs (Internet service providers) and content delivery networks see the benefit of supporting IXPs.
The impact of an IXP is dynamic and can be instrumental in developing the local Internet ecosystem. IXPs can attract a range of local and international operators, which then can trigger innovation and more business opportunities. In addition, IXPs can improve local users’ quality of access by providing more-direct network connections for local content producers and consumers.
To measure the impact, we need to check if the local content is actually hosted locally and, if not, then look into the details. The first step is to measure what is hosted locally and what is not.
Because ccTLDs are used mostly by local businesses, it is safe to assume that they are targeting local audiences and should be hosted locally. For example, a local state government website for New South Wales (Australia) is targeting the residents of the state, and it is beneficial for that government entity to host it locally.
URL: https://nsw.gov.au A Records: 99.83.133.180, 75.2.117.83 whois -h whois.cymru.com 99.83.133.180 AS | IP | AS Name 16509 | 99.83.133.180 | AMAZON-02, US whois -h whois.cymru.com 75.2.117.83 AS | IP | AS Name 16509 | 75.2.117.83 | AMAZON-02, US PING 75.2.117.83 (75.2.117.83) 56(84) bytes of data. 64 bytes from 75.2.117.83: icmp_seq=1 ttl=121 time=0.792 ms --- 75.2.117.83 ping statistics --- 1 packet transmitted, 1 received, 0% packet loss, time 0ms 11 rtt min/avg/max/mdev = 0.792/0.792/0.792/0.000 ms PING 99.83.133.180 (99.83.133.180) 56(84) bytes of data.
Measuring the Impact of Local IXPs: Understanding Hosting Trends in the Asia-Pacific Region From the Regional Domain Perspective 33
CC BY-NC-SA 4.0internetsociety.org
@internetsociety

64 bytes from 99.83.133.180: icmp_seq=1 ttl=121 time=0.665 ms --- 99.83.133.180 ping statistics --- 1 packet transmitted, 1 received, 0% packet loss, time 0ms rtt min/avg/max/mdev = 0.665/0.665/0.665/0.000 ms
The above results suggest that the website is hosted with Amazon (AWS) but at Sydney node, as the ping results are from Sydney, and it is accessible locally with less than 1ms delay. If we are able to get the same data for all .au domains, then it is easy to understand the behavior at large scale.
Scope of work and deliverables:
• Study has to be conducted for the following countries in the Asia-Pacific region.
• Countries: Australia, Bangladesh, Fiji, India, Indonesia, Japan, Malaysia, Nepal, Pakistan, Philippines, Singapore, and Thailand .
Internet Society obligation:
• The Internet Society will provide the list of domains per selected ccTLD, and the list of domains will be taken from domain crawler zonefiles.io, which might contain old records with no A/AAAA15 entries and/or stale data. Such records should not be included in the study, and subdomains must be removed from the list as well.
Service provider deliverable:
• The script to fetch the desired results per ccTLD is available at GitHub, and vendor has been added to the repository. In case of any problem with the script, please open an issue on GitHub.
• Vendor must run the script from a Virtual Machine (VM) within the country to fetch the results against the list of domains provided.
• In case of any ambiguity in results, the vendor will raise the concern through GitHub.
• Highlight the government and educational/university domains in particular, while tabulating results for the country.
• Tabulate the results on the basis of in-country and out-of-country domain hosting, and also mention the domains with only A16 records and/or both A and AAAA records.
• Report should include country analysis as well as general regional analysis.
15 IP Version 6 Addresses (Hinden & Deering, 1995)16 IP Version 4 Addresses
Measuring the Impact of Local IXPs: Understanding Hosting Trends in the Asia-Pacific Region From the Regional Domain Perspective 34
CC BY-NC-SA 4.0internetsociety.org
@internetsociety
Appendix 2: Technical Methodology• Each ccTLD has a supplied list of domains to use.
• A virtual machine or a bare metal machine from a well-connected provider was used in each country.
• With the exception of blog derived domains across the sample, all domains were tested.
• The main DNS17 records resolved and used were A and AAAA records.
• Using code supplied by the project sponsor (danishahmed90, 2020), the list is crawled in parallel.
• Data on hop count and latency is saved into a temporary SQLite3 database.
• As the scripts finish, consolidated data is dumped to CSV18 format files.
• That raw data is loaded into a database on the PostgreSQL19 data.
• The MaxMind database as of early February 2021 is used to geolocate the networks loosely in the data.
• A capture of the ROA data from February 9, 2021, is used to estimate the validity and uptake of RPKI amongst the hosts.
17 DNS https://www.cloudflare.com/en-gb/learning/dns/dns-records/18 A Comma Separated Values (CSV) file is a plain text file that contains a list of data.19 Programming language - usually used to write scripts that can pull data from databases. SQL stands for Structured Query Language,
used to communicate with a database.
Measuring the Impact of Local IXPs: Understanding Hosting Trends in the Asia-Pacific Region From the Regional Domain Perspective 35
CC BY-NC-SA 4.0internetsociety.org
@internetsociety

Appendix 3: More VisualizationsBD
Figure 8 BD, Latency versus Hop Count, source: Terry Sweetser, Tableau Visualization .
NP
Figure 9 . Nepal, latency vs hop count, source: Terry Sweetser, Tableau visualization
2 3 4 5 6 7 8 9 10 11 12 13 14 15 16 17 18 19 20 21 22 23 24 25 26 27 28 29
Hop Count MAX
0
50
100
150
200
250
300
350
Late
ncy
AVG
CLUSTERSAs Country (Network Metrics)
AUBDCADEFIFRGBINMYNLPLSGTHUSVG
CountryBD
Hop Count MAX vs. Latency AVG. Colour shows details about Country. Size shows details about As Country (Network Metrics). The view is filtered on Exclusions (Country,Hop Count MAX,Latency AVG) and Country. The Exclusions (Country,HopCount MAX,Latency AVG) filter keeps 9,799 members. The Country filter keeps BD.
0 1 2 3 4 5 6 7 8 9 10 11 12 13 14 15 16 17 18 19 20 21 22 23 24 25 26 27 28 29 30 31
Hop Count MAX
0
50
100
150
200
250
300
350
Late
ncy
AVG
CLUSTERS
CountryNP
As Country (Network Metrics)NullAEAUBGBRCACYCZDEFIFRGBINJPLTLUMYNLNONPNZRORUSCSESGUAUSVG
Hop Count MAX vs. Latency AVG. Colour shows details about Country. Size shows details about As Country (Network Metrics). The view is filtered on Exclusions (Country,Hop Count MAX,Latency AVG) and Country. The Exclusions (Country,HopCount MAX,Latency AVG) filter keeps 9,799 members. The Country filter keeps NP.
Measuring the Impact of Local IXPs: Understanding Hosting Trends in the Asia-Pacific Region From the Regional Domain Perspective 36
CC BY-NC-SA 4.0internetsociety.org
@internetsociety

Others
Figure 10. Other latency vs hop count, source: Terry Sweetser, Tableau visualization
Measuring the Impact of Local IXPs: Understanding Hosting Trends in the Asia-Pacific Region From the Regional Domain Perspective 37
CC BY-NC-SA 4.0internetsociety.org
@internetsociety
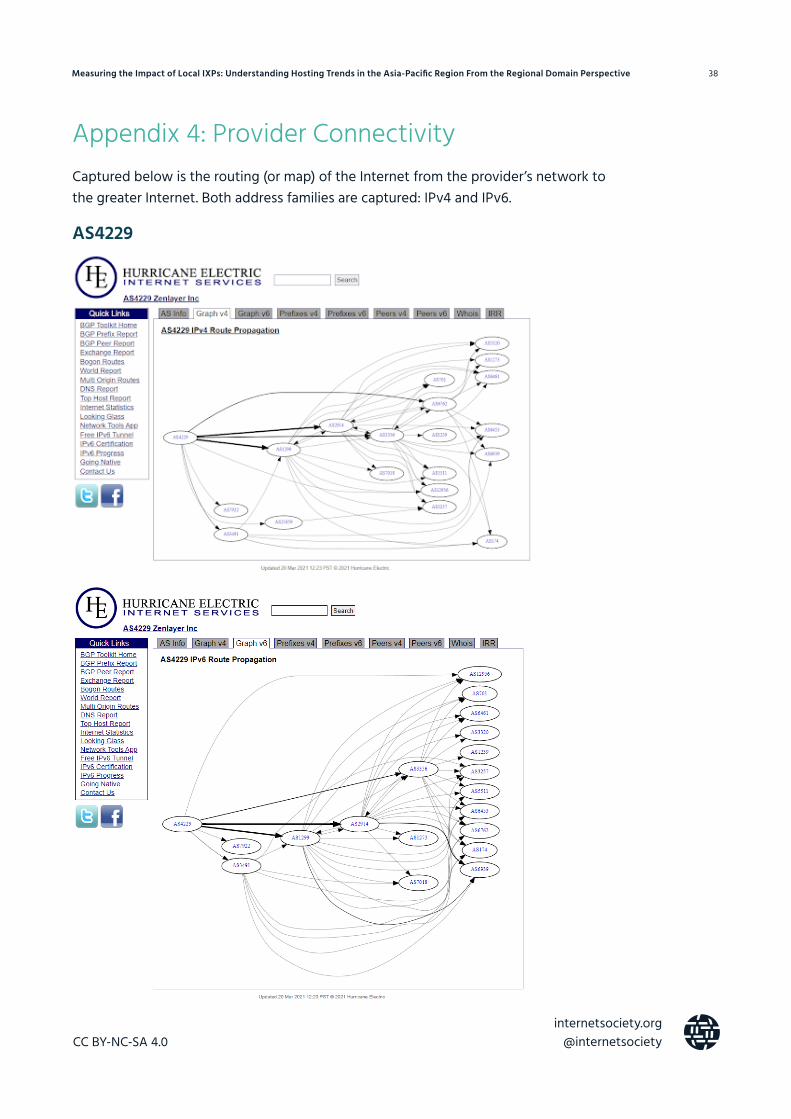
Appendix 4: Provider ConnectivityCaptured below is the routing (or map) of the Internet from the provider’s network to the greater Internet. Both address families are captured: IPv4 and IPv6.
AS4229
Measuring the Impact of Local IXPs: Understanding Hosting Trends in the Asia-Pacific Region From the Regional Domain Perspective 38
CC BY-NC-SA 4.0internetsociety.org
@internetsociety

AS21859
Measuring the Impact of Local IXPs: Understanding Hosting Trends in the Asia-Pacific Region From the Regional Domain Perspective 39
CC BY-NC-SA 4.0internetsociety.org
@internetsociety

AS20473
Measuring the Impact of Local IXPs: Understanding Hosting Trends in the Asia-Pacific Region From the Regional Domain Perspective 40
CC BY-NC-SA 4.0internetsociety.org
@internetsociety

AS45170
Measuring the Impact of Local IXPs: Understanding Hosting Trends in the Asia-Pacific Region From the Regional Domain Perspective 41
CC BY-NC-SA 4.0internetsociety.org
@internetsociety

AS10075
Measuring the Impact of Local IXPs: Understanding Hosting Trends in the Asia-Pacific Region From the Regional Domain Perspective 42
CC BY-NC-SA 4.0internetsociety.org
@internetsociety

Appendix 5: Regional Latency Data (Singapore)From Ping Time between Singapore and Other Cities, n.d.
Ping “times” are a metric relied on by providers and users across the Internet, also known as latency. The time taken for Internet traffic to traverse networks is directly proportional to distance and therefore makes for a good measure of distance.
Appendix 6: Trends in the Data Using SQL Looking for specific insights into the data and how that impacts conclusions and discussion in the report.
Data Using SQL
Top 25 Networks (IPv4)
The most popular IP address ranges for content in the project.
ccTLD=# select network(set_masklen(ipv4,24)), count(*) from data where ipv4 is not null group by 1 order by 2 desc limit 25; network | count ------------------+-------- 185.230.63.0/24 | 214023 198.185.159.0/24 | 85509 198.49.23.0/24 | 81995 157.7.107.0/24 | 44151 23.227.38.0/24 | 38525 202.124.241.0/24 | 25070 103.224.182.0/24 | 22430
City Distance Average Min Max Mdev
Jakarta 898km 13.30ms 13.04ms 14.61ms 0.33ms
Bangkok 1423km 27.22ms 26.57ms 31.15ms 1.00ms
Manila 2395km 52.08ms 51.99ms 52.28ms 0.30ms
Dhaka 2871km 54.08ms 53.37ms 56.62ms 0.73ms
Mumbai 3897km 54.34ms 54.02ms 55.56ms 0.43ms
Tokyo 5325km 69.15ms 68.97ms 69.70ms 0.34ms
Sydney 6314km 92.97ms 92.50ms 94.36ms 0.61ms
Measuring the Impact of Local IXPs: Understanding Hosting Trends in the Asia-Pacific Region From the Regional Domain Perspective 43
CC BY-NC-SA 4.0internetsociety.org
@internetsociety
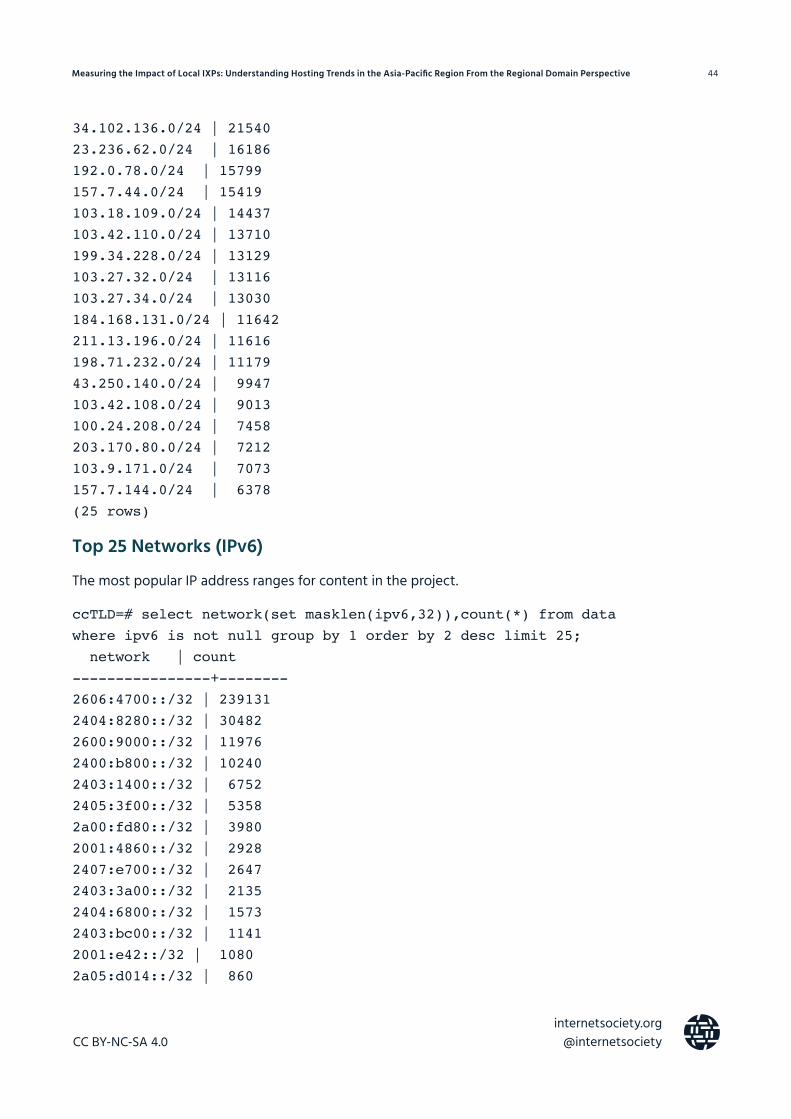
34.102.136.0/24 | 21540 23.236.62.0/24 | 16186 192.0.78.0/24 | 15799 157.7.44.0/24 | 15419 103.18.109.0/24 | 14437 103.42.110.0/24 | 13710 199.34.228.0/24 | 13129 103.27.32.0/24 | 13116 103.27.34.0/24 | 13030 184.168.131.0/24 | 11642 211.13.196.0/24 | 11616 198.71.232.0/24 | 11179 43.250.140.0/24 | 9947 103.42.108.0/24 | 9013 100.24.208.0/24 | 7458 203.170.80.0/24 | 7212 103.9.171.0/24 | 7073 157.7.144.0/24 | 6378 (25 rows)
Top 25 Networks (IPv6)
The most popular IP address ranges for content in the project.
ccTLD=# select network(set masklen(ipv6,32)),count(*) from data where ipv6 is not null group by 1 order by 2 desc limit 25; network | count ----------------+-------- 2606:4700::/32 | 239131 2404:8280::/32 | 30482 2600:9000::/32 | 11976 2400:b800::/32 | 10240 2403:1400::/32 | 6752 2405:3f00::/32 | 5358 2a00:fd80::/32 | 3980 2001:4860::/32 | 2928 2407:e700::/32 | 2647 2403:3a00::/32 | 2135 2404:6800::/32 | 1573 2403:bc00::/32 | 1141 2001:e42::/32 | 1080 2a05:d014::/32 | 860
Measuring the Impact of Local IXPs: Understanding Hosting Trends in the Asia-Pacific Region From the Regional Domain Perspective 44
CC BY-NC-SA 4.0internetsociety.org
@internetsociety

2001:df0::/32 | 798 2001:19f0::/32 | 770 2402:1f00::/32 | 734 2620:12a::/32 | 649 2406:da1c::/32 | 624 2407:d600::/32 | 616 2401:2500::/32 | 509 2a07:7800::/32 | 423 2400:6180::/32 | 405 2404:9400::/32 | 348 2401:fc00::/32 | 332 (25 rows)
Top 25 Hosting ASNs
Where are the bigger sources of ccTLD content in the data?
ccTLD=# select count(*),array_accum(distinct country) as “Serving”,network,asn,as_name,as_city,as_country,latitude, longitude from data where network is not null group by network,asn,as_name,as_city,as_country,latitude,longitude order by 1 desc limit 25;
count | Serving | network | asn | as_name | as_city | as_country | latitude | longitude
------+---------+---------+-----+---------+---------+------------+----------+-----------
214079 | {AU,JP,MY,TH} | 185.230.60.0/22 | 58182 | Wix.com Ltd. | Ashburn | US | 39.018 | -77.539
165690 | {AU,BD,JP,MY,TH} | 104.16.0.0/12 | 13335 | CLOUDFLARENET | | US | 37.751 | -97.822
85509 | {AU,BD,JP,MY,TH} | 198.185.159.0/24 | 53831 | SQUARESPACE | | US | 37.751 | -97.822
81995 | {AU,BD,JP,MY,TH} | 198.49.23.0/24 | 53831 | SQUARESPACE | | US | 37.751 | -97.822
40191 | {AU,BD,JP,MY} | 101.0.64.0/18 | 55803 | Hostopia Australia Web Pty Ltd | | AU | -37.8159 | 144.9669
38525 | {AU,JP,MY,TH} | 23.227.38.0/23 | 13335 | CLOUDFLARENET | | CA | 43.6319 | -79.3716
29657 | {AU,JP,MY} | 116.90.0.0/18 | 55803 | Hostopia Australia Web Pty Ltd | | AU | -33.494 | 143.2104
27652 | {AU,JP,MY} | 103.27.32.0/22 | 45638 | SYNERGY WHOLESALE PTY LTD | | AU | -33.494 | 143.2104
25136 | {AU,JP} | 202.124.240.0/21 | 24446 | NetRegistry Pty Ltd. | | AU | -33.494 | 143.2104
25062 | {AU,JP,MY} | 103.42.108.0/22 | 45638 | SYNERGY WHOLESALE PTY LTD | | AU | -33.494 | 143.2104
22430 | {AU,JP,MY} | 103.224.182.0/23 | 133618 | Trellian Pty. Limited | | AU | -33.494 | 143.2104
21579 | {AU,BD,JP,MY,TH} | 34.102.0.0/15 | 15169 | GOOGLE | Kansas City | US | 39.1028 | -94.5778
20563 | {AU,JP,TH} | 157.7.128.0/17 | 7506 | GMO Internet,Inc | | JP | 35.6897 | 139.6895
17367 | {AU,JP,MY} | 103.18.108.0/22 | 132680 | Net Virtue Pty Ltd | Sydney | AU | -33.8591 | 151.2002
16741 | {AU,JP} | 203.170.80.0/21 | 38719 | Dreamscape Networks Limited | | AU | -33.494 | 143.2104
16228 | {AU,JP,MY,TH} | 23.236.48.0/20 | 15169 | GOOGLE | Council Bluffs | US | 41.2619 | -95.8608
15829 | {AU,JP,MY,TH} | 192.0.64.0/18 | 2635 | AUTOMATTIC | | US | 37.751 | -97.822
15433 | {AU,JP,MY,TH} | 157.7.40.0/21 | 7506 | GMO Internet,Inc | | JP | 35.6897 | 139.6895
13655 | {AU,JP,MY,TH} | 199.34.228.0/22 | 27647 | WEEBLY | | US | 37.751 | -97.822
Measuring the Impact of Local IXPs: Understanding Hosting Trends in the Asia-Pacific Region From the Regional Domain Perspective 45
CC BY-NC-SA 4.0internetsociety.org
@internetsociety

13012 | {AU,BD,JP,MY,TH} | 198.71.128.0/17 | 26496 | AS-26496-GO-DADDY-COM-LLC | Ashburn | US | 39.0481 | -77.4728
12975 | {AU} | 103.9.168.0/22 | 45638 | SYNERGY WHOLESALE PTY LTD | | AU | -33.494 | 143.2104
11914 | {AU,JP,MY} | 122.201.64.0/18 | 38719 | Dreamscape Networks Limited | | AU | -33.494 | 143.2104
11827 | {AU,JP,MY,TH} | 13.232.0.0/13 | 16509 | AMAZON-02 | Sydney | AU | -33.8591 | 151.2002
11808 | {AU,BD,JP,MY,TH} | 184.168.128.0/17 | 26496 | AS-26496-GO-DADDY-COM-LLC | | US | 37.751 | -97.822
11326 | {AU,JP,MY,TH} | 54.248.0.0/13 | 16509 | AMAZON-02 | Sydney | AU | -33.8591 | 151.2002
(25 rows)
Appendix 7: Is There Any Glue?Is there a website or anything hosted on a domain? Some of the answers is this question are “no glue” or nothing is present.
Essentially, the domain is registered and then parked. No website or any other service is being listed in the global DNS for the domain, so the registrant is just obtaining the domain name and no other service with it.
country | Domains | IPv6 Glue | IPv4 Glue | Non-IP Glue | No Glue | Total
--------+---------+-----------+-----------+-------------+----------+-------
AU | 2,035,511 | 289,210 10.34% | 1,718,239 61.42% | 14,499 .52% | 775,608 27.72% | 2,797,556
JP | 683,137 | 25,684 3.33% | 710,829 92.16% | 1,445 .19% | 33,349 4.32% | 771,307
IN | 497,969 | 72,085 10.93% | 545,705 82.74% | 4,693 .71% | 37,063 5.62% | 659,546
ID | 106,671 | 21,710 13.83% | 125,519 79.99% | 621 .40% | 9,071 5.78% | 156,921
MY | 57,007 | 11,182 14.49% | 63,496 82.30% | 180 .23% | 2,291 2.97% | 77,149
SG | 48,350 | 6,803 10.23% | 57,669 86.73% | 175 .26% | 1,845 2.77% | 66,492
TH | 37,738 | 6,279 12.69% | 41,148 83.17% | 162 .33% | 1,888 3.82% | 49,477
PH | 25,129 | 3,916 11.66% | 29,110 86.70% | 137 .41% | 412 1.23% | 33,575
BD | 1,368 | 136 8.09% | 1,194 70.99% | 43 2.56% | 309 18.37% | 1,682
(9 rows)
Measuring the Impact of Local IXPs: Understanding Hosting Trends in the Asia-Pacific Region From the Regional Domain Perspective 46
CC BY-NC-SA 4.0internetsociety.org
@internetsociety