measuring the impact of pmtct programmes nigel rollins department of child and adolescent health and...
TRANSCRIPT

Measuring the impact of PMTCT programmes
Nigel RollinsDepartment of Child and Adolescent Health and Development
WHO

MONITORING AND EVALUATING THE PREVENTION OFMOTHER-TO-CHILD TRANSMISSION OF HIV
A GUIDE FOR NATIONAL PROGRAMMESPreliminary Version for AIDS 2010

IMPACT data
• Used to evaluate overall effectiveness of interventions• Often used for advocacy
• Needs to tell the bottom line
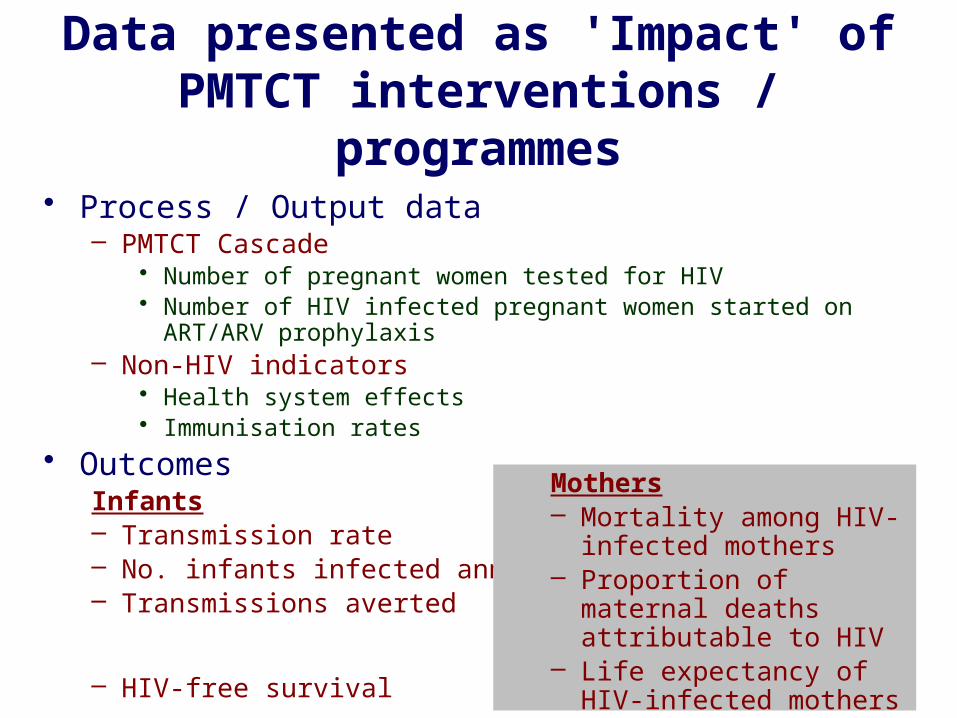
Data presented as 'Impact' of PMTCT interventions / programmes
• Process / Output data– PMTCT Cascade
• Number of pregnant women tested for HIV• Number of HIV infected pregnant women started on ART/ARV prophylaxis
– Non-HIV indicators• Health system effects• Immunisation rates
• OutcomesInfants– Transmission rate– No. infants infected annually– Transmissions averted
– HIV-free survival
Mothers– Mortality among HIV-infected
mothers– Proportion of maternal
deaths attributable to HIV– Life expectancy of HIV-
infected mothers

Leading causes of death among women of reproductive age (15-44 yrs)
World% Deaths(000s) Cause Rank
19.2 682 HIV/AIDS 1
14.6 516 Maternal conditions 2
6.4 228 Tuberculosis 3
4.7 168 Self-inflicted injuries 4
3.7 132 Road traffic accidents
5
Source: Women and Health report, WHO, 2009

Maternal Mortality Trends, 1980-2008
0
600
1200
1800
1980 1990 2000 2008
MM
R
Malawi Mozambique Lesotho World Cameroon
Source: Hogan et al, 2010

The global impact of ART & PMTCT scale up on child outcomes
• 430,000 new paediatric infections in 2008
• 200,000 cumulative new HIV infections in children have been averted in the past 12 years
UNAIDS, WHO AIDS epidemic update 20092
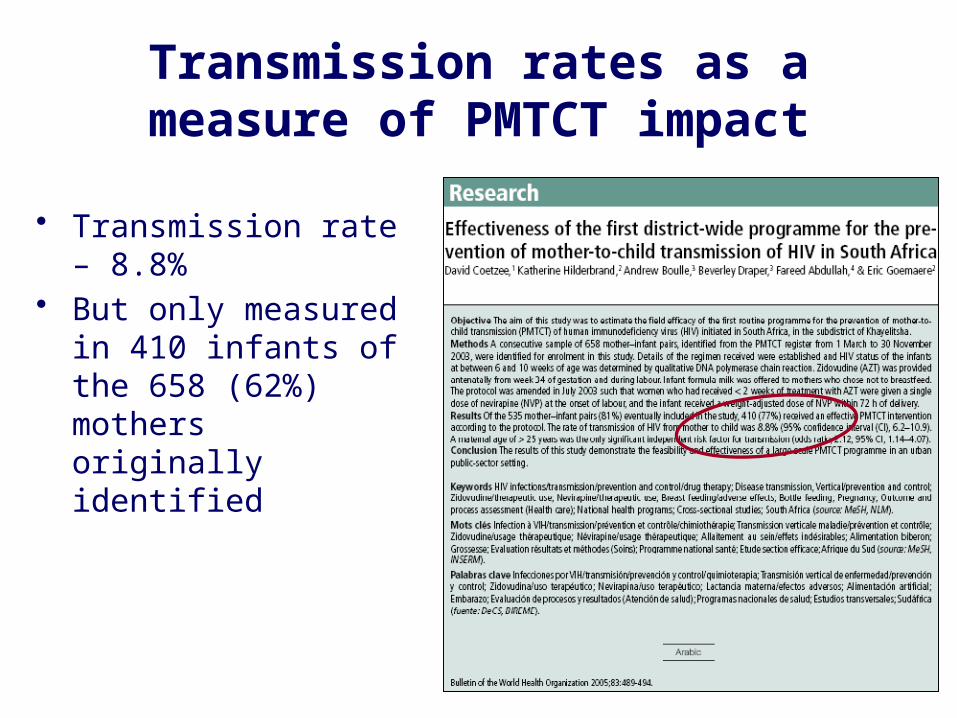
Transmission rates as a measure of PMTCT impact
• Transmission rate – 8.8%• But only measured in 410
infants of the 658 (62%) mothers originally identified

DREAM study: HIV transmission in infants born to mothers on ART
• 1,220 live born infants– 1,150 evaluable
• 1 months– RF 0.8%– BF 1.2%
• 6 months– RF 0.8%– BF 1.8%
Concluded ART 'effective'
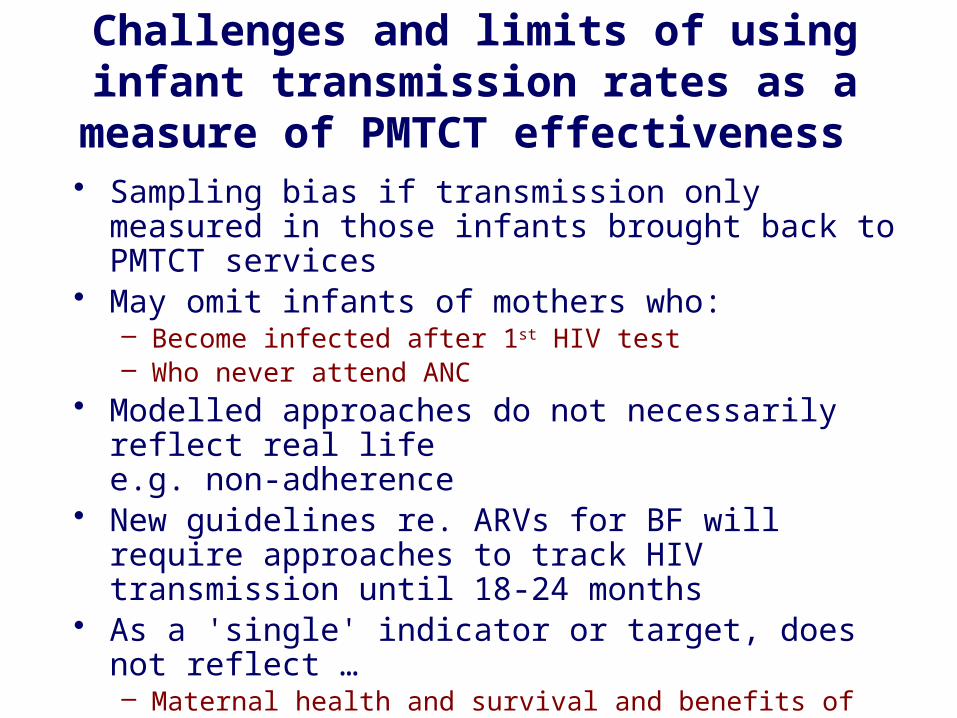
Challenges and limits of using infant transmission rates as a measure of PMTCT effectiveness
• Sampling bias if transmission only measured in those infants brought back to PMTCT services
• May omit infants of mothers who:– Become infected after 1st HIV test– Who never attend ANC
• Modelled approaches do not necessarily reflect real life e.g. non-adherence
• New guidelines re. ARVs for BF will require approaches to track HIV transmission until 18-24 months
• As a 'single' indicator or target, does not reflect …– Maternal health and survival and benefits of interventions– Success, or failure of identifying and initiating treatment of infected
infants and improved survival– Potential for improved survival if ARVs enable safer BF

Infant Mortality Rate
40
50
60
70
80
90
100
110
1999 2000 2001 2002 2003 2004 2005 2006 2007
Year
Infa
nt
Mort
ali
ty R
ate
(p
er
100,0
00 l
ive b
irth
s)FocusControl
Average Change between Pre-PEPFAR era and PEPFAR era, CI
Comparison of Average Change between Focus and Control, CI
P-value
Focus -3.18 (-5.50, -0.86)* 1.61(-2.21, 5.42) P=.246
Control -4.79(-6.28, -3.29)*
Shen. MOAE0101. IAS 2010
Another way of telling the story …
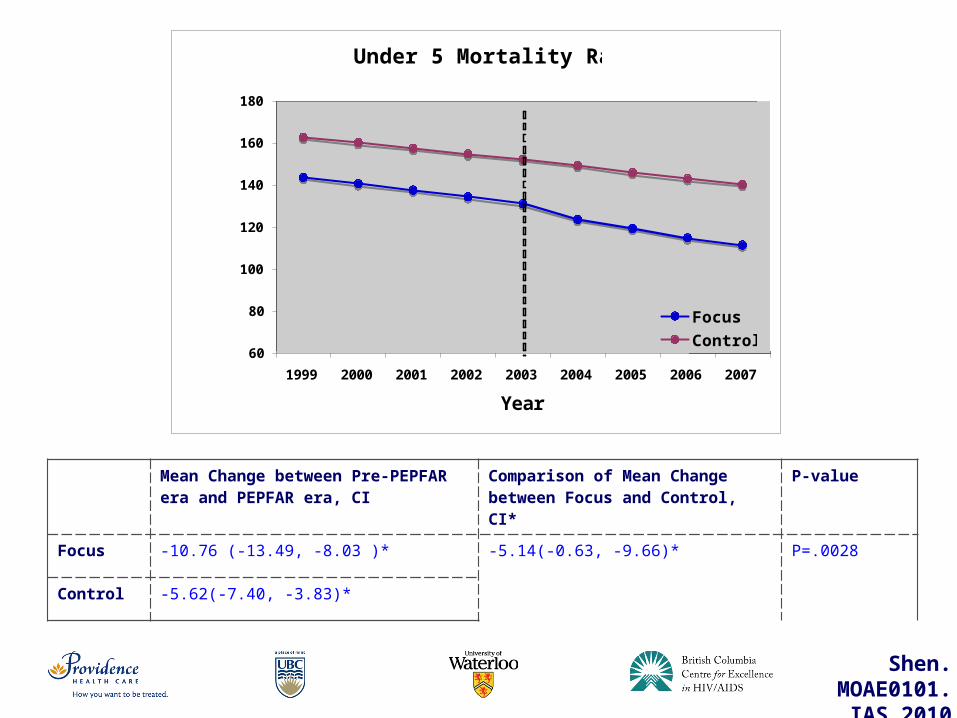
Mean Change between Pre-PEPFAR era and PEPFAR era, CI
Comparison of Mean Change between Focus and Control, CI*
P-value
Focus -10.76 (-13.49, -8.03 )* -5.14(-0.63, -9.66)* P=.0028
Control -5.62(-7.40, -3.83)*
Under 5 Mortality Rate
60
80
100
120
140
160
180
1999 2000 2001 2002 2003 2004 2005 2006 2007
Year
Un
der
5 M
ort
ality
Rate
(p
er
1,0
00 liv
e b
irth
s)
Focus
Control
Shen. MOAE0101. IAS 2010

Under-2 mortality – measured through a demographic surveillance system
Ndirangu. AIDS 2010
In the context of a comprehensive programme offering ART to mothers and ARVs for prevention of MTCT including support for appropriate infant feeding practices, mainly BF
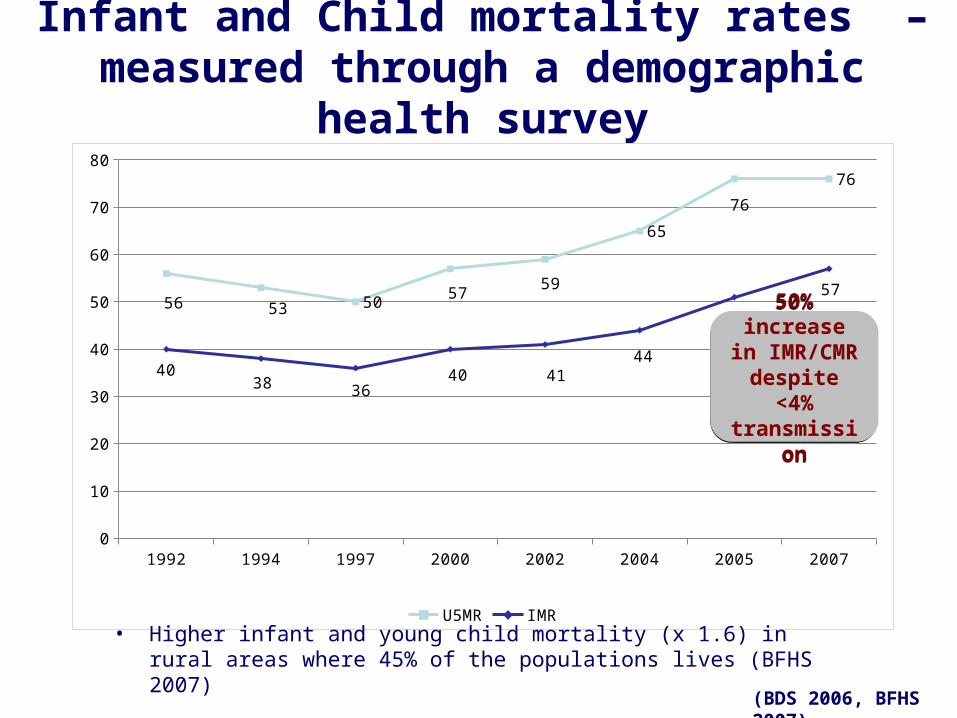
Infant and Child mortality rates – measured through a demographic health survey
1992 1994 1997 2000 2002 2004 2005 20070
10
20
30
40
50
60
70
80
56 53 50 57 59
65
76
76
4038 36
40 4144
51
57
U5MR IMR
50% increase in IMR/CMR
despite <4%transmission
50% increase in IMR/CMR
despite <4%transmission
• Higher infant and young child mortality (x 1.6) in rural areas where 45% of the populations lives (BFHS 2007)
(BDS 2006, BFHS 2007)
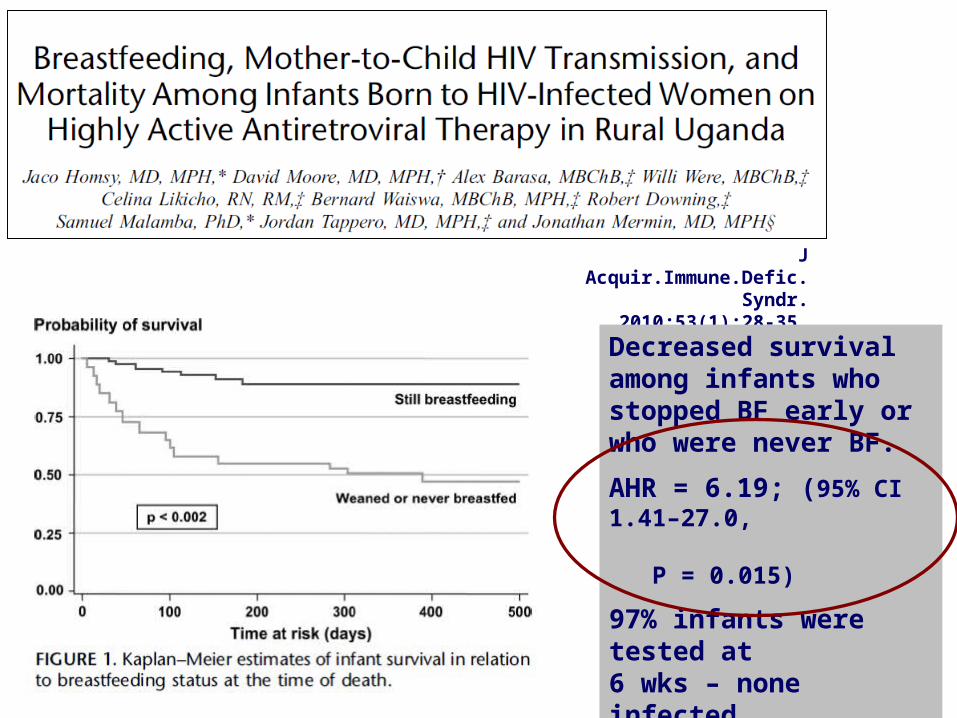
J Acquir.Immune.Defic.Syndr. 2010;53(1):28-35
Decreased survival among infants who stopped BF early or who were never BF.
AHR = 6.19; (95% CI 1.41–27.0, P = 0.015)
97% infants were tested at 6 wks – none infected.
Difference was independent of maternal health or if receiving ART

East Africa
Proportion of HIV-related under-5 mortality in African sub-regions, 1990-2007
Central AfricaWest Africa
1990
1991
1992
1993
1994
1995
1996
1997
1998
1999
2000
2001
2002
2003
2004
2005
2006
2007
Prop
orti
on (
%)
25
20
15
10
5
0
1990
1991
1992
1993
1994
1995
1996
1997
1998
1999
2000
2001
2002
2003
2004
2005
2006
2007
Prop
orti
on (
%)
25
20
15
10
5
0
Southern Africa
1990
1991
1992
1993
1994
1995
1996
1997
1998
1999
2000
2001
2002
2003
2004
2005
2006
2007
Prop
orti
on (
%)
25
20
15
10
5
0
1990
1991
1992
1993
1994
1995
1996
1997
1998
1999
2000
2001
2002
2003
2004
2005
2006
2007
Prop
orti
on (
%)
25
20
15
10
5
0
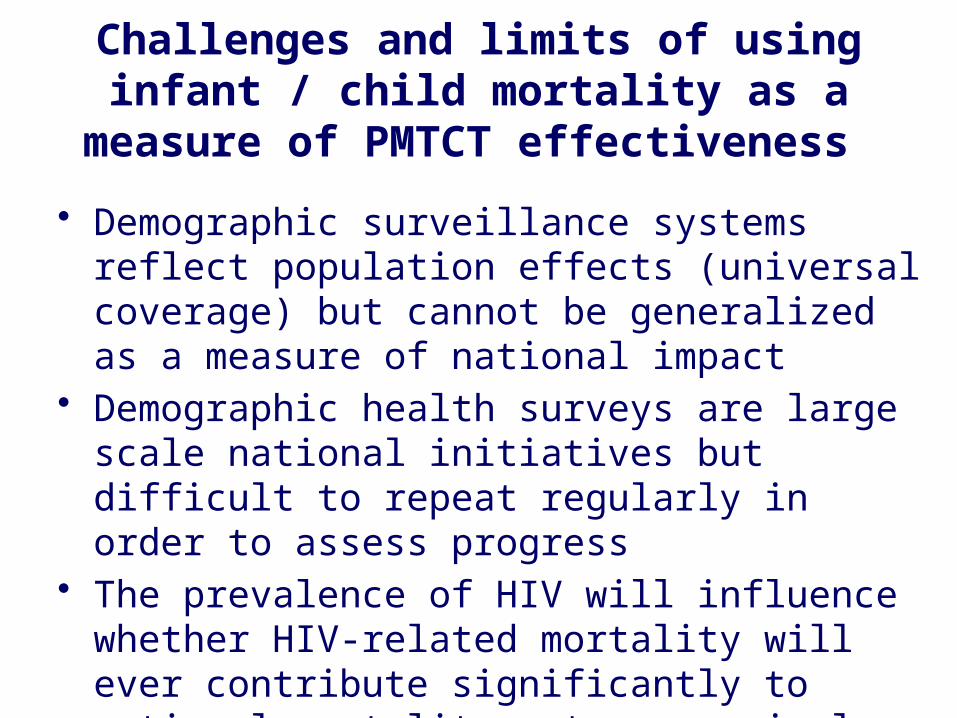
Challenges and limits of using infant / child mortality as a measure of PMTCT effectiveness
• Demographic surveillance systems reflect population effects (universal coverage) but cannot be generalized as a measure of national impact
• Demographic health surveys are large scale national initiatives but difficult to repeat regularly in order to assess progress
• The prevalence of HIV will influence whether HIV-related mortality will ever contribute significantly to national mortality rates esp. in low prevalence settings
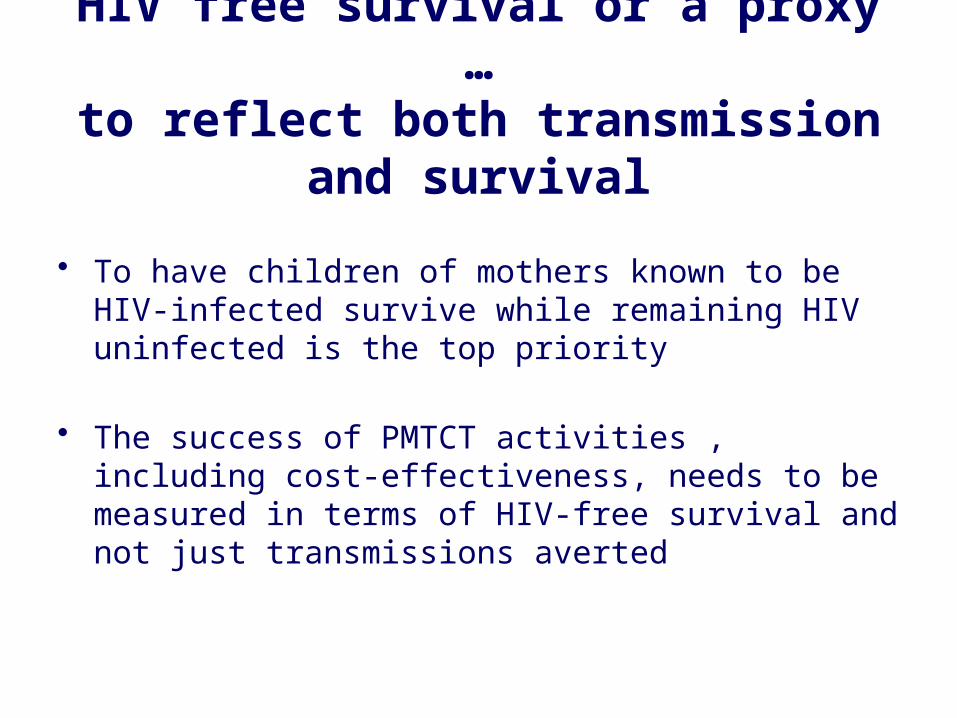
HIV free survival or a proxy …to reflect both transmission and survival
• To have children of mothers known to be HIV-infected survive while remaining HIV uninfected is the top priority
• The success of PMTCT activities , including cost-effectiveness, needs to be measured in terms of HIV-free survival and not just transmissions averted

Impact assessments• Meaningful
– Tells the full story• Measurable
– ?HIV-FS• Population-based.
– Achieving 'Universal coverage'.• Robust
– Snapshots ……. Trends• Replicable within a reasonable timeline
– Within country or district health systems– Between countries
• Relevant for high and low prevalence settings
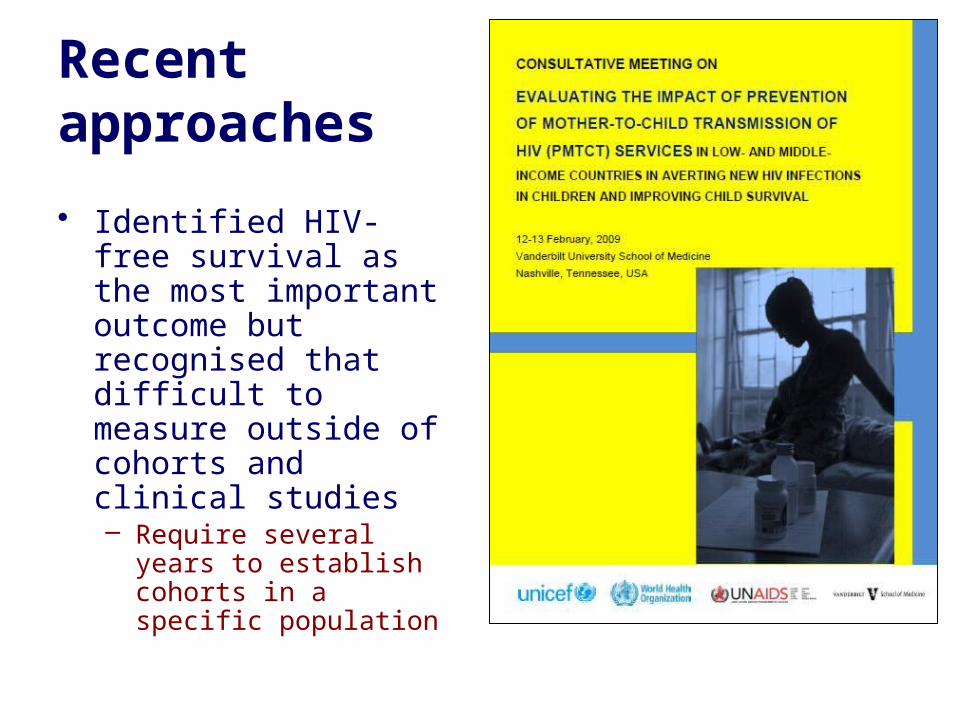
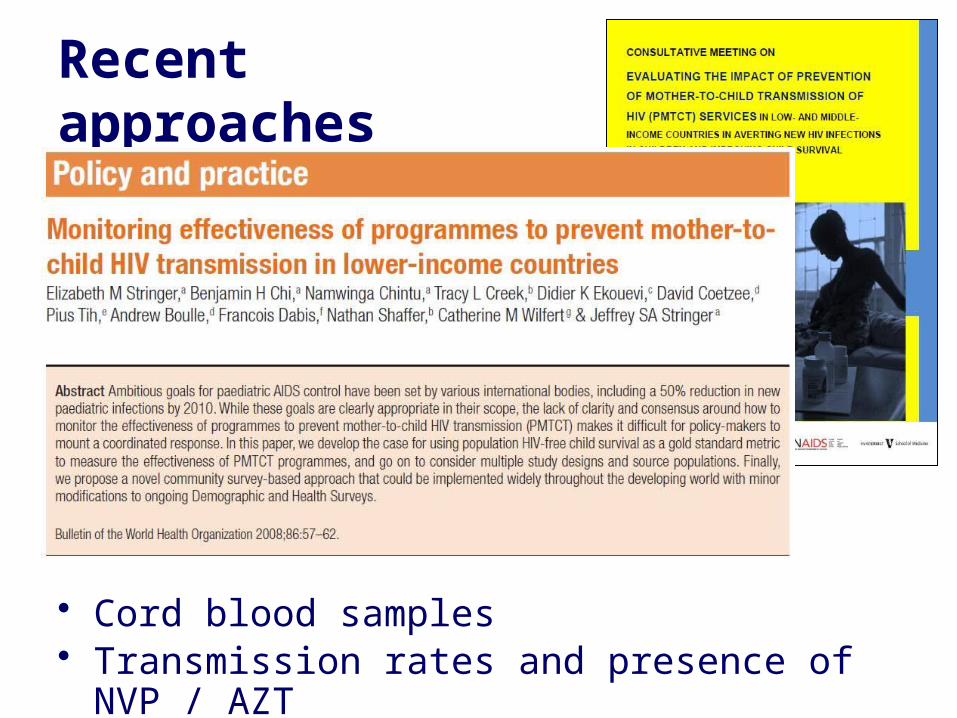
Recent approaches
• Identified HIV-free survival as the most important outcome but recognised that difficult to measure outside of cohorts and clinical studies– Require several years to
establish cohorts in a specific population
Recent approaches
• Cord blood samples• Transmission rates and presence of NVP / AZT

Using attendance at immunisation clinics to assess infant 6 week HIV prevalence and estimate trends in infant mortality rates
If immunisation attendance is high, then = a proxy for population vertical transmission rates and major effects of HIV and PMTCT interventions on infant outcomes
• Dried blood spots requested from all infants attending 6 week immunisation clinics
• DBS tested for HIV antibodies (maternal) = infant exposure
• Where antibodies detected, same sample tested for HIV by DNA PCR = infant infection
• All mothers interviewed about deaths in other children• Other information e.g. ARVs taken can also be captured• In 2009, KZN DoH assessed 6 Districts, 347 clinics
– 38,113 interviews, 8013 DBS samples from infants 6wk old– Funded through GFATM
Lancet 2002; 360:389
AIDS 2007;21(10):1341-1347
AIDS 2009;23(14):1851-7
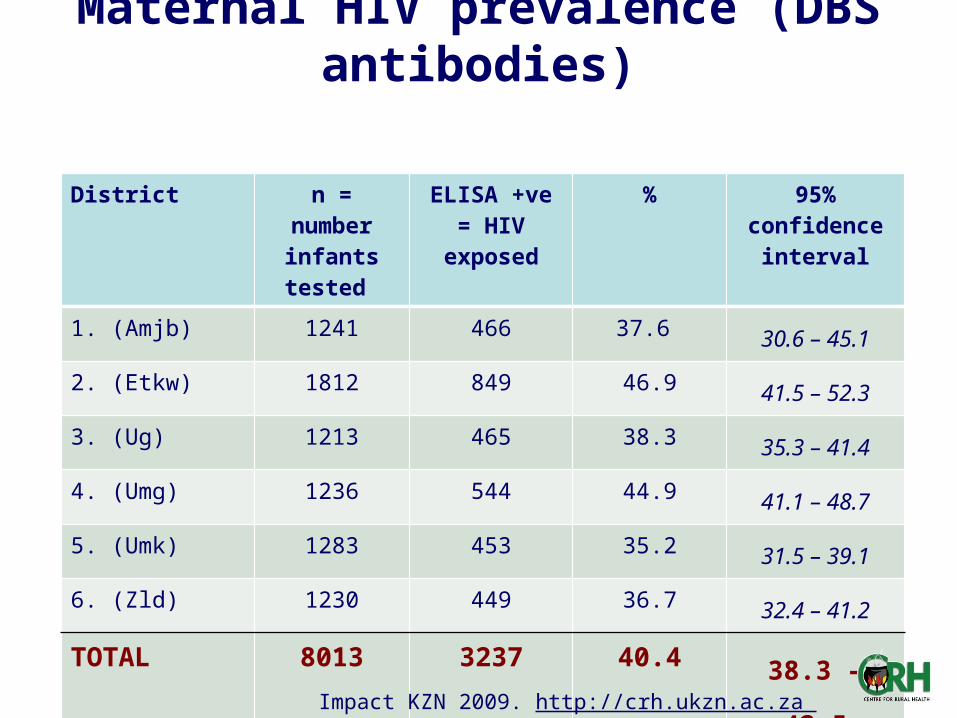
Maternal HIV prevalence (DBS antibodies)
District n = number infants tested
ELISA +ve = HIV exposed
% 95% confidence interval
1. (Amjb) 1241 466 37.6 30.6 – 45.1
2. (Etkw) 1812 849 46.9 41.5 – 52.3
3. (Ug) 1213 465 38.3 35.3 – 41.4
4. (Umg) 1236 544 44.9 41.1 – 48.7
5. (Umk) 1283 453 35.2 31.5 – 39.1
6. (Zld) 1230 449 36.7 32.4 – 41.2
TOTAL 8013 3237 40.4 38.3 – 42.5
Impact KZN 2009. http://crh.ukzn.ac.za
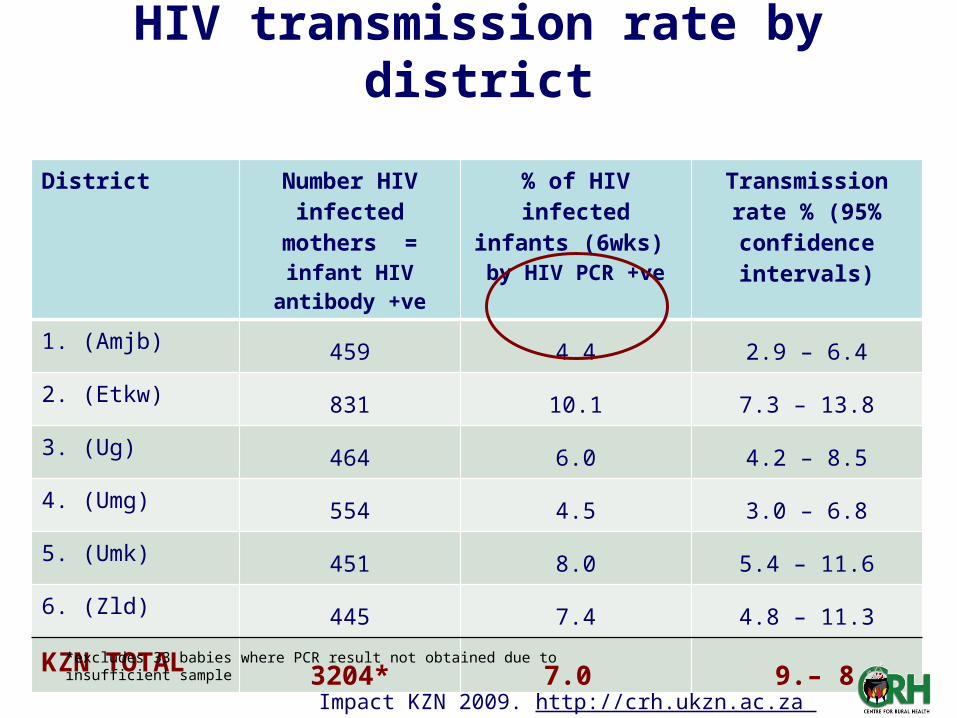
HIV transmission rate by district
District Number HIV infected mothers = infant HIV
antibody +ve
% of HIV infected infants (6wks) by HIV PCR +ve
Transmission rate % (95% confidence
intervals)
1. (Amjb) 459 4.4 2.9 – 6.4
2. (Etkw) 831 10.1 7.3 – 13.8
3. (Ug) 464 6.0 4.2 – 8.5
4. (Umg) 554 4.5 3.0 – 6.8
5. (Umk) 451 8.0 5.4 – 11.6
6. (Zld) 445 7.4 4.8 – 11.3
KZN TOTAL 3204* 7.0 9. – 8.4
*excludes 33 babies where PCR result not obtained due to insufficient sample
Impact KZN 2009. http://crh.ukzn.ac.za

HIV transmission rates by PMTCT regimen
Maternal PMTCT regimen
Number HIV infected mothers = infant HIV
antibody +ve
Transmission rate%
95% confidence intervals
None 320 15.0 11.5- 19.3
NVP only 259 13.5 8.9 – 20.1
NVP and AZT 2149 5.6 4.6 – 6.8
ART 402 5.0 3.2 – 7.6
Total 3196 7.0 5.9 – 8.4
Impact KZN 2009. http://crh.ukzn.ac.za

Infant mortality rates 1997- 2007
Year No of births reported
No of deaths aged<12 mths
IMR 95% CI
1997 1666 44 26 20.3 – 34.3
1998 1865 41 22 15.9 – 30.4
1999 2010 54 27 20.7 – 34.7
2000 2659 100 38 30.8 – 45.8
2001 2428 90 37 29.9 – 45.9
2002 2818 119 42 35.4 – 50.2
2003 3018 155 51 43.8 – 60.1
2004 3404 186 55 47.3 – 63.1
2005 3633 214 59 51.8 – 66.9
2006 3065 237 77 68.7 – 87.0
Impact KZN 2009. http://crh.ukzn.ac.za

Results: Infant mortality rate by district
District Number of previous births:
2005-2007
Number of deaths
IMR per 1000 live births
95% CI
1. (Amjb) 1048 89 84 70.7 – 101.7
2. (Etkw) 1940 165 85 72.8 – 99.1
3. (Ug) 1124 88 78 60.6 – 100.5
4. (Umg) 900 47 52 39.7 – 68.3
5. (Umk) 1476 109 73 62.7 – 86.7
6. (Zld) 1280 103 80 62.6 – 102.9
Total 7768 601 77 71.1 – 84.1
Impact KZN 2009. http://crh.ukzn.ac.za

Same methodology applied in a community-based evaluation
4258 households visited
• Number of children <18mo tested for HIV w/ evaluable EIA - 889/912 (97.5%)
• 58/885 (6.6%) HIV-infected by PCR
• IMR 67/1000 LB– 36% at home

East Africa
Proportion of HIV-related under-5 mortality in African sub-regionsCentral AfricaWest Africa
1990
1991
1992
1993
1994
1995
1996
1997
1998
1999
2000
2001
2002
2003
2004
2005
2006
2007
Prop
orti
on (
%)
25
20
15
10
5
0
1990
1991
1992
1993
1994
1995
1996
1997
1998
1999
2000
2001
2002
2003
2004
2005
2006
2007
Prop
orti
on (
%)
25
20
15
10
5
0
Southern Africa
1990
1991
1992
1993
1994
1995
1996
1997
1998
1999
2000
2001
2002
2003
2004
2005
2006
2007
Prop
orti
on (
%)
25
20
15
10
5
0
1990
1991
1992
1993
1994
1995
1996
1997
1998
1999
2000
2001
2002
2003
2004
2005
2006
2007
Prop
orti
on (
%)
25
20
15
10
5
0
Low vs. high prevalence settings
Consider IMR restricted to HIV-exposed infants

Maternal AIDS Free survival
0 4 8 12 16 20 24 28 32 36 40 44 48 52 56 60 64 68 72 76 80 84
Time since delivery (weeks)
0.60
0.65
0.70
0.75
0.80
0.85
0.90
0.95
1.00
Pro
po
rtio
n n
ot
pro
gre
ssed
Short-ARV arm
Triple-ARV arm Triple-ARV arm
Rate of progression from delivery
Kesho Bora. Th LB B105. Vienna IAS. 2010
12.4%
19.6%

Implication for evaluating the cost benefit of PMTCT investment
• Cost : benefit analyses of PMTCT investments should reflect the lifetime gains of mothers and infants surviving while being AIDS- or HIV-free and the interaction between the two– Putting a value only on infant transmissions averted
underestimates the investment• Strengthens the argument and justification for HIV
investment as a contribution to achieving MDGs 4 and 5

Conclusions
• Impact assessments need to reflect the full scope of what PMTCT aims to achieve
• Robust, simple, combined methods are available but need investment to perform
• Impact assessments need to be repeated to monitor progress towards targets and to hold global and national authorities accountable for investments made/needed
• WHO is developing protocols for national or sub-national impact assessments