measuring the informal economy in latin america and the caribbean guillermo vuletin
TRANSCRIPT

Measuring the Informal Economy in Latin America and the Caribbean
Guillermo Vuletin

Route Map• Introduction
- Definitions - Why does the informal economy (IE) arise? - Why is it important to measure the IE?
• Methods of measuring the IE - Several → MIMIC
• Empirical study - Data - Preliminary evidence - MIMIC estimation results - Informal economy estimations - Relative contribution of each cause variable
• Conclusions
Introduction
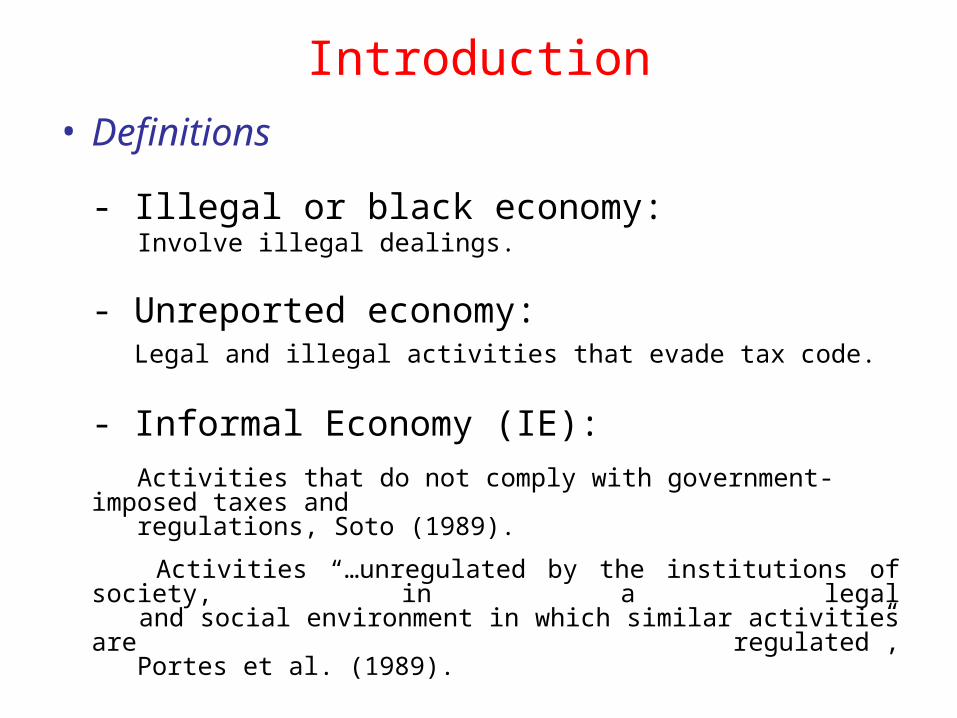
• Definitions
- Illegal or black economy: Involve illegal dealings.
- Unreported economy: Legal and illegal activities that evade tax code.
- Informal Economy (IE): Activities that do not comply with government-imposed taxes and regulations, Soto (1989).
Activities “…unregulated by the institutions of society, in a legal and social environment in which similar activities are regulated”, Portes et al. (1989).

• Why does the Informal Economy arise?
- Benefits of informal economy: Avoid “excessive” taxes and regulations.
Increase entry cost (e.g. license fees, registration requirements)
Increase cost of remain legal (e.g. taxes, red tape, labor and environmental regulations)
- Costs of informal economy:Not fully enjoy public and private services (police, courts, capital markets, insurance, social security)

• Why is it important to measure the IE?
- VAT tax evasion
- Social security system viability.
- Could reduce effectiveness of policies.
IE (early 90s) Tax evasion (early 90s)
New Zealand 12 % 5%
Sweden 16 % 6 %
Argentina 21 % 30%
Honduras 47 % 35 %
Bolivia 66 % 44 %
tax evasion = 1 – actual VAT revenue 100
potential VAT revenue
Methods of measuring the IE
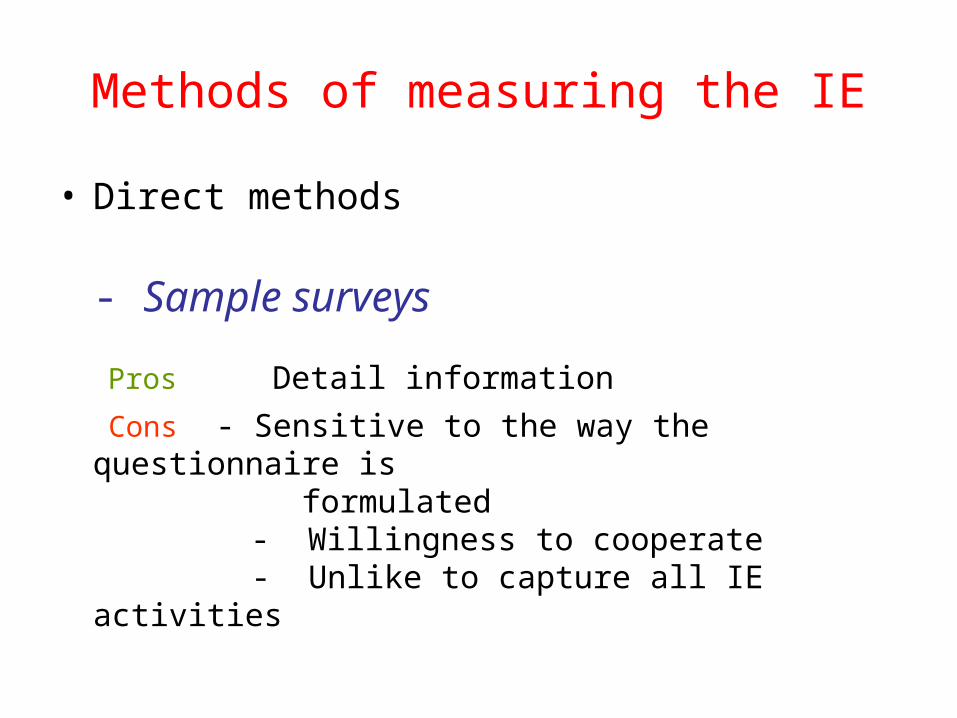
• Direct methods
- Sample surveys
Pros Detail information
Cons - Sensitive to the way the questionnaire is formulated - Willingness to cooperate - Unlike to capture all IE activities

• Indirect methods
- Electricity approach Kauffman and Kaliberda (1996)
Idea (time series):Assuming an electricity-GDP elasticity close to one, then∆ IE % = ∆ electricity consumption% - ∆ official GDP %
Pros Simple and appealing Cons - Not all IE require electricity (personal services) •
- Extra information to pin down value of IE • - Technical progress in electricity use - Differences in elasticities across countries
We DO NOT have data for ECCU

- Transactions approach Feige (1979)
Idea (time series): Changes in Money not explained by Velocity or
official GDP correspond to changes in IE.
Money ∙ Velocity = Price ∙ Transactions
Price ∙ Transactions = constant (official GDP + IE) Money ∙ Velocity = constant (official GDP + IE)
Pros Theoretically attractive Cons - Extra information to pin down value of IE •
- constant invariant over time - What is “Money” in a dollarized economy? •
Money = MLocal Currency + exch. rate ∙ MForeign Currency
(MLC + e ∙ MFC) ∙ Velocity = constant (official GDP + IE)
We DO have data for ECCU

- Currency Demand approach Tanzi (1980)
Idea (time series):Changes in not explained by the underlined below variables correspond to changes in IE.
Pros Most commonly used method Cons - Extra information to pin down value of IE •
- Not all transactions in the IE are paid in cash • - What are Money and Cash in a dollarized
economy? •
We DO have data for ECCU
)/ln()1ln()2/ln( 210 GDPwagesratetaxMcash
)ln()ln( 43 GDPpc interest rate
)2/( Mcash
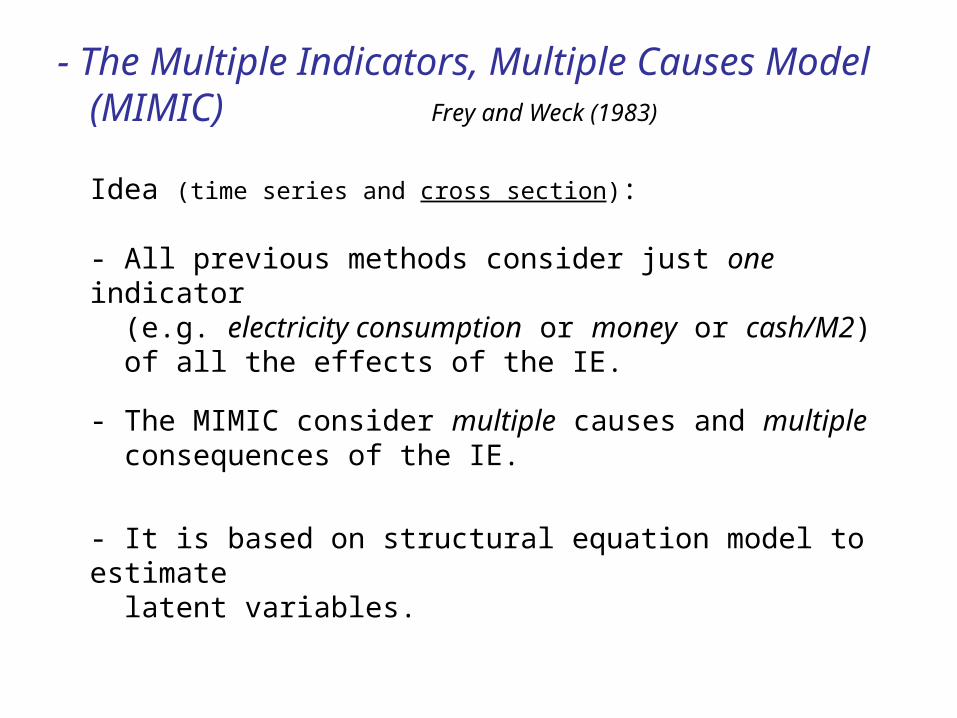
- The Multiple Indicators, Multiple Causes Model (MIMIC) Frey and Weck (1983)
Idea (time series and cross section):
- All previous methods consider just one indicator (e.g. electricity consumption or money or cash/M2) of all the effects of the IE.
- The MIMIC consider multiple causes and multiple consequences of the IE.
- It is based on structural equation model to estimate latent variables.

How does it work?
causes indicators
x1 y1
x2 Informal Economy y2
… ( IE ) …
x3 y3
- First step: estimate and .
- Second step: estimate relative distribution of IE using .
- Third step: pin down the level value of IE using extra information: time series → some year IE cross section → some country IE
xy
xIE ' IEy

Empirical Study• Several real causes and indicators.
Similar to Loayza (1996): He calculate the size of the IE for 14 Latin American countries for “early 90s”.
• Cross section of 32 countries for “early 2000s”
- 6 ECCU
- 23 western hemisphere
Chile Argentina Nicaragua Paraguay
- Cyprus, Fiji and Malta

- Variables used and expected signs
causes indicators / effects
Informal
Economy
Tax burden
+
+
-
-
-
Importance of agriculture
Inflation
Strength of enforcement
system
-
+
Labor rigidity
Workers contributing to social security
(% of LF)
Gross enrolment ratio for secondary school
Degree of unionization
+
Correlation between causes and indicators
Expected sign (+)
Expected sign (-)
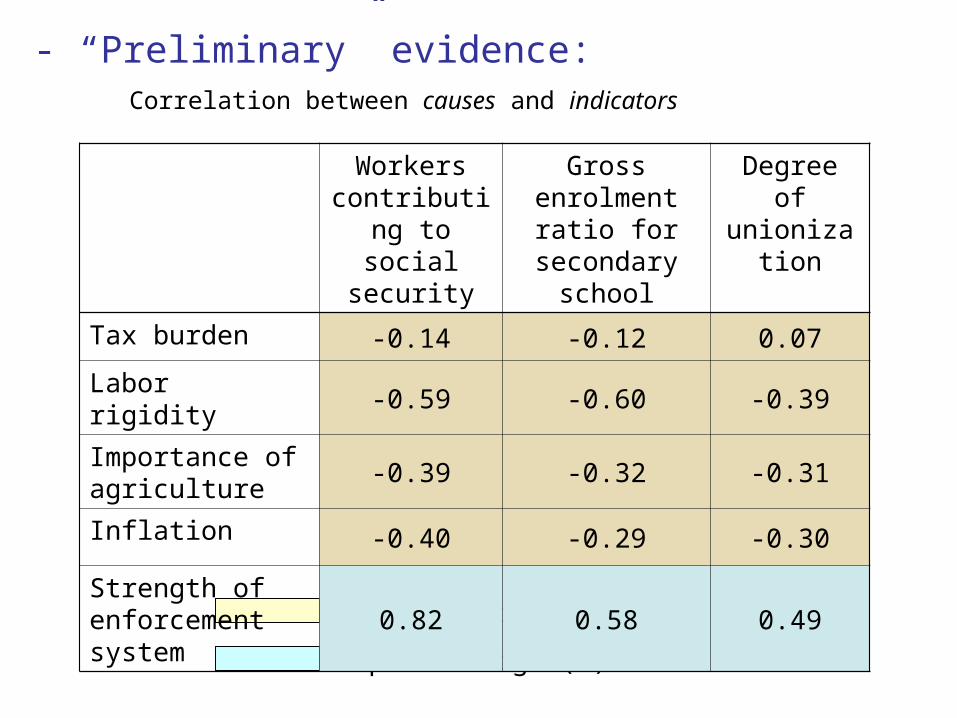
- “Preliminary” evidence:
Workers contributing to social security
Gross enrolment ratio for
secondary school
Degree of unionization
Tax burden -0.14 -0.12 0.07
Labor rigidity -0.59 -0.60 -0.39
Importance of agriculture
-0.39 -0.32 -0.31
Inflation -0.40 -0.29 -0.30
Strength of enforcement system
0.82 0.58 0.49

Unions (% of LF)
Workers contributing to social security
IE (% of LF)
Secondary gross enrollment ratio
0.404 ***
0.274 **
-0.756 ***
-0.874 ***
-0.593 ¤
Share of variance explained by the IE
35.1 %
76.3 %
57.2 %
Share of IE variance explained by the causes
78.6% Overall model fit :
Discrepancy function (CMIN) (p-value) : 0.932 > 0.05
Goodness to fit (GFI) : 0.973 > 0.9
Root mean square error of approximation (RMSEA) : 0 < 0.05
- MIMIC estimation results (Benchmark)
Labor rigidity
Importance of agriculture
Inflation
0.519 ***
0.465 ***
Tax burden

- Informal economy estimations
0
10
20
30
40
50
60
70T
he B
aham
as
Cyp
rus
Gre
nada
St.
Kit
ts a
nd N
evis
Tri
nida
d an
d T
obag
o
Bar
bado
s
Mex
ico
Bra
zil
Mal
ta
Ant
igua
and
Bar
buda
Chi
le
Arg
enti
na
Dom
inic
a
Jam
aica
Uru
guay
El S
alva
dor
Guy
ana
Per
u
St.
Luc
ia
Cos
ta R
ica
Gua
tem
ala
Ven
ezue
la
Col
ombi
a
Pan
ama
Dom
inic
an R
epub
lic
Bel
ize
St.
Vin
cent
and
the
Gre
nadi
nes
Ecu
ador
Hon
dura
s
Fij
i
Nic
arag
ua
Par
agua
y
Size
of
IE (
% o
f G
DP
)
Note: Using information from IDB that Jamaica IE is around 35%

- Relative contribution of each cause variable
Tax pressure index
Labor rigidityImportance of
agricultureInflation
Average 35 26 31 8
Antigua and Barbuda 61 31 6 2Barbados 66 0 31 3Trinidad and Tobago 61 27 7 6
Paraguay 10.4 52.4 32.7 4.5Dominican Republic 23.9 44.4 26.3 5.4
St. Lucia 32.9 16.4 48.7 2.0Belize 22.9 26.7 49.3 1.1St. Vincent and the Grenadines 33.8 23.9 41.0 1.2

Conclusions• We confirm that:
- “Excessive” taxes and labor regulations raise the IE.
- “High” inflation and importance of agriculture sector raise IE.
- Higher IE reduce worker “benefits” and school attendance.
• Sizes and factors underling the IE vary considerably among countries.
• Some policy implications:
- “Excessive” taxes: lower and homogenizing effective tax rate across sectors in the economy.
- “Excessive” labor regulations: labor market reform and flexibility.
- “High” inflation: tighten monetary and fiscal policies.
- “High” importance of agriculture sector: improve strength and expertise of government officials.