measuring the performance of knowledge management initiatives
TRANSCRIPT

Universität Augsburg, D-86135 Augsburg Visitors: Universitätsstr. 12, 86159 Augsburg Phone: +49 821 598-4801 (Fax: -4899) www.fim-online.eu
University of Augsburg
Prof. Dr. Hans Ulrich Buhl
Research Center Finance & Information Management
Department of Information Systems Engineering & Financial Management
Discussion Paper WI-135
Measuring the Performance of Knowledge Management Initiatives
by
Ulrich Faisst, Florian Resatsch1
1Institute of Electronic Business, Universität der Künste Berlin
October 2003
Presented at : OKLC 2004, Innsbruck, (Austria), April 2004

Measuring the Performance of Knowledge Management Initiatives
Florian Resatsch a,
Ulrich Faisst b
a Institute of Electronic Business Berlin University of the Arts, Germany
[email protected] b Competence Center IT & Financial Services
University of Augsburg, Germany [email protected]
Abstract
The multifarious term 'Knowledge Management' is still widely used throughout theory and
practice. Most of the worldwide top 500 companies use Knowledge Management systems to
various extents and in various forms in their daily business. Many corporations have developed
Knowledge Management initiatives; mostly without any economic evaluations. Due to more
competitive market conditions, organizations are urged to evaluate the impacts of Knowledge
Management initiatives more precisely. As existing measurement approaches solve the problem
only partially, this article develops a performance measurement framework for a Knowledge
Management initiative (according to North et al. 1998; Probst et al. 2000) including possible
indicators within each category. The article is based on research within a recent Knowledge
Management initiative at SGL CARBON, a global carbon manufacturing corporation.
Keywords: knowledge management initiative; performance measurement; intermediation. Suggested track: F
1 Introduction
Within the last years, nearly all major corporations started Knowledge Management
(KM) initiatives, particularly to strengthen the knowledge base within the organization,
especially to help employees share, activate and increase their knowledge to finally
generate a more innovative, faster acting, competitive organization. Recognizing
knowledge as the primary intangible resource to make companies more efficient and
effective was the basis for the "knowledge-based economy" and for KM. Increasingly
sophisticated customers, new technologies, eager new competitors, and the need for
more innovative products forces companies to be able to manage their knowledge
assets well. The introduction of a KM initiative is a large investment for many
corporations. Therefore performance measurement systems are required to make the
benefits and the performance of KM initiatives transparent. Especially in times of
scarce budgets the usefulness of KM is in doubt, as the business impact of such
initiatives often can be hardly quantified or is only indirectly measurable.
Despite the overwhelming feedback KM has gained in the past years, implementations
of KM initiatives often still lack an appropriate performance measurement systems
(Amelingmeyer 2000; Davenport et al. 2000; Gentsch 2000; Nonaka et al. 1995).
Current measurement approaches for Knowledge and KM, such as Tobin’s Q (North et
al. 1998) or Calculated Intangible Value (Stewart 1997), solve this problem only
partially. Facing the problem of a continuous performance measurement of results and
performance drivers of KM initiatives, this article develops a performance measurement
framework mapping the different phases of KM initiatives (following North et al. 1998
and Probst et al. 2000). This approach has been developed in a project at SGL
CARBON and is therefore applied to the specific requirements of a manufacturing
corporation.
The article starts with a short literature review on Knowledge and KM in order to define
the fundamentals (section 2). After that, current measurement approaches and their
limitations are discussed (section 3). Then a framework for performance measurement
of KM initiatives over different phases of development is presented portraying the case
of SGL CARBON (section 4). Finally, conclusions are drawn and an outlook for further
research is provided (section 5).
2 Knowledge and Knowledge Management
The last 5 years led to an immense amount of literature on Knowledge and KM (e.g.
Amelingmeyer 2000; Brooking 1999; Gentsch 2000; Lehner 2000; North et al. 1998;
Schindler 2001; Schreyögg 2001). In order to define and delimit the fundamentals and
the view on the widely used terms Knowledge and KM, a review on selected
fundamental literature is given in the following paragraphs.
2.1 Knowledge
Following Davenport and Prusak (2000): "Knowledge is a fluid mix of framed
experiences, values, contextual information and expert insight that provides a
framework for evaluating and incorporating new experiences and information."
Knowledge originates and is applied in the mind of individuals, whereas in
organizations it can be embedded in routines, processes, practices, and norms

(Davenport and Prusak 2000). It actively enables performance, problem-solving,
decision-making, learning and teaching by integrating ideas, experience, intuition, and
skills, to create value for employees, the organization, its customers, and shareholders
(Liebowitz 2000; Probst et al. 2000).
Commonly agreed, knowledge can be split into two types: explicit and tacit (Polanyi
1997 and Nonaka and Takeuchi 1995). Tacit knowledge is held by experts, having
topic specific as well as cognitive skills that contain patterns of thought or notions,
beliefs, institution and mental models. Explicit knowledge can be articulated in an
artifact of some type outside a human being and be transferred e.g. to non-experts.
Explicit knowledge is rational and includes theoretical approaches, problem solving,
manuals, and databases. The transfer of knowledge from tacit to explicit or explicit to
tacit can be viewed as a continuous learning process becoming the so-called
knowledge spiral (Nonaka and Takeuchi 1995; Senge 1990). It enables building and
conveying knowledge in need of good "Knowledge Management" to enhance the
process, finally leveraging corporate performance.
2.2 Knowledge Management
KM is about interventions in the organizations' knowledge base, which by definition
includes individual and collective intellectual assets that help an organization to
perform its tasks (Amelingmeyer 2000; Probst et al. 2000; Romhardt 1998). It
undergoes regular changes that constitute organizational learning (Senge 1990). A
review of the early KM literature shows that raw technical approaches drew the initial
interest, but are not sufficient to produce the desired outcome of KM (Davenport and
Prusak 2000; Probst et al. 2000). While intranets and information repositories may
provide means for people, they are not good in helping people apply the new
knowledge in the context of process work (Massey et al. 2002). Therefore every KM
initiative has not only technical aspects, but also involves people and processes.
Choi and Lee (2002) categorized KM from explicit- and tacit-oriented perspectives into
four styles: dynamic, system-, human-oriented, and passive (See Figure 2).

System-oriented
Passive
Dynamic
Human-oriented
Low
High
Low High
Tacit-oriented
Expl
icit-
orie
nted
Fig. 1. Choi and Lee 2002 styles of KM
The explicit-oriented level considers the degree of codifying and storage of
organizational knowledge needed for a person to use and access it. The tacit-oriented
considers the acquisition and sharing of organizational knowledge. Passive style
companies do not manage knowledge in a systematic manner and do not truly exploit
knowledge. Companies of a system-oriented style put more emphasis on codifying and
reusing knowledge, increased by the use of advanced IT systems to facilitate the
complexity of accessing and using knowledge. The management capabilities are
enhanced by group and standard training programs. The human-oriented style places
the emphasis on acquiring and sharing tacit knowledge and interpersonal experience.
Knowledge within the organization originates from informal networks with good
relationships among organizational members. Those organizations tend to seek radical
learning abilities and prefer procedures like storytelling as a way to share knowledge.
The dynamic-style is the aggressive and integrative way to manage tacit and explicit
knowledge dynamic. Chen and Lee (2002) found out that the dynamic-style results in
the best performance according their measurement study. Ensuring successful KM
requires close attention to the costs.

Figure 2 classifies different views on KM. These views are oftentimes mixed and
bundled (Probst et al. 2000, Lehner 2000).
KnowledgeKnowledge Base
ITTechnology
Controlling/PerformanceMeasurement
HumanResourcesOrganization
Strategy and Coordination
Operational View
Strategic View
Fig. 2. Classification of different views on KM (following Schauer and Frank 2002)
Considering these views on KM, this article focuses on Controlling and Performance
Measurement of Knowledge Management (Initiatives). The next section presents the
current state of measurement approaches for Knowledge and Knowledge
Management.
3 Measurement approaches for Knowledge and Knowledge Management
Current approaches can be split into a combination of objects for measuring knowledge
and knowledge management in terms of value and status. The object "knowledge"
relates to knowledge as a resource or output product, whereas the object "knowledge
management" includes all actions, structures, and processes of managing knowledge.
The column "value" describes monetary results and relations to business success,
while "status" targets the quality and development status. Practical instruments and
theoretical approaches can be determined for every quadrant; some instruments cover
more than one quadrant. Figure 3 classifies measurement approaches in four
quadrants (according to Deking 2002).

Knowledge
KnowledgeManagement
Value Status
Business Impact of Knowledge Assets
Location and Value of Knowledge Assets
Business Impact of Knowledge Management
Quality of KnowledgeManagement Initiative
Instrument (example):• Balanced Scorecard• Intellectual Capital Audits• Knowledge Portfolio• Tobin‘s Q• CIV
Instrument (example):• Analysis of Knowledge
Quality• Technology Broker
Instrument (example):• Succes Stories• Cost Saving Analysis• Scoring Models
Instrument (example):• Questioneers• Cross Organizational
Benchmarking
Fig. 3. The four quadrants of measurement enhancing the framework of Deking (2002)
According the several methods of measuring Knowledge and KM, the choice of
practicable instruments depends on the context of development status, controlling
objects, the management, the costs of implementing an instrument, and of the
initiatives' goals. Most of the existing approaches concentrate on one quadrant. A
common way to further structure KM measurement approaches is to distinguish
between deductive-summarizing and inductive-analytical approaches. The deductive-
summarizing approaches, such as Tobin's Q (North et al. 1998) or Calculated
Intangible Value (CIV) (Stewart 1997), and inductive-analytical approaches, such as
the Intellectual Capital Navigator (ICN) (Stewart 1997), Intangible Assets Monitor (IAM)
(Sveiby 1997; URL 2), the Balanced Scorecard (BSC) (Kaplan and Norton 1996) or the
Skandia Navigator (SN) (Skyrme and Amidon 1998; URL 3).

Deductive-Summarizing Approaches Inductive-Analytical ApproachesIn
tang
ible
Ass
ets
Boo
kva
lue
CalculatedIntangible Value
Tobin’s Q
EconomicValueAdded
IntangibleAssets Monitor
IntellectualCapital
Navigator
Ska
ndia
Nav
igat
or
Bala
nced
Sco
reca
rd
Fig. 4. Overview of Approaches to Evaluate Knowledge Management (North et al. 1998)
In case companies are in the same business area and market environment, deductive-
summarizing approaches concentrate on the value of intangible assets, e.g. by the
quotient of market value and book value. As aggregated values, these approaches are
able to value the organizational knowledge base, but the cause-and-effect connection
of intervention and changes in the knowledge base cannot be specified (North et al.
1998, p. 16). Inductive-analytical approaches are more suitable to connect company
objectives with specific interventions. Two types can be identified: First, the analytical
description and evaluation of different components within the organizational knowledge
base, including further intangible assets. Sveiby's IAM and Stewart's ICN are part of
this category. Second, approaches that integrate financial and non-financial indicators
to align measures with strategies, such as the BSC and the SN. As previously
mentioned, the Industrial Age business model is slowly replaced by the Information
Age model. However, many measurement approaches are based on the underlying
assumptions of the Industrial Age – the tangible-assets-based explanations (Housel
and Bell 2001). In contrast the Information Age paradigm recognizes a set of
knowledge assets distributed among machines, people, and processes to produce the
desired outputs and operate processes. KM initiatives need feedback on how well the
Knowledge is utilized within the company and provides valuable contribution to the
company success. To enable the measurement intangible assets within the

organization have to be identified and their impact on business results has to be
determined.
Most of the described existing approaches are the first step in an evaluation of
interventions and outcomes of the organization's knowledge base (Maier and Haedrich
2001). Mostly questionnaires are used to determine a subjective success. A targeted
development of the knowledge base and the reference to business results appears
difficult to establish. Most approaches concentrate on metrics that are influenced by an
abundance of single factors. Isolated successes are measured (Telephone availability),
as well as static finance indicators (North et al. 1998). Some indicators appear
confusing and may not provide a satisfactory description of the company's intangible
assets, for example in the IAM outcomes are mixed with strictly descriptive elements
(Tillquist and Rodgers 2002).
A specific case is the Balanced Scorecard (BSC) (Kaplan and Norton 1992/1996) as
the concept measures how the strategy has been implemented into operations. The
classic BSC measures performance in four perspectives: financials, customers, internal
processes, and learning and growth. These perspectives provide a balanced view on
financial and non-financial data of the present and future performance of the business.
A further development of the classic BSC are Knowledge Scorecards with perspectives
that are applied to the needs of knowledge organizations (See Deking 2002; Kaps
2001; Fairchild 2002). The previously named approaches face a drawback in terms of
the maturity of KM initiatives. An APQC study (Lopez 2001) identifies several stages of
a KM initiative within the implementation in a company and discusses different
performance measurement system in single stages. According the APQC,
measurement of KM follows a bell curve pattern through the life cycle of a business. In
the early stages of KM implementations, formal measurement rarely takes place nor is
even required. As it becomes more structured and widespread, the need for
measurement steadily increases. The objectives of the start-up phase are to generate
interest and support for KM, creating a higher value on measures, such as positive
anecdotes or stories that indicate KM as a worthwhile instrument. The pilot project
phase concentrates on more definitive measures, which develop an evidence of
success or lessons learned that could be transferred to other initiatives. For the growth
and expansion stage, KM is institutionalized across the organization and therefore
measures are needed, that represent benefits of business units or even company-wide

benefits (Lopez 2001; Fairchild 2002). Figure 4 shows the KM measurement bell curve
with a second curve that shows the growing importance of measuring the effectiveness
of knowledge-intensive business processes (Massey et al. 2002).
Stage 1Enter andAdvocate
Stage 2Explore andExperiment
Stage 3Discover and
Conduct Pilots
Stage 4Expand and
Support
Stage 5Institutionalize
Time
Impo
rtanc
e of
KM
Initi
ativ
e sp
ecifi
c m
easu
rem
ent
The Knowledge Management Bell Curve
Need for specific measurement increases as KM becomes more structured and widespread
The need to measure the effectivenessof knowledge-intensive business processes increases and quantitative financial metrics become more important.
Micro project-related metrics
Integrated performance measurement systems considering financial and non-financial results and their performance drivers
Fig. 5. The Knowledge Management Bell Curve
Since pure financial measures are not appropriate until stage four, previous stages can
be measured with quantitative and anecdotal measurement approaches. Examples in
the first two stages are the accredited budget and the number of sponsors, indicating
an increasing support for a KM project. Stage three conducts software pilots; captures
lessons learned and focuses on the business strategy, as well as cultural change is on
the way. Although sometimes suggested in several measurement concepts (Maier and
Haedrich 2001), metrics in this stage can only help determining the value and success
of implemented KM software pilot systems. The overall success of a KM initiative,
which may include programs for cultural change and process reengineering, can be
measured from stage 4 on, when multiple KM projects in different business units are
undertaken. Assuming that the previous stages proved enough commitment to officially
expand KM, it becomes part of the organization's funded activities and gets
implemented in an organizational view and in form of information technology. Each
organization has to develop its own set of approaches, adapted to its own
circumstances and problems (Probst et al. 2000). To fit the requirements a combination

of performance indicators is required (Deking 2002). A case study at SGL CARBON
showed the usability of the multidimensional measurement approach of Probst et al.
(2000) with exemplary indicators.
4 Performance Measurement of a Knowledge Management Initiative at a Manufacturing Corporation
This section develops a performance measurement framework on the case of SGL
CARBON. With more than 8 000 employees and sales revenue of €1.233 million, SGL
CARBON is the world's largest manufacturer of carbon, graphite and composite
materials for industrial and aerospace applications. SGL CARBON has more than 30
production sites, as well as a sales and service network that covers 90 countries
around the world (See SGL CARBON Annual Report 2001). The following approach to
measure the performance of a KM initiative is based on a corporation that already
finished the pilot testing and runs a working KM program matching at least stage 4 of
the APQC bell curve (Lopez 2001). Having invested money and management time in
building up KM, SGL CARBON was interested to make the impact of KM on business
results and performance drivers more transparent1. At first section 4.1 shortly describes
the requirements on performance measurement. Then section 4.2 defines the
framework and its classes of indicators I-IV, which are then presented in sections 4.3-
4.6.
4.1 Requirements on performance measurement
The industry or branch of the corporation and the corporation itself sets specific
requirements for performance measurement of KM. Manufacturing companies rely on
their knowledge workers in the same way other businesses, such as consulting or the
IT industry do. For the measurement approach at SGL CARBON, a distinction between
the overall KM initiative and the technological system of the initiative has been drawn.
The KM initiative includes organizational instruments, such as incentive systems for
cultural change, reward tenure, or process reengineering, as well as the information
technology foundation for knowledge sharing and transfer. The technology system
means the information technology level of the initiative, consisting of the company
specific definition of KM.
1 Although the framework was developed within SGL Carbon, the company did not prove the value and efficiency of the framework yet. An case study has to be concluded.

Indicators for KM initiatives can be quantitative and qualitative. Quantitative data
provides hard data to evaluate performance. Qualitative indicators should be
quantified, wherever possible or used to provide additional data for quantitative
indicators. The selected performance indicators have to be related to the business
objectives, esp. KM goals, of the corporation (Trittmann 2003). The implementation of
the framework and its performance indicators has to be in an economic relation to the
possible business improvement resulting from controlling efforts. Forcing the usage of
KM systems and investing in a cultural change, which increases the usage again, leads
to a stage, where performance indicators are required to show the impact on the
business after time - tied to the maturity of corporations' KM initiatives (Lopez 2001). A
concentration on only a part of the initiative, e.g. the system usage of knowledge tools,
would neglect financial indicators. A KM initiative may take a few years to produce real
business value (Davenport and Prusak 2000); therefore different performance
indicators for different phases are necessary (Lopez 2001). Hence, the performance
measurement framework should be flexible enough to be further developed over the
course of time. Last, but not least, the performance measurement framework also has
to be interoperable with other management instruments such as traditional accounting
or Balanced Scorecard approaches.
4.2 Overview on the developed framework
Contrary to the other measurement approaches, this article tries to figure out a way to
deal with every level of a KM initiative and different objects to enable an integrated
measurement framework. The basic requirement for metrics in this area is the
distinction of indicators to avoid mixing contents, inputs and outputs (Liebowitz 2000).
North et al. (1998) and Probst et al. (2000) differentiate four classes of indicators (see
table 1): Class I indicators describe the content of the organizational knowledge base in
qualitative and quantitative terms; class II indicators determine processes as
measurable dimensions of attempts to change the knowledge base; class III indicators
measure intermediate outcomes and transfer effects; class IV indicators evaluate the
effects of KM initiatives on business results.
Table 1. Classes of Indicators (North et. al.)
Class of indicators Definition of term
Knowledge base indicators (Class I) Constituents of the organizational knowledge base in
qualitative and quantitative terms

Cost indicators (Class II) Processes and inputs for changes in the
organizational knowledge base (Costs)
Intermediation and transfer indicators
(Class III)
Measure direct usage of the knowledge base and the
results of knowledge transfer resulting in intermediate
effects on the organization.
Effect indicators on business results
(Class IV)
Evaluation of the effects on business results
Based on the classification figured in table 1 performance indicators are defined in the
following. To meet the organization's knowledge goals, the knowledge base is changed
by targeted interventions and includes the implementation of potential portal software,
new incentive systems, and the acquisition of new knowledge from inside and outside
the company. Intermediate organizational effects are the results, leading to shorter
response times, better decision-making and thus to increasing customer satisfaction.
The transfer effects also cover the technology system with increased use, more user
satisfaction and the generation of knowledge context, in turn influencing the
organization again. The performance measurement framework (Figure 6) separates
indices into different classes to show the full context and effects of interventions in the
knowledge base. Examples of Class I to III indicators are given; Class IV indicators are
assumed to be already measured at most companies as they are basic financial
measures. The different classes of indicators in the framework include quantitative and
qualitative measures for organizational change and the underlying information
technology.
The selection of performance indicators has to be harmonized within the requirements
of the organization, esp. the general management and the management level of each
business unit. The goal of the KM initiative in the company also plays a very important
role. Therefore, the described measures present exemplary indicators that are not
mandatory for every (manufacturing) corporation, nor mandatory for companies with
the same size and revenue than SGL CARBON. To prove the resulting framework on
being applicable for other corporations and industries as well, further research in this
area should take place.

Figure 6 shows the performance measurement framework (based on North et al. 1998
and Probst et al. 2000), which locates the impact of interventions in the corporate
knowledge base and the connection between the costs of interventions and the
intermediate effects.
Cost indicators(Class II)
Knowledge base indicators (Class I)
Business results
System quality Knowledge quality(Documents)
Knowledge specificservice
Costs of interventions
Interceding processes
System usage
User satisfaction
Knowledge transferwithin the organization
Intermediation andtransfer indicators
(Class III)
Effect indicators on business results
(Class IV)
Fig. 6. Performance measurement framework for KM Initiatives
An improvement of values of performance indicators in Class I, II or III are assumed to
positively drive business results (Class IV). For example, if the company decides to
carry out targeted interventions in the knowledge base associated with higher costs,
the knowledge quality and the system quality increase. A measured higher system
quality and service lead to more interceding processes and again more budget to
further increase the knowledge base quality. The interventions in the knowledge base
produce the intermediate results including a higher user satisfaction and higher system
usage. More knowledge is shared and transferred to enlarge the knowledge specific
service for example as well as the knowledge in the heads of the employees, which is a
part of the company's knowledge base increases. Following the theory of knowledge as
a resource to business success (Wernerfelt 1984, 1995; Barney 1991), class IV
indicators should be able to prove the value of a KM initiative. Even if the intermediate
results and the causal link to a change in the company's financial results are not always
clear, this approach helps to understand the connections between the intangible
resource knowledge, the management of it and the resulting financial outcomes (Probst
et al. 2000).
4.3 Class I - Knowledge Base Indicators
By definition, Class I indicators describe the content of the organizational knowledge
base in qualitative and quantitative terms. The knowledge base consists of individual
and collective knowledge assets that the organization can use to perform its tasks
(Knowledge Quality) and the information and data that is stored in the knowledge
repositories (System and Service). Class I indicators are split into three sub factors:
Quality of the system, quality of the provided knowledge in the knowledge base, and
the knowledge specific service that is provided with the aid of an information
technology system.
System quality
Despite the various attempts to measure the creative knowledge within the heads of
the employees, we assume that it itself cannot be measured, only its outcome.
Therefore the following metrics concentrate on the measurement of the knowledge
repository's quality and the access to the knowledge base supported by the
recommended knowledge portal. The system quality can be measured with qualitative
rankings done by the users (see table 2).
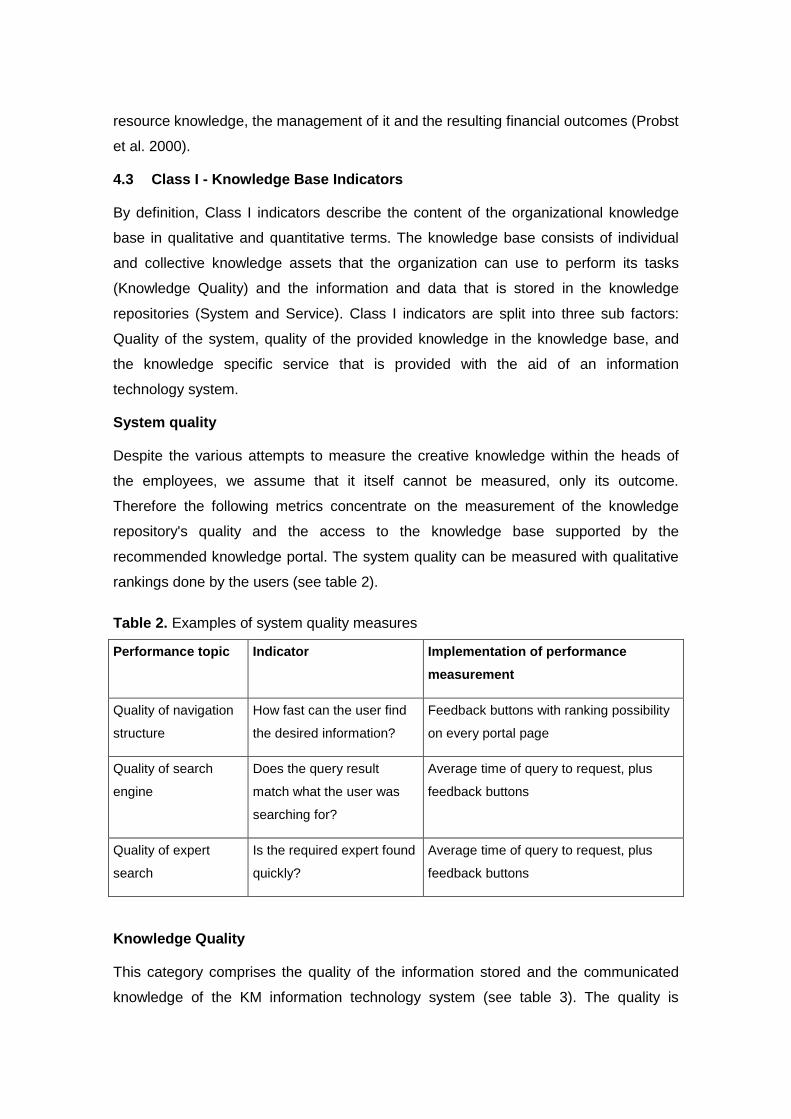
Table 2. Examples of system quality measures
Performance topic Indicator Implementation of performance
measurement
Quality of navigation
structure
How fast can the user find
the desired information?
Feedback buttons with ranking possibility
on every portal page
Quality of search
engine
Does the query result
match what the user was
searching for?
Average time of query to request, plus
feedback buttons
Quality of expert
search
Is the required expert found
quickly?
Average time of query to request, plus
feedback buttons
Knowledge Quality
This category comprises the quality of the information stored and the communicated
knowledge of the KM information technology system (see table 3). The quality is

measured by the feedback of the employees using it, with feedback buttons and
internal rankings.
Table 3. Examples of knowledge quality measures
Performance topic Indicator Implementation of performance
measurement
Quality of the content Quality of the provided
documents within the
repository
Feedback functionality attached to single
documents. Higher rated documents are
scaled up in the search lists. A repeated
usage might also indicate a high-quality
document.
Reliability, Up-to-
dateness, Relevance,
Accuracy of the
content
Are the files and documents
always up-to-date and do
they fit the user's criteria?
Internal ranking, Feedback buttons, Trust
buttons referring to author of document
Quality of experts Could the expert help? Feedback button referring to experts
Knowledge specific service
Knowledge specific service includes the distribution of information and relevant context
in order to generate new knowledge.
Table 4. Examples of knowledge specific service measures
Performance topic Indicator Implementation of performance
measurement
Quality of knowledge
distribution
Is the right knowledge at
the right time at the right
person?
Average time employees spent searching
the information
Support of
communities and
collaboration
Do communities of practice
share knowledge more
efficiently?
Feedback surveys of participants
Implementing a proper feedback function in the knowledge portal , which provides the
user interface to access important documents, enables an immediate spontaneously
vote on the quality of single functions. North et al. (1998) state several examples of

quantitative measures of the individual and collective knowledge, for example the
"number and quality of external knowledge links". Depending on the effort to measure
this, it is a practicable way to audit the company's external knowledge. A possible
internal rating of the experts helps avoiding unnecessary contacts and the waste of
time by contacting non-experts, although personal emotions might influence these
ratings. A knowledge portal can provide a rating function if all contacts are maintained
and updated regularly in the knowledge repositories.
4.4 Class II - Cost Indicators
The costs of interventions in the knowledge base influence the following intermediate
outcomes and transfer effects. Class II indicators measure not only the real dollar value
as costs, but also processes that intervene in the corporate knowledge base. Only
those costs of interventions are taken into account that can influence the knowledge
base or help accessing it. The provision of desktop computers may be a requirement to
use all the provided KM information technology, but is not a direct intervention in the
corporate knowledge base. Placing an infrastructure at the disposal to share and
distribute knowledge is an intervention to easily access the knowledge base and
considered to be of particular importance. The objective is to estimate the costs of
buying, building, implementing, and supporting any application (Harvard Computing
Group Report 1998):
Table 5. Cost types of KM initiatives
Cost types Items
Hardware Server, Network, Infrastructure
Software Portal Software, Network: One-time purchases or
development costs
Implementation Consulting, customizing, training, and testing costs;
communication costs
Support (Maintenance) Annual system administration, support, and maintenance
costs
Further expenses in the knowledge base, such as buying knowledge on CDs or hiring
consulting companies are for interest as a Class II indicator, if proven as valuable to
the company. Starting point of quantification are the costs, differentiated by one time
investments and frequent costs. Costs can be measured easily, but have to be verified

if necessary, because the relation to really use the knowledge is hard to reconstruct.
The standard Net Present Value or Total Cost of Ownership approach can be used to
determine the costs (Weishaar and Hess 2003). Interceding processes are for example
a "lessons learned" workshop or the implementation of action training. The following list
specifies several possible indicators (Liebowitz 2000):
• Training expense / Employee
• Training expense / Administrative expense
• Time in training (days/year)
• Professional development / Number of employees
• Action training / Total training
• Number of conferences attended
• Number of best practices
• Number of lessons learned workshops
The KM core processes enable many supposable indicators in this class. The
processes of knowledge acquisition and knowledge development directly influence the
company's knowledge base and can be measured by measuring the impact of single
instruments.
4.5 Class III – Intermediate and transfer indicators
The targeted interventions according to the previously defined knowledge goals should
lead to improved knowledge utilization, because the underlying knowledge base
becomes more valuable and transparent and the employees see a benefit using it.
Class III indicators can be split into three sub categories (Probst et al. 2000): The
system usage, user satisfaction, and effects on the organization and individuals, in this
framework described with the knowledge transfer indicators.
System usage
The system usage is in the currently available literature the most frequently stated
area, covering many easy quantifiable factors. Usually portal software or other KM
tools provide several possibilities to monitor the system usage, oftentimes resulting in a
statistical overflow of data. Depending on the desired information, only a few measures
should be selected and put in a monthly report to monitor the system.
Table 6. Examples of system usage measures

Cost types Items
Hardware Server, Network, Infrastructure
Software Portal Software, Network: One-time purchases or
development costs
Implementation Consulting, customizing, training, and testing costs;
communication costs
Support (Maintenance) Annual system administration, support, and maintenance
costs
Ginzberg (1981) states that the measure "Frequency of use" suffers a typical problem:
A high amount of usage may indicate an inefficient use or usability of the system, and
also effective systems are possible that are used infrequently. The system success
should rather be evaluated in terms of the way it is used, than the frequency of use.
User satisfaction
Besides the system monitoring, the end user satisfaction deeply influences the success
of a KM information technology system. A satisfied user, additionally motivated
because of incentives, will use the KM portal more frequently. In contrast to the Class I
indicator "Knowledge quality", which measures the quality of single documents or files
within the knowledge base, the Class III indicator "User satisfaction" measures the
overall affective evaluation a user has regarding his experience related with the
information system (Chin and Lee 1997). By improving the Class I "Knowledge quality"
with Class II interventions, an intermediate result would be a higher user satisfaction in
turn leading to more knowledge transfer and exchange. Doll and Torkzadeh (1998)
propose an end-user computer satisfaction model (EUCS) with five items capturing the
relevant factors that form satisfaction. A further development to this model is the
approach of Chin and Lee (1997), who focus on the same five constructs, but
specifically add new constructs to capture the satisfaction by separating expectations
from desires and argues that both have an impact in the form of the difference between
priors and post hoc usage perceptions. A frequent survey on the topic of user
satisfaction should take place to avoid that employees do not use the provided
knowledge.

Knowledge transfer
The interventions in the knowledge base cause intermediate effects on the
organization, its individuals and communities by improving the measurable knowledge
transfer. Effects on the creativity (Massetti 1996) are likewise possible as effects on
communicating behavior (Blili et al. 1998). These measurements, as suggested by
Maier and Haedrich (2001), are hard to capture and of limited expressiveness within
the company. The employee, who is affected by the initiative in anyway, may be able to
judge if his autonomy to make decisions or his creativity is enforced by the initiative,
but measuring the enhancement is only measurable through the outcome in form of
innovations or faster decisions. Through a far-reaching feedback system within the KM
system, several indicators can be measured qualitatively, e.g. if willingness to share
knowledge has risen since implementation of the portal software. The effects on
organizational capabilities can be split into the internal capabilities as seen by the
employees and management and the external capabilities as seen by the stakeholders,
especially the customers (table 7).
Table 7. Examples for Knowledge Transfer as Intermediate and Transfer Indicator (See GKEC
2002)
Performance
topic
Indicator
Knowledge
transfer from
organization to
employees
Period of vocational adjustment: The time to adjust a (new) employee to the given
processes within the company decreases, because most of the necessary knowledge is
available easier.
Knowledge
transfer from
organization to
projects
Reuse Rate: indicates the percentage of failed objects. This performance measure can
be applied to a number of "re-inventing the wheel" cases: another measure is reuse
opportunities ratio – the ratio between actual reuse content compared to opportunities.
(Dvir and Evans 2000)
Knowledge
transfer from
R&D to
production
Effectiveness of knowledge transfer from the Research & Development (R&D)
department and the production area. A rating-based performance measure shows the
closeness of working relationships between R&D and manufacturing using an internal
self-assessment based on ratings.
Knowledge
transfer from
production to
Response time to customer queries: The response time can be tracked electronically
and is closely correlated to the customer satisfaction.
Response quality of customer queries: Average customer rating (internal and external)
of overall technical capability of the firm in providing technical service and new product

customer service innovations to bring value to the customers' future problems. Possible is an average
rating by key external or internal customers using a 1 to 5 interval rating scale to
evaluate various dimensions regarding product technology or process technology (URL
1).
External
knowledge
spillover
Response time to competitive moves: Time required for corporation to match the
newest product of the competitor divided by the time required for competitor to match
firm's newest product benefits. This indicates the ability of the corporation to maintain a
leadership position or to match technology moves by the competition. The knowledge is
generated by external experts, customers, supplier, competitors, and research
institutions.
Indicators to measure the innovative capacity of a corporation, for example the
"number of new patents within a year" or "quality of patents", that define the
percentage of active and lucrative patents from the company's total patent estate, can
be included in this model. As there is a debate about the validity of using the number of
patents as an indicator of the innovativeness and technological strength of a company,
these metrics are not part in this approach. Some companies do not patent extensively
as a matter of strategy, and their patents might not be particularly valuable in other
industries. If implemented, patent-based indicators should be benchmarked against
competitors and compared to exploitation of the current technology position.
4.6 Class IV - Effect Indicators on Business Results
A start to measure a financial business effect is the measurement of savings related to
the implementation of new applications. Documenting the expenses associated with
tasks in the current environment for staffing, travel, and material can complete this. As
a result of the interventions in the knowledge base employees may be able to complete
their job requirements faster and more efficiently, customers may demand fewer
employee resources, because other resources have been made available, or Paper,
CDs, Copying costs etc., may be reduced. A table documenting the tasks, the number
of people involved, the percentage of time, and the amount of savings can be applied
und used as a Class VI indicator. This table samples current expenses to complete
tasks and once the expenses are identified, the objective is to estimate the savings or
any additional revenue of e.g. increased help desk productivity, savings in publishing
and telephone costs etc., in the next period. It is possible to use the Class II indicators
(Cost of interventions) in combination with the savings of Class VI indicators to
calculate the effects on total cash-flow and based on this determine the Net Present

Value of the KM initiative. Cash-flow is affected by additional hardware, software,
consulting, training and development costs of the KM system to the anticipated annual
savings.
Table 8. Exemplary effect indicators on business results sorted by classical Balanced
Scorecard perspectives
Performance topic Indicators
Financials Shareholder Value, NPV, Profit, ROI, ROA, ROE, ...
Customer
Satisfaction
Number of refunds made, number of merchandising items returned, etc. (See
Liebowitz 2000). Explanation: the customer satisfaction may increase because of
faster response times and a better understanding of customer needs due to
external knowledge links.
Internal Processes - Efficiency of internal processes: e.g. percentage of tasks/milestones achieved
within a certain timeframe measures the efficiency of a group/unit.
- Quality of internal processes: the fraction of tasks finished correctly:
perf(t):=(Number of tasks solved in time period/number of all tasks in that time
period)*100
Potentials Knowledge Value-Added Methodology (KVA): A possible measurement approach
could include the KVA methodology by Housel and Bell (2002). The process-
oriented view with learning time as basic metrics shows the performance of
business units.
Another performance indicator to measure a financial effect of the KM initiative is the
"gross profit margin" (GPM) (IRI 1995). The GPM is used in assessing the value of the
technology assets of the firm and the contribution of the Research & Development
(R&D) department to value creation. The GPM is calculated as a percentage of sales,
where gross profit equals net sales minus cost of goods sold (product costs plus direct
manufacturing costs). Value assessment can be based on change in GPM, regarding
other influencing factors of manufacturing costs, where possible.
5 Conclusions and Outlook
The performance measurement framework for KM initiatives, developed in this article,
supports managers at SGL CARBON to measure the quality of the knowledge base, to
determine the total costs of such an initiative, to make the interventions on the

knowledge base and their effects on organizational capabilities transparent and finally
to track the impact on business results. The framework provides an overview on what
kind of knowledge, its quality and structure is available in the company and builds the
opportunity to change this knowledge base by targeted interventions of a capable
knowledge expert (e.g. a Chief Knowledge Officer). Monitoring costs and results of
these interventions is a specific benefit of the approach, because even in early stages
possible mistakes are made visible. Attached to knowledge goals the initiative should
prove its value in finally producing more business outcome. In most cases, the quality
and value of knowledge assets are only measurable indirectly. Multi-dimensional
cause-and-effect chains of the implementation of KM are hard to describe and
evaluate. Focusing on comprehensive indicators can help comprise cost and benefits
and link knowledge issues to business results, but restricts the possibilities to
practically change the underlying knowledge, which in theory determines the business
results. The specific performance indicators have been selected based on the specific
knowledge goals of SGL CARBON and therefore don’t provide a universally valid
concept of measuring KM. For other branches performance indicators have to be
applied, depending on the underlying information technology and the targeted goals of
the organization. The implementation of the concepts needs a very exact definition of
the KM strategy including the goals of the initiative to set the right performance
indicators. The weighting of these performance indicators depends on the decision of
the top management and may change over time. Results should be benchmarked in
corporate and industry-wide studies, as the requirements and outcomes of KM are
different for industries. The current values of performance indicators in the framework
can be included in a report, which is handed out to the top management every month.
A possible "cockpit", similar to the Balanced Scorecard cockpit could be added on to
the monthly reports. If no results are measured, the underlying KM concept may lack
the necessary support.
Further questions for research are e.g. an empirical analysis of the performance
measurement approaches in use in different branches and different organizations (see
e.g. Tillquist and Rodgers 2002) and how these approaches contribute to improved
business results. Moreover, the empirical analysis of effects of Knowledge Networks
enabled by strategic alliances between corporations would make the effects of
Knowledge transfer between corporations more transparent. For practitioners the
development of reference models for the implementation and performance
measurement of KM would support efficiency and effectiveness of the implementation
of KM initiatives.
Still all KM initiatives have to be implemented in a large scale with all the detailed steps
necessary for successful KM (Davenport and Prusak 2000). If a business owner and
the management are committed to KM and have adequate performance measurement
frameworks to prove its value, the value contribution of KM initiatives can be made
more transparent.
6 References
Amelingmeyer, J. (2000): Wissensmanagement: Analyse und Gestaltung der Wissensbasis von
Unternehmen, Deutscher Universitäts-Verlag, Wiesbaden.
Barney J. B. (1991): Firm Resources and Sustained Competitive Advantage, in Journal of Management,
99 – 120
Blili, S., Raymond, L., Rivard, S. (1998): Impact of Task Uncertainty, End-User Involvement, and
Competence on the Success of End-User Computing, in: Information & Management, 33, 137 – 153
Brooking, A. (1999): Corporate Memory: Strategies for Knowledge Management, International Thomson
Business Press, London
Chin, W. W., Lee, M. K. O. (1997): On the Formation of End-User Computing Satisfaction: A Proposed
Model and Measurement Instrument, University of Hong Kong
Choi, B., Lee, H. (2000): An empirical investigation of Knowledge Management styles and their effect on
corporate performance, Korea Advanced Institute of Science and Technology
Clare, M. (2002): Solving the Knowledge Value Equation (Part One), in: Knowledge Management Review,
Vol. 5, Issue 2, 14 – 17
Clare, M. (2002): Solving the Knowledge Value Equation (Part Two), in Knowledge Management Review,
Vol. 5, Issue 3, 12 – 15
Collins, H. (2000): Corporate Portals: Revolutionizing Information Access to Increase the Productivity and
Drive the Bottom Line, AMACOM
Davenport, T., Prusak, L. (2000): Working Knowledge, Harvard Business School Press, Boston
Deking, I. (2002): Management des Intellectual Capital – Bildung einer strategiefokussierten
Wissensorganisation, dissertation, Technical University of Munich
Doll, W. J., Torkzadeh, G. (1991): Issues and Opinions - The Measurement of End-User Computing
Satisfaction: Theoretical and Methodological Issues, in: MIS Quarterly, 15, 5 – 10.
Dvir, R., Evans, S. (2000):Mapping Knowledge Reuse in R&D Processes – The Implementation of Quality
Tools, Cranfield University, Cranfield
Fairchild, A. M. (2002): Knowledge Management Metrics via a Balanced Scorecard Methodology,
Proceedings of the 35th Hawaii International Conference on System Sciences
Gentsch, P. (2000): Wissen managen mit innovativer Informationstechnologie, Gabler, Wiesbaden
Ginzberg, M. J. (1981): Early Diagnosis of MIS Implementation Failure, in: Management Science, 459 –
479.
Global Knowledge Economics Council (2002): Knowledge Management – Metrics / Candidate Metrics,
Working Document, March
Harvard Computing Group Report (1998): Knowledge Management – Return on Investment, report,
Boston
Housel, T., Bell, A. H. (2001): Measuring and Managing Knowledge, McGraw-Hill
Industrial Research Institute (1995): Research – Technology Management, report, Washington
Kaplan, R. S., Norton, D. P. (1992): The Balanced Scorecard – Measures That Drive Performance, in:
Harvard Business Review, January/February, Boston
Kaplan, R. S., Norton, D. P. (1996): The Balanced Scorecard: Translating Strategy into Action, Harvard
Business press, Boston.
Kaps, G. (2001): Erfolgsmessung im Wissensmanagement unter Anwendung von Balanced Scorecards,
Working paper series Wissensmanagement, 2
KPMG Consulting (2000): Knowledge Management Research Report 2000, report.
Lehner, F. (2000): Organisational Memory: Konzepte und Systeme für das organisatorische Lernen und
das Wissensmanagement, Hanser Verlag, Munich
Liebowitz, J. (2000): The Knowledge Management Handbook, Department of Information Systems,
University of Maryland

Lopez, K. et al. (2001): Measurement for Knowledge Management, report, American Productivity & Quality
Center, October
Maier, R., Haedrich, T. (2001): Modell für die Erfolgsmessung von Wissensmanagement Systemen, in:
Wirtschaftsinformatik, 43, 497 – 509
Massetti, B. (1996): An Empirical Examination of the Value of Creativity Support Systems on Idea
Generation, in: MIS Quarterly, 20, 83 – 97
Massetti, B., Zmut, R. W. (1996): Measuring the Extent of EDI Usage in Complex Organizations:
Strategies and Illustrative Examples, in MIS Quarterly, 20, September, 331 – 345
Massey, A. P., Montoya-Weiss, M. M., O'Driscoll, T. M. (2002): Knowledge Management in Pursuit of
Performance: Insights From Nortel Networks, in: MIS Quarterly, 26, No.3, September, 269 – 289
Nonaka, I., Takeuchi, H. (1995): The Knowledge-Creating Company: How Japanese Companies Create
the Dynamics of Innovation, Oxford University Press, May
North, K., Probst, G., Romhardt, K. (1998): Wissen messen – Ansätze, Erfahrungen und kritische Fragen,
in Zeitschrift für Führung und Organisation, Vol. 3, 158 – 166
Polanyi, M. (1997): The tacit dimension, in Knowledge in Organizations, Butterworths, London, 135 – 146
Probst, G., Raub, S., Romhardt, K. (2000): Managing Knowledge, John Wiley & Sons, Chichester
Romhardt, K. (1998): Die Organisation aus der Wissensperspektive – Möglichkeiten und Grenzen der
Intervention, Gabler, Wiesbaden
Schauer, H., Frank U. (2002): Einführung von Wissensmanagement und Wissensmanagementsystemen,
in Wirtschaftsinformatik, 44, 381 – 386
Schindler, M. (2001): Wissensmanagement in der Projektentwicklung, Josef Eul, Lohmar
Schreyögg, G. (2001): Wissen in Unternehmen: Konzepte – Maßnahmen – Methoden, Erich Schmidt
Verlag, Berlin
SGL CARBON (2002): Annual Report; see http://www.sglcarbon.com/ir/public/annual/index.php4
Skyrme, D. J., Amidon, D. M. (1998): New Measures of Success, in Journal of Business Strategy, 40, 20 -
24
Senge, P., (1990): The Fifth Discipline: The Art and Practice of the Learning Organization,
Currency/Doubleday, August
Stewart, T. (1997): Intellectual Capital, London

Sveiby, K. (1997): The New Organizational Wealth, San Francisco
Tillquist, J., Rodgers, W. (2002): Valuation of knowledge-based assets in e-business
Trittmann, R. (2003): Zielorientierte Erfolgsmessung von Wissensmanagementprojekten, Dissertation,
University of Cologne
Weishaar, A., Hess, F. (2003): Bewertung von Wissensmanagement: Vom Business Case zum Eckpfeiler
der Implementierung, Arthur D. Little
Wernerfelt, B. (1984): A resource-based view of the firm, in Strategic Management Journal, 5, 171 – 180
Wernerfelt, B. (1995): A resource-based view of the firm: ten years after, in Strategic Management Journal,
16, 171 – 174
URL 1: http://www.iriinc.org/webiri/publications/index.cfm [August 8, 2003]
URL 2: http://sveiby.konverge.com/articles/companymonitor_nov2001.html [August 8, 2003]
URL 3: http://www.skandia.com/en/about/processes.shtml [August 8, 2003]