measuring transparency - web publishing · measuring transparency james r ... structure and size of...
TRANSCRIPT

Measuring Transparency∗
James R. Hollyer†1, B. Peter Rosendorff2, and James Raymond Vreeland3
1Department of Political Science, University of Minnesota
2Wilf Family Department of Politics, New York University
3Mortara Center for International Studies, Georgetown University
August 2012
Abstract
Transparency is often viewed as crucial to government accountability, but its mea-
surement remains elusive. This concept encompasses many dimensions, which have
distinct effects. In this paper, we focus on a specific dimension of transparency: gov-
ernments’ collection and dissemination of aggregate data. We construct a measure of
government transparency, using an item response model that treats transparency as a
latent predictor of the reporting of data to the World Bank’s World Development Indi-
cators. The resultant index covers 149 countries from 1980-2008. Our measure, the
∗We would like to thank Neal Beck, Adam Bonica, Lawrence Broz, Christina Davis, Jennifer Gandhi,Michael Gilligan, Andrew Little, Jonathan Nagler, Megumi Naoi, William Skorupski, Randall Stone, JohannesUrpelainen and participants in the 2011 MPSA Panel on New Methodologies and Data for IPE, the NYUWorkshop on Bayesian Methods, and the 2012 ISA Panel on Transparency Information and Firms in a GlobalEconomy for helpful comments and suggestions. All remaining errors are our own.†Corresponding Author: 1414 Social Sciences, 267 19th Ave S, Minneapolis, MN 55455. jhol-
1

HRV Index (1) systematically rates low to middle income autocracies as more transpar-
ent than does Freedom House, and (2) rates democracies – particularly high-income
democracies – as more transparent than does the measure based on newspaper circu-
lation. We demonstrate that HRV is a stronger predictor of a wide range of governance
outcomes than is media circulation, particularly for autocratic regimes.
2

Transparency, broadly defined, relates to the full flow of information within a polity. A
lengthy literature stresses the importance of the provision of information to the populace
to ensure the accountability of government, and thus emphasizes the role of transparency
as a determinant of government performance (see, for instance Adserà, Boix and Payne,
2003; Besley and Burgess, 2002).
This broad notion of transparency, however, may encompass many different forms of
information transmission. The transmission of information to the citizenry is affected
by the freedom, structure and size of the mass media market (Adserà, Boix and Payne,
2003; Besley and Burgess, 2002; Djankov et al., 2003). Transparency may also reflect the
willingness of government bodies to provide information regarding their decision-making
processes (Stasavage, 2003). Institutional structures, such as the presence or absence of
Freedom of Information Laws (FOILs) may ease or hinder the flow of information to the
public (Islam, 2006). One may even conceive of social capital and/or ethnic divisions as
affecting the flow of information between citizens, thus aiding or hindering their ability to
hold political agents to account (Habyarimana et al., 2009; Grief, 2006).
This multifaceted nature of transparency poses difficulties for measurement, theory,
and theory testing. Optimally, theoretical models should specify which forms of informa-
tion transmission are most relevant to the mechanism being studied. Empirical measures
should be devised to precisely capture specific dimensions of transparency. And empirical
tests of theories should employ these precise measures – and control for alternative infor-
mation transmission mechanisms. By contrast, most existing findings rely on the broad
claim that transparency is relevant to accountability, and support this claim using proxies
for information transmission. Such statements fail to precisely identify mechanisms and
may misstate the effect of specific informational channels.
In this paper, we take one step towards clarifying theoretical mechanisms and empirical
measures. We introduce an index of a particular dimension of transparency: the collection
3

and dissemination of credible economic data by national statistical offices. To construct
this measure, we rely on a Bayesian item response model which treats transparency (along
this dimension) as a latent predictor of the reporting or non-reporting of data in the World
Bank’s World Development Indicators (WDI) data series. Our model analyzes 172 items
corresponding to the 172 variables relating to Economic Policy and Debt consistently col-
lected by the WDI over time.1 Since the WDI obtains its data from other international
agencies that, in turn, obtain their data from national statistical offices, our measure is
a valid indicator of governments’ efforts to collect and disseminate economically relevant
information. Moreover, because the WDI omits data considered ‘questionable’, our index
reflects the collection and dissemination of credible information.2
Our index thus focuses on a specific dimension of transparency largely ignored in the
literature.3 This measure is based on objective criteria, rather than on subjective expert
judgments. Moreover, our reliance on the presence or absence of data from a long-running
data series provides greater coverage than many commonly used alternatives. We construct
transparency measures for 149 countries covering a period from 1980-2008. Our index is
also measured at the interval level – by construction, a unit change in our scale has a
consistent meaning regardless of value of the measurement.
In addition to constructing an index of transparency, we offer a theoretical argument as
to why this dimension of transparency is important to government accountability. Informa-
tion collected and disseminated by the government has a key property: that of aggregation.
1We defer to the WDI’s classification of variables. Other categories include Education, Environment,Financial Sector, Health, Infrastructure, Labor and Social Protection, Poverty, Private Sector and Trade, andPublic Sector. See http://databank.worldbank.org/ddp/home.do. We refer to variables as consistentlycollected over time if they are reported by at least one country in every year contained in the WDI.
2See the World Bank statements about World Development Indicators: http://data.worldbank.org/
about/data-programs, accessed March 7, 2011. In some instances, these data are omitted by the WDI. Inothers, the international agencies that provide information to the WDI weed out questionable data earlier inthe collection process.
3For a notable exception, see Islam (2006) who focuses on the speed with which data are reported. Otherexceptions include Bueno de Mesquita et al. (2003), Lebovic (2006), and Stone (2008).
4

Because of the high fixed costs involved in collecting aggregate data, and because of the
public goods-like property of such information (Rodrik, 1995), the government is the only
entity able to assemble data on such matters as economic well-being, price levels, growth,
etc. This property of aggregation is crucial for two reasons: (1) By virtue of the law of large
numbers, broad aggregates are likely to more accurately reflect the efficacy of government
policies than are personal experiences or news reports. When citizens are uncertain as to
the appropriateness of different policy choices, the presence or absence of aggregate data
is likely to prove crucial in ensuring government accountability. (2) Information about ag-
gregate outcomes may also facilitate collective action. Poor aggregate outcomes are likely
to indicate that dissatisfaction with the government is widespread. This knowledge may
facilitate collective activities – such as protest or revolt – to discipline the government for
its poor behavior in a way that an active press or widespread social contacts is unlikely to
achieve.
We thus offer a precise measure of a limited but important component of transparency
and suggest its theoretical relevance to government accountability. We emphasize that our
measure does not capture all the dimensions of transparency, that accountability itself is
complex and influenced by many factors. Moreover, data dissemination is related to other
factors beyond government accountability, notably a country’s level of economic develop-
ment. Still, our measure is crisply defined, reproducible, meaningful, and important as
both an intrinsically interesting dependent variable and as a potential explanatory vari-
able. We encourage scholars to use it – along with other appropriate measures of other
facets of transparency – to test various hypotheses about the relationships between trans-
parency and accountability, governance, and democracy. Will will make our index publicly
available on publication of this research.
5
1 Existing Literature
A large literature in political science relates transparency to government accountability.
These theories predominantly build upon retrospective voting models (Barro, 1973; Fer-
ejohn, 1986), in which citizens discipline the government by the threat of removal from
office. Information is modeled as improving the precision (reducing the variance) with
which the public observes either the outcome of government decisions or the govern-
ment’s policy choice (Besley, 2006). Such studies typically conclude that improvements in
the flow of information enable citizens to adopt superior strategies for disciplining politi-
cians, thereby improving government performance. Empirical studies (e.g. Adserà, Boix
and Payne, 2003; Besley and Burgess, 2002) have lent support to these conclusions.
The precise type of information being transmitted may, however, be crucial. In the
models discussed above, the welfare implications of transparency depend on whether the
citizenry better observes the outcome of a government policy or if the public better ob-
serves the policy choice. For instance, Prat (2005) demonstrates that information regard-
ing the policy choice of the government can be detrimental when the public is imperfectly
informed of the optimal policy and when governments are affected by career concerns. Ca-
reer concerns may cause governments to adopt conventionally accepted policies, regard-
less of any private information, to avoid being seen as incompetent – and suffering the
resultant risk of replacement. Similarly, Stasavage (2004) demonstrates that transparency
regarding the conduct of international negotiations may lead to increased posturing by
government representatives, even if such posturing reduces the likelihood of finding an
optimal compromise. By contrast, the literature overwhelmingly concludes that informa-
tion about policy outcomes improves the ability of citizens to hold governments to account.
Different mechanisms of information transmission – the media, FOILs, open decision-
making processes, the collection of aggregate data – differ in their effectiveness in provid-
6

ing information about policy choices and outcomes. FOILs and open political institutions
may improve the public’s ability to observe policy choices and the policy-making process.
FOILs, for instance, allow members of the populace to legally demand information about
the actions of and discussions within the government, thereby allowing the public to pun-
ish government actions taken against the (perceived) public interest. As noted by Prat
(2005) and Stasavage (2004), access to this information may have both positive and neg-
ative welfare consequences – which effect dominates is theoretically ambiguous and likely
to vary according the the degree to which the public is informed about the mapping be-
tween policy choices and consequences.
A free media with access to a wide audience may inform the public about both policy
choices and policy outcomes. Investigative journalists may examine the manner in which
government decisions are reached and may uncover policies the government attempts to
hide. The media may also report on the outcomes of policy choices – with stories focusing
on those most affected by a given set of government decisions. Two criteria must be
satisfied for the media to effectively play this role: (1) news agencies must be free of
government interference and (2) they must be able to reach large audiences.
Yet, the media are unlikely to be able to aggregate information on the broad welfare
effects of policy decisions. Individual news agencies typically cannot invest the resources
necessary to document movements in price indexes, levels of economic growth, levels of
poverty, or education rates. The collection of such information often entails enormous fixed
costs. Indeed, the collection of census data often involves workforces that number in the
tens or hundreds of thousands. Moreover, such information has a public goods-like nature
– once collected and reported by any one news agency, all other such agencies can simply
reproduce these numbers. Aggregate data collection thus usually falls to the government.
And the provision of such information is likely to affect the public’s awareness of the macro
outcomes of policy decisions.
7

Attempts to measure transparency across states have generally focused on the role
of the media, to the exclusion of other mechanisms of information dissemination. For
instance, the commonly used Freedom House Freedom of the Press index measures sub-
jective expert judgments of (1) the laws and regulations that constrain media content, (2)
the degree of political control over the media, and (3) the structure of media ownership.4
But, as noted above, the freedom of the media to conduct operations without government
interference constitutes only one of at least two prerequisites for facilitating the flow of
information. In addition to freedom of operations, these media must reach a sufficient
portion of the population for their efforts to have a significant effect.
An alternative measure focuses on the level of newspaper circulation (see, for instance,
Adserà, Boix and Payne, 2003). This index proxies for the ability of the press to reach
a broad swath of the population and may be an important explanatory variable in some
contexts. The newspaper circulation index, however, suffers from the opposite problem
from that of Freedom House. High newspaper circulation numbers may be driven by the
pervasiveness of state-run media outlets offering biased coverage of government actions.
Other measures of transparency tend to focus on the openness of the decision-making
process of particular institutions. This is particularly true for the literature on central
bank transparency. For instance, Stasavage (2003) constructs a measure based on the
degree to which central banks publish economic forecasts (see also Chortareas, Stasavage
and Sterne, 2002). These measures have the advantage of reflecting a particular form of
transparency that is expected to affect outcomes in a precisely modeled manner. They do
not reflect sufficiently broad indicators of government performance, however, to assess the
effects of information on government accountability.
Scholars have paid relatively scant attention to the form of information dissemination
discussed in this paper: the collection and reporting of aggregate economic data by the
4See http://freedomhouse.org/templace.cfm?page=533.
8

government. One notable exception is Islam (2006), who constructs an index based on
the speed with which governments report data to the WDI, to the International Monetary
Fund’s International Financial Statistics (IFS), and other sources.5 She examines 11 indi-
cators drawn from across these series and assigns scores based on the degree of deviation
from the ‘desirable’ frequency with which such data should be reported. These scores are
then added together to construct an aggregate measure of data reporting frequency.
In the work that follows, we construct an index that, like Islam’s, focuses on data
dissemination. Unlike Islam, we focus on the simple presence or absence of data from the
WDI, rather than on the frequency with which data is reported. Our index (henceforth,
the HRV Index) is also based on a large number of indicators and offers coverage for 149
countries over the full 1980-2007 period. We construct the index through an item response
theory model that, as is outlined below, ensures minimal information loss from collapsing
a 172 dimension observation into a single dimension representation.
We contend that the HRV Index is a valid measure of the degree of data dissemination
by the government. Like other measures of transparency, ours is limited to a specific facet
of information transmission. It thus has strengths and weaknesses, and its appropriateness
will depend on the theory being tested. Our index, we argue, has one important property:
that of aggregation. Aggregate data indicate the effectiveness of government policy better
than citizens’ personal experiences, as we outline below.
2 The Importance of Aggregation
The release of economic data provides the public with information on policy outcomes –
particularly macro level outcomes such as economic growth or inflation. Economic data
are hardly unique in this regard. A free and vibrant media may also ease the flow of infor-
5Islam (2006) also examines the role of an alternative form of transparency – the operation of FOILs.
9
mation about policy outcomes; reporters may examine the effects of government decisions
as well as the decision-making process itself. Similarly, social networks may allow those
impacted by policy decisions to communicate with one another and with those not directly
targeted by policy choices.
Aggregate data are unique in one regard: their ability to provide information regarding
a large number of individual outcomes. Newspaper stories are effective at communicating
the association between policy choices and the welfare of individuals or small groups that
may or may not be representative. In the absence of aggregate data, reporters cannot – by
themselves – credibly convey the broader effects of policy choices. Moreover, the public
goods property of information and the high fixed-costs of data collection ensure that even
a vibrant media market will under-supply such information.
The collection and dissemination of aggregate data is likely to be critical to political
accountability if three conditions hold: (1) The public is imperfectly informed as to the
optimal policy choice.6 Were this not the case, one could know the appropriateness of the
government’s actions simply by observing its policy decisions. A free and vibrant press,
coupled with sufficiently open political institutions, would be vital to the transmission of
such information; economic data would not.
(2) The policy in question affects a broad swath of the public. If policies are narrowly
tailored, members of the media or social networks are likely able to discover the policy’s
effects simply by contacting interested parties.
(3) Policy choices do not perfectly map into welfare implications for individuals.7 This
6We refer to optimality from the perspective of the majority, or of a member of the winning coalition.It is not necessary for all citizens to share policy preferences, though this assumption is often adopted forsimplicity in retrospective voting models. For instance, assume that the utility of citizen i from a policy choiceP is a function g(P ) + ηi where ηi is a random shock that follows some commonly known distribution f(.).Citizen uncertainty over the optimal policy would result if the citizens were uninformed of the functionalform of g(P ). Information regarding the choice of P would thus be of minimal value in securing governmentaccountability.
7This is equivalent to assuming that the distribution of ηi, as discussed above, is not degenerate (e.g.,ηi = 0 ∀ i).
10

requirement ensures that each individual’s welfare is an imperfect indicator of the ‘correct-
ness’ of the government’s decisions. Thus, individuals should not optimally condition their
decision of whether to discipline the government on their individual welfare alone.8 The
weaker the correlation between government policies and individual outcomes, the more
important aggregate information. The law of large numbers implies that data offer an
increasingly precise signal of the appropriateness of government decisions as the level of
aggregation rises.9
We do not contend that the ‘law of large numbers effect’ fully solves the informational
problems faced by the populace. Even if aggregate economic outcomes are fully known,
assessing government responsibility for these outcomes is a difficult task. Economic well-
being may fluctuate with a variety of shocks orthogonal to government policy. But, shocks
to aggregate level measures of economic performance are the sum of a variety of similar
shocks at the individual level. Our contention is that – in practical settings – the effects of
such shocks on aggregate-level outcomes is likely to be smaller than those on individual-
level outcomes, such that the provision of aggregate-level data enables citizens to draw
better (though still imperfect) inferences about the appropriateness of government poli-
cies.
In addition to this ‘law of large numbers effect’, aggregation has implications for col-
lective action. Collective action on the part of members of the populace is often inhibited
by uncertainty over the willingness of others to participate in collective activities. This
has particularly important implications for the accountability of autocrats, as methods of
disciplining such governments – public protest, revolution – suffer from collective action
problems. Fearon (2006), for instance, finds that uncertainty over the distribution of dis-
8See Kuran (1991) and Khemani (2007) for related discussions.9This discussion relates to the literature on sociotropic versus ‘pocketbook’ voting in American politics
(Kramer, 1983; Markus, 1988). Note further that the disclosure of more and more accurate economic datawould provide greater information not only regarding the average effectiveness of government policies onindividual welfare, but also more information regarding the distribution of these effects.
11

content may hinder public sanctioning of autocratic regimes. In his model, elections may
serve as an informational device to overcome this problem. It is our contention that the
public disclosure of aggregate data may do the same.
3 Missing Data as an Element of Transparency
Our concept of theoretical interest is the disclosure of aggregate economic information to
the public. Our empirical measure of this concept is a function of the missingness/non-
missingness of data from the WDI.
Few studies have employed data-availability as a variable, but those that do implicitly
disagree as to the processes that drive this form of transparency. Bueno de Mesquita et al.
(2003) and Hollyer, Rosendorff and Vreeland (2011) focus on missing data as a reflection
of governments’ willingness to disseminate data. By contrast, Stone (2008) uses missing
data as a proxy for state capacity, assuming that missing data result from the inability of a
government to collect and publish information. We suggest that these two explanations are
non-exclusive: both the government’s willingness and its capacity to collect and distribute
data are necessary, but neither is sufficient, to ensure transparency.
We suggest that transparency should not, in general, be viewed in contradistinction to
state capacity. Nor does transparency only reflect the willingness (whether primitive or
induced) of a government to provide information. In our view, transparency is a reflection
of both the willingness of a government to provide information and its ability to do so.
Governments with greater fiscal resources and/or a more technically competent bureau-
cracy are, ceteris paribus, more likely to be transparent. Conversely, governments with a
stronger preference for disclosure – whether induced by political institutions (Broz, 2002;
Hollyer, Rosendorff and Vreeland, 2011) or primitive – are likely to be more transparent.
Those with a strong preference for secrecy will tend to avoid disclosure. For instance, Ross
12
(2006) notes that “high-performing authoritarian states” tend to report child mortality
and economic data infrequently, despite relatively high per capita income levels and low
mortality rates.
From the point of view of a citizen, it may not matter whether a paucity of data results
from state willingness or capacity. In the absence of data disclosure, this citizen will be less
able to draw accurate inferences about government behavior. Regardless of whether her
government was unable or unwilling to collect and disclose data, she is equally uninformed.
This is not to say the question of whether willingness or capacity has a greater effect on
disclosure is unimportant. To the contrary, this question is central to political science, and
we offer a variable which scholars can use to test various hypotheses about which causal
mechanism dominates under different circumstances.
Indeed, one can attribute the rankings of certain states on our index to either their
capacity or their willingness to disclose data. For instance, Cuba receives the lowest trans-
parency score of any country in our sample during the year 1980. At the time, Cuba’s
per capita GDP was nearly twice that of the median country in the Penn World Table, and
the government had vastly expanded education provision to rates similar to those of the
developed world (Barro and Lee, 1996). Cuba possessed a high level of state capacity,
but chose to not to disclose data to the WDI. By contrast, Somalia experienced precipitous
drops in its HRV score in 1990 and 1991 – coinciding with the collapse of the Siad Barre
government and the outbreak of civil war. It is probable that we can attribute most of the
decline in transparency in this instance to the loss of state capacity, as Somalia became the
paradigmatic example of a failed state.
13

4 The Empirical Model
We measure governments’ collection and disclosure of data directly, by relying on the pres-
ence or absence of reported values from the WDI. The World Bank assembles these data
from information provided by other international organizations – for instance, the Inter-
national Monetary Fund (IMF) and International Labor Organization (ILO). These organi-
zations, in turn, obtain information from national statistical offices. In some instances, the
World Bank codes observations in the WDI as missing because the information provided by
national agencies is deemed to be questionable. Our measure thus reflects the disclosure
of credible information by national statistical agencies. As such, it possesses a high degree
of content validity (Carmines and Zeller, 1979) with regards to the concept of theoretical
interest – the collection and dissemination of aggregate economic data.
To be more precise, we treat transparency as a latent (unobserved) term predicting the
presence or missingness of data on 172 measures drawn from the WDI’s section pertaining
to Economic Policy and Debt. We obtain estimates of this transparency term through the
use of a Bayesian item response theory (IRT) model. IRT models are a class of procedures,
drawn from the psychometrics literature (for a thorough overview, see van der Linden
and Hambleton, 1997) and used to reduce the dimensionality of data with minimal loss
of information. Such models have previously been used in political science to estimate
the ideal points of legislators (Clinton, Jackman and Rivers, 2004), to refine indexes of
democracy (Treier and Jackman, 2008; Pemstein, Meserve and Melton, 2010), to examine
support for the US within the UN General Assembly (Voeten, 2004), and to combine expert
estimates of bureaucratic agency ideologies (Clinton and Lewis, 2008).
Our approach assumes that there is an unobserved term – transparency – that drives the
reporting of variables to the WDI. Countries that score highly on this term are more likely
to report each item in the WDI than countries that receive low scores; though the degree
14

to which reporting/non-reporting reflects transparency varies across each variable in the
WDI. There is likely to be variation in the degree to which reporting reflects transparency
both because certain variables are more likely to be reported – by all countries – than
others, and because certain variables may be reported for idiosyncratic reasons. Thus, the
reporting/non-reporting of different variables in the WDI provides differing amounts of in-
formation about transparency. Our model estimates the degree to which each observation
is informative. We can therefore report a single value of transparency for each country-
year that reflects the missingness of data across all 172 WDI variables with minimal loss of
information.
In our model, we let yj,c,t ∈ {0, 1} denote an indicator equal to 1 if country c reports
WDI variable j in year t and equal to 0 otherwise. We then estimate
Pr(yj,c,t = 1|transparencyc,t) = logit(δj + βjtransparencyc,t) (1)
where δj is the difficulty parameter and βj the discrimination parameter for item j. The
term transparencyc,t is the measure of a given country-year’s propensity to disclose data,
which is to be estimated. The logit function is a logistic transformation. Thus, changes in
δj reflect the degree to which countries, on average, report a given variable drawn from
the WDI. Changes to βj reflect the degree to which the outcome of one item predicts the
outcome of other items (Gelman and Hill, 2006).
In our model there are 172 items j, 149 countries c and 28 years t. We thus estimate a
system of 172 equations (all of the form of equation 1) with 4172 observations.10
The model represented by equation 1 is only identified up to an affine transformation.
10We confine our analysis to 149 countries that have been continuously independent since 1980 and arerecorded in the WDI from that time. We rely on the DD Index of Democracy (Cheibub, Gandhi and Vreeland,2010) to define independent country years. The WDI provide data for dates preceding independence. But,we do not rely on such data, given that these must either be reported by entities other than that of thesovereign government or are interpolated from information reported subsequently. We thus run our modelon a rectangular dataset.
15

The analyst never observes the actual values of δj, βj or transparencyc,t. One could there-
fore multiply all transparency values by a constant, and divide all βj by the same value,
and produce the same model. One could similarly manipulate coefficient values to shift
the transparency index in any direction. To avoid this problem, it is standard to treat the
values of transparency as draws from an informative prior distribution. By so anchoring
the values of transparency, the difficulty and discrimination parameters become estimable
(Gelman and Hill, 2006; Clinton, Jackman and Rivers, 2004).
In this instance, however, we encounter an additional modeling difficulty. Since our
data are time-series cross-sectional, we cannot treat each observation of transparencyc,t
as independent of the observation transparencyc,t−1. To adjust for the likely correlation of
index values within countries over time, we rely on a system of dynamic priors. We treat
our prior beliefs of the transparency score for each country in each year as a function of
the transparency score for that country in the previous year. This set of priors will ‘shrink’
the estimate of a given country-year’s transparency score back towards the estimated level
of transparency for that country in the previous year, smoothing discrete movements in
our index. Our system of priors is thus: transparencyc,t ∼ N(transparencyc,t−1,1τc) ∀ t > 1
and transparencyc,t ∼ N(0, 2) for t = 1. τc acts as a country specific smoothing parameter,
since the degree to which an estimated value of transparencyc,t shrinks back towards the
prior mean is inversely proportional to the variance of the prior distribution (Jackman,
2009). Similar priors are often used in the ideal point estimation literature when working
with dynamic data (see, for instance Martin and Quinn, 2002). We estimate the parameter
τc for each country in our data, and give this term a prior τc ∼ Gamma(40, 0.1).11
We place diffuse normal priors on the difficulty and discrimination parameters δj and
11A Gamma distribution with a scale parameter 40 and shape parameter 0.1 has a mean of 4 and a varianceof 0.4.
16

βj, such that12
δj
βj
∼ N(
0
0
,
100 0
0 100
).
These diffuse priors ensure that the posterior estimate of each discrimination and difficulty
parameter is overwhelmingly determined by the data.
We estimate this model employing a Markov Chain Monte Carlo algorithm run from
WinBUGS 1.4.3 launched from R.2.11.0. The model is estimated using 2 chains of 250,000
iterations each, the first 150,000 of which serve as a burn-in period.
5 Influential Items
Some reasonable concern remains as to whether the index derived from the model above
reflects the dissemination of politically relevant data. We construct our index based on
the reporting or non-reporting of 172 variables, some of which are obscure and of little
value to the public in disciplining government behavior. If these items drive most or all of
the variation in the HRV Index, our measure is a poor barometer of transparency and is
unlikely to affect government accountability.
Fortunately, we can assess whether politically relevant variables influence the HRV In-
dex scores by examining the posterior densities of the difficulty (δj) and discrimination
(βj) parameters described in equation 1. Recall that the discrimination parameters (βj)
reveal the extent to which the reporting/non-reporting of a given variable correlates with
the transparency index; while the difficulty parameters (δj) reflect the extent to which a
12By treating these priors as independent draws from a multivariate normal, rather than draws from twounivariate normals, we ‘block’ on these parameters. Blocking implies that the Gibbs sampler simultaneouslydraws simulated values of both δj and βj , rather than conditioning the draw of each term on prior draws ofthe other. Blocking on parameters that are likely to be highly correlated speeds the rate at which the Gibbssampler explores the parameter space (Jackman, 2009).
17

given observation is reported in the data. Large and positive values of the βj indicate that
a given variable is much more likely to be reported in a highly transparent country, a nega-
tive βj indicates the reverse, and values close to zero indicate that the reporting of a given
variable does not much affect our transparency index.
The variables whose dissemination has the strongest influence on the HRV Index are
highly politically relevant. The most discriminating items include various measures of
household expenditures, government expenditures, gross national expenditures, exports,
and imports. Highly politically relevant variables such as GDP and GDP per capita have
large and positive discrimination parameter estimates (generally in the vicinity of 10-12).
Measures whose reporting negatively correlates with index values are uniformly measures
of development assistance, which are not typically reported by developed countries.
Those variables whose reporting exercises little to no influence over the HRV Index
include such measures as workers’ remittances, changes in inventories, manufacturing
value added, and the net capital account. Typically these data would not be expected
to be highly politically influential. Figures 1 and 2 plot the discrimination and difficulty
parameter estimates, and 95 percent highest posterior density intervals, for the 25 items
with the highest and lowest discrimination parameter estimates, respectively.13
6 Face Validity
To assess the validity of our estimates, we first examine the estimated values of the trans-
parency index in the 1980 cross-section. We report estimated index values and 95 percent
highest posterior density intervals for the 25 lowest scoring countries in Figure 3 and for
the 25 highest scoring countries in Figure 4.14 As can be seen from the estimates, nearly
13The abbreviation ‘LCU’ stands for ‘Local Currency Unit’, while ‘DAC’ stands for ‘Development AssistanceCommittee’.
14Values from the MCMC estimates were initially inverted such that low scores corresponded to higherlevels of transparency. We have rescaled the index by multiplying all values by −1. We similarly rescale all
18

Figure 1: Parameter Estimates, Highest Discrimination Scores
Discrimination and difficulty parameters, and 95 percent highest pos-terior density intervals, for the 25 items with the highest discrimina-tion parameter scores. Parameter values are plotted on the x-axis.Item names are noted on the y-axis
all the highest scoring countries are members of the OECD. While the lowest scoring coun-
tries consist of Cuba, Cambodia, Djibouti, Angola and Laos – all states we would expect to
score poorly on transparency during this period. We can also see that the highest scoring
country in this period (Austria) differs significantly in its score from other developed coun-
tries such as Denmark and the USA. Similarly, the lowest scoring country (Cuba) differs
discrimination parameters.
19

Figure 2: Parameter Estimates, Lowest Discrimination Scores
Discrimination and difficulty parameters, and 95 percent highest pos-terior density intervals, for the 25 items with the lowest discrimina-tion parameter scores. Parameter values are plotted on the x-axis.Item names are noted on the y-axis
significantly from other low scoring countries such as Equatorial Guinea and Qatar. Not
only do our index values coincide with common notions of transparency, but we are also
able to discriminate among high and low scoring countries. It is more difficult, however, to
discriminate among the large number of countries that are placed in the middle ranges of
the index (between 0 and 0.5), though the low and high ends of this range are statistically
distinguishable.
20

Figure 3: Low Scoring Countries, 1980
A cross section of the 50 lowest scoring countries on the HRV Indexfrom 1980. Three letter ISO country codes are plotted on the y-axis.Index scores are plotted on the x-axis. Mean predicted transparencyindex values are indicated by diamonds, while the whiskers denote95 percent highest posterior density intervals. Countries are plottedin ascending order of mean HRV Index score.
In addition to comparing across countries cross-sectionally, we examine longitudinal
variation in our estimates to assess their validity. Based on anecdotal accounts, the level
of transparency in many countries in our sample should be shifting over time. We present
our estimates of the level of transparency in several such countries below.
For instance, Vietnam experienced enormous economic and political changes over the
1980-2007 period. These changes included substantial economic liberalization, the cre-
ation of (relatively) more representative institutions, and the establishment of diplomatic
relations with nations with which it had been estranged. The 1986 Party Congress is widely
21
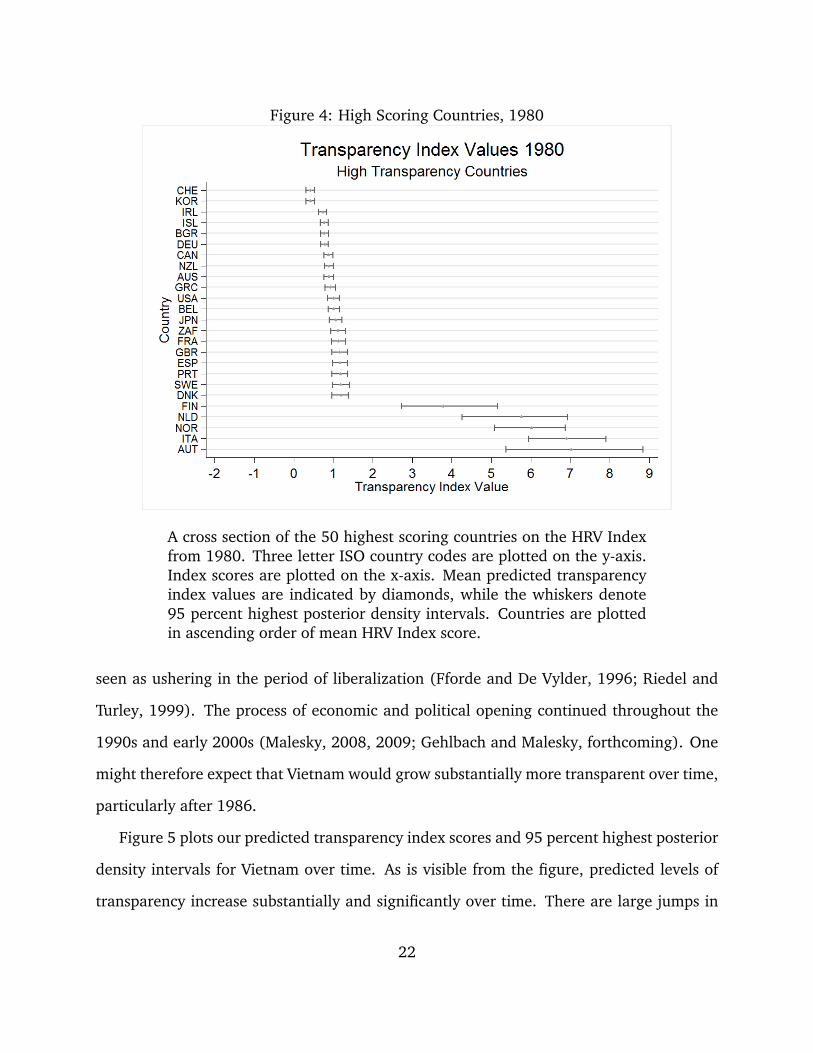
Figure 4: High Scoring Countries, 1980
A cross section of the 50 highest scoring countries on the HRV Indexfrom 1980. Three letter ISO country codes are plotted on the y-axis.Index scores are plotted on the x-axis. Mean predicted transparencyindex values are indicated by diamonds, while the whiskers denote95 percent highest posterior density intervals. Countries are plottedin ascending order of mean HRV Index score.
seen as ushering in the period of liberalization (Fforde and De Vylder, 1996; Riedel and
Turley, 1999). The process of economic and political opening continued throughout the
1990s and early 2000s (Malesky, 2008, 2009; Gehlbach and Malesky, forthcoming). One
might therefore expect that Vietnam would grow substantially more transparent over time,
particularly after 1986.
Figure 5 plots our predicted transparency index scores and 95 percent highest posterior
density intervals for Vietnam over time. As is visible from the figure, predicted levels of
transparency increase substantially and significantly over time. There are large jumps in
22

the 1984-1986 period, corresponding to the Party Congress, such that the transparency
score is significantly higher in 1986 than it was in 1985 and significantly higher in 1985
than 1984. Similar increases in transparency coincide with episodes of political and eco-
nomic liberalization in Tanzania and China (see supporting materials).
Figure 5: Vietnam HRV Scores Over Time
A longitudinal plot of Vietnam’s HRV Index scores from 1980-2008.HRV Index scores are on the y-axis, while time is measured on the x-axis. Diamonds denote mean predicted index scores. Whiskers denote95 percent highest posterior density intervals.
We do not observe a universal trend towards rising transparency levels over the period
between 1980 and 2008 – a number of countries experienced substantial declines. For
instance, Zimbabwe experienced increasing levels of unrest and trade union-led opposi-
tion to the ZANU-PF government beginning in the mid-1990s. General strikes were held
in 1996, and met with police intimidation (van der Walt, 1998). This period also saw the
forced confiscation of white-owned farms setting off a precipitous economic decline and
23
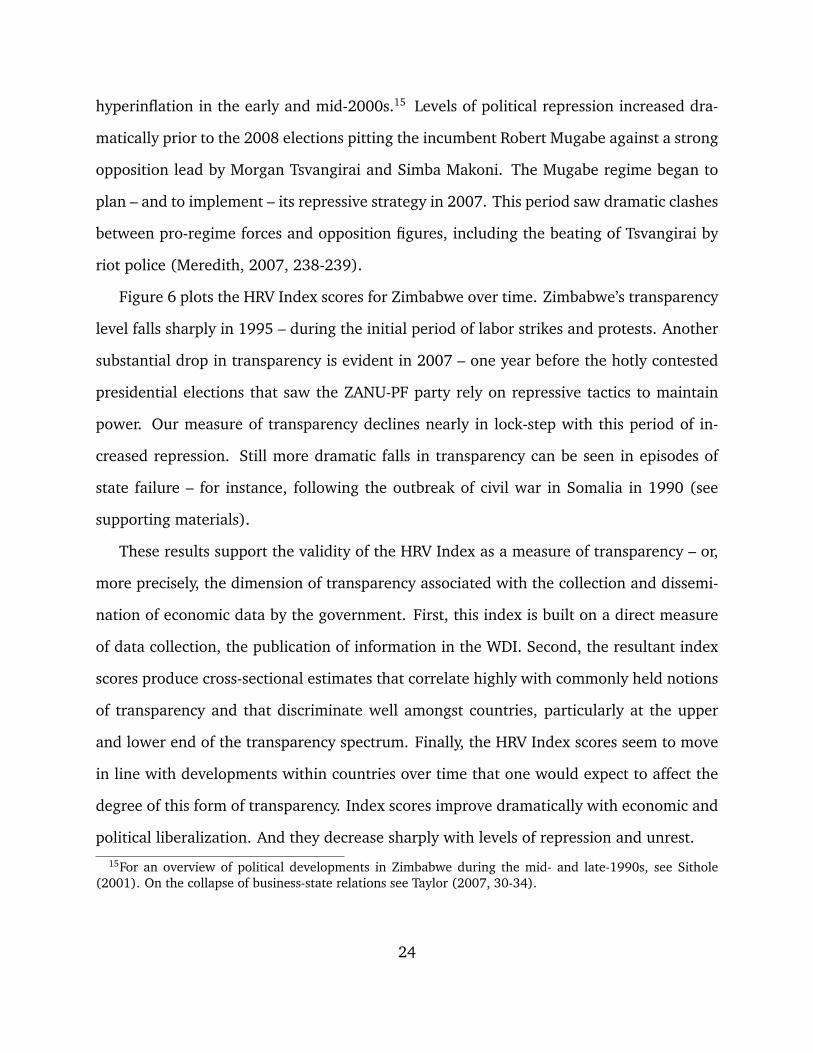
hyperinflation in the early and mid-2000s.15 Levels of political repression increased dra-
matically prior to the 2008 elections pitting the incumbent Robert Mugabe against a strong
opposition lead by Morgan Tsvangirai and Simba Makoni. The Mugabe regime began to
plan – and to implement – its repressive strategy in 2007. This period saw dramatic clashes
between pro-regime forces and opposition figures, including the beating of Tsvangirai by
riot police (Meredith, 2007, 238-239).
Figure 6 plots the HRV Index scores for Zimbabwe over time. Zimbabwe’s transparency
level falls sharply in 1995 – during the initial period of labor strikes and protests. Another
substantial drop in transparency is evident in 2007 – one year before the hotly contested
presidential elections that saw the ZANU-PF party rely on repressive tactics to maintain
power. Our measure of transparency declines nearly in lock-step with this period of in-
creased repression. Still more dramatic falls in transparency can be seen in episodes of
state failure – for instance, following the outbreak of civil war in Somalia in 1990 (see
supporting materials).
These results support the validity of the HRV Index as a measure of transparency – or,
more precisely, the dimension of transparency associated with the collection and dissemi-
nation of economic data by the government. First, this index is built on a direct measure
of data collection, the publication of information in the WDI. Second, the resultant index
scores produce cross-sectional estimates that correlate highly with commonly held notions
of transparency and that discriminate well amongst countries, particularly at the upper
and lower end of the transparency spectrum. Finally, the HRV Index scores seem to move
in line with developments within countries over time that one would expect to affect the
degree of this form of transparency. Index scores improve dramatically with economic and
political liberalization. And they decrease sharply with levels of repression and unrest.
15For an overview of political developments in Zimbabwe during the mid- and late-1990s, see Sithole(2001). On the collapse of business-state relations see Taylor (2007, 30-34).
24

Figure 6: Zimbabwe HRV Scores Over Time
A longitudinal plot of Zimbabwe’s HRV Index scores from 1980-2008.HRV Index scores are on the y-axis, while time is measured on the x-axis. Diamonds denote mean predicted index scores. Whiskers denote95 percent highest posterior density intervals.
7 The Relationship between Government Data Collection
and Other Forms of Transparency
We have established that the HRV Index moves in line with perceived levels of transparency
– in both cross-sectional and longitudinal settings. It remains to be seen how this index
correlates with commonly used indexes of transparency, indexes that attempt to measure
alternative dimensions of the flow of information. Ex ante, one might expect these indexes
to be positively correlated. Governments that are willing to allow freedom of the press
or uninhibited access to the news media are more likely to encourage the free flow of
information more generally. A free and active press may also actively push the government
25

to collect aggregate data and make this information publicly available.
Yet, one might also expect systematic differences between the HRV Index and such
measures as Freedom House’s Freedom of the Press Index and daily newspaper circula-
tion figures. Very little state activity is required to enforce the ‘negative rights’ implied
by freedom of the press. By contrast, the collection and dissemination of aggregate eco-
nomic data is often a costly exercise.16 The Freedom House measures are also related to
democratic notions of individual rights. While it may be the case that democracies have
a stronger incentive to collect and disseminate data than autocracies (Hollyer, Rosendorff
and Vreeland, 2011), these incentives are less clearly associated with democracy than are
protections of the freedom of the press.
Table 1 explores the relationship between the Freedom House and HRV Indexes. (We
present scatterplots of the relationship between these two indexes in the appendix.) HRV
Index scores are regressed on the Freedom House Index, on an indicator for democracy
(we use the DD/ACLP definition of democracy as coded by Cheibub, Gandhi and Vreeland,
2010), GDP per capita in thousands of constant PPP adjusted 2005 US dollars (Heston,
Summers and Aten, 2009), and the interaction between these latter two terms.17
These results indicate that the two indexes are positively correlated. The coefficients
on democracy, income and their interaction indicate that low and middle income (incomes
below roughly $3,900) autocracies score highly on the HRV measure relative to the Free-
dom House measure. At higher incomes, democracies perform more strongly on the HRV
Index than on that composed by Freedom House. Further investigations suggests that the
relatively high scores of OECD countries on the HRV Index drive this relationship.
16For instance, the most recent Indian census required 2.7 million workers, who often had to travel enor-mous distances, to complete the enumeration. “Heads Up: A National Head Count Should Show DramaticChanges.” The Economist. February 24, 2011. http://www.economist.com/node/18233732?story_id=
1823373217We weight all observations in these regressions by the inverse of the standard deviation of the HRV Index
predictions.
26
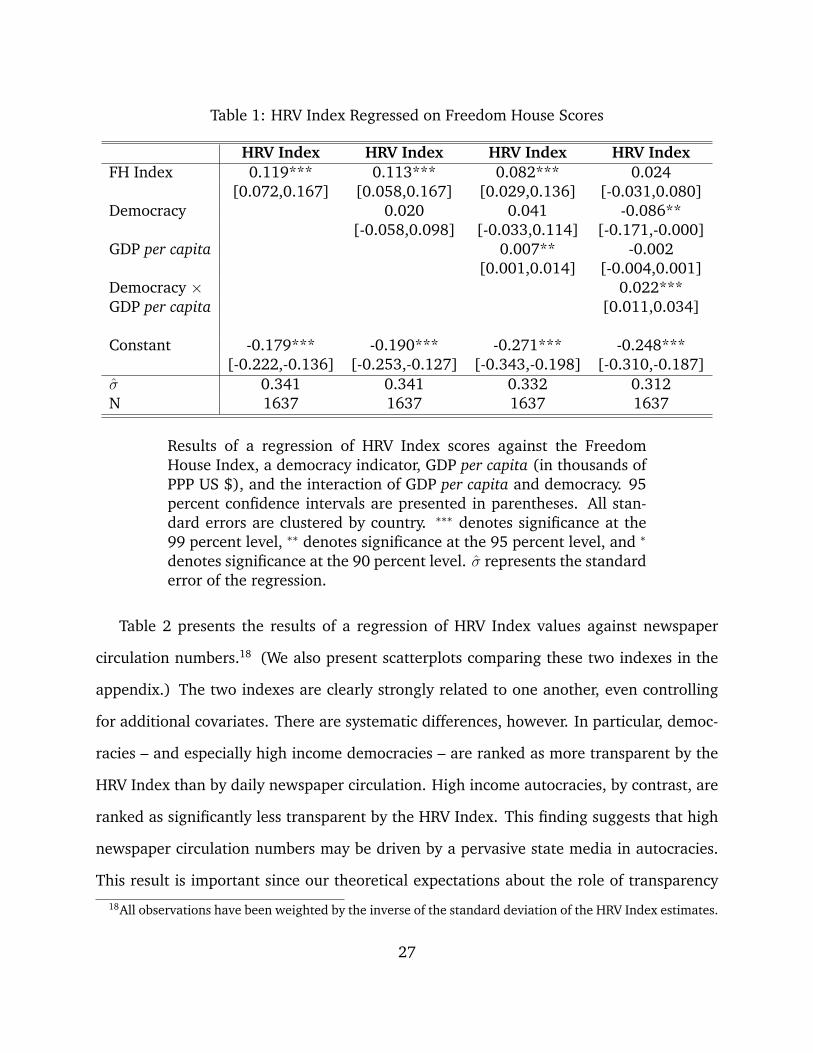
Table 1: HRV Index Regressed on Freedom House Scores
HRV Index HRV Index HRV Index HRV IndexFH Index 0.119*** 0.113*** 0.082*** 0.024
[0.072,0.167] [0.058,0.167] [0.029,0.136] [-0.031,0.080]Democracy 0.020 0.041 -0.086**
[-0.058,0.098] [-0.033,0.114] [-0.171,-0.000]GDP per capita 0.007** -0.002
[0.001,0.014] [-0.004,0.001]Democracy × 0.022***GDP per capita [0.011,0.034]
Constant -0.179*** -0.190*** -0.271*** -0.248***[-0.222,-0.136] [-0.253,-0.127] [-0.343,-0.198] [-0.310,-0.187]
σ̂ 0.341 0.341 0.332 0.312N 1637 1637 1637 1637
Results of a regression of HRV Index scores against the FreedomHouse Index, a democracy indicator, GDP per capita (in thousands ofPPP US $), and the interaction of GDP per capita and democracy. 95percent confidence intervals are presented in parentheses. All stan-dard errors are clustered by country. ∗∗∗ denotes significance at the99 percent level, ∗∗ denotes significance at the 95 percent level, and ∗
denotes significance at the 90 percent level. σ̂ represents the standarderror of the regression.
Table 2 presents the results of a regression of HRV Index values against newspaper
circulation numbers.18 (We also present scatterplots comparing these two indexes in the
appendix.) The two indexes are clearly strongly related to one another, even controlling
for additional covariates. There are systematic differences, however. In particular, democ-
racies – and especially high income democracies – are ranked as more transparent by the
HRV Index than by daily newspaper circulation. High income autocracies, by contrast, are
ranked as significantly less transparent by the HRV Index. This finding suggests that high
newspaper circulation numbers may be driven by a pervasive state media in autocracies.
This result is important since our theoretical expectations about the role of transparency
18All observations have been weighted by the inverse of the standard deviation of the HRV Index estimates.
27

relate not simply to the volume but to the quality of information relayed to the public. It
seems that the HRV Index does a better job of reflecting this quality.
Table 2: HRV Index Regressed on Daily Newspaper Circulation
HRV Index HRV Index HRV Index HRV IndexNews Circ. 0.003*** 0.002*** 0.002* 0.002**
[0.001,0.004] [0.001,0.004] [-0.000,0.003] [0.000,0.004]Democracy 0.200* 0.186 -0.119
[-0.021,0.422] [-0.045,0.416] [-0.274,0.037]GDP per capita 0.008 -0.023**
[-0.007,0.024] [-0.041,-0.005]Democracy × 0.036***GDP per capita [0.022,0.050]
Constant 0.169*** 0.078 0.057 0.246***[0.090,0.247] [-0.027,0.183] [-0.050,0.165] [0.161,0.331]
σ̂ 0.515 0.506 0.503 0.473N 476 476 476 476
Results of a regression of HRV Index scores against the World Bank’sDaily Newspaper circulation per 1000 numbers, a democracy indica-tor, GDP per capita (in thousands of PPP US $), and the interactionof GDP per capita and democracy. 95 percent confidence intervals arepresented in parentheses. All standard errors are clustered by country.∗∗∗ denotes significance at the 99 percent level, ∗∗ denotes significanceat the 95 percent level, and ∗ denotes significance at the 90 percentlevel. σ̂ represents the standard error of the regression.
So, while the HRV Index correlates with other measures of transparency, it also exhibits
systematic differences. Poor- and middle-income autocracies appear more willing to dis-
seminate data than to tolerate freedom of the press. The contrast between high-income
democracies and other countries is stronger with respect to data dissemination than other
forms of transparency. In the next section, we examine whether these systematic differ-
ences across dimensions of transparency are associated with variation in the association
between these measures and governance.
28

8 Transparency and the Quality of Governance
Political scientists have long been concerned with political accountability and its effects on
government performance. A seminal contribution to this literature is that of Adserà, Boix
and Payne (2003) (henceforth, ABP), which examines the effect of democracy and the free
flow of information on government corruption, bureaucratic quality, and the rule of law.19
Democracies, they find, perform significantly better than autocracies in all four measures
– and the role of democracy is further accentuated when information (proxied by the level
of circulation of daily newspapers) flows freely.
We replicate the work of ABP below, using both the HRV Index of data dissemination
and the circulation of daily newspapers as measures of different forms of transparency.20
Our theoretical expectations, based on the discussion above, lead us to believe that (1) the
HRV Index is likely to be more predictive of government performance in autocratic systems
– where collective actions by citizens are necessary to discipline the government, and (2)
the HRV Index is likely to be less predictive of government behavior than media activi-
ties when the citizenry is likely to be certain of its preferred policy choice. Note that the
majority of governance indicators examined here are likely to involve relatively low uncer-
tainty over policy choices, so this is a conservative test of the role of data dissemination on
government performance.21
19ABP also consider the relationship with the risk of appropriation. The current version of the ICRGdataset, however, does not include this measure.
20Ours is not an exact replication of ABP, as several of the datasets they use have been updated and mod-ified. We use the most recent ICRG measures of corruption, law and order, and bureaucratic quality. Thebureaucratic quality measure in our specifications ranges from 0-4, all other measures range from 0-6. ABPmeasure democracy using the Polity III democracy measure. We rely on the more commonly used polity2measure drawn from the Polity IV dataset. Finally, we append additional observations of daily newspa-per circulation through 2004 (drawn from the 2011 WDI). Our specification also differs from that of ABP.They include an interaction between newspaper circulation and democracy in their model, but assume thatnewspaper circulation has no direct effect on governance. We prefer not to make such an assumption and,following the advice of Brambor, Clark and Golder (2005), include the constitutive terms of all interactionsin our specifications.
21We do not intend for these results to be interpreted causally. As noted above, our transparency scoresare likely to be correlated with state capacity, which may act as an omitted variable driving the relationship
29

We follow ABP in treating each governance indicator as a linear function of democracy
(here proxied by the polity2 score), GDP per capita measured in 2005 constant purchasing
power parity US dollars, transparency, the interaction of transparency and democracy, and
a lagged dependent variable. The model is thus
governancei,t = α + φgovernancei,t−1 + γ1democracyi,t + γ2transparencyi,t+
γ3democracyi,t ∗ transparencyi,t + γ4GDPi,t + εi,t. (2)
To improve the comparability of regression coefficients, we standardize both the HRV Index
and the newspaper circulation values by subtracting the mean from each observation and
dividing by the standard deviation. The coefficients on these terms thus measure the
contemporaneous association between a one standard deviation shift in the transparency
measure and governance. (The presence of a lagged dependent variable makes the model
dynamic. Thus, the steady state association between these terms and governance is given
by dividing each coefficient value by 1− φ.)
Also following ABP, we collapse yearly observations into half-decade intervals, taking
the mean of all terms except newspaper circulation in each five year period. As newspa-
per circulation is only measured in five year increments prior to 1997, we simply take the
newspaper circulation figures from the first year in each period as the observation. Col-
lapsing the data helps to adjust for slow movement in the governance indicators over time
and helps to reduce measurement error in these terms.
Lagrange multiplier tests of the model depicted in equation 2 under the null hypothesis
that the disturbances are not serially correlated reject this hypothesis, even after averag-
with governance outcomes. This problem is likely to be particularly severe with respect to measures ofbureaucratic quality. While controlling for GDP per capita helps to adjust for this problem, it may not solve it.We note that such bias is unlikely to explain why the HRV Index is more strongly associated with governanceoutcomes in autocratic – as opposed to democratic – states. Our purpose here is to ascertain the validity ofour measure by replicating a seminal work in the literature.
30
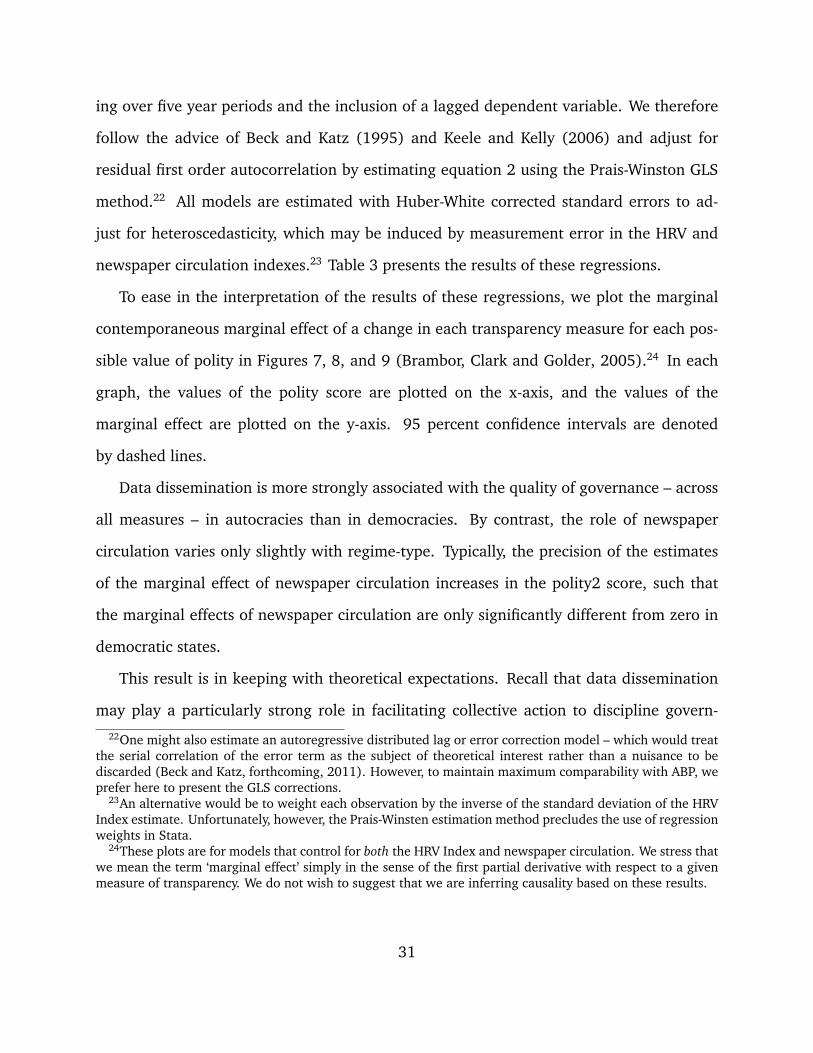
ing over five year periods and the inclusion of a lagged dependent variable. We therefore
follow the advice of Beck and Katz (1995) and Keele and Kelly (2006) and adjust for
residual first order autocorrelation by estimating equation 2 using the Prais-Winston GLS
method.22 All models are estimated with Huber-White corrected standard errors to ad-
just for heteroscedasticity, which may be induced by measurement error in the HRV and
newspaper circulation indexes.23 Table 3 presents the results of these regressions.
To ease in the interpretation of the results of these regressions, we plot the marginal
contemporaneous marginal effect of a change in each transparency measure for each pos-
sible value of polity in Figures 7, 8, and 9 (Brambor, Clark and Golder, 2005).24 In each
graph, the values of the polity score are plotted on the x-axis, and the values of the
marginal effect are plotted on the y-axis. 95 percent confidence intervals are denoted
by dashed lines.
Data dissemination is more strongly associated with the quality of governance – across
all measures – in autocracies than in democracies. By contrast, the role of newspaper
circulation varies only slightly with regime-type. Typically, the precision of the estimates
of the marginal effect of newspaper circulation increases in the polity2 score, such that
the marginal effects of newspaper circulation are only significantly different from zero in
democratic states.
This result is in keeping with theoretical expectations. Recall that data dissemination
may play a particularly strong role in facilitating collective action to discipline govern-
22One might also estimate an autoregressive distributed lag or error correction model – which would treatthe serial correlation of the error term as the subject of theoretical interest rather than a nuisance to bediscarded (Beck and Katz, forthcoming, 2011). However, to maintain maximum comparability with ABP, weprefer here to present the GLS corrections.
23An alternative would be to weight each observation by the inverse of the standard deviation of the HRVIndex estimate. Unfortunately, however, the Prais-Winsten estimation method precludes the use of regressionweights in Stata.
24These plots are for models that control for both the HRV Index and newspaper circulation. We stress thatwe mean the term ‘marginal effect’ simply in the sense of the first partial derivative with respect to a givenmeasure of transparency. We do not wish to suggest that we are inferring causality based on these results.
31

Figure 7: Marginal Effects of a Standard Deviation Change in Transparency on Bureau-cratic Quality
Plots of the marginal effect of transparency on bureaucratic quality forvarying levels of democracy. Polity2 (democracy) scores are plottedon the x-axis, the marginal effect of a one-standard deviation changein each transparency measure is plotted on the y-axis. Point estimatesare represented by the solid line, 95 percent confidence intervals arerepresented by the dashed lines.
ments. Data about aggregate outcomes help to inform members of the public about gen-
eral outcomes, and thus help them better predict the actions of their fellow citizens. As
members of the public cannot discipline their government through the polls in an autoc-
racy, they must rely on the threat of collective action to remove or otherwise punish the
government. Thus, one would expect data dissemination to be particularly important in
autocracies. Of course, these results are hardly proof of this mechanism. We cannot imply
causality from these results, and attempts to do so are well beyond the scope of this paper.
Nonetheless, this finding is suggestive, and the contrast between the different facets of
transparency is clear.
32

Figure 8: Marginal Effects of a Standard Deviation Change in Transparency on Law andOrder
Plots of the marginal effect of transparency on law and order for vary-ing levels of democracy. Polity2 (democracy) scores are plotted onthe x-axis, the marginal effect of a one-standard deviation change ineach transparency measure is plotted on the y-axis. Point estimatesare represented by the solid line, 95 percent confidence intervals arerepresented by the dashed lines.
Across all measures of governance, the HRV Index is a stronger predictor of government
performance than is newspaper circulation in all but the most democratic countries. The
point estimates on the contemporaneous marginal effect of the HRV Index suggest that
a one standard deviation shift in index scores is associated with a 0.65 to 0.75 standard
deviation change in governance indexes in the most autocratic nations, and that this effect
declines as governments grow more democratic. By contrast, a one standard deviation
increase in newspaper circulation is associated with a 0-0.2 standard deviation improve-
ment in governance indexes in autocratic governments, and a broadly similar change in
33

Figure 9: Marginal Effects of a Standard Deviation Change in Transparency on Corruption
Plots of the marginal effect of transparency on corruption for vary-ing levels of democracy. Polity2 (democracy) scores are plotted onthe x-axis, the marginal effect of a one-standard deviation change ineach transparency measure is plotted on the y-axis. Point estimatesare represented by the solid line, 95 percent confidence intervals arerepresented by the dashed lines.
democratic governments.25
The comparatively large magnitude of the association between data dissemination and
governance quality is somewhat surprising for some of these measures. Given that the
public is likely to be well-informed of optimal policies with respect to corruption and law
and order, one might expect a free press to play a larger role in determining the quality
of governance along these dimensions. The measurement schemes employed by the ICRG
may play a roll in this finding. Their measure of law and order encompasses not just
such elements as the independence and fairness of the judiciary, but also measures of the
25Note that the lagged dependent variable coefficients indicate that the steady-state effects of such shiftsare 1.5 to 2 times this size.
34
level of criminality. As the latter may be influenced by the appropriateness of government
policing strategies – the optimal choice of which are unlikely to be known ex ante by the
public – data dissemination may play a role in improving policy choices. Similarly, the
ICRG’s corruption measure refers to the extent to which the spheres of government and
business are intertwined, rather than specifically to acts of bribery or misappropriation by
civil servants. Here too, data dissemination may improve the public’s ability to sanction
policy choices.
Our results thus demonstrate that the HRV Index is robustly correlated with governance
outcomes, controlling for an alternative form of transparency (i.e., newspaper circulation).
For most countries, this association is stronger – by several orders of magnitude – than that
between newspaper circulation and governance. These findings are broadly consistent
with theoretical expectations.
35

Tabl
e3:
Gov
erna
nce
Mea
sure
sR
egre
ssed
onTr
ansp
aren
cy
Bu
reau
crat
icQ
ual
ity
Law
and
Ord
erC
orru
ptio
nLa
gged
DV
0.68
5***
0.72
2***
0.67
0***
0.58
8***
0.62
7***
0.58
5***
0.64
6***
0.72
0***
0.64
5***
[0.6
28,0
.742
][0
.663
,0.7
80]
[0.6
11,0
.730
][0
.505
,0.6
71]
[0.5
55,0
.699
][0
.495
,0.6
74]
[0.5
65,0
.727
][0
.658
,0.7
81]
[0.5
66,0
.724
]Po
lity
20.
018*
**0.
008
0.00
8-0
.007
-0.0
17-0
.026
*0.
016*
0.00
3-0
.001
[0.0
08,0
.028
][-
0.00
1,0.
018]
[-0.
006,
0.02
2][-
0.02
1,0.
008]
[-0.
034,
0.00
1][-
0.04
7,-0
.005
][0
.003
,0.0
28]
[-0.
007,
0.01
3][-
0.01
7,0.
016]
New
spap
erC
irc.
0.02
70.
045
0.14
10.
147*
0.13
80.
224*
[-0.
096,
0.15
0][-
0.09
9,0.
189]
[-0.
002,
0.28
5][0
.002
,0.2
92]
[-0.
047,
0.32
3][0
.053
,0.3
95]
New
spap
erC
irc.
×0.
005
0.00
40.
000
-0.0
010.
011
0.00
2Po
lity
2[-
0.00
7,0.
018]
[-0.
011,
0.01
9][-
0.01
4,0.
014]
[-0.
015,
0.01
3][-
0.00
4,0.
026]
[-0.
015,
0.01
8]
GD
Ppe
rca
pita
0.01
7***
0.01
6***
0.02
0***
0.02
4***
0.02
5***
0.02
7***
-0.0
000.
010*
**-0
.002
[0.0
11,0
.023
][0
.009
,0.0
22]
[0.0
13,0
.026
][0
.013
,0.0
36]
[0.0
15,0
.034
][0
.013
,0.0
41]
[-0.
010,
0.01
0][0
.005
,0.0
15]
[-0.
012,
0.00
9]H
RVIn
dex
0.27
3*0.
325*
0.45
3*0.
541*
*0.
346*
0.50
1*[0
.018
,0.5
27]
[0.0
16,0
.633
][0
.088
,0.8
19]
[0.1
72,0
.910
][0
.068
,0.6
25]
[0.1
10,0
.892
]H
RVIn
dex×
-0.0
26*
-0.0
35*
-0.0
39*
-0.0
54**
-0.0
29*
-0.0
49*
Polit
y2
[-0.
052,
-0.0
00]
[-0.
066,
-0.0
04]
[-0.
076,
-0.0
02]
[-0.
092,
-0.0
17]
[-0.
057,
-0.0
00]
[-0.
088,
-0.0
09]
Con
stan
t0.
495*
**0.
468*
**0.
620*
**1.
530*
**1.
302*
**1.
673*
**0.
975*
**0.
620*
**1.
206*
**[0
.349
,0.6
41]
[0.3
27,0
.609
][0
.439
,0.8
01]
[1.2
84,1
.777
][1
.049
,1.5
56]
[1.3
97,1
.949
][0
.656
,1.2
95]
[0.4
10,0
.830
][0
.882
,1.5
30]
σ̂0.
423
0.38
40.
423
0.73
80.
710
0.72
60.
629
0.62
90.
607
ρ0.
236
0.30
50.
196
0.04
70.
075
-0.0
120.
175
0.07
40.
129
N28
344
326
428
344
326
428
344
326
4
Res
ults
ofa
regr
essi
onof
ICR
Ggo
vern
ance
indi
cato
rsag
ains
tdif
feri
ngm
easu
res
oftr
ansp
aren
cy.
Bot
hth
eH
RVIn
dex
and
the
new
spap
erci
rcul
atio
nva
lues
have
been
stan
dard
ized
.Es
tim
ates
are
obta
ined
thro
ugh
GLS
usin
gth
ePr
ais-
Win
sten
corr
ecti
onfo
rfir
stor
der
auto
corr
elat
ion.
All
stan
dard
erro
rsha
vebe
encl
uste
red
atth
eco
untr
yle
vel.
95pe
rcen
tco
nfide
nce
inte
rval
sar
epr
esen
ted
inbr
acke
ts.
∗de
note
ssi
gnifi
canc
eat
the
90pe
rcen
tle
vel,
∗∗de
note
ssi
gnifi
canc
eat
the
95pe
rcen
tle
vel,
and
∗∗∗
deno
tes
sign
ifica
nce
atth
e99
perc
ent
leve
l.
36

9 Conclusion
We have argued that transparency can be decomposed along various dimensions – the
freedom of the media and the functioning of media markets, institutional forms that fa-
cilitate accountability and public access, and the voluntary dissemination of data by the
government. These varying forms of transparency operate according to different mecha-
nisms and should be expected to have differing effects on government behavior. We have
argued that a crucial feature of government data dissemination lies in its ability to commu-
nicate information about aggregate level outcomes to members of the citizenry, allowing
citizens to adopt more effective strategies to discipline the government when optimal pol-
icy choices are uncertain – and that these effects are likely to be particularly important
under autocratic rule.
We have further constructed an index measuring data dissemination with many desir-
able properties. Our index is based on objective criteria, rather than subjective judgments,
and reflects the dissemination of credible information. The HRV also provides information
on a far wider range of countries and dates than alternative transparency measures. More-
over, it captures a largely unmeasured form of transparency of great theoretical import.
In addition to constructing this index, we show that (1) it systematically differs from
other commonly used indexes in political science, and (2) that these differences have em-
pirical meaning. The HRV Index has a positive association with governance outcomes even
after alternative forms of transparency are controlled for – and this association is substan-
tially stronger with our index than with alternate facets of transparency. It is particularly
strongly associated with good governance in autocracies.
Of course, much remains to be done to more precisely document the mechanisms
by which data dissemination affects government decision-making. Scholars should take
greater care in specifying theoretical mechanisms, in constructing outcome measures, and
37

in documenting the causal influence of transparency. Indeed, one direction of future work
should reflect the decision of governments to release such information (for one example in
this vein, see Hollyer, Rosendorff and Vreeland, 2011). This paper takes a necessary step
in this direction by providing a valid measure of data dissemination.
References
Adserà, Alícia, Carles Boix and Mark Payne. 2003. “Are You Being Served? Political Ac-
counatability and Quality of Government.” The Journal of Law, Economics & Organization
19(2):445–490.
Barro, Robert J. 1973. “The Control of Politicians: An Economic Model.” Public Choice
14(1):19–42.
Barro, Robert J. and Jong Wha Lee. 1996. “International Measures of Schooling Years and
Schooling Quality.” The American Economic Review 86(2):218–223.
Beck, Nathaniel and Jonathan N. Katz. 1995. “What to Do (and What Not to Do) With
Time-Series Cross-Section Data.” The American Political Science Review 89(3):634–647.
Beck, Nathaniel and Jonathan N. Katz. forthcoming, 2011. “Modeling Dynamics in Time-
Series-Cross-Section Political Economy Data.” Annual Review of Political Science .
Besley, Timothy. 2006. Principled Agents? The Political Economy of Good Government. Ox-
ford University Press.
Besley, Timothy and Robin Burgess. 2002. “The Political Economy of Government Re-
sponsiveness: Theory and Evidence from India.” The Quarterly Journal of Economics
117(4):1415–1451.
38

Brambor, Thomas, William Roberts Clark and Matt Golder. 2005. “Understanding Interac-
tion Models: Improving Empirical Analyses.” Political Analysis 13:1–20.
Broz, J. Lawrence. 2002. “Political System Transparency and Monetary Commitment
Regimes.” International Organization 56(4):861–887.
Bueno de Mesquita, Bruce, Alastair Smith, Randolph M. Siverson and James D. Morrow.
2003. The Logic of Political Survival. Cambridge, MA: The MIT Press.
Carmines, Edward G. and Richard A. Zeller. 1979. Reliability and Validity Assessment. SAGE
Publication.
Cheibub, José Antonio, Jennifer Gandhi and James Raymond Vreeland. 2010. “Democracy
and Dictatorship Revisited.” Public Choice 143:67–101.
Chortareas, Georgios, David Stasavage and Gabriel Sterne. 2002. “Does it Pay to be Trans-
parent? International Evidence from Central Bank Forecasts.” The Federal Reserve Bank
of St. Louis Review 84(4):99–118.
Clinton, Joshua and David E. Lewis. 2008. “Expert Opinion, Agency Characteristics, and
Agency Preferences.” Political Analysis 16(1):3–20.
Clinton, Joshua, Simon Jackman and Douglas Rivers. 2004. “The Statistical Analysis of
Roll Call Data.” The American Political Science Review 98(2):355–370.
Djankov, Simeon, Caralee McLiesh, Tatiana Nenova and Andrei Shleifer. 2003. “Who Owns
the Media?” Journal of Law and Economics 46(2):341–381.
Fearon, James D. 2006. “Self-Enforcing Democracy.”.
Ferejohn, John. 1986. “Incumbent Performance and Electoral Control.” Public Choice 50:5–
25.
39
Fforde, Adam and Stefan De Vylder. 1996. From Plan to Market: The Economic Transition
in Vietnam. Westview Press.
Gehlbach, Scott and Edmund Malesky. forthcoming. “The Contribution of Veto Players to
Economic Reform.” Journal of Politics .
Gelman, Andrew and Jennifer Hill. 2006. Data Analysis Using Regression and Multi-
level/Hierarchical Models. Analytical Methods in Social Science Cambridge University
Press.
Grief, Avner. 2006. Institutions and the Path to the Modern Economy: Lessons from Medieval
Trade. Cambridge University Press.
Habyarimana, James, Macartan Humphreys, Daniel N. Posner and Jeremy M. Weinstein.
2009. Coethnicity: Diversity and the Dilemmas of Collective Action. Russell Sage Founda-
tion.
He, Baogang and Mark E. Warren. 2011. “Authoritarian Deliberation: The Deliberative
Turn in Chinese Political Development.” Perspectives on Politics 9(2):269–289.
Heston, Alan, Robert Summers and Bettina Aten. 2009. “Penn World Table Version 6.3.”
Center for International Comparisons of Production, Income and Prices at the University
of Pennsylvania.
Hollyer, James R., B. Peter Rosendorff and James R. Vreeland. 2011. “Democracy and
Transparency.” Journal of Politics 73(4):1–15.
Islam, Roumeen. 2006. “Does More Transparency Go Along with Better Governance?”
Economics and Politics 18(2):121–167.
Jackman, Simon. 2009. Bayesian Analysis for the Social Sciences. Wiley.
40

Keele, Luke and Nathan J. Kelly. 2006. “Dynamic Models for Dynamic Theories: The Ins
and Outs of Lagged Dependent Variables.” Political Analysis 14:186–205.
Kelliher, Daniel. 1997. “The Chinese Debate over Village Self-Government.” The China
Journal 37:63–86.
Khemani, Stuti. 2007. The Politics of Service Deliverty in Democracies. Better Access for the
Poor. Ministry for Foreign Affairs: Sweden chapter Can Information campaigns Over-
come Political Obstacles to Serving the Poor?, pp. 56–69.
Kramer, Gerald H. 1983. “The Ecological Fallacy Revisited: Aggregate- versus Individual-
level Findings on Economics and Elections, and Sociotropic Voting.” The American Polit-
ical Science Review 77.1:92–111.
Kuran, Timur. 1991. “Now Out of Never: The Element of Surprise in the East European
Revolution of 1989.” World Politics 44(1):7–48.
Landry, Pierre. 2008. Decentralized Authoritarianism in China: The Communist Party’s Con-
trol of Local Elites in the Post-Mao Era. Cambridge University Press.
Lebovic, James H. 2006. “Democracies and Transparency: Country Reports to the UN
Register of Conventional Arms, 1992-2001.” Journal of Peace Research 43(5):543–562.
Lewis, Joanna I. 2007. “China’s Strategic Priorities in Internatinal Climate Change Negoti-
ations.” The Washington Quarterly 31(1):155–174.
Malesky, Edmund. 2008. “Strainght Ahead on Red: How Foreign Direct Investment Em-
powers Subnational Leaders.” Journal of Politics 70(1):97–119.
Malesky, Edmund. 2009. “Gerrymandering Vietnam Style: Escaping the Partial Reform
Equilibrium in a Non-Democratic Regime.” Journal of Politics 71(1):132–159.
41
Markus, Gregory B. 1988. “The Impact of Personal and National Conditions on the Pres-
idential Vote: A Pooled Cross-Sectional Analysis.” American Journal of Political Science
32(1):137–154.
Martin, Andrew D. and Kevin M. Quinn. 2002. “Dynamic Ideal Point Estimation via Markov
Chain Monte Carlo for the U.S. Supreme Court, 1953-1999.” Political Analysis 10:134–
153.
Meredith, Martin. 2007. Mugabe: Power, Plunder, and the Struggle for Zimbabwe. Public
Affairs.
Pemstein, Daniel, Stephen A. Meserve and James Melton. 2010. “Democratic Compro-
mise: A Latent Variable Analysis of Ten Measures of Regime Type.” Political Analysis
18(4):426–449.
Prat, Andrea. 2005. “The Wrong Kind of Transparency.” American Economic Review
95(3):862–877.
Prunier, Gérard. 1996. “Somalia: Civil War, Intervention and Withdrawal.” Refugee Survey
Quarterly 15(1):35–85.
Riedel, James and William S. Turley. 1999. “The Politics and Economics of Transition to an
Open Market Economy in Viet Nam.” OECD Development Centre Working Papers 152.
Rodrik, Dani. 1995. “Why is there International Lending?” NBER Working Paper.
Ross, Michael. 2006. “Is Democracy Good for the Poor?” American Journal of Political
Science 50(4):860–874.
Sithole, Masipula. 2001. “Fighting Authoritarianism in Zimbabwe.” Journal of Democracy
12(1):160–169.
42

Stasavage, David. 2003. “Transparency, Democratic Accounatability, and the Economic
Consequences of Monetary Institutions.” American Journal of Political Science 47(3):389–
402.
Stasavage, David. 2004. “Open Door or Closed Door? Transparency in Domestic and
International Bargaining.” International Organization 58:667–703.
Stone, Randall W. 2008. “The Scope of IMF Conditionality.” International Organization
62(4):589–620.
Taylor, Scott D. 2007. Business and the State in Southern Africa: The Politics of Economic
Reform. Lynne Rienner.
Treier, Shawn and Simon Jackman. 2008. “Democracy as a Latent Variable.” American
Journal of Political Science 52:201–217.
Tsai, Lilly L. 2007. “Solidarity Groups, Informal Accountability, and Local Public Goods
Provision in Rural China.” The American Political Science Review 101(2):355–372.
van der Linden, Wim J. and Ronald K. Hambleton, eds. 1997. Handbook of Modern Item
Response Theory. Springer.
van der Walt, Lucien. 1998. “Trade Unions in Zimbabwe: For Democracy, Against Neo-
Liberalism.” Capital and Class 22:85–117.
Voeten, Eric. 2004. “Resisting the Lonely superpower: Repsonses of States in the United
Nations to U.S. Dominance.” Journal of Politics 66(3):729–754.
43

A Appendix
A.1 The Relationship Between Freedom of the Press and the HRV In-
dex
Figure 10 depicts a scatterplot of HRV Index scores against Freedom House scores both
from 1994-2004.26 Both indexes have been standardized by subtracting the mean index
value from each observation and dividing by the standard deviation so that each index is
on the same scale with mean zero and standard deviation 1. The dashed line follows a
45 degree angle, so the two measures would be perfectly correlated if all measures fell
on this line. Observations that fall above the line score relatively highly on the Freedom
House Index (plotted on the y-axis) as compared to the HRV Index (plotted on the x-axis).
The reverse holds for observations that fall below the line. The dotted curve represents a
locally weighted scatterplot smoother (lowess) that is applied to these data.
The correlation between the two indexes is apparent in the figure. The slope of lowess
is close to one for much of the range of both indexes; though it flattens to levels close
to zero at very high levels of both scores. The two indices broadly agree on which coun-
tries should receive relatively high and relatively low transparency scores – though the
magnitude of the difference between high/low-scoring countries and mean index values
is far greater in the HRV Index than in Freedom House. This relationship may reflect the
constrained range of values (0-100) that the Freedom House Index can assume. Freedom
House, however, assigns a wide range of scores to country-years that rank in the middle
of the HRV Index. Perhaps this relationship reflects differences in the way the two indices
evaluate laws and institutions versus practices. Roughly one-third of the Freedom House
index is determined by questions relating to legal protections for freedom of speech.27
26The Freedom House Index has been inverted such that higher scores reflect more transparent countries.27See http://www.freedomhouse.org/template.cfm?page=350&ana_page=376&year=2011.
44

These laws may vary greatly; though they may not reflect great differences in govern-
ment behavior. For instance, Iraq and Qatar receive quite similar Freedom House scores in
the same year – both have similar legal protections for the freedom of speech – but Iraq
receives a substantially lower HRV Index score.
Figure 10: HRV Index Plotted Against Freedom House Scores
A scatter plot of (standardized) Freedom House Freedom of the PressScores and (standardized) HRV Index scores. Each observation corre-sponds to a country-year, and all country years with observations onboth indexes between 1994 and 2004 are plotted. The dashed lineruns through the origin at a 45 degree angle. Were the correlationbetween the two indexes perfect, all observations would lie on thisline. Observation that lie above this line score relatively highly onthe Freedom House Index (compared to HRV). Observations that liebelow this line score relatively lowly on Freedom House. The dottedline is a lowess smoother. The marked observation is from Somalia in1994.
45

A.2 The Relationship Between Newspaper Circulation and the HRV
Index
Figure 11 depicts a scatter plot of the HRV Index against a commonly used measure of
media market size – daily newspaper circulation per 1000 residents, as collected by the
World Bank. Both measures have been standardized by subtracting the mean value from
each observation and dividing by the standard deviation. The dashed line corresponds to
a 45 degree angle; while the dotted line is a lowess smoother plotted over the data.
Figure 11 indicates that both indexes broadly agree on a set of low scoring countries.
Countries with high scores on the HRV Index, however, vary greatly in their daily news-
paper circulation numbers. The two indexes are correlated, though the disagreement over
which countries are highly transparent is greater than between Freedom House and the
HRV values.
46

Figure 11: HRV Index Plotted Against Daily Newspaper Circulation
A scatter plot of (standardized) World Bank Daily Newspaper Cir-culation per 1000 numbers and (standardized) HRV Index scores.Each observation corresponds to a country-year, and all country yearswith observations on both indexes between 1997 and 2004 are plot-ted. The dashed line runs through the origin at a 45 degree angle.Were the correlation between the two indexes perfect, all observa-tions would lie on this line. Observation that lie above this line scorerelatively highly on the newspaper circulation index (compared toHRV). Observations that lie below this line score relatively lowly onnewspaper circulation. The dotted line is a lowess smoother.
47

B Supporting Materials
B.1 Longitudinal Variation in HRV Scores
The economic and (to a lesser extent) political liberalization of the People’s Republic of
China since the late-1970s and early-1980s through the present is well-known and widely
commented upon.28 This liberalization has proceeded to such an extent that some authors
refer to the PRC as exemplifying ‘authoritarian deliberation’ under which information is
provided to the public, who’s opinion is consulted in the policy-making process (He and
Warren, 2011).29 One might therefore expect levels of transparency over the 1980-2008
period to have experienced a large improvement. Figure 12 demonstrates that – at least ac-
cording to our measure – such an increase in transparency has indeed taken place. While
there are few dramatic breaks in the time-series, the PRC’s HRV Index scores have im-
proved steadily and significantly over time.
A dramatic decline in HRV Index scores is visible in Figure 13, which plots Somalia’s
HRV Index scores over time. Throughout the 1970s and 1980s, Somalia was ruled by the
nominally communist government of Mohamed Siad Barre.30 This government is associ-
ated with moderate to low HRV Index scores of between 0.5 and 0. By the late 1980s,
this government faced increasing armed domestic opposition and infighting between clans
once supportive of the government. Unrest grew such that, in 1991, Siad Barre was forced
to flee Mogadishu in a tank, taking with him the foreign exchange reserves of the central
bank (Prunier, 1996, 45). The collapse of the government ushered in a period of civil war
during which Somalia became the paradigmatic example of a failed state. The collapse of
28On the opening of China’s political system, see Landry (2008). On accountability in China see Tsai(2007). Kelliher (1997) notes that the Chinese discussion of local self-government largely focused on thereplacement of corrupt officials with competent political outsiders.
29China’s liberalization has also given rise to a greater openness to foreign influence. For a discussion ofthese changes, with specific reference to investment and climate change, see Lewis (2007, 163-165).
30For an overview of the rise and fall of the Siad Barre regime, see Prunier (1996).
48

Figure 12: PRC HRV Scores Over Time
A longitudinal plot of the PRC’s HRV Index scores from 1980-2008.HRV Index scores are on the y-axis, while time is measured on the x-axis. Diamonds denote mean predicted index scores. Whiskers denote95 percent highest posterior density intervals.
the Siad Barre government coincides perfectly with a dramatic – and statistically signifi-
cant – fall in Somalia’s HRV Index score. In 1990, Somalia’s predicted HRV score fell from
0.046 to -0.111. The following year saw a still more dramatic drop to -0.686, followed by
further declines. Somalia’s transparency score stabilizes around values of -1.66, the lowest
in our sample.
49

Figure 13: Somalia HRV Scores Over Time
A longitudinal plot of Somalia’s HRV Index scores from 1980-2008.HRV Index scores are on the y-axis, while time is measured on the x-axis. Diamonds denote mean predicted index scores. Whiskers denote95 percent highest posterior density intervals.
50