measuring up 2018 - hqontario.ca · 2018-11-16 · measuring up 2018, has often found herself...
TRANSCRIPT

Measuring Up 2018A yearly report
on how Ontario’shealth system is performing
Health QualityOntario Let’s make our health system healthier

Health Quality Ontario is the provincial lead on the quality of health care. We help nurses, doctors and others working hard on the frontlines be more effective in what they do – by providing objective advice and by supporting them and government in improving health care for the people of Ontario.
Learn more about Health Quality Ontario at www.hqontario.ca
ISBN 978-1-4868-2573-8 ( Print ) ISSN 2292-2067 (Print)ISBN 978-1-4868-2574-5 ( PDF ) ISSN 2292-2067 (Online )
On the cover: Karen, standing in her office. See page 6 for her story. We thank Karen and the other people who have shared with us their experiences in Ontario’s health system. (Cover photo by Roger Yip)

Table of Contents
Foreword 2
Executive Summary 3
CHAPTER 1 INTRODUCTION 8
CHAPTER 2 OUR HEALTH 12
Life expectancy 13, 15Potential years of life lost 13, 15Risk factors that affect health 14, 15Opioid-poisoning deaths 16Visits to the emergency department for opioid poisoning 16New starts of opioid medications 16
CHAPTER 3 TRANSITIONS IN CARE 20
Patients in hospital waiting for care elsewhere 21Time to specialist appointment 22Primary care provider informed about specialist care 23Primary care provider up-to-date on hospitalization 23Test results not available 23
Follow-up after hospitalization 24
CHAPTER 4 HOSPITAL CARE 26
Wait time for surgery 27Wait time to see a surgeon 27Emergency department length of stay 28Patient recommendation of emergency department 29Hospital-acquired C. difficile infection 30Obstetric trauma 30
CHAPTER 5 MENTAL ILLNESS AND ADDICTIONS 36
First contact in emergency for a mental illness or addiction, for children and youths 37Follow-up after hospitalization for a mental illness or addiction 38Readmission after hospitalization for a mental illness or addiction 39Physical restraint of patients with a mental illness or addiction 40
CHAPTER 6 LONG-TERM CARE 42
Wait time to admission 43, 45Use of antipsychotic medications 44, 45, 46Daily physical restraints 44, 45, 46Daily moderate or any severe pain 44, 46Falls among residents 45, 46Worsened symptoms of depression 45, 46New or worsened pressure ulcer 46
CHAPTER 7 HOME CARE 48
Caregiver distress 49, 50Daily pain among clients 50
Client involvement in care plan 50
CHAPTER 8 PRIMARY CARE 52
Timely access to a primary care provider 53Continuity of care 53Satisfaction with time to appointment 54Visits to emergency for conditions people thought could have been managed by their primary care provider 55After-hours access to a primary care provider 55Visits to a walk-in clinic 55Cervical cancer screening 56Colorectal cancer screening 56
CHAPTER 9 PALLIATIVE CARE 60
Home visits from a doctor 61, 62Home care services 61, 62Unplanned visits to the emergency department 62
Location of death 63
CHAPTER 10 HEALTH SPENDING 66
Health spending per person 67Health spending on drugs per person 68Skipped dental care due to cost 69
Acknowledgments 70
References 72
Health Quality Ontario | Measuring Up 2018

ForewordKaren, an emergency physician who shared her story for Measuring Up 2018, has often found herself apologizing to patients who receive less than optimal care in the frequently overcrowded emergency department where she works.
“We’re a department of 38 beds and we often have up to 30 admitted patients,” she explained.
“We see a volume of about 170 a day, which means we are trying to see 170 people in eight beds. So, we are doing a lot of hallway and make-do medicine. Overcrowding causes real morbidity and mortality, and there’s an incredible toll on the staff trying to deal with it.”
Jeff, Craig and Farrah – patients and family members who shared their stories for the Measuring Up report – have also experienced the consequences of hospital overcrowding and other challenges facing the health system. Jeff waited four days in the emergency department to get a psychiatric assessment. Craig felt like he was left on his own to care for his dying mother at her home. Farrah struggled to coordinate her care and pay out-of-pocket medical expenses after being diagnosed with lupus.
There are plenty of data in the report to support what health professionals, patients and families are telling us about the challenges they are experiencing. The numbers show emergency department wait times are getting longer for admitted patients. More hospital beds are occupied by patients waiting for care to become available elsewhere. Follow-up visits with a doctor after hospitalization for mental illness or addictions vary widely across the province. People are waiting longer for admission to long-term care homes.
However, there are also data in Measuring Up that show where care is improving. The rate of hospital-acquired C. difficile infection is decreasing. Wait-time targets are mostly being met for cancer and general surgeries. Among people near the end of life, an increasing percentage are receiving home visits from a doctor or palliative home care services, a positive change since Craig and his mother’s experience with the health system.
These types of improvements are a testament to focused efforts by those on the front line, tackling head-on the challenging issues that get in the way of optimal patient care. They show that better patient care is possible.
Providing consistently high-quality care is all the more challenging with a growing and aging population, with patients having increasingly complex needs and multiple chronic conditions, with barriers to communication and coordination between the traditional institutional and professional
“silos” in which care is provided, and with gaps in care as patients move between different parts of the health system.
Addressing a complex problem like overcrowding in hospitals requires the ingenuity and effort of those on the front line, supported by concentrated and sustained system-wide initiatives all informed by meaningful and useful data. Health Quality Ontario will continue to evolve and focus what we measure to both inform system priorities and support front-
line health care professionals whose hard workand dedication Ontario’s patients depend on.
We will also work to support and spread novel, data-driven local solutions to system-wide problems. Karen now reports that as a result of changes implemented at the hospital where she works, the amount of time 9 out of 10 people spend in the emergency department before being admitted has decreased to 27 hours from 57, and patient care and staff morale have improved. Like the doctors, nurses and administrators at Karen’s hospital who saw problems and found ways to solve them, those on the front lines are often the best-positioned to identify and put into practice workable and lasting solutions.
Dr. Andreas LaupacisBoard Chair
Dr. Joshua TepperPresident and Chief Executive Officer
Measuring Up 2018 | Health Quality Ontario
2
Executive SummaryMeasuring Up 2018 provides a yearly look at the performance of Ontario’s health system. It’s produced with input from patients, families, doctors, nurses, and other health care professionals to understand what’s workingwell and where there is room for improvement.
People in Ontario are, on average, seeing overall improvements in many aspects of their health, and in the care they receive. They are living longer and are less likely to die before the age of 75. More people are having cancer surgery or general surgery within the recommended wait times. Rates of hospital-acquired C. difficile, a potentially life-threatening infection, continue to decline. Fewer children and youths are having their first care for a mental health condition occur in the emergency department. And more people are receiving palliative care in their home in their last days of life.
These examples show that improvement is possible, especially when there are focused and sustained efforts by many organizations in the health system to make progress on key indicators.
However, while there are bright spots scattered throughout the health system, an aging population and more people with complex health needs means many parts of the system are under increased strain. Many Ontario hospitals are regularly operating at over 100% capacity, which can lead to compromised care for patients and burnout among doctors, nurses, and other health care providers.
Our key findings point to hospital overcrowding as a symptom and a source of cascading pressures throughout the health system, which include longer wait times for care; insufficient access to mental health and addictions care; wide variation in quality
of care among long-term care homes; and rising levels of distress among unpaid caregivers.
Hospital care
An increasing percentage of Ontario hospital beds are being used for people who are waiting for care elsewhere.
More than 1 in every 7 days (14.8%) that patients spent in Ontario hospitals in 2016/17 were spent waiting to go elsewhere, such as a long-term care home or rehabilitation facility. That’s the highest rate in the last five years and the equivalent of more than 10 large hospitals being occupied every day by patients waiting for care elsewhere. The proportion of hospital beds that were occupied by patients waiting for care elsewhere (called ‘alternate level of care’) varied across Ontario’s regions, from 6.4% to 29.8%.
Emergency department visits are on the rise, especially among those with serious conditions.
Crowded hospital emergency departments across Ontario are under pressure to care for an increasing number of patients. Visits to Ontario’s emergency departments increased by 11.3% over the last six years, to 5.9 million in 2017/18 from 5.3 million in 2011/12. Visits by high-acuity patients – those with more serious conditions – rose at an even higher rate, up by 26% to 4.1 million from 3.3 million.
Hospital emergency departments are facing an increasing challenge dealing with the opioid crisis. Visits to the emergency department due to opioids more than tripled to 54.6 per 100,000 people in 2017, from 15.2 per 100,000 in 2003.
Wait times for care
Patients are spending more time in the emergency department before being admitted to hospital.
People spent an average of nearly 16 hours in the emergency department before being admitted to the hospital in 2017/18, more than 2 hours longer than in 2015/16, and the longest it’s been in six years.
Fewer people are seeing a specialist within 30 days.
Among people who needed to see a specialist, less than one-third (32.3%) reported seeing a specialist within 30 days of being referred to one, down from 37.8% in 2016. Across the province, the proportion of people who reported seeing a specialist in less than 30 days ranged from 25.8% to 39.4% by region.
Fewer hip and knee surgeries are being completed within target times.
The percentage of patients who have their hip or knee replacement surgery completed within the province’s maximum recommended wait time has
3
Health Quality Ontario | Measuring Up 2018
decreased over recent years. In 2017/18, 78% of patients had their hip replacement surgery within target, down from 82% in 2014/15, and 74% of patients had their knee replacement surgery within target, down from 80% in 2014/15. There was substantial variation between hospitals, with the proportion of patients who had their surgery within target ranging from 6% to 100% for hip replacement by individual hospital, and 7% to 100% for knee replacement.
Mental illness and addictions
Some people are not receiving timely or appropriate care for mental illness or addiction.
Emergency department mental health visits can be an indication that people did not receive timely and appropriate care for mental illness or addiction in the community. Although there has been an improvement in the last 10 years, in 2016, more than 4 in 10 (41.2%) children and youths up to24 years old who visited the emergency department for a mental illness or addiction had not received mental health care from a family doctor, pediatrician or psychiatrist during the preceding two years. This rate varied by region from 37.7% to 55.7%.
Timely follow-up with a doctor for patients of all ages after discharge from hospital can help smooth the transition to receiving mental health care in the community and may help prevent a return to hospital. There was a nearly two-fold variation (from 26.5% to 46.1%) between the province’s regions in the percentage of people 16 years of age and older who were seen by a family doctoror psychiatrist within seven days of discharge after being hospitalized with a mental illness or addiction.
Long-term care
Wait times for long-term care homes are getting longer, and vary substantially by region.
In 2016/17, people typically waited more than 3 months (92 days) from hospital to move into a long-term care home, about 3 weeks longer than in 2015/16. There was variation by region in the median wait for a spot in a long-term care home for patients from hospital, ranging from 41 days to 220 days. The median wait time for people who are from the community was even longer, at 149 days in 2016/17, more than 2 weeks longer than in 2015/16. This ranged from 74.5 days to 252 days among regions.
Care that people receive in long-term care homes varies widely across the province.
While there have been some overall improvements in care received in long-term care homes in Ontario, there continue to be persistent and substantial differences in the quality of care, depending on where long-term care home residents live. Province-wide, the percentage of residents who were physically restrained on a daily basis was 5.1% in 2016/17, down from 16.1% in 2010/11, but this ranged from 0% to 57.5% among long-term care homes. There’s been a steady and promising decline in the percentage of residents who were given antipsychotic medications without documented psychosis, to 20.4% in 2016/17 from 35.0% in 2010/11. However, this ranged from 0% to 57.8% across long-term care homes.
Caregiver distress
Caregiver distress continues to increase.
The stresses within the health system not only have an impact on patients, but also on doctors, nurses and other health professionals, as well as on the
family and friends who care for patients. Among clients who received home care for six months or longer, in the first half of 2017/18 more than 1 in 4 (26.1%) had a primary family or friend caregiver who experienced continued distress, anger or depression in relation to their caregiving role. That’s up from 20.8% in the first half of 2012/13. The increase represented 13,244 additional caregivers experiencing continued distress, anger or depression.
From action to results
The key findings of this report highlight that the overcrowding we are seeing in emergency departments and hospital wards is a symptom of challenges with timely access to care elsewhere in the system.
Many people in hospital beds are on longer wait lists for long-term care homes, or for mental illness and addictions supports. When hospital wards are full, this in turn puts pressure on emergency departments, which are already under strain with an increasing number of visits, particularly by people with serious conditions including mental illness and addiction. The hospital overcrowding issue reaches far beyond the walls of the hospital.
We’ve seen that improvements in the health system are possible, especially when there are concerted efforts in targeted areas. Beyond public reporting on these indicators, Health Quality Ontario is committed to working with partners in the health system to identify ways to move forward that will make concrete improvement, reduce and eliminate low-value care, support and enable those working on the front lines to develop and spread effective and sustainable local solutions, and ultimately improve patient care and outcomes.
Measuring Up 2018 | Health Quality Ontario
4

Health system performance in Ontario – 2018 highlightsQuality Element* Bright Spots Room for Improvement No Change
Effective • Premature mortality (potential years of life lost; longevity)• New starts of opioid medication• Overdue for colorectal cancer screening
• Opioid-related emergency department visits and opioid-related deaths
• Cervical cancer screening
• Follow-up after hospitalization for chronic obstructive pulmonary disease or heart failure
Timely • First contact in the emergency department for mental illness or addiction (children and youth)
• Wait time for surgery (cancer, general surgery)
• Time to specialist appointment• Emergency department length of stay for admitted patients• Wait time for surgery (hip, knee)• Wait time to admission to long-term care• Timely access to a primary care provider
• Emergency department length of stay for discharged patients
• After-hours access to a primary care provider
Patient-centred
• Test results available at time of appointment • Pain experienced by residents in long-term care• Home visits from a doctor for palliative care; receiving
palliative home care service
• Caregiver distress • Provider up-to-date on specialist care or discharge from a hospital
• Patient recommendation of emergency department
• Home care clients who feel involved in planning their care
Safe • Hospital-acquired C. difficile infections• Use of antipsychotic medications in long-term care• Use of physical restraints in long-term care
• Physical restraint of patients with a mental illness or addiction • Rate of obstetric trauma with instrument
Efficient • Continuity of primary care • Waiting in hospital for care elsewhere• Location of death
• Total health spending per person
Equitable • Premature mortality• Smoking, obesity, physical inactivity, heavy drinking• Hospital readmission within 30 days for mental illness or addiction• Follow-up after hospitalization for mental illness or addiction• Use of antipsychotic medications and physical restraints, and falls
and depression among long-term care residents• Satisfaction with time to primary care appointment• Emergency department visits that could have been managed by a
primary care provider• Unplanned emergency department visits in the last 30 days of life• Skipped dental care due to cost
* Quality elements identified in Health Quality Ontario’s Quality Matters, which was developed to guide the health system in Ontario to improve care for patients and their families and caregivers, and to support health care providers.
LEGEND Our HealthTransitions in CareHospital Care
Mental Illness and AddictionsLong-Term CareHome Care
Primary CarePalliative CareHealth Spending
Health Quality Ontario | Measuring Up 2018
5

On the front line
Karen’s story
Photo of Karen by Roger Yip. Please see Karen’s story on the next page.
6
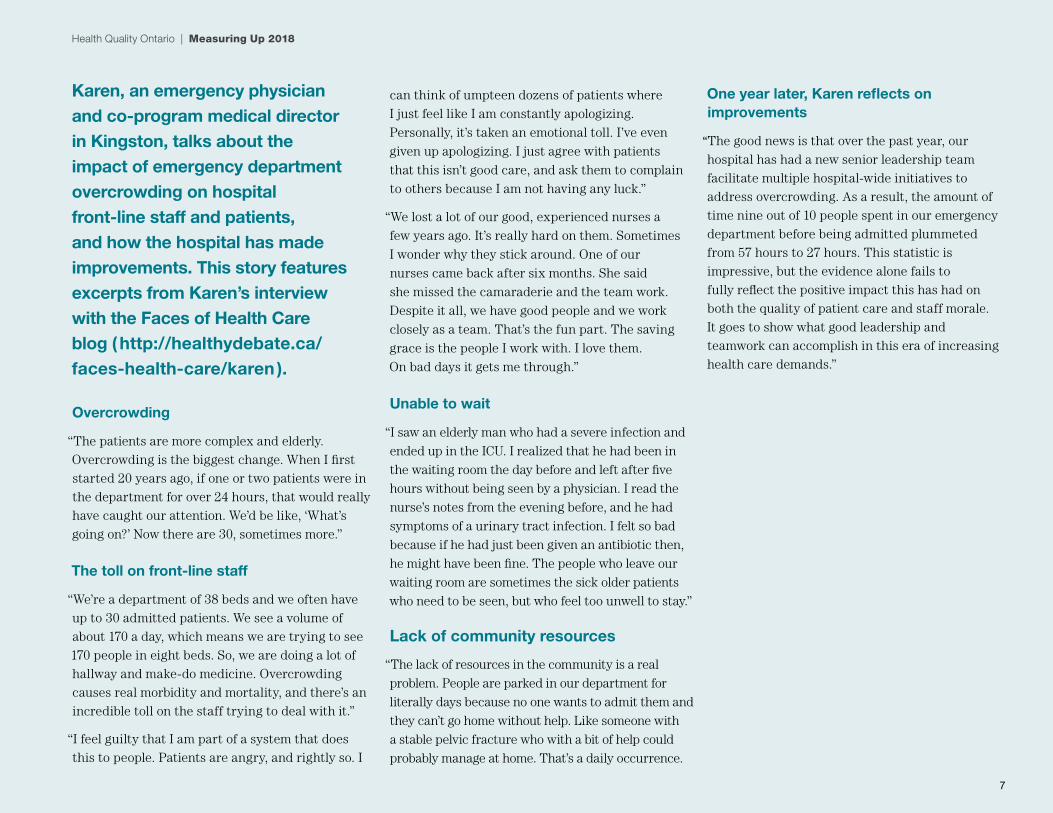
Karen, an emergency physician and co-program medical director in Kingston, talks about the impact of emergency department overcrowding on hospital front-line staff and patients, and how the hospital has made improvements. This story features excerpts from Karen’s interview with the Faces of Health Care blog ( http://healthydebate.ca/faces-health-care/karen ).
Health Quality Ontario | Measuring Up 2018
7
Overcrowding
“The patients are more complex and elderly. Overcrowding is the biggest change. When I first started 20 years ago, if one or two patients were in the department for over 24 hours, that would really have caught our attention. We’d be like, ‘What’s going on?’ Now there are 30, sometimes more.”
The toll on front-line staff
“We’re a department of 38 beds and we often have up to 30 admitted patients. We see a volume of about 170 a day, which means we are trying to see 170 people in eight beds. So, we are doing a lot of hallway and make-do medicine. Overcrowding causes real morbidity and mortality, and there’s an incredible toll on the staff trying to deal with it.”
“I feel guilty that I am part of a system that does this to people. Patients are angry, and rightly so. I
can think of umpteen dozens of patients where
I just feel like I am constantly apologizing.
Personally, it’s taken an emotional toll. I’ve even
given up apologizing. I just agree with patients
that this isn’t good care, and ask them to complain
to others because I am not having any luck.”
“We lost a lot of our good, experienced nurses a
few years ago. It’s really hard on them. Sometimes
I wonder why they stick around. One of our
nurses came back after six months. She said
she missed the camaraderie and the team work.
Despite it all, we have good people and we work
closely as a team. That’s the fun part. The saving
grace is the people I work with. I love them.
On bad days it gets me through.”
Unable to wait
“I saw an elderly man who had a severe infection and
ended up in the ICU. I realized that he had been in
the waiting room the day before and left after five
hours without being seen by a physician. I read the
nurse’s notes from the evening before, and he had
symptoms of a urinary tract infection. I felt so bad
because if he had just been given an antibiotic then,
he might have been fine. The people who leave our
waiting room are sometimes the sick older patients
who need to be seen, but who feel too unwell to stay.”
Lack of community resources
“The lack of resources in the community is a real
problem. People are parked in our department for
literally days because no one wants to admit them and
they can’t go home without help. Like someone with
a stable pelvic fracture who with a bit of help could
probably manage at home. That’s a daily occurrence.
One year later, Karen reflects on improvements
“The good news is that over the past year, our hospital has had a new senior leadership team facilitate multiple hospital-wide initiatives to address overcrowding. As a result, the amount of time nine out of 10 people spent in our emergency department before being admitted plummeted from 57 hours to 27 hours. This statistic is impressive, but the evidence alone fails to fully reflect the positive impact this has had on both the quality of patient care and staff morale. It goes to show what good leadership and teamwork can accomplish in this era of increasing health care demands.”

11 Introduction
8

Keeping Ontarians informed about their health care
Measuring Up 2018 is the 12th edition of Health Quality Ontario’s yearly report on the performance of the province’s health care system. The report provides an overview of the quality of health care people in Ontario are receiving, by shining a spotlight on where things are working and should be built upon, and where things need to be improved.
The report is based on a set of health system performance indicators developed by Health Quality Ontario in association with health care experts and health system partners such as doctors, nurses, hospitals and home care providers, as well as patients and their families and caregivers.
While much of Measuring Up is about what these health system performance indicators show, a significant part of the report is dedicated to stories from patients and caregivers. These stories provide a human context for all the facts and figures. They show us what all the data mean in terms of real experiences and outcomes for real people.
How the data are presented
Measuring Up has evolved considerably over the years to better serve Ontarians. It has been further refined in 2018 to make the information it contains more easily accessible to increasingly busy readers. To this end, the report has been streamlined to focus on key findings.
For those who want a more detailed look at how the health system is working, province-wide and in individual regions, all indicator results analyzed for the report can be found in the Measuring Up 2018 Technical Supplement tables available on the Health Quality Ontario website. The tables include results for indicators and stratifications that are not highlighted among the report’s key findings.
Also available on the website is a Technical Appendix with details on the methodology and indicators used. The report contains the most recent data available. Throughout the year, Health Quality Ontario’s website will have updated data on many of the indicators in Measuring Up.
The report includes comparisons between performance indicator results in Ontario's regions. For some indicators, results are also provided for local communities. The local-community data cover smaller geographic planning areas, and so provide a better understanding of health system performance and patient needs at a local level.
In some instances, Measuring Up compares Ontario to other provinces and to Canada as a whole, as well as to socioeconomically similar countries. Some of the international comparisons are facilitated by the ongoing collaboration between Health Quality Ontario and The Commonwealth Fund, which is expanding Ontario’s participation in The Commonwealth Fund’s annual international health policy surveys. The surveys usually include Canada, Australia, France, Germany, the Netherlands, New Zealand, Norway, Sweden, Switzerland, the United Kingdom, and the United States. The report also uses health data from the Organisation for Economic Cooperation and Development, which includes the same 11 countries.
Health Quality Ontario | Measuring Up 2018
9
CHAPTER 1 INTRODUCTION

FIGURE 1.1 Map of Ontario regions
Ontario regions
1 Erie St. Clair2 South West3 Waterloo Wellington4 Hamilton Niagara Haldimand Brant
5 Central West6 Mississauga Halton7 Toronto Central8 Central
9 Central East10 South East11 Champlain12 North Simcoe Muskoka
13 North East14 North West
Measuring Up 2018 | Health Quality Ontario
10


22Our HealthAbout 6 out of 10 people in Ontario rated their own health as either
“excellent” or “very good” in 2016, and nearly 3 out of 10 said it was “good.” [1] Still, many Ontarians face significant health challenges.
Chronic illnesses such as heart disease, lung disease, cancer and diabetes are the leading cause of death and disability in the province. [ 2 ] About 1 out of 5 people in Ontario aged 12 and older have two or more chronic health conditions. [ 3]
Health risk factors such as smoking, obesity, heavy drinking and physical inactivity, which remain prevalent among a significant proportion of Ontarians, play a major role in the development of chronic diseases.
12

Longevity is improving, but varies according to where people liveLife expectancy is increasing in Ontario. A person born between 2014 and 2016 – the most recent years for which data are available – has a life expectancy of 82.5 years, compared to 80.8 years for someone born between 2005 and 2007.
People are also losing fewer potential years of life to premature mortality – defined as death before the age of 75. The rate of potential years of life lost collectively per 100,000 population younger than 75 improved steadily in Ontario between 2005 and 2015, decreasing to 4,188 years per 100,000, from 4,897.
However, rates of potential years of life lost varied by more than two-fold between Ontario’s regions, in the period between 2013 and 2015. Rates ranged from 3,003 potential years of life lost per 100,000 population younger than 75 in the Mississauga Halton region, to 7,975 years inthe North West region. ( Figure 2.1 )
To put the North West region rate into perspective, the last time the overall Ontario rate of potential years of life lost was that high was in 1982.
FIGURE 2.1 Potential years of life lost due to premature death per 100,000 population younger than 75, in Ontario, by region, 2013/2015
Per 100,000 population
10000
0
2500
5000
7500
Ont
ario
Erie
St.
Cla
ir
Sou
th W
est
Wat
erlo
oW
ellin
gton
Ham
ilton
Nia
gara
Hal
dim
and
Bra
nt
Cen
tral
Wes
t
Mis
siss
auga
Hal
ton
Toro
nto
Cen
tral
Cen
tral
Cen
tral
Eas
t
Sou
th E
ast
Cha
mp
lain
Nor
th S
imco
eM
usko
ka
Nor
th E
ast
Nor
th W
est
Region
41984839 4858
4117
4822
35503003
3932
3086
4070
5250
4000
4872
6255
7975
Health Quality Ontario | Measuring Up 2018
13
CHAPTER 2 OUR HEALTH
Data source: Table 13-10-0743-01, Statistics CanadaNote: Age-adjusted

Smoking, inactivity, obesity, heavy drinking persist as risks to healthIn 2016, 16.0% of Ontarians aged 12 and older reported smoking cigarettes daily or occasionally. More than 1 in 6 – 17.6% – were heavy drinkers. Heavy drinkers were defined as males who reported having five or more drinks, or females who reported having four or more drinks, on one occasion, at least once a month in the past year.
More than 1 in 4 people aged 18 and over were obese based on adjusted self-reported height and weight, and about 1 in 5 reported being physically inactive. Physical inactivity was defined as not engaging in any moderate or vigorous physical activity that lasted a minimum of 10 continuous minutes within a week.
Smoking, obesity, being physically inactive and drinking heavily have all been linked to increased risk of cardiovascular disease, cancer and other diseases.
The rates at which people were affected by these risk factors varied substantially by region, household income, and immigration status, as well as by education for all but heavy drinking.
Rates of smoking and physical inactivity were higher among those with lower incomes, while obesity rates were highest for middle income groups. Heavy drinking was more prevalent among those with higher incomes. ( Figure 2.2 )
Immigrants to Canada had lower rates of smoking, obesity and heavy drinking than non-immigrants, but had a higher rate of physical inactivity.
FIGURE 2.2 Percentages of people who reported smoking cigarettes daily or occasionally; reported being physically inactive; were obese based on adjusted self-reported weight and height; were heavy drinkers; in Ontario, by household income quintile, 2016
Percent
50
0
10
20
30
40
Smoking:aged 12 and over
Physical inactivity: aged 18 and over
Adjusted obesity: aged 18 and over
Heavy drinker: aged 12 and over
Household Income Quintle
23.6
16.9 15.613.7
11.1
23.4 22.220.8
18.8
14.8
23.9
28.2 29.1
24.6 23.4
12.914.8
18.5 18.7
23.5
Q1 (lowest) Q2 Q3 Q4 Q5 (highest)
Measuring Up 2018 | Health Quality Ontario
14
CHAPTER 2 OUR HEALTH
Data source: Canadian Community Health Survey, Statistics CanadaNote: Age-adjusted
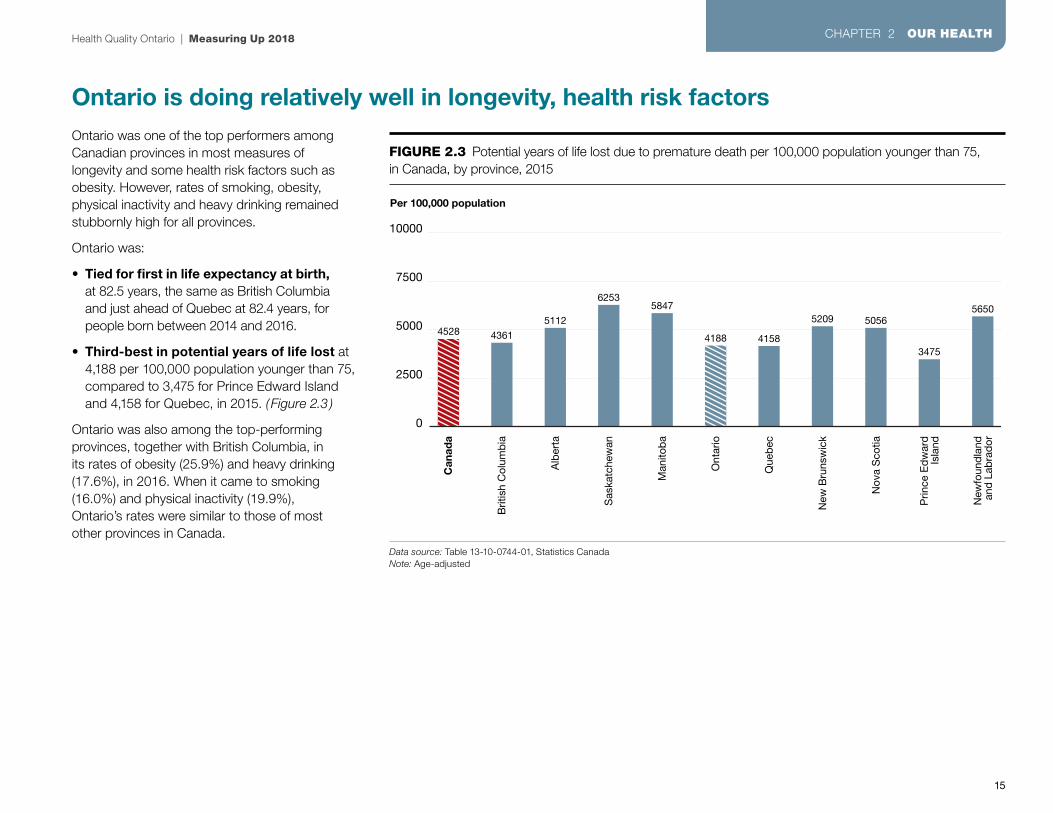
Ontario is doing relatively well in longevity, health risk factorsOntario was one of the top performers among Canadian provinces in most measures of longevity and some health risk factors such as obesity. However, rates of smoking, obesity, physical inactivity and heavy drinking remained stubbornly high for all provinces.
Ontario was:
• Tied for first in life expectancy at birth,at 82.5 years, the same as British Columbia and just ahead of Quebec at 82.4 years, for people born between 2014 and 2016.
• Third-best in potential years of life lost at 4,188 per 100,000 population younger than 75, compared to 3,475 for Prince Edward Island and 4,158 for Quebec, in 2015. ( Figure 2.3 )
Ontario was also among the top-performing provinces, together with British Columbia, in its rates of obesity (25.9%) and heavy drinking (17.6%), in 2016. When it came to smoking (16.0%) and physical inactivity (19.9%), Ontario’s rates were similar to those of most other provinces in Canada.
FIGURE 2.3 Potential years of life lost due to premature death per 100,000 population younger than 75,in Canada, by province, 2015
Per 100,000 population
10000
0
2500
5000
7500
Can
ada
Brit
ish
Col
umb
ia
Alb
erta
Sas
katc
hew
an
Man
itob
a
Ont
ario
Que
bec
New
Bru
nsw
ick
Nov
a S
cotia
Prin
ce E
dw
ard
Isla
nd
New
foun
dla
ndan
d L
abra
dor
4528 4361
5112
62535847
4188 4158
5209 5056
3475
5650
Health Quality Ontario | Measuring Up 2018
15
CHAPTER 2 OUR HEALTH
Data source: Table 13-10-0744-01, Statistics CanadaNote: Age-adjusted

Opioid-related deaths and visits to emergency have surged higherOntario is in the midst of an opioid crisis. The rate of opioid-poisoning deaths – from overdose or taking an opioid by error – nearly tripled to 8.9 per 100,000 population in 2017, from 3.0 in 2003. ( Figure 2.4 ) In 2017, 1,265 Ontarians died from opioid poisoning.
Visits to the emergency department for opioid poisoning more than tripled to 54.6 per 100,000 population in 2017, from 15.2 in 2003.
Opioid medications can be very useful for pain management, but they also have risks, including addiction, overdose and death. One strategy to reduce people’s exposure to opioids is for health care professionals to prescribe them even more cautiously – less often, for lower doses and for shorter periods of time.
The rate of new starts of patients on opioid medications has fallen in Ontario, to 818 per 10,000 population in 2017, from 959 in 2013. New starts are prescriptions filled for people who have not filled a prescription for opioids in six months.
In 2017, the rate of new starts of patients on opioid medications varied widely between the province’s regions, from 672 per 10,000 population in the Toronto Central region to 1,070 in the Erie St. Clair region.
Opioid overdoses, especially fatal overdoses, are often the result of people using drugs obtained from “street” sources. [4 ] Health care professionals can help reduce the risk of overdose by identifying patients who are using opioids in a way that might cause them harm, and offering them evidence-based treatment.
FIGURE 2.4 Emergency department visits for opioid poisoning, and opioid-poisoning deaths, per 100,000 population, in Ontario, 2003–2017
Rate per 100,000 population
100
0
20
60
40
80
2003 2004 2005 2006 2007 2008 2009 2010 2011 2012 2013 2014 2015 2016 2017
Calendar Year
15.2
3.0
16.5 16.7
3.5
17.0 17.5 18.7
3.83.73.42.7
22.2 21.6 22.1 23.5
54.6
22.5 24.5 26.331.7
4.1 4.3 4.2 4.4 4.7 4.9 5.3 6.28.9
Emergency department visits for opioid poisoning
Opioid-poisoning deaths
Measuring Up 2018 | Health Quality Ontario
16
CHAPTER 2 OUR HEALTH
Data source: National Ambulatory Care Reporting System, Ontario Opioid-Related Death Database, Office of the Chief Coroner for Ontario, provided by Public Health Ontario

Indicators
Life expectancy at birth: The number of years a newborn baby can expect to live, based on mortality trends and data
Life expectancy reflects a population’s general health and wellbeing.
Potential years of life lost: Potential years of life collectively lost due to death before age 75, per 100,000 population younger than 75
Potential years of life lost is a useful indicator of a population’s general health and wellbeing.
Heavy drinking: The percentage of people 12 and older who reported alcohol consumption that would classify them as heavy drinkers, defined as males who reported having five or more drinks, or females who reported having fouror more drinks, on one occasion, at least once a month in the past year
Heavy drinking is associated with liver disease and many cancers.
Visits to the emergency department for opioid poisoning: The number of visits made to the emergency department for opioid poisoning – which includes overdose and taking or being given an opioid by error – per 100,000 population.
Visits to the emergency department for opioid poisoning reflect particularly the threat to public health posed by the non-prescription street sources of synthetic opioids often used by people who make opioid-related emergency department visits.
Cigarette smoking: The percentage of people 12 and older who reported daily or occasional smoking
Smoking increases risk of lung cancer, heart disease, stroke, chronic obstructive pulmonary disease (COPD), and diminished overall health.
Opioid-poisoning deaths: The number of deaths due to opioid poisoning, per 100,000 population
The use of opioid drugs is associated with significant risk of opioid use disorder, overdose and death.
Obesity: The percentage of people 18 and older who were obese based on adjusted self-reported height and weight
Obesity is associated with increased risk of heart disease, stroke, type 2 diabetes and some cancers.
New starts of opioid medications: The rate of prescriptions for opioids filled for people who have not filled a prescription for opioids in six months, per 10,000 population
Prescribers and patients may want to consider alternative medications or dosages, due to the risks associated with the use of opioid drugs.
Physical inactivity: The percentage of people 18 and older who reported being physically inactive
Being physically inactive increases risk of many diseases, including cardiovascular disease, type 2 diabetes and cancer.
Health Quality Ontario | Measuring Up 2018
17
CHAPTER 2 OUR HEALTH
For more indicator results related to Our Health, as well as results for all the indicators analyzed for Measuring Up 2018, please see the Technical Supplement tables at www.hqontario.ca.

Farrah’s story:
Life with chronic conditionsFarrah, now 31, was diagnosed with depression at 21, lupus at 23, and
endometriosis at 27. This is her story of hospital stays, emergency department visits, family doctor and specialist visits, and mental health care.
( continued on next page )
18

It took visits with more than a dozen doctors before Farrah was finally diagnosed with lupus at age 23. The 31-year-old graduate student says she was often sick since she was about 15, but at the time doctors told her it was a flu or a cold. In the summer of 2010, while working at a summer job in Ottawa, Farrah’s skin broke out in painful rashes. She saw a doctor who ordered a blood test that indicated she might have lupus, a chronic disease that can cause inflammation in any part of the body, including the skin, muscles, joints, lungs, heart, or brain.
From Ottawa to Ajax to Toronto
The clinic in Ottawa told her there was a three-to-six-month wait to see a rheumatologist to diagnose her condition. Farrah couldn’t wait that long, as her pain was getting worse. She left Ottawa and moved back to live with her parents in Ajax,near Toronto.
“I needed help caring for myself. I was suffering from all-over body inflammation, and the possibility of failing organs,” Farrah says. Her parents rushed her to the emergency department at a hospital in Ajax, where they suspected she might have lupus, and transferred her to a hospital in Scarborough, and then a lupus clinic at a hospital in Toronto, where she was diagnosedwith lupus.
After seeing specialists in Toronto, she had trouble finding the right medications. “With lupus, you can never be sure you’re getting the right meds,” Farrah says. “The meds I got gave me drug-induced hepatitis, and within a week I ended up back in hospital.” Because of her condition, Farrah
is not able to drive, which made the many trips to
Toronto a big challenge.
Waiting for specialists
Four years later, in 2014, Farrah was diagnosed
with endometriosis, a condition in which the cells
that normally grow in the uterus end up growing
outside the uterus. This involved more trips to
the doctor in Toronto, where she felt isolated as
someone with endometriosis in a clinic where most
of the patients were pregnant.
She also had to arrange visits to other specialists
in Toronto, including a heart specialist, lung
specialist, and psychiatrist. Several times, she
ended up in the emergency department of a
hospital in Ajax, often waiting for five or six hours
in severe pain before seeing a doctor.
Farrah also has depression, which she says gets
worse when she’s in hospital and when she’s
struggling with her health. She saw a family doctor
in Ajax about her depression, but wait times were
at least a month to see a psychiatrist, which was a
long time given her state of mind. “It seemed that
life could only get worse or have very negative
outcomes and I didn't see any point in getting out
of bed or trying to live life normally,” Farrah says.
“I never wanted to be a burden to loved ones, so I
tried to get help as soon as possible but was unable
to, and waiting a month meant my bad thoughts
spiralled to worse.”
Going into debt
When she was first diagnosed with lupus, Farrah
paid tens of thousands of dollars out of pocket for
the medications. “It was terrible,” she says. “I remember telling my doctor, ‘I can’t afford this.’ I ended up going into a lot of debt ... He put me on another medication that was less money but didn’t work as well.” She eventually qualified for coverage through the Ontario Disability Support Program, but this didn’t cover the $90 physiotherapy sessions that have helped ease the chronic pain in her hip. Because of the cost, Farrah sees the physiotherapist far less than the weekly visits her doctor recommended.
“I’m grateful to be living in a country where I can find a specialist and don’t have to pay for doctor visits or hospital stays,” Farrah says. “If I were living in the States, I would be homeless. But Ontario’s whole system needs to be streamlined for people who aren’t there on a one-time basis.”
Health Quality Ontario | Measuring Up 2018
19

33Transitions in CareA health system that manages transitions well provides people with the care they need, when and where they need it.
In such a system, people who need to see a specialist, to be admitted to hospital, or to obtain home care will not encounter bottlenecks in the system. They won’t have to wait too long for care, or receive medical treatment on a gurney in a hallway because there’s no room for them anywhere else in an overcrowded hospital.
Achieving efficient transitions in care for a growing population with diverse and complex health care needs is a challenging task. Rapid changes in medicine and technology add to the challenge, as well as providing opportunities to develop local solutions.
20

More people across Ontario are waiting in hospital for care elsewhereIn 2016/17, on average, 4,233 Ontario hospital beds were occupied every day by patients waiting to receive care somewhere else – such as in a long-term care home or rehabilitation facility. That was the equivalent of about 10-and-a-half large, 400-bed hospitals filled to capacity each day by patients who didn’t need the level of services hospitals are designed to provide.[5]
In terms of province-wide hospital capacity, 14.8% of inpatient days in Ontario hospitals were used to care for patients waiting for an “alternate level of care” elsewhere. That was up from 13.9% in 2015/16, and 14.3% in 2011/12. [6 ] Inpatient days are a count of the number of days individual hospital beds in a given region or facility are occupied by patients.
Having a substantial proportion of inpatient hospital bed capacity used for patients waiting for care elsewhere is both a cause and a consequence of bottlenecks in the flow of patients between different parts of Ontario’s health system.
Patients are often stuck in hospital because the transition to the care they need elsewhere is blocked. In 2016/17 across Ontario, about half of alternate-level-of-care inpatient days were used for patients waiting for a place in a long-term care home, 12% were used for patients waiting for assisted living, and 11% for patients waiting for publicly funded home care.[7] This blockage may worsen, as the median wait time from hospital for long-term care increased by 31.4% in 2016/17. For details on this wait, see the Long-Term Care chapter.
At the same time, having many patients in hospital who should be elsewhere limits the capacity of hospitals to accept new patients, such as those waiting in their emergency departments. For more on wait times in emergency for admitted patients, see the Hospital Care chapter.
As a result of these bottlenecks, both the patients stuck waiting in a hospital bed and the ones stuck waiting in emergency may receive care that is less than optimal.
Patients needing an alternate level of care have a growing but varying collective impact on different regions of Ontario. The proportion of all inpatient days hospital beds were occupied by patients waiting for care elsewhere increased in most regions in 2016/17, and ranged from 6.4% to 29.8%. ( Figure 3.1 )
FIGURE 3.1 Percentage of inpatient days that beds were occupied by patients who were waiting to receive care elsewhere, by region, in Ontario, 2015/16 and 2016/17
Percent
0
10
20
40
30
Ont
ario
Erie
St.
Cla
ir
Sou
th W
est
Wat
erlo
oW
ellin
gton
Ham
ilton
Nia
gara
Hal
dim
and
Bra
nt
Cen
tral
Wes
t
Mis
siss
auga
Hal
ton
Toro
nto
Cen
tral
Cen
tral
Cen
tral
Eas
t
Sou
th E
ast
Cha
mp
lain
Nor
th S
imco
eM
usko
ka
Nor
th E
ast
Nor
th W
est
Region
2015/16
2016/17
13.9
19.3
14.8 15.111.7
9.4
6.4
14.1 14.2
11.09.4
13.4
5.5
11.3 12.215.7
20.9
17.313.8
11.614.5
17.7 18.7
12.614.3
22.5
29.8
15.4
20.5
27.1
Health Quality Ontario | Measuring Up 2018
21
CHAPTER 3 TRANSITIONS IN CARE
Data source: Bed Census Summary, Wait Time Information System, provided by Cancer Care OntarioNote: Crude Rates

The proportion of patients who say they were able to see a specialist less than 30 days after referral falls to 32%When Ontarians aged 16 and older needed care beyond what a family doctor or nurse practitioner could provide, 32.3% reported seeing a specialist less than 30 days after being referred to one, in 2017. That was a decrease from 37.8% in 2016.
The proportion of people who said they saw a specialist in less than 30 days was lower in 2017 than in any year since 2013, when it was 37.6%. Also in 2017, 34.2% of people reported waiting 30-89 days to see a specialist, and 33.5% said they waited 90 days or longer.
Across the province, the proportion of people who reported seeing a specialist in less than 30 days varied by region from 25.8% to 39.4%.
An international survey showed Ontario’s performance in wait times to see a specialist was in the middle of the pack among provinces in Canada, in 2016. The proportion of people aged 18 and older who said they were able to see a specialist within 4 weeks ranged from 29% in Newfoundland to 47% in Nova Scotia, compared to 36% in Ontario. ( Figure 3.2 )
However, when compared internationally to socioeconomically similar countries, Ontario’s performance was among the poorest, just below Norway’s 37% and far behind Switzerland’s 73%. ( Figure 3.2 )
FIGURE 3.2 Percentage of people aged 18 and older who needed to see a specialist in the previous 2 years and reported seeing a specialist within 4 weeks of referral, in Canada and internationally, 2016
Percent
100
0
20
60
40
80
Can
ada
Brit
ish
Col
umb
ia
Alb
erta
Sas
katc
hew
an
Man
itob
a
Ont
ario
Que
bec
New
Bru
nsw
ick
Nov
a S
cotia
Prin
ce E
dw
ard
Isla
nd
New
foun
dla
nd
Aus
tral
ia
Fran
ce
Ger
man
y
Net
herla
nds
New
Zea
land
Nor
way
Sw
eden
Sw
itzer
land
Uni
ted
Kin
gdom
Uni
ted
Sta
tes
Province/Country
3843 43 46
34 36 35 33
47
39
29
70
49
73
48
37
49
6471
6055
Measuring Up 2018 | Health Quality Ontario
22
CHAPTER 3 TRANSITIONS IN CARE
Data source: Commonwealth International Survey, 2016

Patients report doctors do not always receive updates on their careIn a 2017 survey of Ontarians 16 and older, among those who had seen a specialist in the previous 12 months, about 1 in 5 reported that their regular family doctor or other primary care provider did not seem informed and up-to-date about the care they received from a specialist.
Among survey respondents who had been admitted to hospital in the previous 12 months, about 1 in 4 said their regular primary care provider was not up-to-date about their hospitalization after they were discharged.
Among all respondents who had had a medical test in the previous 12 months, about 1 in 8 reported that test results were not available at the time of a scheduled appointmentwith their provider.
Communication gaps between hospitals, specialists and primary care providers, as well as delays in obtaining test results, affect the quality of care patients receive, and waste time and resources.
The proportion of respondents who said their test results were not available improved slightly between 2013 and 2017, falling to 12.8% from 14.8%. ( Figure 3.3 )
FIGURE 3.3 Percentages of people aged 16 and older who reported that their provider did not seem informed and up-to-date about the care they received from their specialist; that test results were not available at the time of a scheduled appointment with their provider within the past 12 months; or that their provider was not up-to-date following their discharge from hospital; in Ontario, 2013–2017
Percent
50
0
10
30
20
40
2013 2014 2015 2016 2017
Calendar Year
23.6
16.7
14.8
26.1
15.5
13.4
22.3
19.2
13.1
24.5
15.6
13.2
25.8
18.4
12.8
Provider was not up-to-date about specialist care
Provider was not informed of discharge from hospital
Test results were not available
Health Quality Ontario | Measuring Up 2018
23
CHAPTER 3 TRANSITIONS IN CARE
Data source: Health Care Experience Survey, provided by the Ministry of Health and Long-Term Care

Less than half of people hospitalized for heart failure or COPD have a follow-up visit with a doctor within 7 days of leaving hospitalOntario-wide in 2016/17, 48.0% of people hospitalized for heart failure and 37.9% of people hospitalized for chronic obstructive pulmonary disease (COPD), among those aged 40 and older, saw a primary care doctor or a specialist within seven days after discharge.
The rates of such follow-up visits by patients with these two very serious diseases have not changed substantially since 2005/06.
Rates of follow-up visits varied between Ontario’s regions from 35% to 58% for heart failure, and from 29% to 51% for chronic obstructive pulmonary disease. Rates were generally higher in central areas of the province. ( Figure 3.4 )
A follow-up visit with a health care professional such as a doctor soon after discharge from hospital may help a patient better manage their condition and reduce the need for rehospitalization. [8 ]
The data reported here include only follow-up visits with a family doctor or a specialist, and it is possible that patients saw another health professional after discharge.
FIGURE 3.4 Percentage of patients aged 40 and older who saw a family doctor or specialist within 7 days of discharge after hospitalization for chronic obstructive pulmonary disease (COPD) or congestive heart failure, by region, in Ontario, 2016/17
Percent
0
20
40
100
80
60
Ont
ario
Erie
St.
Cla
ir
Sou
th W
est
Wat
erlo
oW
ellin
gton
Ham
ilton
Nia
gara
Hal
dim
and
Bra
nt
Cen
tral
Wes
t
Mis
siss
auga
Hal
ton
Toro
nto
Cen
tral
Cen
tral
Cen
tral
Eas
t
Sou
th E
ast
Cha
mp
lain
Nor
th S
imco
eM
usko
ka
Nor
th E
ast
Nor
th W
est
Region
Chronic obstructive pulmonary disease
Congestive heart failure
37.9 37.7
48.0 45.8 43.7 46.1
54.649.7
58.3
36.141.8 38.6
48.5 50.854.0 52.8 52.1
48.142.345.0 44.3
37.033.4 32.3
43.134.8
39.738.532.0 29.5
Measuring Up 2018 | Health Quality Ontario
24
CHAPTER 3 TRANSITIONS IN CARE
Data source: Discharge Abstract Database, Ontario Health Insurance Plan Claims History Database, Physician Database, Registered Persons Database, provided by the Institute for Clinical Evaluative SciencesNote: Age- and sex-adjusted

Indicators
Hospital beds occupied by patients waiting to receive care elsewhere: Looks at “inpatient days” – the total of all the days each hospital bed was occupied by a patient – to measure the percentage of inpatient days hospital beds were occupied by patients identified as requiring an alternate level of care such as a long-term care home or home care
Having beds occupied by patients who could be elsewhere may affect hospitals’ ability to provide services to other patients who require hospital care. As well, patients waiting in hospital may face greater risk of exposure to infections than they would elsewhere. They may also lose some ability to perform activities, and may be socially isolated.
Primary care provider informed about specialist care: The percentage of people 16 and older who reported in a survey that their primary care provider seemed informed and up-to-date about the care they received from their specialist, among those who had a regular primary care provider and who had seen a specialist in the previous 12 months
Lack of communication between specialists and primary care providers may affect the care patients receive.
Time to specialist appointment: The percentages of people 16 and older who reported in a survey that they saw a specialist in: less than 30 days, 30 to 89 days, or 90 or more days, after referral by a primary care provider
Timeliness is a critical aspect of access to care and an important component of measuring transitions in care.
Primary care provider up-to-date on hospitalization: The percentage of people 16 and older who reported in a survey that their primary care provider seemed up-to-date about their hospitalization, among those who had a primary care provider and were admitted to hospital in the previous 12 months
Lack of communication between hospitals and primary care providers may affect the care patients receive.
Test results not available: The percentage of people 16 and older who reported in a survey that test results were not available at the time of a scheduled appointment with their primary care provider within the previous 12 months, among those who had a regular primary care provider and who had a test within the previous 12 months
Not receiving test results in a timely manner may affect the care patients receive.
Follow-up after hospitalization for heart failure or chronic obstructive pulmonary disease: The percentages of patients aged 40 and older who were seen by a family doctor or a specialist within seven days of discharge after being hospitalized for heart failure or chronic obstructive pulmonary disease
A follow-up visit with a health care professional such as a doctor soon after discharge from hospital for heart failure or chronic obstructive pulmonary disease may help the patient to better manage their condition, and reduce the need for rehospitalization.
Health Quality Ontario | Measuring Up 2018
25
CHAPTER 3 TRANSITIONS IN CARE
For more indicator results related to Transitions in Care, as well as results for all the indicators analyzed for Measuring Up 2018, please see the Technical Supplement tables at www.hqontario.ca.
e
44Hospital CareHospitals play a vital role in the health care system. Ontario’s 141 public hospital corporations, spread over about 228 hospital sites, [9] provide a wide range of both inpatient and outpatient services to a growing population of more than 14 million people.
Collectively, Ontario hospitals care for more than a million inpatients per year, [10] including about 350,000 who have surgery. They also perform 1.2 million outpatient surgeries, [11] and see millions more patients each year for ambulatory care and emergency department visits.
26

e
People are waiting longer for hip and knee replacement surgeriesMore patients are having to wait longer than Ontario’s maximum recommended wait time for their hip or knee replacement surgery.
This wait target varies according to the priority level assigned to the patient’s surgery, which is based on their condition. Overall, 90% of surgeries are supposed to be completed within the wait target for their priority level.
In 2017/18, 73.7% of patients had their knee replacement surgery within target, as did 78% of patients who had hip replacement surgery.
The percentages of patients who had their surgery within target decreased in recent years for both knee and hip replacements. Slightly more of those surgeries were within target in 2017/18 than in 2008/09. ( Figure 4.1 )
There was substantial variation in wait times for surgery between individual hospitals. For example, the proportion of patients who had their surgery within target ranged among hospitals from 7% to 100% for knee replacement, and from 6% to 100% for hip replacement.
Among patients who had cancer surgery, 87.3% had their surgery within the maximum recommended wait time for its assigned priority level, in 2017/18, an increase from 70.9% in 2008/09. Wait targets were met for 95% of patients who had general surgery, an increase from 90.6% in 2008/09.
Ontario also has maximum recommended wait times for a first appointment with a surgeon, which also vary by priority level. This wait is measured from the date the patient is referred to the surgeon to the date of the appointment. Province-wide in 2017/18, more than 90% of patients who had hip replacement or general surgery had their first appointment with a surgeon within target. Among patients who had cancer surgery, 86.6% had their first appointment within target, as did 88.9% of patients who had knee replacement surgery.
Among individual hospitals, the proportion of patients who saw a surgeon within the target wait time ranged from 37% to 100% for knee replacement and from 44% to 100%for hip replacement.
FIGURE 4.1 Percentages of hip and knee replacement surgeries completed within the maximum recommended wait time, in Ontario, 2008/09 to 2017/18
Percent
100
0
20
60
40
80
90
10
50
30
70
2008/09 2009/10 2010/11 2011/12 2012/13 2013/14 2014/15 2015/16 2016/17 2017/18
Fiscal Year
72.476.3 75.6 76.8 79.4 79.8 81.5 80.0 78.5 78.0
70.074.2 73.6 71.7
74.5 77.079.8 79.1
75.0 73.7
Knee replacementHip replacement
Health Quality Ontario | Measuring Up 2018
27
CHAPTER 4 HOSPITAL CARE
Data source: Wait Time Information System, provided by Cancer Care Ontario

Waits in emergency are getting longer for admitted patientsVisits to Ontario’s emergency departments increased by 11.3% over the last six years,to 5.9 million in 2017/18 from 5.3 million in 2011/12. Visits by high-acuity patients – those who have more serious conditions – rose by 26% to 4.1 million from 3.3 million.* [12]
The average time spent in emergency by patients admitted to the hospital from emergency increased to 16.0 hours in 2017/18, up from 15.3 hours the previous year, 13.8 hours two years previously, and 14.8 hours in 2011/12. ( Figure 4.2 )
Having a high number of inpatient hospital beds occupied by patients waiting for an “alternate level of care” – such as a spot in a long-term care home or assisted living facility – has been cited by care providers and researchers as a key contributor to long wait times in emergency for people admitted to hospital. [ 13 ]
For patients not admitted to hospital, time spent in emergency has remained relatively steady. High-acuity patients who were discharged spent an average of 3.9 hours in emergency in 2017/18, and low-acuity discharged patients spent an average of 2.4 hours.
The provincial maximum recommended length of stay in emergency is 8 hours for admitted patients, 8 hours for high-acuity discharged patients and 4 hours for low-acuity discharged patients – with the target to be met for 90% of patients. In 2017/18, 35.5% of admitted patients, 93.4% of high-acuity discharged patients, and 87.2% of low-acuity discharged patients completed their visit within the wait target.
Time spent in emergency varied somewhat between Ontario’s regions. The widest regional variation was in the average length of stay for admitted patients, which ranged from 10.7 hours to 21.1 hours.
FIGURE 4.2 Average time spent in the emergency department, by patient acuity, in Ontario, 2011/12 to 2017/18
Hours
16
0
0
4
12
8
2
10
6
14
2011/12 2012/13 2013/14 2014/15 2015/16 2016/17 2017/18
Fiscal Year
14.814.2
13.614.3
13.8
15.3
16.0
High-acuity discharged patients
Admitted patients
Low-acuity discharged patients
2.3
4.0
2.2
3.9
2.1
3.8
2.2
3.7
2.2
3.8
2.2
3.8
2.4
3.9
Measuring Up 2018 | Health Quality Ontario
28
CHAPTER 4 HOSPITAL CARE
Data source: National Ambulatory Care Reporting System, provided by Access to Care, Cancer Care Ontario*The data on this page include only emergency department visits to hospitals that report emergency wait times.

6 in 10 people rate their emergency department positivelyIn 2016/17, 59.7% of patients surveyed said they would “definitely” recommend the emergency department they visited to friends and family.
That was slightly less than the 62.9% who said they felt that way in 2015/16, but a bit more than the 56.3% who said the same in 2006/07. ( Figure 4.3 )
The high point in this indicator came in 2015/16, when 62.9% of respondents said they would
definitely recommend the emergency department they visited.
Patients’ recommendations of emergency departments varied substantially by region. Among regions for which data were available, the proportion of patients who would “definitely” recommend the emergency department they used ranged from 45.5% to 71.3%.
FIGURE 4.3 Percentage of survey respondents who said they would “definitely” recommend their emergency department to friends and family, in Ontario, 2006/07 to 2016/17
Percent
100
0
20
60
80
40
2006/07 2008/09 2010/11 2012/132007/08 2009/10 2011/12 2013/14 2014/15 2015/16 2016/17
Fiscal Year
56.3 57.3 56.8 57.7 58.2 58.7 60.1 60.6 61.8 62.959.7
Health Quality Ontario | Measuring Up 2018
29
CHAPTER 4 HOSPITAL CARE
Data source: National Research Corporation Health, provided by Ontario Hospital Association

Patient safety: C. difficile declining, obstetric trauma unchangedThe rate of hospital-acquired C. difficile infection has decreased steadily in Ontario over recent years, to 0.22 cases per 1,000 inpatient days in 2017/18 from 0.35 in 2011/12. Inpatient days count the days individual hospital beds are occupied by patients. ( Figure 4.4 )
C. difficile (Clostridium difficile) is a bacteria that can overgrow in the bowel. It can cause diarrhea, fever and even death, [14 ] and can be spread between hospital patients by hospital staff or visitors. C. difficile infections cannot be eliminated, but hospitals have reduced their spread through infection prevention and control programs.
In 2017/18, C. difficile infection rates ranged among Ontario’s regions from 0.08 to 0.25 cases per 1,000 inpatient days.
The rate of obstetric trauma during instrument-assisted vaginal births in hospital, at 14.9 per 100 such births, has remained substantially unchanged in Ontario since 2012/13.
Childbirth is the most common reason for hospital admission in Ontario. About 12% of vaginal deliveries in the province’s hospitals each year are instrument-assisted. Instruments to assist delivery include forceps and vacuum devices. For this indicator, obstetric trauma includes lacerations of third-degree or greater severity, or other injury to pelvic organs.
Among Ontario’s regions, the rate of obstetric trauma ranges from 10.0 to 18.0 per 100 instrument-assisted vaginal births.( Figure 4.5 )
FIGURE 4.4 Rate of hospital-acquired C. difficile infection per 1,000 inpatient days, in Ontario, 2009/10 to 2017/18
Rate per 1,000 inpatient days
0.50
0.40
0.00
0.20
0.30
0.10
2009/10 2011/12 2013/14 2015/162010/11 2012/13 2014/15 2017/182016/17
Fiscal Year
0.29 0.30
0.350.33
0.30
0.26 0.260.24
0.22
Data source: Self-Reporting Initiative, provided by the Ministry of Health and Long-Term Care
FIGURE 4.5 Rate of obstetric trauma per 100 instrument-assisted vaginal deliveries, by region, in Ontario, 2016/17
Rate per 100 instrument-assisted vaginal deliveries
20
25
0
10
15
5
Region
Ont
ario
Erie
St.
Cla
ir
Sou
th W
est
Wat
erlo
oW
ellin
gton
Ham
ilton
Nia
gara
Hal
dim
and
Bra
nt
Cen
tral
Wes
t
Mis
siss
auga
Hal
ton
Toro
nto
Cen
tral
Cen
tral
Cen
tral
Eas
t
Sou
th E
ast
Cha
mp
lain
Nor
th S
imco
eM
usko
ka
Nor
th E
ast
Nor
th W
est
14.9
10.012.8 11.8
15.6 15.012.9
18.0
13.215.3
13.2
17.615.4 14.6 14.6
Measuring Up 2018 | Health Quality Ontario
30
CHAPTER 4 HOSPITAL CARE
Data source: Discharge Abstract Database, provided by the Canadian Institute for Health InformationNote: Risk-adjusted rate

Optimizing surgical qualityOntario’s hospitals are committed to patient safety and better surgeries. As of June 2018, approximately 77% of surgeries were performed in hospitals that were part of the Ontario Surgical Quality Improvement Network.
The 46 hospital sites in the province that are members of the network use surgical data as the foundation for better care before, during and after a patient’s surgery. As part of the network, they follow principles established by a U.S.-based, international surgical improvement program, which helps support improvement in two ways. It gives each member a snapshot of its surgical performance by comparing its outcomes for specific surgeries with those of the broader membership. Those comparisons help to pinpoint where surgeons at any member facility can make improvements. It also offers best practices hospitals can use to ensure better outcomes.
Fifteen additional hospital sites joined the network in the first half of 2018.
Ontario Surgical Quality Improvement Network hospitals
South WestGrey Bruce Health Services Owen SoundLondon Health Sciences Centre, Children’s Hospital
London
London Health Sciences Centre, University Hospital
London
London Health Sciences Centre, Victoria Hospital
London
Waterloo WellingtonCambridge Memorial Hospital CambridgeGrand River Hospital, Kitchener Waterloo Campus
Kitchener
Guelph General Hospital Guelph
Hamilton Niagara Haldimand BrantHamilton Health Sciences, Hamilton General Hospital
Hamilton
Hamilton Health Sciences, Juravinksi Hospital
Hamilton
McMaster Children’s Hospital HamiltonNiagara Health System, St. Catharines Site
St. Catharines
St. Joseph’s Healthcare Hamilton Hamilton
Central West William Osler Health Centre, Brampton Civic Hospital
Brampton
William Osler Health Centre, Etobicoke General Hospital
Etobicoke
Mississauga HaltonHalton Healthcare, Oakville Trafalgar Memorial Hospital
Oakville
Toronto CentralMichael Garron Hospital East YorkThe Hospital for Sick Children TorontoSinai Health System, Mount Sinai Hospital
Toronto
St. Joseph’s Health Centre Toronto TorontoSt. Michael’s Hospital TorontoSunnybrook Health Sciences Centre TorontoUniversity Health Network, Princess Margaret Hospital
Toronto
University Health Network, Toronto General Hospital
Toronto
University Health Network, Toronto Western Hospital
Toronto
CentralHumber River Hospital TorontoMackenzie Health Richmond HillMarkham Stouffville Hospital MarkhamNorth York General Hospital North YorkSouthlake Regional Health Centre Newmarket
Central EastLakeridge Health, Oshawa Hospital OshawaPeterborough Regional Health Centre PeterboroughThe Scarborough Hospital Scarborough
South EastKingston Health Sciences Centre, Kingston General Hospital
Kingston
Quinte Health Care Belleville
ChamplainL’Hôpital Montfort OttawaThe Children’s Hospital of Eastern Ontario OttawaThe Ottawa Hospital OttawaPembroke Regional Hospital PembrokeQueensway Carleton Hospital OttawaRenfrew Victoria Hospital Renfrew
North Simcoe MuskokaCollingwood General and Marine Hospital CollingwoodOrillia Soldier’s Memorial Hospital Orillia
North EastHealth Sciences North, Ramsey Lake Health Centre
Sudbury
North Bay Regional Health Centre North Bay
North WestSioux Lookout Meno Ya Win Health Care Sioux LookoutThunder Bay Regional Health Sciences Centre
Thunder Bay
Note: The sites added in 2018 are in gold.
Health Quality Ontario | Measuring Up 2018
31
CHAPTER 4 HOSPITAL CARE

FIGURE 4.6 Ontario Surgical Quality Improvement Network hospitals by region
Southern Ontario
Northern Ontario
Greater Toronto Area
7
1
2
63
4
7
85
9
10
12
11
13
14
13
Ontario regions
1 Erie St. Clair2 South West3 Waterloo Wellington4 Hamilton Niagara Haldimand Brant
5 Central West6 Mississauga Halton7 Toronto Central8 Central
9 Central East10 South East11 Champlain12 North Simcoe Muskoka
13 North East14 North West
New hospital sitesHospitals
Measuring Up 2018 | Health Quality Ontario
32
CHAPTER 4 HOSPITAL CARE

Indicators
Wait time for surgery (cancer, hip replacement, knee replacement or general surgery): The percentage of patients who had their surgery completed within the maximum recommended wait time for its priority level, with the wait time measured from the date the decision was made with the surgeon or specialist to have the surgery performed, to the date the surgery was completed
Patients may have to endure pain, discomfort and deterioration while they wait for surgery, and cancer patients’ tumours may grow or spread.
Emergency department length of stay: The total amount of time patients spent in the emergency department, from the time they were triaged or registered – whichever came first – to when they were discharged from emergency to go home, or were admitted to an inpatient bed, or were transferred to another acute-care facility
Long stays in the emergency department may delay needed care and can be uncomfortable for patients.
Wait time to see a surgeon (cancer, hip replacement, knee replacement or general surgery): The percentage of patients who had their first appointment with a surgeon within the maximum recommended wait time for their surgery’s priority level, with the wait time measured from the date a referral was received by the surgeon’s office, or a central intake office, to the date of the patient’s first consultation with the surgeon
Seeing a surgeon quickly is important for patients, who may have to endure emotional distress, pain and discomfort while they wait.
Patient recommendation of emergency department: The percentage of patients surveyed who said they would "definitely" recommend their emergency department to family and friends
Patient satisfaction is a key component of patient-centred care.
Hospital-acquired C. difficile infection: The number of hospital-acquired cases of C. difficile (Clostridium difficile) infection per 1,000 inpatient days.
Infection with C. difficile can cause severe diarrhea, fever, abdominal pain and even death.[15]
Obstetric trauma during instrument-assisted vaginal delivery:The number of cases of obstetric trauma ( lacerations of third-degree or greater severity, or other obstetric injury to pelvic organs ) per 100 instrument-assisted vaginal births
Obstetric care represents high volumes of inpatient hospital stays.
Health Quality Ontario | Measuring Up 2018
33
CHAPTER 4 HOSPITAL CARE
For more indicator results related to Hospital Care, as well as results for all the indicators analyzed for Measuring Up 2018, please see the Technical Supplement tables at www.hqontario.ca.

Jeff, Calder and Kim’s story:
Four days in emergencyJeff* went to his local rural hospital’s emergency department during a
mental health crisis looking for help. Little did he and his family know he would end up waiting there for four days.
( continued on next page )
34

On a bitterly cold and windy Friday evening in February 2016, Jeff finished a family dinner at home and walked 15 minutes through freezing rain and snow to the emergency department of the hospital in his hometown of Espanola in northeastern Ontario. The 18-year-old had been experiencing symptoms of depression on and off for two years, but on this night, he had become overwhelmed and distraught, and had hit a crisis point. He needed to talk to someone and didn’t know where else to go.
In emergency, but without treatment
The small hospital in the town about an hour’s drive west of Sudbury did not have any mental health specialists on staff, so Jeff was assessed by a nurse and an emergency physician and spoke with a mental health crisis worker by phone through the Ontario Telemedicine Network (OTN). The emergency physician and OTN worker decided Jeff should be put on a Form 1, a legal document under the Mental Health Act that means physicians felt he was at risk of harming himself or someone else, or not able to provide care for himself. Form 1 authorizes the hospital to keep a patient in detention for up to 72 hours while admitted to a specific psychiatric bed until they receive a psychiatric assessment.
This all came as a shock to Jeff’s parents, Calder* and Kim*, who rushed to the hospital as soon as they found out what was going on, only to find their son, alone and afraid, in a room in the hospital’s emergency department.
“The nurses treated our son very well,” Calder says, “but they are not trained in how to deal with someone who is having a mental health crisis. He wasn’t able to get any mental health care. We didn’t know what to do. It was a nightmare.”
Waiting for a psychiatric assessment
Calder and Kim were told Jeff would be transferred to a psychiatric bed in Sudbury, but there was no bed available that night, so they would have to wait until Saturday morning at 9. But when the hospital called Sudbury the next morning, there was still no bed.
“They kept trying,” Calder says. “Each time they told us that there was no bed, my son was just more and more defeated. We all were. We were just spent. We came there for help. We didn’t have any doctor see him all weekend, or even have a counsellor.”
Legally, the 72-hour clock on the Form 1 wouldn’t officially begin until Jeff was admitted to the psychiatric bed, and since there was no bed available, Jeff could remain in the emergency department well beyond the 72 hours. Calder and Kim desperately tried to find a way to get their son back home before then, but the Form 1 meant the hospital would be obliged to call the police to bring Jeff back into their care if he left given their concerns for his safety. Calder made calls to several different organizations trying to find a way to get help for his son and received conflicting information. They decided to wait it out.
Transferred to hospital in Sudbury
After four days in the emergency department, still without any psychiatric care, on Tuesday a bed opened up and Jeff was in an ambulance by 11 a.m. and admitted to the hospital in Sudbury by 12:30 p.m. A psychiatrist assessed Jeff at 2 p.m. and the family were in the car heading home by 2:30.
“The psychiatrist had a smile on his face,” Calder recalls, “like, this is going to be a success story because he’s going to be just fine. It was a good eye-opener for us. It ended up being really good because it exposed a lot of stuff for us as parents.”
Calder and Kim arranged for Jeff to receive counselling for eight months, and he also went to his family doctor who prescribed him some medication. He is now doing much better, but the trauma of those four days in emergency lingers for the family. “It’s amazing the cracks that we fell through,” Calder says. “No one who wants help should end up getting trapped like that. If my son had shown up in emergency with a badly fractured leg, he would have been sent to an orthopedic surgeon immediately. Why is it different for a mental health crisis?”
Jeff’s experience led to the introduction of a Rural Health Hub project in the region, which ensures there is a consulting psychiatrist available through OTN every day to assess and speak to patients at rural hospitals.
* Names have been changed for privacy.
Health Quality Ontario | Measuring Up 2018
35
e
55Mental Illness and AddictionsAbout 7 out of 10 people in Ontario rate their mental health as excellent or very good, and just over 2 out of 10 rate it as good. [16] Still, about two million Ontarians visit a family doctor or psychiatrist for a mental illness or addiction every year. [17]
A serious mental illness or addiction can decrease a person’s life expectancy by 7 to 24 years, [18] and mental health conditions are among the top causes of disability in Canada. [19]
Mental health conditions often have their onset during childhood or adolescence, [20] and people 15 to 24 years old are the age group most likely to experience a mood or substance use disorder. [21,22]
36
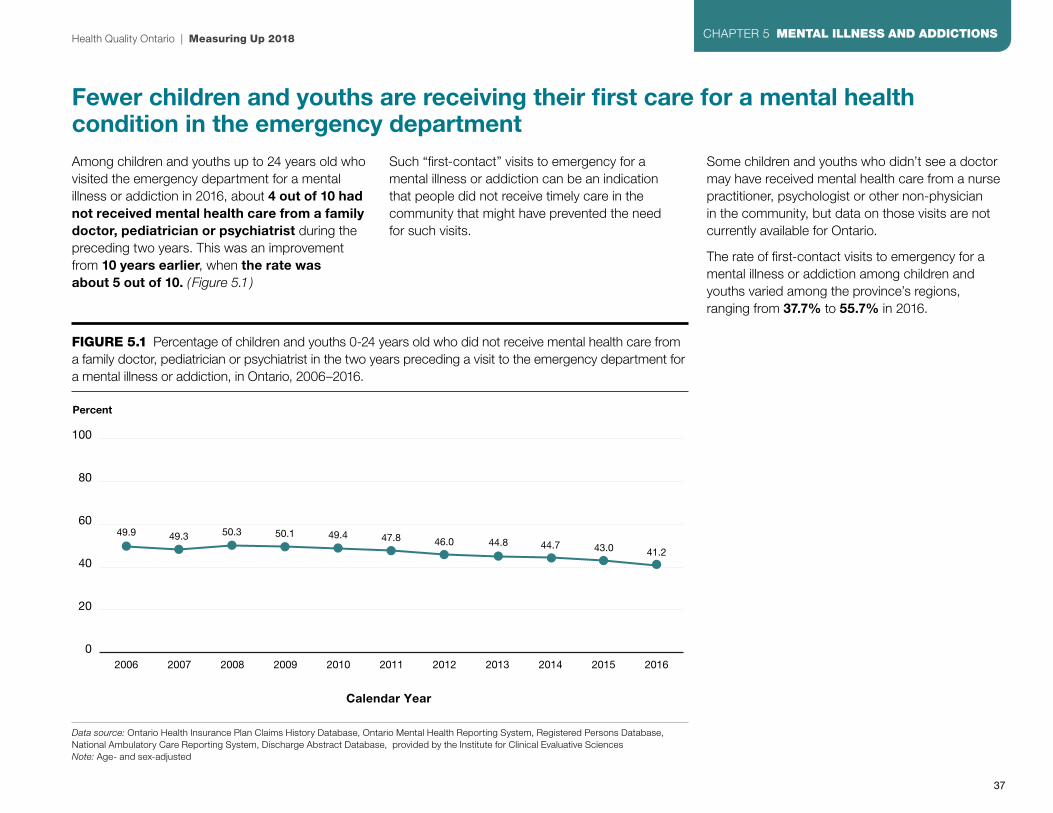
e
Fewer children and youths are receiving their first care for a mental health condition in the emergency departmentAmong children and youths up to 24 years old who visited the emergency department for a mental illness or addiction in 2016, about 4 out of 10 had not received mental health care from a family doctor, pediatrician or psychiatrist during the preceding two years. This was an improvement from 10 years earlier, when the rate was about 5 out of 10. ( Figure 5.1 )
Such “first-contact” visits to emergency for a mental illness or addiction can be an indication that people did not receive timely care in the community that might have prevented the need for such visits.
Some children and youths who didn’t see a doctor may have received mental health care from a nurse practitioner, psychologist or other non-physician in the community, but data on those visits are not currently available for Ontario.
The rate of first-contact visits to emergency for a mental illness or addiction among children and youths varied among the province’s regions, ranging from 37.7% to 55.7% in 2016.
FIGURE 5.1 Percentage of children and youths 0-24 years old who did not receive mental health care from a family doctor, pediatrician or psychiatrist in the two years preceding a visit to the emergency department for a mental illness or addiction, in Ontario, 2006–2016.
Percent
100
0
20
60
80
40
2006 2008 2010 20122007 2009 2011 2013 2014 2015 2016
Calendar Year
49.9 49.3 50.3 50.1 49.4 47.8 46.0 44.8 44.7 43.0 41.2
Health Quality Ontario | Measuring Up 2018
37
CHAPTER 5 MENTAL ILLNESS AND ADDICTIONS
Data source: Ontario Health Insurance Plan Claims History Database, Ontario Mental Health Reporting System, Registered Persons Database, National Ambulatory Care Reporting System, Discharge Abstract Database, provided by the Institute for Clinical Evaluative Sciences Note: Age- and sex-adjusted

Follow-up visits with a doctor after hospitalization vary by region There was substantial variation between the province’s regions in the percentage of people who were seen by a family doctor or psychiatrist within seven days of discharge after being hospitalized with a mental illness or addiction. ( Figure 5.2 )
About 1 in 4 people in the North Westregion who were hospitalized for a mental illness or addiction had such a follow-up visit, compared to about 1 in 2 people in the Toronto Central region.
Timely follow-up with a doctor after discharge from hospital can help smooth the transition to receiving mental health care in the community, and may help prevent a return to hospital. [ 23 ]
Some people who didn’t have a follow-up visit with a doctor may have had one with a nurse practitioner, psychologist or other non-physician in the community, but data on those visits are not currently available for Ontario.
Follow-up visits with a doctor also varied widely according to neighbourhood income.
About 4 out of 10 people who lived in the wealthiest neighbourhoods were seen by a doctor within seven days of discharge after a hospitalization for mental illness or addiction, while the rate was just over 3 out of 10 for people who lived in the poorest neighbourhoods.
Ontario-wide, the rate of follow-up visits with a doctor after a hospitalization for a mental illness or addiction was 36.1% in 2016, compared to 37.3% in 2006.
FIGURE 5.2 Percentage of patients aged 16 and older who were seen by a general practitioner/family physician or psychiatrist within seven days of discharge after being hospitalized for a mental illness or addiction, in Ontario, by region, 2016
Percent
100
0
20
40
60
80
Ont
ario
Erie
St.
Cla
ir
Sou
th W
est
Wat
erlo
oW
ellin
gton
Ham
ilton
Nia
gara
Hal
dim
and
Bra
nt
Cen
tral
Wes
t
Mis
siss
auga
Hal
ton
Toro
nto
Cen
tral
Cen
tral
Cen
tral
Eas
t
Sou
th E
ast
Cha
mp
lain
Nor
th S
imco
eM
usko
ka
Nor
th E
ast
Nor
th W
est
Region
36.132.4 29.4
35.4 37.4 39.142.6
46.140.3
36.333.3 35.6
32.026.7 26.5
Measuring Up 2018 | Health Quality Ontario
38
CHAPTER 5 MENTAL ILLNESS AND ADDICTIONS
Data source: Ontario Health Insurance Plan Claims History Database, Ontario Mental Health Reporting System, Registered Persons Database, Discharge Abstract Database, provided by the Institute for Clinical Evaluative Sciences Note: Age- and sex-adjusted
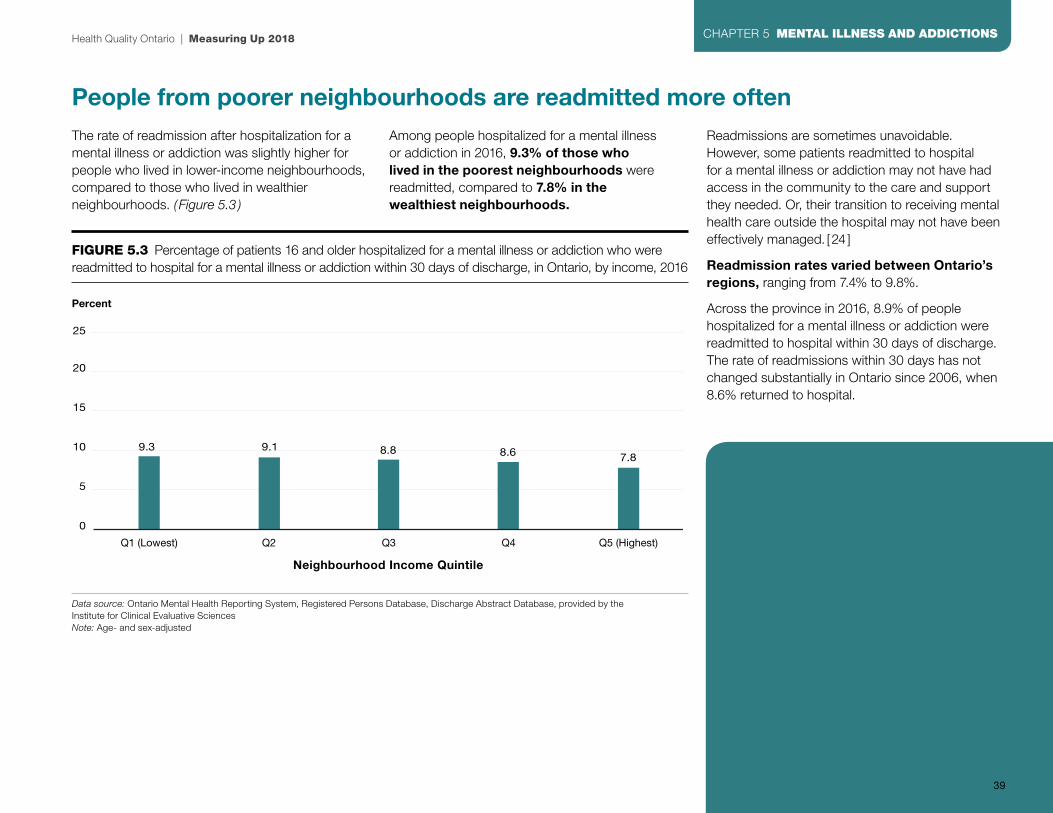
People from poorer neighbourhoods are readmitted more oftenThe rate of readmission after hospitalization for a mental illness or addiction was slightly higher for people who lived in lower-income neighbourhoods, compared to those who lived in wealthier neighbourhoods. ( Figure 5.3 )
Among people hospitalized for a mental illness or addiction in 2016, 9.3% of those who lived in the poorest neighbourhoods were readmitted, compared to 7.8% in the wealthiest neighbourhoods.
Readmissions are sometimes unavoidable. However, some patients readmitted to hospital for a mental illness or addiction may not have had access in the community to the care and support they needed. Or, their transition to receiving mental health care outside the hospital may not have been effectively managed. [24 ]
Readmission rates varied between Ontario’s regions, ranging from 7.4% to 9.8%.
Across the province in 2016, 8.9% of people hospitalized for a mental illness or addiction were readmitted to hospital within 30 days of discharge. The rate of readmissions within 30 days has not changed substantially in Ontario since 2006, when 8.6% returned to hospital.
FIGURE 5.3 Percentage of patients 16 and older hospitalized for a mental illness or addiction who were readmitted to hospital for a mental illness or addiction within 30 days of discharge, in Ontario, by income, 2016
Percent
0
5
10 9.3 9.1 8.8 8.6 7.8
15
20
25
Q1 (Lowest) Q2 Q3 Q4 Q5 (Highest)
Neighbourhood Income Quintile
Health Quality Ontario | Measuring Up 2018
39
CHAPTER 5 MENTAL ILLNESS AND ADDICTIONS
Data source: Ontario Mental Health Reporting System, Registered Persons Database, Discharge Abstract Database, provided by the Institute for Clinical Evaluative Sciences Note: Age- and sex-adjusted
Did you know?Mental illness and poverty often go hand-in-hand. Serious mental illness can interfere with education or work and thereby limit opportunities for obtaining employment and earning income. At the same time, poverty is a known risk factor for mental illness. [25 ]
In Ontario, people in the lowest income quintiles are more than three times as likely as those who are the wealthiest to rate their own mental health as fair or poor. [26 ]
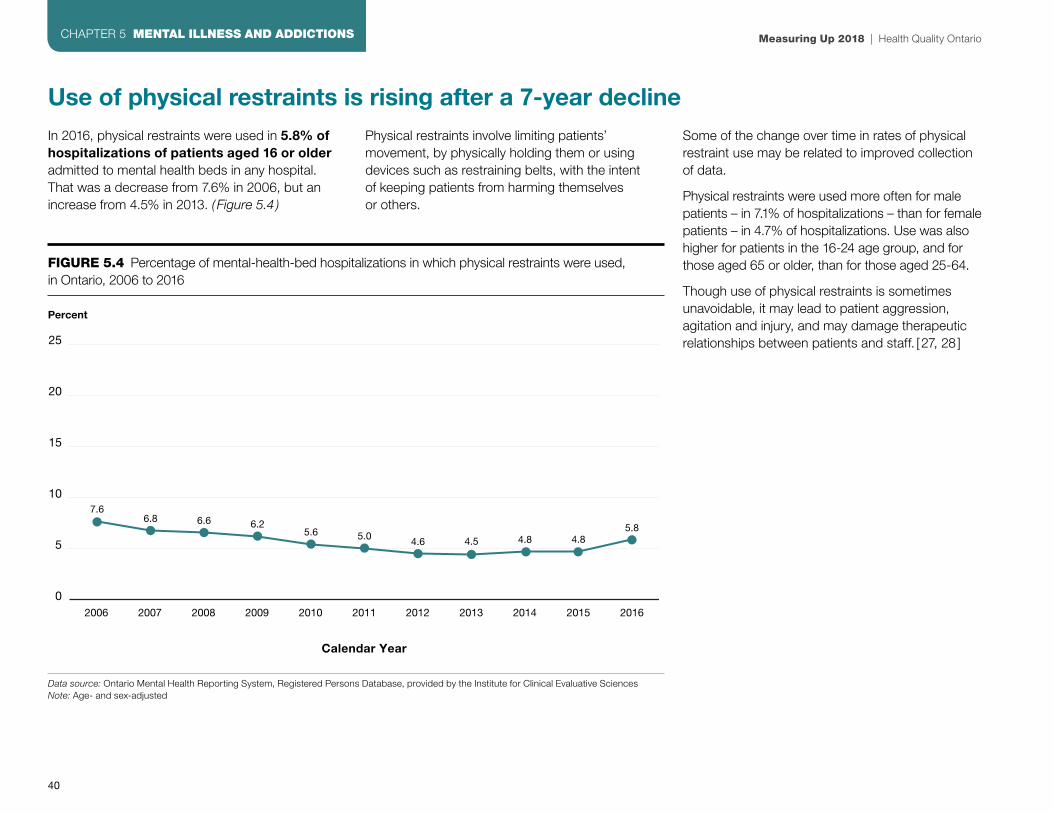
Use of physical restraints is rising after a 7-year declineIn 2016, physical restraints were used in 5.8% of hospitalizations of patients aged 16 or olderadmitted to mental health beds in any hospital. That was a decrease from 7.6% in 2006, but an increase from 4.5% in 2013. ( Figure 5.4 )
Physical restraints involve limiting patients’ movement, by physically holding them or using devices such as restraining belts, with the intentof keeping patients from harming themselves or others.
Some of the change over time in rates of physical restraint use may be related to improved collection of data.
Physical restraints were used more often for male patients – in 7.1% of hospitalizations – than for female patients – in 4.7% of hospitalizations. Use was also higher for patients in the 16-24 age group, and for those aged 65 or older, than for those aged 25-64.
Though use of physical restraints is sometimes unavoidable, it may lead to patient aggression, agitation and injury, and may damage therapeutic relationships between patients and staff. [ 27, 28 ]
FIGURE 5.4 Percentage of mental-health-bed hospitalizations in which physical restraints were used,in Ontario, 2006 to 2016
Percent
25
0
5
15
20
10
2006 2008 2010 20122007 2009 2011 2013 2014 2015 2016
Calendar Year
7.66.8 6.6 6.2
5.64.65.0 4.5 4.8 4.8
5.8
Measuring Up 2018 | Health Quality Ontario
40
CHAPTER 5 MENTAL ILLNESS AND ADDICTIONS
Data source: Ontario Mental Health Reporting System, Registered Persons Database, provided by the Institute for Clinical Evaluative Sciences Note: Age- and sex-adjusted

Indicators
First contact in emergency for a mental illness or addiction, for children and youths: The percentage of people, among those aged 24 and younger who visited an emergency department for a mental illness or addiction, who had not received mental health care from a family doctor, pediatrician or psychiatrist in the preceding two years
Children and youths who have a first-contact visit to emergency for a mental illness or addiction may not have had access to mental health care in the community that might have prevented the need for such a visit.
Seven-day follow-up after hospitalization for a mental illness or addiction: The percentage of patients, among those aged 16 and older hospitalized for a mental illness or addiction, who were seen by a family doctor or psychiatrist within seven days after being discharged from hospital
Timely follow-up with a mental health professional after discharge may ease patients’ transition from hospital to home and help ensure they receive the treatment and support they need in the community.
Readmission after hospitalization for a mental illness or addiction:The percentage of patients, among those 16 and older hospitalized for a mental illness or addiction, who were readmitted to hospital for a mental illness or addiction within 30 days after being discharged
Patients readmitted to hospital for a mental illness or addiction may not have received the mental health care and support they needed in the community after discharge.
Physical restraint of patients with a mental illness or addiction: The percentage of patients aged 16 and older in mental-health-designated beds who were physically restrained in the three days before their most recent assessment
Use of physical restraints on patients with mental illness or addiction may lead to aggression, agitation, or injury, and may damage therapeutic relationships between patients and staff. [ 29, 30 ]
For more indicator results related to Mental Illness and Addictions, as well as results for all the indicators analyzed for Measuring Up 2018, please see the Technical Supplement tables at www.hqontario.ca.
Did you know?One in 3 Canadians meets the criteria for having a mental illness or substance use disorder at some point in their life. [31 ]
However, the stigma associated with mental illness and addictions persists. In a survey of Ontario workers, 39% of respondents said they would not tell their managers if they were experiencing a mental health problem, and 64% indicated they would worry about how their job would be affected if a colleague had a mental health problem. [32 ]
Health Quality Ontario | Measuring Up 2018
41
CHAPTER 5 MENTAL ILLNESS AND ADDICTIONS

e
66Long-Term CareOntario’s approximately 630 long-term care homes provide around-the-clock care and supervision to about 115,000 residents over the course of a year. [33]
Those residents are changing. Increasing proportions of them have chronic conditions, physical limitations and cognitive impairments that make caring for them more complex.
42

e
Wait times for long-term care are on the riseThe median amount of time people waited from hospital to move into a long-term care home was 31.4% longer in 2016/17 than in 2015/16, and the median wait from the
community lengthened by 12.9%. ( Figure 6.1 ) The median is the point at which half of people waited more and half waited less.
However, compared to 2012/13, the wait from the community was 9.7% shorter in 2016/17, while the wait from hospital was 19.5% longer.
People’s health may deteriorate during long waits for admission, and waiting can be stressful for them and for the family members or friends who are their caregivers. As well, when people are waiting in hospital, it may affect the hospital’s ability to provide services to other patients who require hospital care.
FIGURE 6.1 Median numbers of days people waited from the community* or from hospital to move into a long-term care home, in Ontario, 2012/13 to 2016/17
Days
200
0
50
150
100
25
125
75
175
2012/13 2013/14 2014/15 2015/16 2016/17
Fiscal Year
77.072.0
60.070.0
92.0
165.0154.0
135.0 132.0
149.0
From hospitalFrom community
Health Quality Ontario | Measuring Up 2018
43
CHAPTER 6 LONG-TERM CARE
Data source: Modernized Client Profile Database, provided by the Ministry of Health and Long-Term Care*Community is used here to capture any place of residence in the community, such as the applicant’s home, a retirement home or supportive housing, for applicants who were not waiting in hospital.
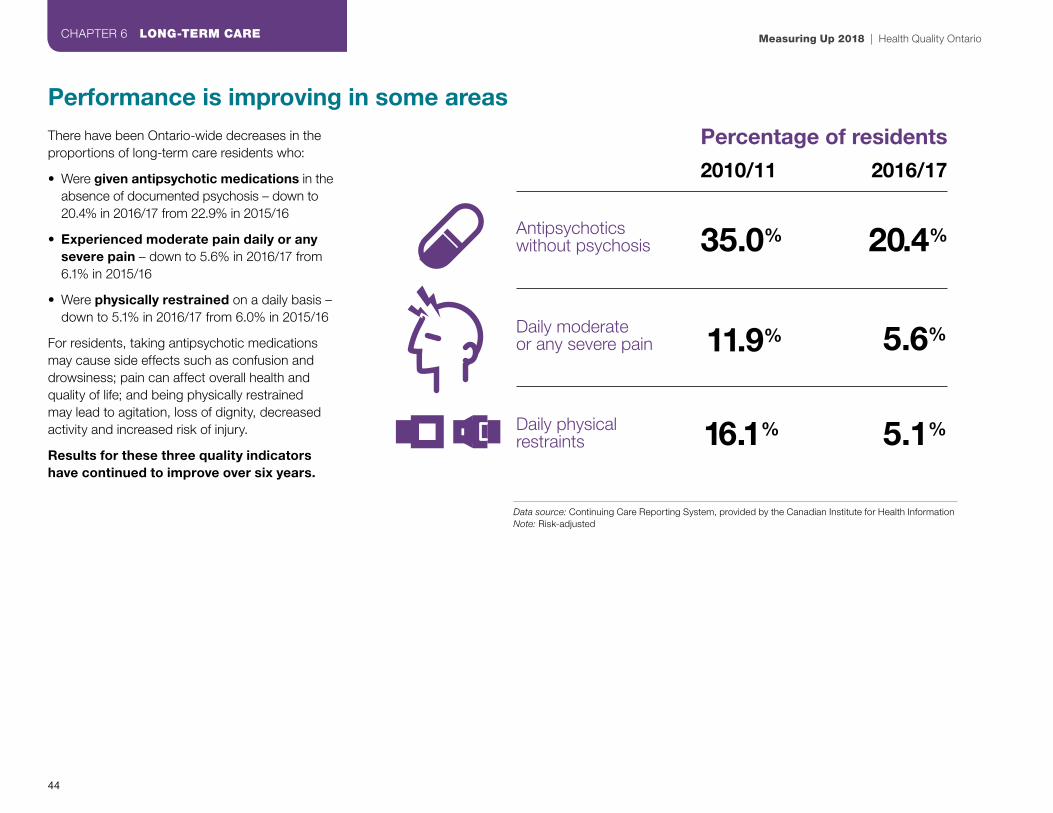
Performance is improving in some areasThere have been Ontario-wide decreases in the proportions of long-term care residents who:
• Were given antipsychotic medications in the absence of documented psychosis – down to 20.4% in 2016/17 from 22.9% in 2015/16
• Experienced moderate pain daily or any severe pain – down to 5.6% in 2016/17 from 6.1% in 2015/16
• Were physically restrained on a daily basis – down to 5.1% in 2016/17 from 6.0% in 2015/16
For residents, taking antipsychotic medications may cause side effects such as confusion and drowsiness; pain can affect overall health and quality of life; and being physically restrained may lead to agitation, loss of dignity, decreased activity and increased risk of injury.
Results for these three quality indicators have continued to improve over six years.
Antipsychotics without psychosis 20.4%
2010/11 2016/17
35.0%
5.6%
5.1%
11.9%
16.1%
Percentage of residents
Daily moderateor any severe pain
Daily physicalrestraints
Measuring Up 2018 | Health Quality Ontario
44
CHAPTER 6 LONG-TERM CARE
Data source: Continuing Care Reporting System, provided by the Canadian Institute for Health Information Note: Risk-adjusted

Where people live affects the long-term care they have access toThere were substantial differences between Ontario’s regions in how long people waited for admission to a long-term care home and in the care residents received. [34 ]
In 2016/17:
• The median wait time to admission from the community ranged from 74.5 days in the Erie St. Clair region to 252 days in the Central East region[35]
• The median wait time to admission from hospital ranged from 41 days in the South West region to 220 days in the North Simcoe Muskoka region[36]
• Residents physically restrained on a daily basis varied from 1.7% in the Toronto Central region to 15.1% in the North West region [37]
• Residents with worsened symptoms of depression ranged from 15.5% in the Mississauga Halton region to 30.6% in the South East region [38]
Quality indicator results for individual long-term care homes ranged from:[39, 40]
• 0% to 57.5% for residents physically restrained daily
• 0% to 57.8% for residents without psychosis given antipsychotic medication
• 3.4% to 35.9% for residents who fell ( see illustration)
1 in 30 10 in 30to
The rate of falls among residents varied between individual homes from:
Health Quality Ontario | Measuring Up 2018
45
CHAPTER 6 LONG-TERM CARE
Data source: Continuing Care Reporting System, provided by the Canadian Institute for Health InformationNote: Risk-adjusted

Ontario both leads and trails other provincesIn 2016/17, Ontario had the smallest proportion of long-term care residents with moderate pain daily or any severe pain, or who were physically restrained daily, among all the provinces where comparable data were available.
Only Alberta had a smaller proportion than Ontario of residents without psychosis receiving antipsychotic medications.
Ontario was near the Canadian average for falls and pressure ulcers.
However, Ontario had the second-highest percentage of residents whose symptoms of depression worsened, after Alberta, even though Ontario had the highest percentage of residents taking antidepressants. [41 ]
2016/17
Antipsychotic medications without psychosis
Daily physical restraints
Daily moderate or any severe pain
Falls New or worsened pressure ulcer
Worsened symptoms of depression
British Columbia 25.9% 8.3% 12.8% 15.9% 3.2% 17.7%
Alberta 17.4% 6.5% 6.9% 15.8% 3.1% 27.1%
Saskatchewan 27.0% 10.1% 11.5% 12.9% 2.3% 20.0%
Ontario 20.4% 5.1% 5.6% 15.8% 2.7% 23.5%
Newfoundland and Labrador
38.3% 14.2% 16.0% 11.2% 1.7% 15.3%
Canada* 21.9% 6.5% 7.9% 15.9% 2.8% 21.7%
Lower is better – the best results are highlighted in blue.
Data source: Continuing Care Reporting System, provided by the Canadian Institute for Health Information.Note: Risk-adjusted *Includes only parts of Canada where data were available.
Measuring Up 2018 | Health Quality Ontario
46
CHAPTER 6 LONG-TERM CARE

Did you know?The residents of Ontario’s long-term care homes have changed in recent years in ways that make caring for them more complex.
More of them are 85 years of age or older, more have chronic conditions, and more need help with personal care and daily activities, as shown inthe table below.
Resident population 2010/11 2016/17
85 years of age or older 51.3% 54.6%
Have neurological disease 76.4% 80.1%
Have heart or circulatory disease
72.3% 76.3%
Have a form of dementia such as Alzheimer’s disease
58.0% 63.6%
Have diabetes 25.9% 27.7%
Need extensive assistance with or totally dependent in activites such as showering and eating
76.3% 84.7%
Receive antidepressant medication
51.1% 55.3%
In hospital before admission
41.9% 35.4%
At their own home before admission
36.2% 42.0%
Data source: Continuing Care Reporting System Quick Stats 2010/11 and 2016/17, provided by the Canadian Institute for Health Information.
Indicators
Wait time to admission: The median number of days people waited to move into a long-term care home, from the hospital and from the community
Long waits for admission can cause stress for patients and their families.
Antipsychotic medications without psychosis: The percentage of residents without documented psychosis who were given antipsychotic medication in the seven days preceding their most recent assessment
Antipsychotic medications are sometimes used to help reduce agitation or aggression, but may cause side effects such as confusion and increased risk of falls.
Daily physical restraints: The percentage of residents who were physically restrained on a daily basis in the seven days preceding their most recent assessment
Restraints may protect residents from harming themselves or others, but can lead to agitation and increased risk of injury or pressure ulcers.
Daily moderate or any severe pain: The percentage of residents who experienced moderate pain daily or any severe pain in the seven days preceding their most recent assessment
Experiencing chronic or severe pain can affect overall health and quality of life.
Falls among residents: The percentage of residents who fell in the 30 days preceding their most recent assessment
A fall may cause serious injury such as a hip fracture and may result in a visit to the emergency department or admission to hospital.
Worsened symptoms of depression: The percentage of residents whose mood from symptoms of depression worsened since their previous assessment
Depression affects quality of life and can affect overall health and functioning.
New or worsened pressure ulcer: The percentage of residents who had a new or worsened pressure ulcer since their previous assessment
A pressure ulcer may cause pain and impair mobility, and can lead to infection.
For more indicator results related to Long-Term Care, as well as results for all the indicators analyzed for Measuring Up 2018, please see the Technical Supplement tables at www.hqontario.ca.
Health Quality Ontario | Measuring Up 2018
47
CHAPTER 6 LONG-TERM CARE

e
77Home CareOntario provides publicly funded home care to about 667,000 people a year.
Collectively, the province’s home care clients receive 7.3 million nursing visits a year, and 29.8 million hours of personal support services such as help with personal care and household management. [42]
Increasing percentages of clients have one or more physical or cognitive impairments or serious illnesses that require a high level of care.
48

e
Caregiver distress is still rising and varies by where clients liveIn the first half of 2017/18, among long-stay home care clients with at least one family member or friend providing them with unpaid care, 26.1% had a primary family or friend caregiver who experienced continued distress, anger or depression in relation to their caregiving role. That was up from 23.6% one year earlier and 20.8% in the first half of 2012/13.
Long-stay clients – about 4 in 10 of all clients – are those who receive care for more than two months. Continued distress is distress reported in at least two client assessments over a period of at least six months.
The increase between 2012/13 and 2017/18 repre-sented 13,244 additional caregivers experiencing continued distress, anger or depression.
Family and friend caregivers may experience such symptoms of stress not only because a loved one is ill, but also as a result of the effort and time required to provide care when caregivers have other work and family responsibilities. The negative effects of stress on caregivers’ health can range from anxiety, depression and migraines to early death, [43, 44, 45, 46 ] and can also affect their ability to continue providing care.
The proportion of long-stay clients who had caregivers experiencing continued distress varied between Ontario’s regions from 17.6% in the South West region to 41.3% in the North Simcoe Muskoka region, in the first half of 2017/18. ( Figure 7.1 )
This indicator of continued caregiver distress differs from another indicator that measures episodes of caregiver distress reported in a single assessment.
FIGURE 7.1 Percentage of long-stay home care clients whose primary family or friend caregiver experienced continued distress, anger or depression in relation to their caregiving role, by region, in Ontario, Q1/Q2 of 2017/18
Percent
100
0
20
40
60
80
Ont
ario
Erie
St.
Cla
ir
Sou
th W
est
Wat
erlo
oW
ellin
gton
Ham
ilton
Nia
gara
Hal
dim
and
Bra
nt
Cen
tral
Wes
t
Mis
siss
auga
Hal
ton
Toro
nto
Cen
tral
Cen
tral
Cen
tral
Eas
t
Sou
th E
ast
Cha
mp
lain
Nor
th S
imco
eM
usko
ka
Nor
th E
ast
Nor
th W
est
Region
26.121.4
17.6
33.629.8 31.4
27.924.4 25.8
30.3
19.1 20.9
41.3
25.1 27.3
Health Quality Ontario | Measuring Up 2018
49
CHAPTER 7 HOME CARE
Data source: Home Care Reporting System, provided by the Canadian Institute for Health InformationNote: This indicator is risk-adjusted and is measured at half-year intervals

Ontario compares poorly in someareas of home care In the first half of 2017/18, Ontario had the highest percentage of home care clients with caregivers who experienced continued distress,anger or depression in relation to their caregiving role, among all provinces where comparable data were available.
Ontario also had the highest percentage of home care clients who reported or showed evidence of daily pain, among provinces with comparable data.
British Columbia
Alberta Ontario Newfoundland and Labrador
Canada*
CaregiverDistress
20.4 13.0 26.1 15.4 25.4
Daily Pain 11.5 12.8 20.8 18.0 19.8
Lower is better - the best results are highlighted in blue.
*Includes only parts of Canada where data were available
Data source: Home Care Reporting System, provided by the Canadian Institute for Health InformationNote: This indicator is risk-adjusted and is measured at half-year intervals
57.1% of home care clients ‘strongly agree’ they felt involved in the planning of their own careIn 2016/17, just under 6 out of 10 home care clients said in a survey that they “strongly agree" they felt involved in the development of the plan for the home care they received. ( Figure 7.2 ) Results for this indicator have not changed substantially since 2013/14.
Involving clients and their informal caregivers in decisions about their care is a fundamental element of patient-centred care. It may also motivate clients to adhere more closely to their care plan, improve clients’ own management of their health conditions, and increase their satisfaction with the care they receive. [47 ]
FIGURE 7.2 Percentages of home care clients who chose “Strongly agree,” “Somewhat agree,” “Neither agree nor disagree,” “Somewhat disagree” or “Strongly disagree” when asked if they felt involved in the development of their care plan, in Ontario, 2016/17
2016/17
0% 20% 40% 60% 80% 100%
57.1 26.7 6.1 5.6 4.5
Strongly agree Somewhat agree Neither agree nor disagree
Somewhat disagree Strongly disagree
Measuring Up 2018 | Health Quality Ontario
50
CHAPTER 7 HOME CARE
Data source: Client and Caregiver Experience Evaluation Survey, provided by Health Shared Services Ontario
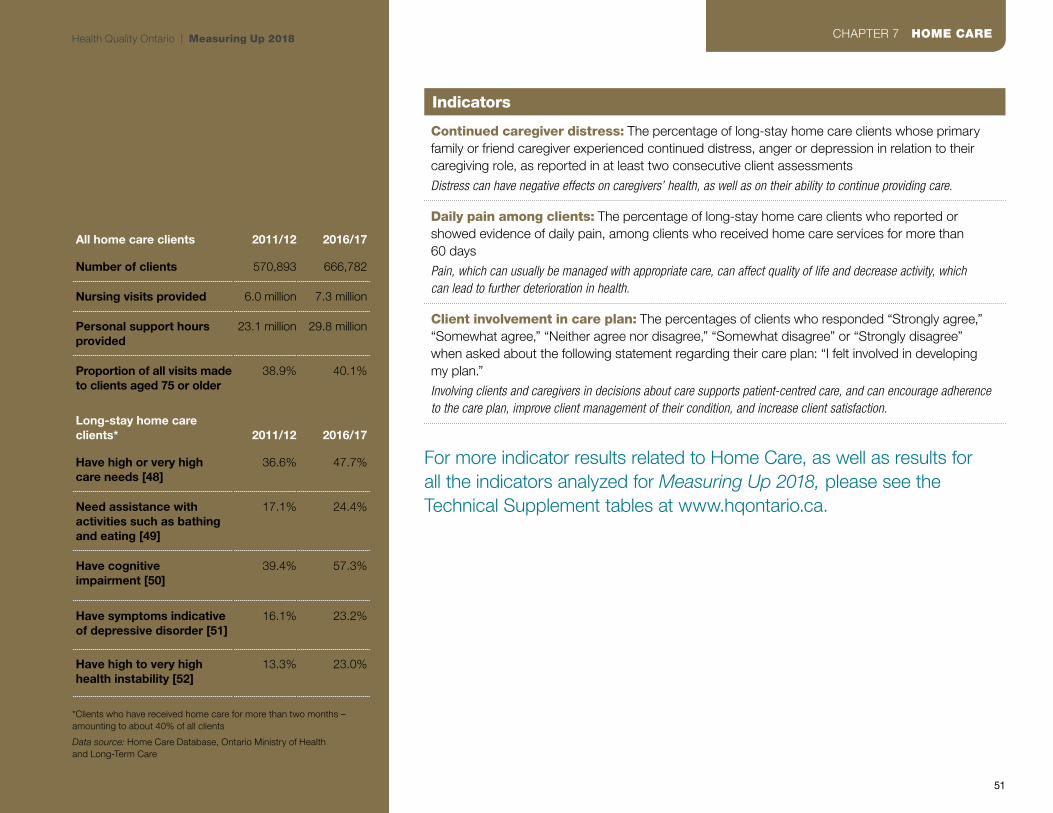
Did you know?The number of people receiving home care in Ontario is increasing faster than the population is growing, and collectively, home care clients are changing in ways that make caring for them more complex.
All home care clients 2011/12 2016/17
Number of clients 570,893 666,782
Nursing visits provided 6.0 million 7.3 million
Personal support hours provided
23.1 million 29.8 million
Proportion of all visits made to clients aged 75 or older
38.9% 40.1%
Long-stay home care clients* 2011/12 2016/17
Have high or very highcare needs [48]
36.6% 47.7%
Need assistance with activities such as bathing and eating [49]
17.1% 24.4%
Have cognitiveimpairment [50]
39.4% 57.3%
Have symptoms indicative of depressive disorder [51]
16.1% 23.2%
Have high to very high health instability [52]
13.3% 23.0%
*Clients who have received home care for more than two months – amounting to about 40% of all clients
Data source: Home Care Database, Ontario Ministry of Healthand Long-Term Care
Indicators
Continued caregiver distress: The percentage of long-stay home care clients whose primary family or friend caregiver experienced continued distress, anger or depression in relation to their caregiving role, as reported in at least two consecutive client assessments
Distress can have negative effects on caregivers’ health, as well as on their ability to continue providing care.
Daily pain among clients: The percentage of long-stay home care clients who reported or showed evidence of daily pain, among clients who received home care services for more than 60 days
Pain, which can usually be managed with appropriate care, can affect quality of life and decrease activity, which can lead to further deterioration in health.
Client involvement in care plan: The percentages of clients who responded “Strongly agree,” “Somewhat agree,” “Neither agree nor disagree,” “Somewhat disagree” or “Strongly disagree” when asked about the following statement regarding their care plan: “I felt involved in developing my plan.”
Involving clients and caregivers in decisions about care supports patient-centred care, and can encourage adherence to the care plan, improve client management of their condition, and increase client satisfaction.
For more indicator results related to Home Care, as well as results forall the indicators analyzed for Measuring Up 2018, please see the Technical Supplement tables at www.hqontario.ca.
Health Quality Ontario | Measuring Up 2018
51
CHAPTER 7 HOME CARE

e
88Primary CareFamily doctors, general physicians and nurse practitioners care for people through every stage of life. They also represent an important access point for care: along with providing front-line care, they help ensure that patients receive the specialist care and community support they need within the larger health system.
Over 90% of people in the province say they have a regular family doctor, general physician or nurse practitioner. [53]
People can see their doctors or nurse practitioners in different settings, such as family health networks or community health centres. And, although most people say they can get carewhen they’re sick, some still face challenges, relying on walk-in clinics or emergency departments for treatment after-hours or on weekends.
52

e
When Ontarians are sick, their wait to see the doctor variesWhen people were sick, the wait to see their family doctor or nurse practitioner, or another primary care practitioner in their office, varied in 2017, according to the Health Care Experience Survey.
Almost 4 out of 10 people reported that they saw their primary care provider or someone else in their office in less than 2 days, although the percentage who said so fell to 39.9% in 2017 from 45.3% in 2013. Slightly more than one-quarter (26.5%) said they saw their provider or someone in their office within 2 to 3 days.
However, the wait was longer for some: the percentage who said they waited 8 days or more to see their doctor or another provider in their office about an illness or health concern went up to 14.5% in 2017 from 11.0% in 2013.
The proportion who said they waited 8 days or more ranged from 5.6% in a central region of the province to 40.7% in a northern region. ( Figure 8.1)
2 out of 3 people saythe wait for primary care is ‘about right’Although the wait for care can be challenging for some, the majority of people (67.6%) surveyed in Ontario said the wait to see a primary care provider when they were sick was "about right" in 2017.
Overall, 18.3% said the wait was “somewhat too long” and 14.1% said it was “much too long.”
FIGURE 8.1 Percentage of people aged 16 and older who reported they were able to see their primary care provider, or another provider in their office, in either less than 2 days, 2-3 days, 4-7 days or 8 or more days, when they were sick or had a health concern, by region, in Ontario, 2017
1000 10 20 30 40 50 60 70 80 90
Reg
ion
Percent
Ontario
Erie St. Clair
South West
Waterloo Wellington
Hamilton NiagaraHaldimand Brant
Central West
Mississauga Halton
Toronto Central
Central
Central East
South East
Champlain
North SimcoeMuskoka
North East
North West
4-7 days 8 or more days2-3 daysLess than 2 days
39.9 26.5 19.2 14.5
32.4
44.8
40.7
37.8
48.9
43.2
43.2
43.1
38.9
37.3
36.2
36.8
29.1
22.9
39.9 26.5
29.3
22.7
30.4
25.8
30.0
29.2
27.6
30.2
25.2
25.0
24.4
23.7
15.9
16.6
19.2
21.6
19.9
17.1
22.1
15.5
20.6
19.8
15.0
19.3
20.1
22.2
17.6
18.6
19.8
14.5
16.7
12.7
11.8
14.4
5.6
7.0
9.3
11.7
16.6
17.6
17.2
21.9
36.4
40.7
Health Quality Ontario | Measuring Up 2018
53
CHAPTER 8 PRIMARY CARE
Data source: Health Care Experience Survey, provided by the Ministry of Helath and Long-term Care

In areas where more people said their wait was too long, a higher proportion of people reported waiting eight days or more to see a doctor or other primary care provider when they were sick.
The proportion of those who said they waited “much too long” ranged between Ontario’s regions from 10.2% to 23.6%. ( Figure 8.2 )
Most people see the same doctor when they need oneSeeing the same family doctor or nurse practitioner at each visit builds good relationships between patients and their primary care providers. It also creates what’s known as continuity of care—this keeps doctors and other providers up to date on patients’ needs and avoids treatment gaps.
Research suggests that people who get consistent care from the same provider receive better preventive care, are more likely to comply with recommended treatments and have better outcomes. [54, 55]
In 2016/17, of those who had more than three visits with a primary care doctor in the previous two years:
• The majority – 56.8% – had “high” continuity of care (more than 75% of visits with the same doctor)
• 27.7% had “medium” continuity of care (50 to 75% of visits with the same doctor )
• 15.5% had “low” continuity of care ( less than 50% of visits with the same doctor. )
Younger people—between 19 and 44 years old — were more likely to have low continuity of care than those over 65 years old. People in large urban areas were also more likely to have lower continuity of care than those in rural areas.
FIGURE 8.2 Percentage of people aged 16 and older who said that the amount of time they waited to an appointment with their health care provider when sick was either “about right,” “somewhat long,” or “much too long,” by region, in Ontario, 2017
1000 10 20 30 40 50 60 70 80 90
Reg
ion
Percent
Somewhat long Much too longAbout right
Ontario
Erie St. Clair
South West
Waterloo Wellington
Hamilton NiagaraHaldimand Brant
Central West
Mississauga Halton
Toronto Central
Central
Central East
South East
Champlain
North Simcoe Muskoka
North East
North West
67.6 18.3 14.1
65.5
76.0
68.2
69.7
64.0
67.0
69.0
68.4
63.3
72.5
68.4
66.9
61.4
58.7
67.6 18.3
19.2
9.8
19.8
15.8
19.0
19.1
20.7
20.0
22.1
13.1
18.6
18.0
15.0
18.6
14.1
15.3
14.2
12.0
14.5
17.0
13.9
10.2
11.6
14.5
14.4
13.0
15.1
23.6
22.8
Measuring Up 2018 | Health Quality Ontario
54
CHAPTER 8 PRIMARY CARE
Data source: Health Care Experience Survey, provided by the Ministry of Helath and Long-term Care

Many people go to emergency instead of their regular doctorIn some cases, people go to emergency departments for conditions that they think their primary care provider could have managed. In 2017, 2 out of 5 people who went to an emergency department reported that their visit was for something their regular provider could have managed, if they had been available.
The rate of such visits varied across the province, with 29.3% to 53.1% of people reporting in different regions that their primary care provider could have handled the condition they visited emergency for, if that provider had been available. ( Figure 8.3 )
More rural residents – 57.3% – said they used emergency departments for conditions that their primary care provider could have managed, compared to 39.7% of urban residents.
However, family doctors in rural areas often practise in different settings, including emergency departments. Overall, the people who reported such visits did not specify whether they made them after hours or on weekends.
Visits to emergency for conditions that people said their primary care provider could have managed also varied by age: 49.8% of people between 16 and 44 years old said theirs was such a visit, compared to 38.8% of those between 45 and 64 and 29.7% of those 65 and older.
Location was a factor in finding care after-hours. In different regions, between 45.7% and 71.9% of people who had a primary care doctor and needed care reported that it was difficult to access care during evenings, weekends or holidays without going to the emergency department.
And, about 1 in 3 people said they visited a walk-in clinic when they were sick during the previous 12 months. Just about half – 49.4% – of those that did said it was because their primary care provider wasn’t available or they couldn’t get an appointment.
Sometimes it’s necessary to seek care elsewhere, though the switch can affect care. For example, emergency department doctors don’t have all the patient information—such as treatment history—that they might need. Such visits can also duplicate diagnostic tests or procedures and put pressure on emergency department resources. They can also make proper follow-up harder, while making it easier for things to fall through the cracks.
FIGURE 8.3 Percentage of people aged 16 and older who reported their emergency department visit was for a condition that could have been managed by their primary care provider if that provider had been available, by region, in Ontario, 2017
Percent
60
0
10
20
30
40
50
Ont
ario
Erie
St.
Cla
ir
Sou
th W
est
Wat
erlo
oW
ellin
gton
Ham
ilton
Nia
gara
Hal
dim
and
Bra
nt
Cen
tral
Wes
t
Mis
siss
auga
Hal
ton
Toro
nto
Cen
tral
Cen
tral
Cen
tral
Eas
t
Sou
th E
ast
Cha
mp
lain
Nor
th S
imco
eM
usko
ka
Nor
th E
ast
Nor
th W
est
Region
42.246.3
50.0 50.8
29.3
42.1 40.1
32.1
42.3 42.5
52.1
45.0 43.2
50.9 53.1
Health Quality Ontario | Measuring Up 2018
55
CHAPTER 8 PRIMARY CARE
Data source: Health Care Experience Survey, provided by the Ministry of Health and Long-term Care

Mixed results on screening for selected cancersEarly detection can be a critical factor in treating diseases like cancer.
A Pap test is an important screening tool for signs of cervical cancer, and 62.0% of screen-eligible people in Ontario received at least one Pap test within 42 months in 2014–2016, below the 85% provincial target.[56]
It’s important to note that cervical cancer screening guidelines changed in 2012, recommending screenings once every three years. This may have contributed to the decrease in screening participation.[57]
People in lower-income urban neighbourhoods were less likely to be screened during the 42-month period. Additionally, those in neighbourhoods with a higher percentage of immigrants were less likely to be screened during that time.
On the other hand, timely screenings for colorectal cancer improved. The number of screen-eligible people between 50 and 74 who were overdue for colorectal cancer screening went down in Ontario, falling to 38.1% in 2016 from 41.5% in 2013.
People between 50 and 54 were most likely to be overdue for colorectal cancer screening. Men were also more likely to be overdue than women.
FIGURE 8.4 Percentage of screen-eligible Ontarians, 21–69 years old, who completed at least one Pap test in a 42-month period, 2005-07 and 2014–16
2005–2007 2014–201666.2% 62.0%
Cervical CancerScreened for
Data source: Ontario Health Insurance Plan Claims History Database, Ontario Cancer Registry, Registered Persons Database, CytoBase, provided by Cancer Care OntarioNote: Age-adjusted
FIGURE 8.5 Percentage of screen-eligible Ontarians, 50–74 years old, who were overdue for screening for colorectal cancer, 2013 and 2016
2013 201641.5% 38.1%
Colorectal CancerOverdue screening for
Measuring Up 2018 | Health Quality Ontario
56
CHAPTER 8 PRIMARY CARE
Data source: Ontario Health Insurance Plan Claims History Database, Laboratory Reporting Tool, Ontario Cancer Registry, Registered Persons Database, Colonoscopy Interim Reporting Tool, provided by Cancer Care OntarioNote: Age-adjusted

Indicators
Timely access to a primary care provider: The percentages of people aged 16 and older who reported that when they were sick or had a health concern, they saw their family doctor or nurse practitioner, or another primary care provider in their office, in less than 2 days, in 2-3 days, in 4-7 days, or in 8 or more days
Timeliness is a key component of access to care.
After-hours access to a primary care provider: The percentage of people aged 16 and older who reported that getting access to care in the evening or on a weekend or public holiday, without going to the emergency department, was very difficult or somewhat difficult
Availability of after-hours care is a key component of access to care.
Continuity of care: The percentages of people who had less than 50%, 50% to 74%, or 75% or more of their primary care visits with the same primary care doctor, among people who saw a primary care doctor at least 3 times over the previous 2 years
Continuity of care ensures consistency of care and good relationships between patients and physicians.
Visits to a walk-in clinic: The percentage of people aged 16 and older who reported visiting a walk-in clinic when they were sick or had a health problem in the previous 12 months
A visit to a walk-in clinic may indicate lack of access to a regular primary care provider.
Satisfaction with time to appointment: The percentages of people aged 16 and older who reported that the amount of time they waited for an appointment with their health care provider when sick was “about right,” “somewhat too long” or “much too long”
Timely care and satisfaction are important aspects of access to care and patient experience, and may affect patient outcomes.
Cervical cancer screening: The percentage of screen-eligible people, 21–69 years old, who completed at least one Pap test in a 42-month period
Timely detection of cervical cancer can influence treatment and improve recovery rates.
Emergency department visits for conditions people thought could have been managed by their primary care provider: The percentage of people with a regular primary care provider who reported that the last time they went to the emergency department, it was for a condition that they thought could have been treated by their primary care provider if that provider had been available. Only patients aged 16 and older who visited the emergency department in the previous 12 months are included
Primary care provider access and availability are essential access-to-care issues.
Colorectal cancer screening: The percentage of screen-eligible people, 50–74 years old, who were overdue for colorectal cancer screening
Timely detection of colorectal cancer can influence treatment and improve recovery rates.
For more indicator results related to Primary Care, as well as results for all the indicators analyzed forMeasuring Up 2018, please see the Technical Supplement tables at www.hqontario.ca.
Health Quality Ontario | Measuring Up 2018
57
CHAPTER 8 PRIMARY CARE

Craig and Lois’s story:
Lessons learnedWhen his mother Lois left the hospital with a diagnosis of terminal lung cancer, Craig scrambled to care for her at home in Scarborough in her final weeks of life, as he struggled with his own health problems and busy family life.
Lois wanted to die at home. She had seen her husband die in hospital and didn’t want to go through the same experience. When she left the hospital after being diagnosed with terminal lung cancer at age 73, her son Craig became her main caregiver for the three weeks before she died.
(continued on next page)
Photo of Craig taken by Roger Yip.
58
A caregiver in distress
Craig, a former flight paramedic, had retired two years earlier after his poorly controlled diabetes and depression led to kidney failure that required dialysis at the hospital three times a week. He would sleep at his mother’s house in Scarborough, waking up two or three times a night to the ringing of a bell that meant Lois needed to go the washroom. Craig would get up to help his mother, reassure her, make sure she had all her medications, and check to see if she needed pain control or if the oxygen canister bedside the bed needed to be changed.
Waking up exhausted in the morning, Craig had arranged for private nursing during the day, which gave him time to go to his home to look after things there, and then go for his kidney dialysis in the afternoon. After that, he would return to his mother’s house to start the process all over again.
“It felt very hectic,” Craig says. “Looking back, I didn’t know how to ask for help or who to ask for help. I just didn’t feel I was doing a very good job of managing all of those conflicting demands.”
One evening, Lois had a fall in the washroom, and Craig wasn’t able to lift her up. He reluctantly called 911. “There’s a sense that you’re failing your parent as a child, that you’re not well enough to support them in this vulnerable time,” Craig says. He also worried about neglecting his wife and 10-year-old son, who were back at his home. “I was very interested in getting my mother support, but didn’t know or didn’t think to ask for supports for myself.”
Gaps in palliative care
When Lois left the hospital, Craig says he expected the health system would automatically arrange a
support team for palliative care at home, including nursing care, psychological counselling, and home visits by a palliative care doctor. Instead, Craig didn’t get any information about how to keep his mother comfortable at home, leaving them to figure things out on their own.
“Whoever you ask, they should have a process in place that triggers people who can do something, people who have skills and knowledge to share,” Craig says. “I just don’t sense that at the time my mother died that palliative care had that sort of trigger.”
In her last weeks of life, Lois was very tired and slept a lot, Craig says, but was awake enough to have conversations. “I don’t think she really understood what was going on,” Craig says. “She kept saying, ‘I don’t want to die. I’m not ready to die. I think we need to try another course of treatment for my cancer.’ It was very frustrating. I think she understood that she was very sick, but I don’t know that anyone had the conversation with her that there is no cure.” Craig says there was a lack of psychological and social supports that should be part
of a high-quality palliative care system.
Avoiding the emergency department
A few times, doctors ordered tests to be done in hospital, but since she had just weeks left to live, Craig knew they were pointless, and cancelled appointments to keep Lois out of the hospital. “My dad had died of cancer as well, but died in the hospital, which I think was why my mother so desperately wanted to get home,” Craig says. “The hospital doesn’t try to make it unpleasant by any intent. It’s just the nature of hospitals that they have a busy, loud, distracting and disturbing environment.”
Toward the end, when Craig was at his limit as a family caregiver, he thought about driving his mother to the emergency department, feeling resentful and angry that the system couldn’t spare the resources to let Lois die at home in comfort. In the end, he told himself to just hang on and get through it. A few days later, Craig called the nurse at the cancer clinic to arrange a move to a hospice, where he says Lois received excellent care untilshe died three days later.
Communication
Craig says the health system has likely improved since his mother died six years ago, but he thinks the palliative care system should have more communications to let patients and families know what’s available to support them. After his mother died, Craig would hear other people in different parts of the province talk about having a personal support worker care for their loved one eight hours a day, plus nursing care and physician home visits. “I remember thinking, I wish my mother had been in that postal code.”
Lessons
Lois was a public-school teacher who taught kids who were having trouble reading. “I remember her always saying, ‘What was the lesson learned?’” Craig recalls. “The expectation was that life was a learning process.” Craig hopes that by sharing his story, others can learn ways to make the system better for people who want to receive palliative care at home, and for those who are caring for them.
Health Quality Ontario | Measuring Up 2018
59

e
99Palliative CareOf the approximately 100,000 people who died in Ontario in 2016/17, about 6 in 10 had a record of having received palliative care services in their last year of life. [58]
Palliative care aims to relieve pain and suffering and improve quality of life for people with a progressive, life-limiting illness, by addressing the physical, psychological, and practical challenges they and their families face. [59]
Palliative care services may be provided at different health care settings by one or more among many types of care providers, including doctors, nurses, home care, hospitals, hospices, and long-term care homes.
60
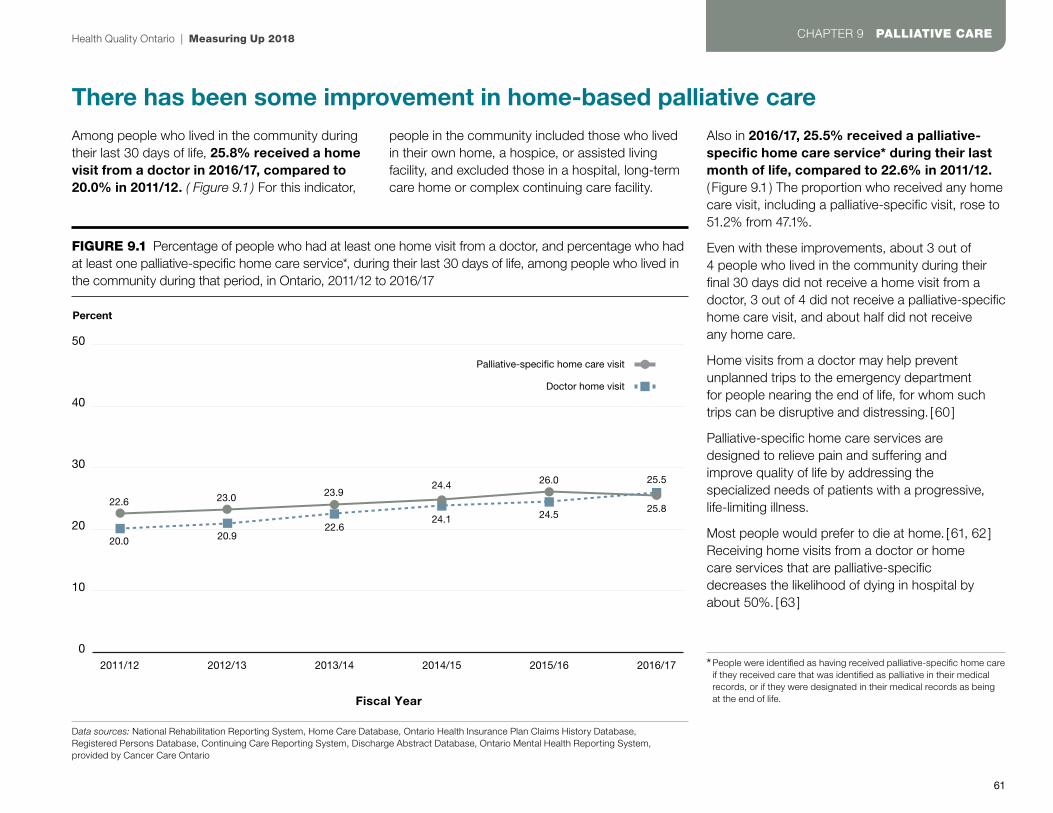
e
There has been some improvement in home-based palliative careAmong people who lived in the community during their last 30 days of life, 25.8% received a home visit from a doctor in 2016/17, compared to 20.0% in 2011/12. ( Figure 9.1 ) For this indicator,
people in the community included those who lived in their own home, a hospice, or assisted living facility, and excluded those in a hospital, long-term care home or complex continuing care facility.
Also in 2016/17, 25.5% received a palliative-specific home care service* during their last month of life, compared to 22.6% in 2011/12.( Figure 9.1 ) The proportion who received any home care visit, including a palliative-specific visit, rose to 51.2% from 47.1%.
Even with these improvements, about 3 out of 4 people who lived in the community during their final 30 days did not receive a home visit from a doctor, 3 out of 4 did not receive a palliative-specific home care visit, and about half did not receiveany home care.
Home visits from a doctor may help prevent unplanned trips to the emergency department for people nearing the end of life, for whom such trips can be disruptive and distressing. [60 ]
Palliative-specific home care services are designed to relieve pain and suffering and improve quality of life by addressing the specialized needs of patients with a progressive, life-limiting illness.
Most people would prefer to die at home. [61, 62 ] Receiving home visits from a doctor or home care services that are palliative-specific decreases the likelihood of dying in hospital by about 50%. [63 ]
FIGURE 9.1 Percentage of people who had at least one home visit from a doctor, and percentage who had at least one palliative-specific home care service*, during their last 30 days of life, among people who lived in the community during that period, in Ontario, 2011/12 to 2016/17
Percent
50
0
20
40
10
30
2011/12 2012/13 2013/14 2014/15 2015/16 2016/17
Fiscal Year
22.6
20.0 20.922.6
24.1 24.525.8
23.0 23.924.4 26.0 25.5
Doctor home visit
Palliative-specific home care visit
Health Quality Ontario | Measuring Up 2018
61
CHAPTER 9 PALLIATIVE CARE
Data sources: National Rehabilitation Reporting System, Home Care Database, Ontario Health Insurance Plan Claims History Database, Registered Persons Database, Continuing Care Reporting System, Discharge Abstract Database, Ontario Mental Health Reporting System, provided by Cancer Care Ontario
* People were identified as having received palliative-specific home care if they received care that was identified as palliative in their medical records, or if they were designated in their medical records as being at the end of life.

The palliative care people receive may depend on where they liveThere was substantial variation between different regions of Ontario in performance indicator results related to palliative care.
During their final 30 days of life, among people who lived in the community in 2016/17:
• The proportion who received a home visit from a doctor varied by up to four-fold between regions, from 8.0% in the North West region to 33.8% in the Waterloo Wellington region. Some people may have received a home visit from a nurse practitioner during their final 30 days of life, but data on those visits are not currently included in the OHIP data used for this indicator. (Figure 9.2)
• The proportion who received palliative-specific home care varied by up to nearly three-fold between regions, from 11.7% in the North West region to 33.7% in the Waterloo Wellington region
• The proportion who received any home care,including palliative-specific home care, ranged from 32.6% in the North West region to 56.3% in the South East region
Among all those who died in Ontario, the proportion who had an unplanned visit to the emergency department in the last 30 days of life ranged from 47.0% in the North West region to 58.0% in theNorth East region.
FIGURE 9.2 Percentage of people who had at least one home visit from a doctor during their last 30 days of life, among people who lived in the community during that period, in Ontario, by region, 2016/17
Percent
50
0
10
20
30
40
Ont
ario
Erie
St.
Cla
ir
Sou
th W
est
Wat
erlo
oW
ellin
gton
Ham
ilton
Nia
gara
Hal
dim
and
Bra
nt
Cen
tral
Wes
t
Mis
siss
auga
Hal
ton
Toro
nto
Cen
tral
Cen
tral
Cen
tral
Eas
t
Sou
th E
ast
Cha
mp
lain
Nor
th S
imco
eM
usko
ka
Nor
th E
ast
Nor
th W
est
Region
25.824.1
27.9
33.8
25.6
28.5
24.9
28.129.9
19.2
24.0
30.532.7
17.6
8.0
Measuring Up 2018 | Health Quality Ontario
62
CHAPTER 9 PALLIATIVE CARE
Data source: National Rehabilitation Reporting System, Ontario Health Insurance Plan Claims History Database, Registered Persons Database, Continuing Care Reporting System, Discharge Abstract Database, Ontario Mental Health Reporting System, provided by Cancer Care Ontario

Most people in Ontario still die in a hospitalMost people say they would prefer to die at home. [64, 65 ] However, more than half of deaths in Ontario occur in hospital.( Figure 9.3 )
There has been a decrease over recent yearsin the proportion of deaths that occur in hospital, to 52.0% in 2016/17 from 56.9% in 2010/11.
Among deaths in hospital in 2016/17: ( Figure 9.3 )
• About three-quarters were in acute inpatient beds, which are intended for the treatment of disease or severe episodes of illness.
• About 1 in 7 were in complex continuing care beds, which are intended to provide continuing, medically complex and specialized services for people with long-term illness or disabilities that require skilled or technology-based care not available in a home or a long-term care facility.
• About 1 in 12 were in emergency departments.
The proportion of deaths that occurred in hospital varied by region in 2016/17 from 42.3 % in the North Simcoe Muskoka region to 58.4% in the Central region.
FIGURE 9.3 Location of deaths in Ontario, as a percentage of all deaths in the province, 2016/17
Hospital
Acute Inpatient*
Complex Continuing Care
Emergency Department
Long Term Care
Community
52.0%
39.6%
18.1%
29.8%
8.0%
4.4%
Health Quality Ontario | Measuring Up 2018
63
CHAPTER 9 PALLIATIVE CARE
Data source: National Ambulatory Care Reporting System, National Rehabilitation Reporting System, Registered Persons Database, Discharge Abstract Database, Ontario Mental Health Reporting System, Continuing Care Reporting System, provided by Cancer Care Ontario*Includes deaths in acute hospital, mental health beds and inpatient rehabilitation.

Did you know?Many people are not receiving palliative care soon enough.
Among people who died in Ontario in 2016/17 and received palliative care services in their last year of life, almost half began receiving it only in their final 30 days ( Figure 9.4 ), even though receiving palliative care earlier can lead to better quality of life during the course of a life-limiting illness. [66 ]
Province-wide performance in this indicator has not changed in five years.
There was variation by region in the proportion of people who began receiving palliative care services only in their final 30 days – from 53.7% in the Erie St. Clair region to 42.8% in the Central West region.
FIGURE 9.4 Percentage of people who began receiving palliative care in each of the 12 months before their deaths, among people who died in Ontario in 2016/17 and received palliative care during their last year of life
0 10 20 30 40 50 60
Mo
nths
bef
ore
dea
th
Percent
12 months or more
11 months
10 months
9 months
8 months
7 months
6 months
5 months
4 months
Started within 2 monthsbefore death
3 months
Started within 1 monthbefore death
7.7
2.5
2.3
2.5
2.7
3.0
3.5
3.8
4.8
6.9
11.9
48.3
Measuring Up 2018 | Health Quality Ontario
64
CHAPTER 9 PALLIATIVE CARE
Data source: National Ambulatory Care Reporting System, Registered Persons Database, Ontario Health Insurance Plan Claims History Database, Discharge Abstract Database, Home Care Database, Ontario Mental Health Reporting System, Continuing Care Reporting System, provided by Cancer Care Ontario
Indicators
Home visits from a doctor: The percentage of people who received at least one visit at home from a doctor during their last 30 days of life, among people who lived in the community during that period.It excludes people who spent their last 30 days in a hospital, long-term care home, complex continuing care facility, mental health inpatient facility or rehabilitation facility
Home visits from a doctor may help prevent unplanned emergency department visits, and decrease the likelihood people will die in hospital. [ 67]
Home care services: The percentage of people who received home care service – including palliative-specific home care or any home care – during their last 30 days of life, among people who lived in the community during that period. It excludes people who spent their last 30 days in a hospital, long-term care home, complex continuing care facility, mental health inpatient facility or rehabilitation facility
Home care can improve quality of life for those nearing the end of life. Research suggests receiving home care services that are palliative-specific decreases the likelihood of dying in hospital. [ 68 ]
Unplanned visits to the emergency department: The percentage of people, among all those who died, who had at least one unplanned emergency department visit in their last 30 days of life. It excludes people who were in the hospital during the entire 30-day period before death
An unplanned visit to the emergency department may indicate that needed care that might have prevented such a visit was not received in the community. [ 69 ]
Location of death: The percentages of people, among all those who died, who died in the community (which includes a private residence, hospice or assisted-living facility), in hospital, or in a long-term care home
Research shows most people would prefer to die at home. [ 70, 71 ]
These palliative care indicators, and others in the Technical Supplement, align with the indicators selected by the Ontario Palliative Care Network to map progress on its Action Plan to improve the availability and accessibility of equitable, high-quality and sustainable palliative care services for all Ontarians.
For more indicator results related to Palliative Care, as well as results forall the indicators analyzed for Measuring Up 2018, please see the Technical Supplement tables at www.hqontario.ca.
Health Quality Ontario | Measuring Up 2018
65
CHAPTER 9 PALLIATIVE CARE

e
1010Health SpendingPublic funding covers a range of health care costs in Ontario, including emergency care, doctor’s visits, hospital stays and surgeries. It also provides home and community care, drug coverage and eye care for certain groups, like those over 65 years old or those with catastrophic conditions.
Although private funding covers other health-related expenses through private health insurance or out-of-pocket payments, the cost of care — for drugs, dental care or other health care services — is still a barrier for some people in the province.
66

e
Health spending per person ranks in the middle among OECD peersTotal health spending per person reached $6,110 in current Canadian dollars in Ontario in 2015. Both public and private funding (which includes out-of-pocket spending by individuals ) contribute to total health spending in the province. That spending covers medical services, administration, prevention programs and investment in new hospital buildings, training and other infrastructure.
Spending remained stable between 2011 and 2014, and went up slightly between 2014 and 2015. And, although total health spending per person was up by 10.3% since 2005 in Ontario, it was lower than in most provinces in 2015. The province also ranked at a mid-range spending level when compared to 10 peer Organisation for Economic Co-operation and Development (OECD) countries — those with well-developed economies and similar investments in health care. ( Figure 10.1 )
Different policies, priorities and overall health needs influence spending in each country, and different spending levels don’t necessarily mean that one is better than another. For example, lower spending levels could reflect more efficient use of health care dollars.
In Ontario, 66.9% ($4,087 in current Canadian dollars) of total health spending per person came from public sources and 33.1% ($2,022, current Canadian dollars) came from private sources. (Figure 10.2) The publicly funded share of the province’s total cost fell slightly, by 2.7%, between 2011 and 2015. On the other hand, private spending on health—on items like prescription drugs and other medical services— is steadily increasing in the province: annual private health spending per person went up by 6.7% during the same period.
FIGURE 10.1 Total health spending per person in Ontario, Canada and internationally, in US dollar purchasing power parity*, 2015
US dollar purchasing power parity
10000
0
2000
4000
6000
8000
Ont
ario
Can
ada
Aus
tral
ia
Fran
ce
Ger
man
y
Net
herla
nds
New
Zea
land
Nor
way
Sw
eden
Sw
itzer
land
Uni
ted
Kin
gdom
Uni
ted
Sta
tes
Province / Pays
4450 4633 4410 46575297 5148
3524
62395272
7570
4072
9491
Data sources: National Health Expenditure Database, provided by the Canadian Institute for Health Information; OECD Health Statistics 2018, provided by the Organisation for Economic Co-operation and Development. *Each country’s spending is given in US dollars and adjusted using a method called purchasing power parity to convert the different currencies. This data exclude capital investment in health care infrastructure
FIGURE 10.2 Health spending per person by sector in Ontario, 2015
Private
Public
$2,022
$4,087
33%
67%
Health Quality Ontario | Measuring Up 2018
67
CHAPTER 10 HEALTH SPENDING
Data source: National Health Expenditure Database, provided by the Canadian Institute for Health Information

Public drug spending per person is lower compared to peer countriesDrugs are a major element of total health spending. [72 ] In 2015, a total of $993 per person from public and private sources was spent on drugs in Ontario, in current Canadian dollars. In a comparison with nine peer Organisation for Economic Co-operation and Development countries – those with well-developed economies and similar investments in health care – only Switzerland and the United States spent more. ( Figure 10.3 )
Public funding covered 38.4% – $381 per person in current Canadian dollars or $306 in US dollar purchasing power parity± – of total drug spending per person in the province in 2015. That proportion of spending on prescription and over-the-counter drugs was on par with the Canadian average, but was in the lower tier of public spending in peer OECD countries. However, different policies and public coverage levels – as well as varied drug pricing – from place to place make it difficult to draw exact comparisons between countries.
Private funding – either through private health care insurance plans or out-of-pocket contributions — covered 61.6% of total spending on drugs per person.
Drug costs have gone up in Canada, as greater use of expensive highly specialized medicines, like biologics, has added to the costs. [73 ]
FIGURE 10.3 Health spending on drugs per person in Ontario, Canada and internationally, by sector (private and public), in US dollar purchasing power parity±, 2015
US dollar purchasing power parity
1400
0
600
800
200
400
1000
1200
Ont
ario
Can
ada
Aus
tral
ia
Fran
ce*
Ger
man
y
Net
herla
nds*
Nor
way
Sw
eden
Sw
itzer
land
Uni
ted
Kin
gdom
*
Uni
ted
Sta
tes†
Province/Country
Private
Public
491
306
466313
323465
191
127
128 179233
405
150
1162
635
271 225 249
558
331294
491
306
Measuring Up 2018 | Health Quality Ontario
68
CHAPTER 10 HEALTH SPENDING
Data source: National Health Expenditure Database, provided by the Canadian Institute for Health Information; OECD Health Statistics 2018, provided by the Organisation for Economic Co-operation and Development
± Each country’s spending is given in US dollars and adjusted using a method called purchasing power parity to convert the different currencies
* The data, in addition to prescribed and over-the-counter medicines, also include other medical non-durable goods for the indicated countries, making these countries less comparable to the others
† For the United States, the spending is from all sectors.
Did you know?In Canada, drug costs exceeded $36 billion in 2015,making drugs the second-largest health care expenditure. On average, pharmaceuticals make up the third-largest health spending category – after inpatient and outpatient care – across OECD countries, accounting for 16% of expenditures on health. [74 ]

A third of Ontarians skip dental visits over costsApart from prescription drugs, other health care expenses can also create barriers to care. In a 2016 survey, 31% of people in Ontario reported skipping dental checkups or care over the previous 12 months because of the cost. Studies have shown that people facing cost-related barriers to dental care also report poorer oral health outcomes. [75, 76]
The percentage of Ontarians skipping dental care over cost concerns was higher than the 28% Canadian average. It was also higher than in most other countries with similarly developed economies and similar investments in health care, where the percentages ranged from 11% in the United Kingdom and the Netherlands, to 32% in the United States. ( Figure 10.4 )
FIGURE 10.4 Percentage of people, aged 18 and over, who reported having skipped dental care or dental checkups because of the cost, in Ontario, in Canada, and internationally, 2016
Percent
100
0
60
80
20
40
Ont
ario
Can
ada
Aus
tral
ia
Fran
ce
Ger
man
y
Net
herla
nds
New
Zea
land
Nor
way
Sw
eden
Sw
itzer
land
Uni
ted
Kin
gdom
Uni
ted
Sta
tes
Province/Country
3128
21 23
1411
22 2219 21
11
32
Health Quality Ontario | Measuring Up 2018
69
CHAPTER 10 HEALTH SPENDING
Data source: Commonwealth Fund 2016 International Health Policy Survey
Indicators
Health spending per person: Public, private, and combined public and private spending on health care, per member of the population, including spending on medical services and products, public health and prevention programs, and administration
A health care system needs sufficient resourcesto function well.
Health spending on drugs per person:Spending on prescription medications and over-the-counter drugs purchased in pharmacies and other retail stores, per member of the population. Drugs consumed in hospitals and other health care settings as part of inpatient or day case treatment are excluded
Expenditures on drugs represent an important elementof overall health spending.
Skipped dental care due to cost: The percentage of people aged 18 or older who reported skipping dental visits or care becauseof the cost
Dental care affordability is a critical health care policy issue. People who report cost barriers to dental care also report worse oral health outcomes. [ 77, 78]
For more indicator results related to Health Spending, as well as resultsfor all the indicators analyzed forMeasuring Up 2018, please see the Technical Supplement tables at www.hqontario.ca.

Acknowledgments
BoardAndreas LaupacisChair
Shelly JamiesonVice-Chair
Simon Brascoupé
Stewart Kennedy
Bernard Leduc
Julie Maciura
Angela Morin
James Morrisey
Camille Orridge
Dorothy Pringle
Rick Vanderlee
Biographies are posted at:http://www.hqontario.ca/About-Us/Our-Mandate-and-Our-People/Board-of-Directors-and-Committees
Health Quality Ontario acknowledges and thanks the manydedicated people who contributed to this report, including:HQO’s expert review panel, a group of research and measurementexperts from around the province who provided advice on all quantitative research and analysis:
Carole Ann Alloway, Debbie Bang, Katherine Berg, Jennifer Berger, Dan Buchanan, Andrean Bunko, Pat Campbell, Lucas Chartier, Tanya Christidis, Imtiaz Daniel, Claire de Oliveira, Shelley Deeks, Michael Dunn, Gilles Fortin, Kaiyan Fu, Jian Gao, Julia Gao, Angelika Gollnow, Norma Hall, Daniel Harrington,Caroline Heick, Jeremy Herring, Bill Hogg, Jeremiah Hurley, Brian Hutchison, Tracy Johnson, David Kaplan, Jaime Killingbeck, Tara Kiran, Kerry Kuluski, Pamela Leece, Lisa Levin, Barbara Liu, Susan Locke,Cathy Lumsden, Shilpi Majumder, Julian Martalog, Danielle Martin, Kavita Mehta, Andrea Moser, Chris Mulford, Vivian Ng, Kathryn Pilkington, Jeff Poss, Lou Reidel, Nathalie Robertson, Laura Rosella, Jane Simms, Rachel Solomon, Michael Spinks, Thérèse Stukel, Penny Sutcliffe, Candace Tam, Justin Thielman, Trevor van Ingen, Sue VanderBent, Simone Vigod, Sarah Wilson, Ryan Wood, and Claudia Zanchetta
Measuring Up 2018 | Health Quality Ontario
70

The following organizations provideddata for the report:
Better Outcomes Registry & Network Ontario, Canadian Institute for Health Information,Cancer Care Ontario, Commonwealth Fund International Health Policy Surveys, CorHealth Ontario, Health Shared Services Ontario (HSSO) ( formally known as Ontario Association of Community Care Access Centres ), Institute for Clinical Evaluative Sciences, Ministry of Health and Long-Term Care, Ontario Hospital Association, Public Health Ontario, Statistics Canada, and The Organisation for Economic Co-operationand Development.
Notes: Parts of this material are based on data and information compiled and provided by CIHI, However, the analyses, conclusions, opinions and statements herein are those of the author, and not necessarily those of CIHI.
Parts of this report are based on data and information provided by ICES, which is funded by an annual grant from the Ontario Ministry of Health and Long-Term Care (MOHLTC). The analyses, conclusions, opinions and statements expressed herein are those of the author, and not necessarily those of ICES and funding sources. No endorsement by ICES or the Ontario MOHLTC is intended or should be inferred.
Parts of this material are based on data and information compiled and provided by MOHLTC. However, the analyses, conclusions, opinions and statements expressed herein are those of the author, and not necessarily those of MOHLTC.
Parts of this material are based on data and information compiled and provided by HSSO. However, the analyses, conclusions, opinions and statements expressed herein are those of the author, and not necessarily those of HSSO.
Core funding for 2016 Commonwealth Fund International Health Policy Survey of Adults was provided by The Commonwealth Fund with co-funding from the following organizations outside of Canada: Haute Autorité de santé (France ); Caisse nationale de l’assurance maladie des travailleurs salariés (France ); BQS Institute for Quality and Patient Safety (Germany ); the German Federal Ministry of Health; the Dutch Ministry of Health, Welfare and Sport; the Scientific Institute forQuality of Healthcare, Radboud University Nijmegen ( the Netherlands ); the Norwegian Knowledge Centre for the Health Services; the Swedish Ministry of Health and Social Affairs; the Swiss Federal Office of Public Health; the NSW Bureau of Health Information (Australia ); and many other country partners. Within Canada, funding for an expanded Canadian sample was provided by the Canadian Institute for Health Information (CIHI ), the Canadian Institutes of Health Research (CIHR), the Health Quality Council of Alberta, the Commissaire à la santé et au bienêtre du Québec and Health Quality Ontario.
Staff at several divisions and branches of the Ministry of Health and Long-Term Care supplied data and background information and verified facts contained within the report.
Health Quality Ontario | Measuring Up 2018
71

References
1 Canadian Community Health Survey 2016, provided by Statistics Canada
2 Public Health Ontario, Chronic Diseasesand Injuries. Available from: https://www.publichealthontario.ca/en/BrowseByTopic/ChronicDiseasesAndInjuries/Pages/Chronic-Diseases-and-Injuries.aspx
3 Canadian Community Health Survey 2016, provided by the Institute for Clinical Evaluative Sciences. Results are adjusted for age and sex. Chronic conditions include anxiety, arthritis, asthma, chronic obstructive pulmonary disease, heart disease, hypertension and depression.
4 Government of Canada, Government of Canada Actions on Opioids: 2016 and 2017. Available from: https://www.canada.ca/en/health-canada/services/publications/healthy-living/actions-opioids-2016-2017.html
5 Indicator Library: Peer Group Methodology, Canadian Institute for Health Information. Available from: http://indicatorlibrary.cihi.ca/download/attachments/1114124/Peer-Group-Methodology_EN.pdf
6 Fiscal year data are incomplete for 2011/12, and included only Q2-Q4
7 Bed Census Summary, Wait Time Information System, provided by Cancer Care Ontario
8 Health Quality Ontario, Effect of Early Follow-Up After Hospital Discharge on Outcomes in Patients With Heart Failure or Chronic Obstructive Pulmonary Disease: A Systematic Review, Ontario Health Technology Assessment
Series; Vol. 17: No. 8, pp. 1–37, May 2017, Queen’s Printer for Ontario, 2017. Available from: http://www.hqontario.ca/Portals/0/Documents/evidence/reports/recommendation-follow-up-discharge-copd-en-1705.pdf
9 As of April 1, 2018. Provided by the Ministry of Health and Long-Term Care.
10 Canadian Institute for Health Information.Inpatient hospitalizations: Volumes, Lengths of Stay, and Standardized Rates, QuickStats
11 Ontario Hospital Association, QuickFacts 2018: Ontario’s Public Hospitals. Available from: https://www.oha.com/your-hospitals
12 National Ambulatory Care Reporting System, Access to Care, provided by Cancer Care Ontario
13 Canadian Institute for Health Information, Understanding Emergency Department Wait Times: Access to Inpatient Beds and Patient Flow (Ottawa: CIHI, 2007)
14 Canadian Institute for Health Information. Inpatient hospitalizations: Volumes, Lengths of Stay, and Standardized Rates, QuickStats,
15 Health Quality Ontario. (2016). Health topic: Read about patient safety in Ontario hospitals Available from: http://www.hqontario.ca/portals/0/Modals/pr/patient-safety/provincial/index-en.html
16 Canadian Community Health Survey 2016, provided by Statistics Canada. Note: Age-standardized rates
17 Brien S, Grenier L, Kapral M.E., Kurdyak P, Vigod S. Taking Stock: A Report on the Quality
of Mental Health and Addictions Services in Ontario. An HQO/ICES Report. Toronto, Health Quality Ontario and Institute for Clinical Evaluative Sciences; 2015. Available from: http://www.hqontario.ca/Portals/0/Documents/pr/theme-report-taking-stock-en.pdf
18 Chesney E, Goodwin GM and Fazel S (2014). Risks of all-cause and suicide mortality in mental disorders: a meta-review. World Psychiatry. 2014. 13: 153-60.
19 Smetanin P, Stiff D, Briante C, Adair CE, Ahmad S, Khan M. The Life and Economic Impact of Major Mental Illnesses in Canada: 2011 to 2041. RiskAnalytica, on behalf of the Mental Health Commission of Canada, 2011
20 Government of Canada (2006). The Human Face of Mental Health and Mental Illness in Canada. Ottawa: Minister of Public Works and Government Services Canada, 2006. Available at http://www.phac-aspc.gc.ca/publicat/human-humain06/pdf/human_face_e.pdf
21 Pearson C, Janz T, and Ali, J. (2013). Health at a Glance: Mental and substance use disorders in Canada. Statistics Canada Catalogue no. 82-624-X. Available from: http://www.statcan.gc.ca/pub/82-624-x/2013001/article/11855-eng.htm
22 Compared to age groups 25-44, 45-64, and 65 and over.
23 Vigod SN, Kurdyak PA, Dennis C-L, Leszcz T, Taylor VH, Blumberger DM, et al. Transitional interventions to reduce early psychiatric readmissions in adults: systematic review. The British Journal of Psychiatry. 2013;202(3):187-194.
Measuring Up 2018 | Health Quality Ontario
72
24 Vigod SN, Kurdyak PA, Dennis C-L, Leszcz T, Taylor VH, Blumberger DM, et al. Transitional interventions to reduce early psychiatric readmissions in adults: systematic review. The British Journal of Psychiatry. 2013;202(3):187-194.
25 Canadian Mental Health Association, Poverty and Mental Illness. Available from: https://ontario.cmha.ca/documents/poverty-and-mental-illness
26 Canadian Community Health Survey, provided by Statistics Canada. Note: Age-standardized rates
27 Fereidooni Moghadam M, Fallahi Khoshknab M, Pazargadi M. Psychiatric Nurses’ Perceptions about Physical Restraint; A Qualitative Study. International Journal of Community Based Nursing and Midwifery. 2014;2(1):20-30.
28 Fisher WA. Restraint and Seclusion: A Review of the Literature., American Journal of Psychiatry. 1994. 151(11) (1994): pp. 1584–1591.
29 Fereidooni Moghadam M, Fallahi Khoshknab M, Pazargadi M. Psychiatric Nurses’ Perceptions about Physical Restraint; A Qualitative Study. International Journal of Community Based Nursing and Midwifery. 2014;2(1):20-30.
30 Fisher WA. Restraint and Seclusion: A Review of the Literature., American Journal of Psychiatry. 1994. 151(11) (1994): pp.1584–1591.
31 Pearson C, Janz T, and Ali, J. (2013). Health at a Glance: Mental and substance use disorders in Canada. Statistics Canada Catalogue no. 82-624-X. Available from: http://www.statcan.gc.ca/pub/82-624-x/2013001/article/11855-eng.htm
32 Dewa CS, Worker attitudes towards mental health problems and disclosure. International Journal of Occupational and Environmental Medicine, 5: 175-86, 2014. Available from:http://www.theijoem.com/ijoem/index.php/ijoem/article/view/463
33 Continuing Care Reporting System Quick Stats 2016/17, provided by the Canadian Institute for Health Information
34 Data on waits for admission stratified by region are based on the locations of the long-term care homes applied to, not on the locations of the applicants
35 Modernized Client Profile Database, provided by the Ministry of Health and Long-Term Care
36 Modernized Client Profile Database, provided by the Ministry of Health and Long-Term Care
37 Continuing Care Reporting System, provided by the Canadian Institute for health Information
38 Continuing Care Reporting System, provided by the Canadian Institute for health Information
39 All indicator results except wait times were risk-adjusted to account for differences in the populations of individual homes
40 Individual home results are available at the Health Quality Ontario website at www.hqontario.ca/System-Performance/Long-Term-Care-Home-Performance
41 Continuing Care Reporting System Quick Stats 2016/17, provided by the Canadian Institute for Health Information
42 Home Care Database, Ontario Ministry of Health and Long-Term care
43 Pinquart M, Sörensen S. Correlates of Physical Health of Informal Caregivers: A Meta-Analysis. Journal of Gerontology: Psychological Sciences. 2007; 62B, (2):P126–P137.
44 Williams AP, Peckham A, Kuluski K, Lum J, Warrick N, Spalding K, Tam T, Bruce-Barrett C, Grasic M, Im J, Caring for Caregivers: Challenging the Assumptions. Healthcare Papers. 2015;15 (1): 8-21, 2015;15 (1).
45 Schulz R, Beach SR. Caregiving as a Risk Factor for Mortality: The Caregiver Health Effects Study. JAMA. 1999; 282 (23).
46 Schulz R, Sherwood PR. Physical and Mental Health Effects of Family Caregiving, American Journal of Nursing September 2009 108(9)(Supplement):23–27.
47 Coulter, A, Ellins, J, Patient-focused interventions: A review of the evidence, The Health Foundation and Picker Institute Europe, 2006 London, England. Available from: http://www.health.org.uk/sites/health/files/PatientFocusedInterventions_ReviewOfTheEvidence.pdf
48 Based on a Method for Assigning Priority Levels (MAPLe) Scale score of 4 or 5
49 Based on an Activities of Daily Living (ADL) Self-Performance Hierarchy Scale score of 3 or more
50 Based on a Cognitive Performance Scalescore of 1 or more
Health Quality Ontario | Measuring Up 2018
73
References
51 Based on a Depression Rating Scale score of 3 or more
52 Based on a Changes in Health, End-Stage Disease and Signs and Symptoms (CHESS) Scale score of 3 or more
53 Ministry of Health and Long Term Care. Health Care Experience Survey 2013-2017. Available at: https://www.ontario.ca/data/health-care-experience-survey-hces
54 Maarsingh OR, Henry Y, van de Ven PM, Deeg DJH, Continuity of care in primary care and association with survival in older people: a 17-year prospective cohort study, British Journal of General Practice 2016; 66 (649): e531-e539.
55 Toward Optimized Practice, Evidence Summary: The Benefits of Continuity in Primary Care, 2017. Available from: http://www.topalbertadoctors.org/file/top--evidence-summary--value-of-continuity.pdf
56 Cancer Quality Council of Ontario. Colorectal Cancer Screening Participation. Available at: http://www.csqi.on.ca/by_patient_ journey/screening/colorectal_screening_participation/
57 Cancer Quality Council of Ontario. Colorectal Cancer Screening Participation. Available at: http://www.csqi.on.ca/by_patient_ journey/screening/colorectal_screening_participation/
58 National Ambulatory Care Reporting System, Registered Persons Database, Ontario Health Insurance Plan Claims Database, Discharge Abstract Database, Home Care Database, Ontario Mental Health Reporting System,
National Rehabilitation Reporting System and Continuing Care Reporting System provided by CCO
59 Ontario Pallaitive Care Networkhttps://www.ontariopalliativecarenetwork.ca
60 Tanuseputro P, Beach S, Chalifoux M, Wodchis WP, Hsu AT, Seow H, Manuel DG, Associations between physician home visits for the dying and place of death: A population-based retrospective cohort study, cohort study. PLoS ONE 13(2) e0191322. https://doi.org/10.1371/journal.pone.0191322
61 Brazil K, Howell D, Bedard M, Krueger P, Heidebrecht C. Preferences for place of care and place of death among informal caregivers of the terminally ill. Palliative Medicine. 2005;19(6):492-9.
62 Gomes B, Calanzani N, Gysels M, Hall S and Higginson IJ. Heterogeneity and changes in preferences for dying at home: a systematic review. BMC Palliat Care. 2013; 12(7)
63 Tanuseputro P, Beach S, Chalifoux M, Wodchis WP, Hsu AT, Seow H, Manuel DG, Associations between physician home visits for the dying and place of death: A population-based retrospective cohort study. PLoS ONE 13(2): e0191322. https https://doi.org/10.1371/journal.pone.0191322
64 Brazil K, Howell D, Bedard M, Krueger P, Heidebrecht C. Preferences for place of care and place of death among informal caregivers of the terminally ill. Palliative Medicine. 2005;19(6):492-9.
65 Gomes B, Calanzani N, Gysels M, Hall S and Higginson IJ. Heterogeneity and changes in preferences for dying at home: a systematic review. BMC Palliat Care. 2013; 12.
66 Zimmermann C, Swami N, Krzyzanowska M, Hannon B, Leighl N, Oza A, et al. Early palliative care for patients with advanced cancer: a cluster-randomised controlled trial. The Lancet. 2014;383:1721-30.
67 Tanuseputro P, Beach S, Chalifoux M, Wodchis WP, Hsu AT, Seow H, Manuel DG, Associations between physician home visits for the dying and place of death: A population-based retrospective cohort study, PLOS, Published: February 15, 2018. Available at: https://doi.org/10.1371/journal.pone.0191322
68 Gomes B, Calanzani N, Gysels M, Hall S and Higginson IJ. Heterogeneity and changes in preferences for dying at home: a systematic review. BMC Palliat Care. 2013; 12.
69 Lawrenson R, Waetford J, Gibbons V, Kirk P, Haggar S, Reddy R. Palliative care patients’ use of emergency departments. The New Zealand Medical Journal. 2013;126(1372):80-8
70 Brazil K, Howell D, Bedard M, Krueger P, Heidebrecht C. Preferences for place of care and place of death among informal caregivers of the terminally ill. Palliative Medicine. 2005;19(6):492-9.
71 Gomes B, Calanzani N, Gysels M, Hall S and Higginson IJ. Heterogeneity and changes in preferences for dying at home: a systematic review. BMC Palliat Care. 2013; 12.
74
Measuring Up 2018 | Health Quality Ontario

72 National Health Expenditure Trends, 1975 to 2017. Ottawa, ON. CIHI. 2017. Available from: https://www.cihi.ca/sites/default/files/document/nhex2017-trends-report-en.pdf
73 National Health Expenditure Trends, 1975 to 2017. Ottawa, ON. CIHI. 2017. Available from: https://www.cihi.ca/sites/default/files/document/nhex2017-trends-report-en.pdf
74 OECD. Health at a Glance, 2017. OECD Indicators. Available from: http://www.oecd.org/health/health-systems/health-at-a-glance-19991312.htm
75 Locker, J. Maggirias, J. & Quinonez, C. Income, dental insurance coverage and financial barriers to dental care among Canadian adults Journal of Public Health Dentistry. 2011. 71(4): 327-334.
76 Thompson, B. Cooney, P. Lawrence, H. Ravaghi, V. Quinonez, C. Cost as a barrier to accessing dental care: Findings from a Canadian population-based study. Journal of Public Health Dentistry. 2014. Available from: https://onlinelibrary.wiley.com/doi/full/10.1111/jphd.12048
77 Locker, J. Maggirias, J. & Quinonez, C. Income, dental insurance coverage and financial barriers to dental care among Canadian adults Journal of Public Health Dentistry. 2011. 71(4): 327-334.
78 Thompson, B. Cooney, P. Lawrence, H. Ravaghi, V. Quinonez, C. Cost as a barrier to accessing dental care: Findings from a Canadian population-based study. Journal of Public Health Dentistry. 2014. 74(3): 210-218.
Health Quality Ontario | Measuring Up 2018
75

Health Quality Ontario is the provincial lead on the quality of health care. We help nurses, doctors and others working hard on the frontlines be more effective in what they do – by providing objective advice and by supporting them and government in improving health care for the people of Ontario.
Our focus is making health care more effective, efficient and affordable which we do through a legislative mandate of:
• Reporting to the public, organizations and health care providers on how the health system is performing,
• Finding the best evidence of what works, and
• Translating this evidence into concrete standards, recommendations and tools that health care providers can easily put into practice to make improvements.
Health Quality Ontario is governed by a 12-member Board of Directors appointed by the Minister of Health and Long-Term Care and with representation from the medical and nursing professions, patients and other segments of health care.
In everything it does, Health Quality Ontario brings together those with first-hand experience – doctors, nurses, other health care providers, patients and
families – to hear their experiences and how to make them better. Health Quality Ontario also works collaboratively with organizations across the province to encourage the spread of innovative and proven programs to support high quality, while also saving money and eliminating redundancy. And, we partner with patients to be full participants in designing our programs – another part of our work we take very seriously.
Examples of what we do include providing ways for clinicians to use their collective wisdom and experience to bring about positive change. Last year, 29 Ontario hospitals participated in a pilot program that reduced infections due to surgery by 18%. This program enabled surgeons to see their surgical data and how they perform in relation to each other and to 700 other hospitals worldwide. We then helped them identify and action improvement practices. Forty-six hospitals across Ontario are now part of this program.
We also develop quality standards that are based on the best evidence, to guide on caring for health conditions where there are gaps in care. Each quality standard provides recommendations to government, organizations and clinicians, and is accompanied by a guide for patients to help them ask informed questions about their care.
In addition, Health Quality Ontario’s health technology assessments use evidence to assess the value for money and safety of new technologies and procedures and make recommendations to government on whether or not they should be funded.
And each year, we help organizations across the system create Quality Improvement Plans, for improving health care quality.
Health Quality Ontario is committed to supporting the development of a quality health care system based on six fundamental dimensions: efficient, timely, safe, effective, patient-centred and equitable.
Our goal is to challenge the status quo and to focus on long-lasting pragmatic solutions that improve the health of Ontarians, enhance their experience of care, reduce health care costs, and support the well-being of health care providers – because we believe a quality health system results in Ontarians leading healthier and more productive lives, and a vibrant society in which everyone benefits.
Measuring Up 2018 | Health Quality Ontario
76

Health QualityOntario Let’s make our health system healthier

Health Quality Ontario130 Bloor Street West10th Floor Toronto, ON M5S 1N5
© Queen’s Printer for Ontario, 2018
Telephone: 416-323-6868Toll-free: 1-866-623-6868Email: [email protected]