measuring value created by impact incubators & accelerators · conveners.org and it reflects...
TRANSCRIPT
I-Dev International Market Based Sustainable Development
MEASURING VALUE CREATED By Impact Incubators & AcceleratorsNovember 2014
NOte: We’d like ddImages on the cover were taken during the pre-SOCAP 2014 workshop, hosted by GSBI/Santa Clara University and Conveners.org and it reflects key questions that were posed to impact incubator/accelerator leadership, and the
responses or additional questions they wrote down. For additional information on this workshop, Please contact: [email protected].
2
Introduction & Executive Summary 03
Establishing A Framework 08
Research Methodology 09
Value Creation to Enterprises 13
Value Creation to Investors 23
Case Study: A Partnership For Impact 35
Summary Recommendations 36
Appendix. Proposed Framework 40
TABLE OF
CONTENTS
3
Are impact incubators & accelerators creating value? If so, how?
INTRODUCTION &
EXECUTIVE SUMMARY
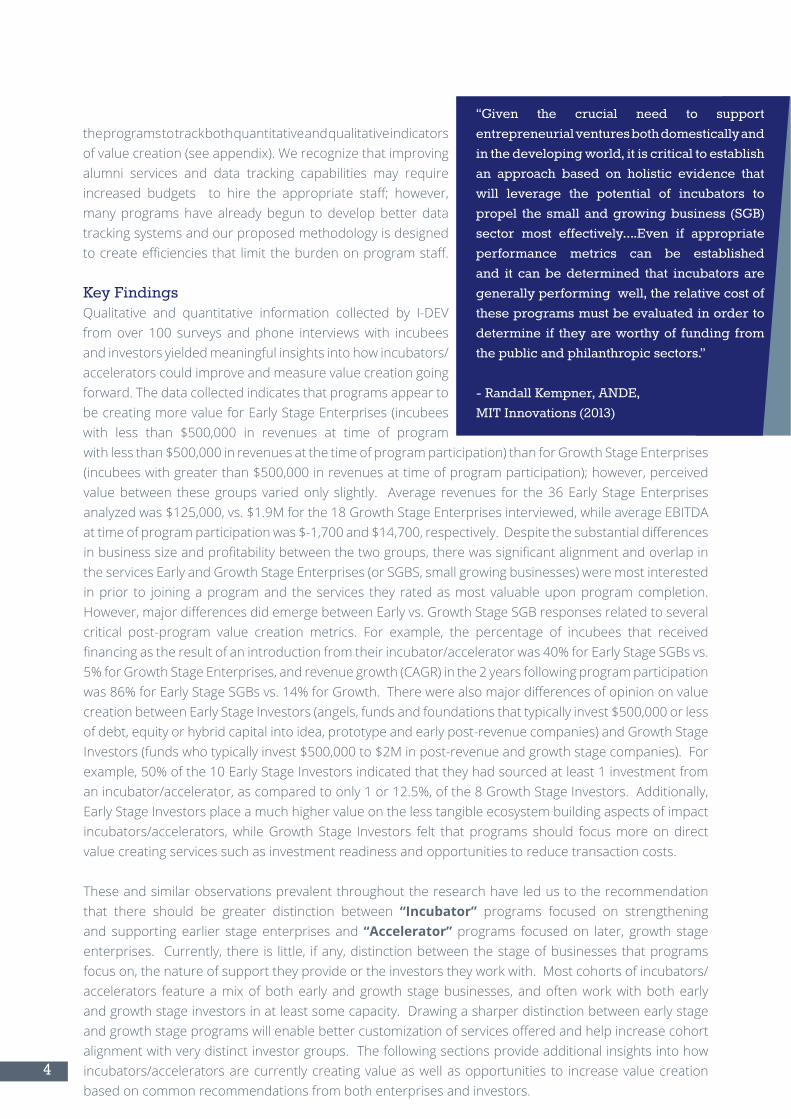
IntroductionI-DEV International, in conjunction with the Aspen Network of Development Entrepreneurs (ANDE) and Agora Partnerships, set out to evaluate the value created by impact incubators and accelerators for social enterprises and impact investors they seek to support. This 18-month analysis included over 100 interviews and surveys with stakeholders from 8 impact-focused incubator/accelerator programs, 54 enterprises that had participated in the incubator/accelerator programs analyzed, and 18 active impact investors.
Key research objectives were to:
• Evaluatethequantifiablevaluecreatedbyimpact-focusedincubator/acceleratorprograms• Design and pilot a framework that can be used to objectively compare and benchmark impact
incubator/accelerator programs against each other
The study is a continuation of ANDE’s research to assess the current and potential value created by impact incubators/accelerators,aninitiativelaunchedin2012.ThisanalysisbuildsonANDE’spreviousfindingsand was conceived as a means to evaluate how and where incubators/accelerators are creating tangible value.Oneoftheinitialgoalsofthestudywastohelpprogramsdevelopquantifiableevidencetheyneedto make a stronger case for charging incubees and investors for their services and the value they create; however, a full quantitative analysis was limited by several key obstacles. Most notably, at the time of analysis, few programs tracked consistent and comprehensive data on their alumni or investors they work with(evenbasicfinancialdataandinvestmentsreceivedorsourcedviatheprogram).
Additionally, few impact incubator/accelerator programs have operated long enough to have alumni that can be measured on multiple years of post-incubation performance. While the later limitation will solve itself over time, we strongly recommend that incubators/accelerators begin to track alumni performance data.As part of the analysis, I-DEV developed and piloted an objective framework that could be used by
social enterprises that had participated in the incubator/accelerator programs analyzed.
• Early Stage SGBs find greater $-value in incubators/accelerators than Growth Stage SGBs
• Incubees & investors have been disappointed by capital raise and investment readiness support
• Most valuable services for Early & Growth Stage SGBs are business plan or strategy development and peer mentoring
• Intangible ecosystem building is the leading value creator for investors
• Programs have a large, untapped opportunity to deliver tangible, quantifiable value for investors via increased pipeline volume & quality, decreased transaction costs and decreased portfolio management costs; however, metrics are not currently being tracked
• Lack of consistent, standardized data collection is limiting impact incubator/accelerator programs’ ability to prove and be adequately compensated for value created for stakeholders
Key Report Highlights:
4
the programs to track both quantitative and qualitative indicators of value creation (see appendix). We recognize that improving alumni services and data tracking capabilities may require increased budgets to hire the appropriate staff; however,many programs have already begun to develop better data tracking systems and our proposed methodology is designed tocreateefficienciesthat limittheburdenonprogramstaff.
Key FindingsQualitative and quantitative information collected by I-DEV from over 100 surveys and phone interviews with incubees and investors yielded meaningful insights into how incubators/accelerators could improve and measure value creation going forward. The data collected indicates that programs appear to be creating more value for Early Stage Enterprises (incubees with less than $500,000 in revenues at time of program
“Given the crucial need to support entrepreneurial ventures both domestically and in the developing world, it is critical to establish an approach based on holistic evidence that will leverage the potential of incubators to propel the small and growing business (SGB) sector most effectively….Even if appropriate performance metrics can be established and it can be determined that incubators are generally performing well, the relative cost of these programs must be evaluated in order to determine if they are worthy of funding from the public and philanthropic sectors.” - Randall Kempner, ANDE, MIT Innovations (2013)
with less than $500,000 in revenues at the time of program participation) than for Growth Stage Enterprises (incubees with greater than $500,000 in revenues at time of program participation); however, perceived value between these groups varied only slightly. Average revenues for the 36 Early Stage Enterprises analyzed was $125,000, vs. $1.9M for the 18 Growth Stage Enterprises interviewed, while average EBITDA attimeofprogramparticipationwas$-1,700and$14,700,respectively.Despitethesubstantialdifferencesinbusinesssizeandprofitabilitybetweenthetwogroups,therewassignificantalignmentandoverlapinthe services Early and Growth Stage Enterprises (or SGBS, small growing businesses) were most interested in prior to joining a program and the services they rated as most valuable upon program completion. However,majordifferencesdidemergebetweenEarlyvs.GrowthStageSGBresponsesrelatedtoseveralcritical post-program value creation metrics. For example, the percentage of incubees that received financingastheresultofanintroductionfromtheirincubator/acceleratorwas40%forEarlyStageSGBsvs.5%forGrowthStageEnterprises,andrevenuegrowth(CAGR)inthe2yearsfollowingprogramparticipationwas86%forEarlyStageSGBsvs.14%forGrowth.Therewerealsomajordifferencesofopiniononvaluecreation between Early Stage Investors (angels, funds and foundations that typically invest $500,000 or less of debt, equity or hybrid capital into idea, prototype and early post-revenue companies) and Growth Stage Investors (funds who typically invest $500,000 to $2M in post-revenue and growth stage companies). For example,50%ofthe10EarlyStageInvestorsindicatedthattheyhadsourcedatleast1investmentfromanincubator/accelerator,ascomparedtoonly1or12.5%,ofthe8GrowthStageInvestors.Additionally,Early Stage Investors place a much higher value on the less tangible ecosystem building aspects of impact incubators/accelerators, while Growth Stage Investors felt that programs should focus more on direct value creating services such as investment readiness and opportunities to reduce transaction costs.
These and similar observations prevalent throughout the research have led us to the recommendation that there should be greater distinction between “Incubator” programs focused on strengthening and supporting earlier stage enterprises and “Accelerator” programs focused on later, growth stage enterprises. Currently, there is little, ifany,distinctionbetweenthestageofbusinessesthatprogramsfocus on, the nature of support they provide or the investors they work with. Most cohorts of incubators/accelerators feature a mix of both early and growth stage businesses, and often work with both early and growth stage investors in at least some capacity. Drawing a sharper distinction between early stage andgrowthstageprogramswillenablebettercustomizationofservicesofferedandhelpincreasecohortalignment with very distinct investor groups. The following sections provide additional insights into how incubators/accelerators are currently creating value as well as opportunities to increase value creation based on common recommendations from both enterprises and investors.
5
30%Formal partnership with an incubator/
accelerator
60%Financed an incubator/ accelerator
Growth Stage Investors
35%Formal partnership with an incubator/
accelerator
12.5%Sourced a deal
via program introduction
0%Financed an incubator/accelerator
Early StageInvestors
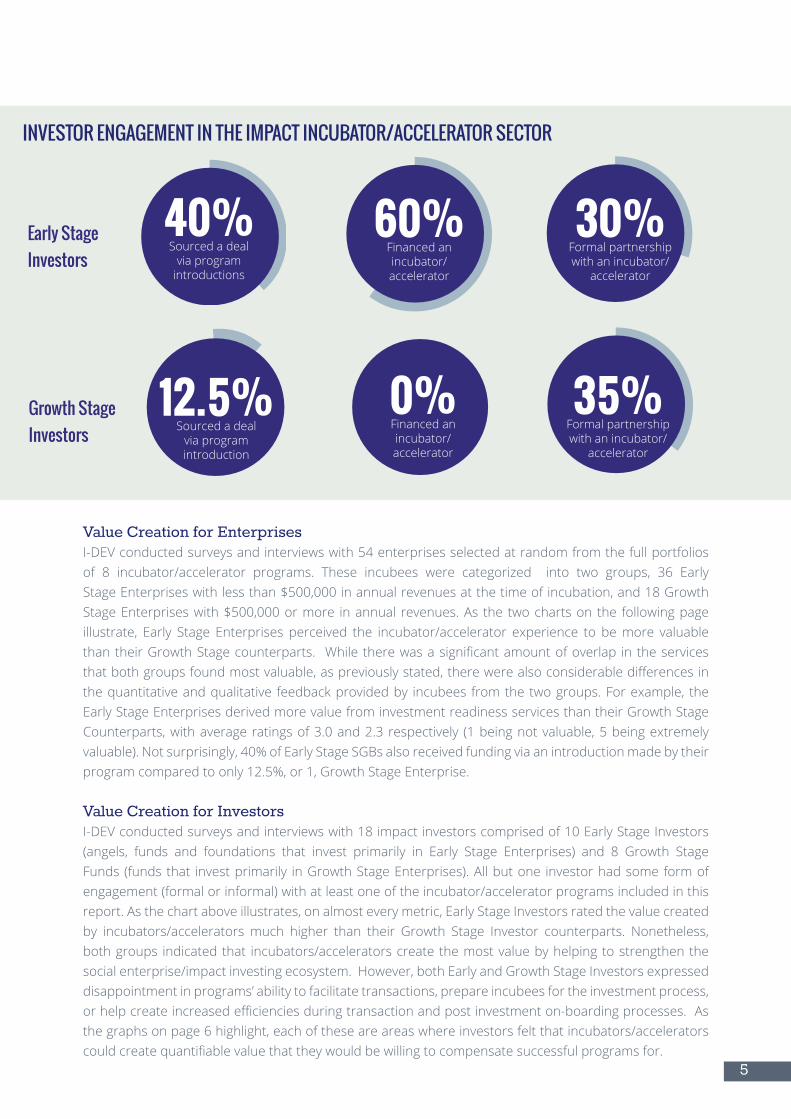
INVESTOR ENGAGEMENT IN THE IMPACT INCUBATOR/ACCELERATOR SECTOR
Value Creation for EnterprisesI-DEV conducted surveys and interviews with 54 enterprises selected at random from the full portfolios of 8 incubator/accelerator programs. These incubees were categorized into two groups, 36 Early Stage Enterprises with less than $500,000 in annual revenues at the time of incubation, and 18 Growth Stage Enterprises with $500,000 or more in annual revenues. As the two charts on the following page illustrate, Early Stage Enterprises perceived the incubator/accelerator experience to be more valuable thantheirGrowthStagecounterparts. Whiletherewasasignificantamountofoverlap intheservicesthatbothgroupsfoundmostvaluable,aspreviouslystated,therewerealsoconsiderabledifferencesinthe quantitative and qualitative feedback provided by incubees from the two groups. For example, the Early Stage Enterprises derived more value from investment readiness services than their Growth Stage Counterparts,withaverageratingsof3.0and2.3respectively (1beingnotvaluable,5beingextremelyvaluable).Notsurprisingly,40%ofEarlyStageSGBsalsoreceivedfundingviaanintroductionmadebytheirprogramcomparedtoonly12.5%,or1,GrowthStageEnterprise.
Value Creation for InvestorsI-DEV conducted surveys and interviews with 18 impact investors comprised of 10 Early Stage Investors (angels, funds and foundations that invest primarily in Early Stage Enterprises) and 8 Growth Stage Funds (funds that invest primarily in Growth Stage Enterprises). All but one investor had some form of engagement (formal or informal) with at least one of the incubator/accelerator programs included in this report. As the chart above illustrates, on almost every metric, Early Stage Investors rated the value created by incubators/accelerators much higher than their Growth Stage Investor counterparts. Nonetheless, both groups indicated that incubators/accelerators create the most value by helping to strengthen the social enterprise/impact investing ecosystem. However, both Early and Growth Stage Investors expressed disappointment in programs’ ability to facilitate transactions, prepare incubees for the investment process, orhelpcreateincreasedefficienciesduringtransactionandpostinvestmenton-boardingprocesses.Asthe graphs on page 6 highlight, each of these are areas where investors felt that incubators/accelerators couldcreatequantifiablevaluethattheywouldbewillingtocompensatesuccessfulprogramsfor.
40%Sourced a deal
via program introductions
6
ENTERPRISES: EARLY VS. GROWTH
Most Appealing Services (Pre-Program): Most Useful Services (Post-Program):
Early Stage Entrepreneurs’ Average Response Growth Stage Entrepreneurs’ Average Response
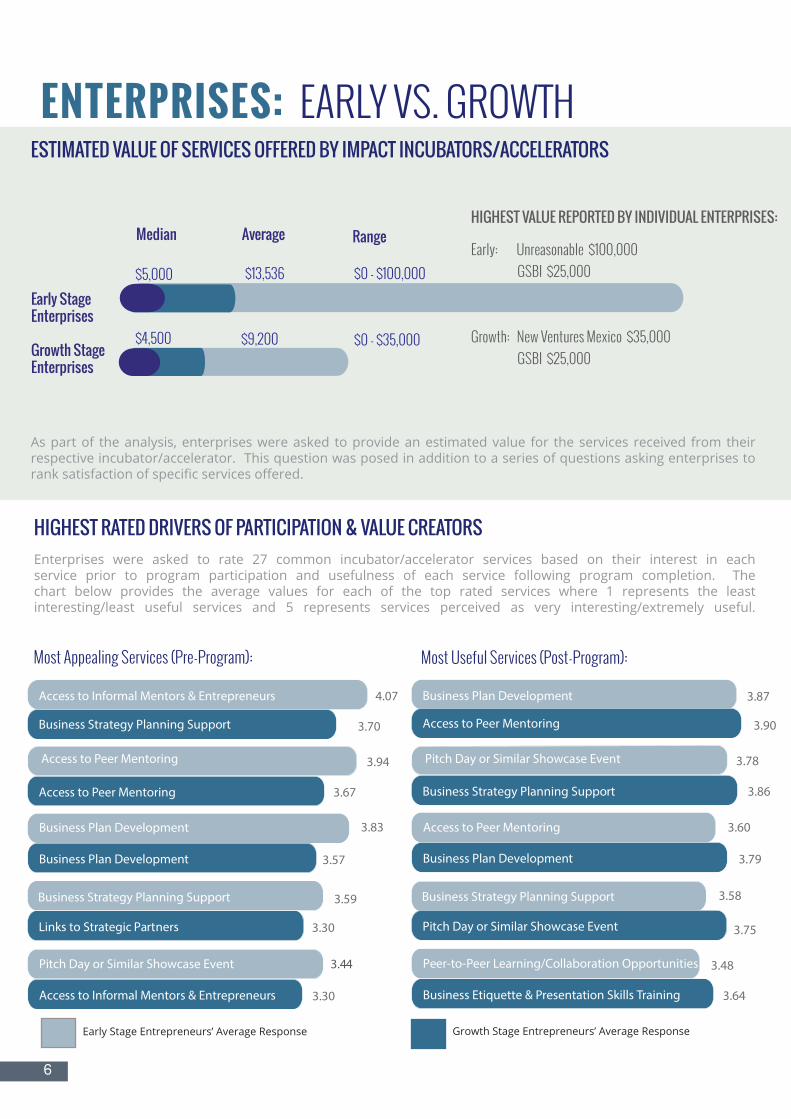
ESTIMATED VALUE OF SERVICES OFFERED BY IMPACT INCUBATORS/ACCELERATORS
As part of the analysis, enterprises were asked to provide an estimated value for the services received from their respective incubator/accelerator. This question was posed in addition to a series of questions asking enterprises to rank satisfaction of specific services offered.
HIGHEST RATED DRIVERS OF PARTICIPATION & VALUE CREATORS Enterprises were asked to rate 27 common incubator/accelerator services based on their interest in each service prior to program participation and usefulness of each service following program completion. The chart below provides the average values for each of the top rated services where 1 represents the least interesting/least useful services and 5 represents services perceived as very interesting/extremely useful.
Business Strategy Planning Support 3.58
Access to Informal Mentors & EntrepreneursBusiness Plan Development
Pitch Day or Similar Showcase Event
Peer-to-Peer Learning/Collaboration Opportunities
3.90Access to Peer Mentoring
3.86Business Strategy Planning Support
3.79Business Plan Development
3.75Pitch Day or Similar Showcase Event
3.64Business Etiquette & Presentation Skills Training
3.87
3.78
Access to Peer Mentoring 3.60
3.48
Business Plan Development
Business Strategy Planning Support
3.94
3.83
3.59
4.07Access to Informal Mentors & Entrepreneurs
Pitch Day or Similar Showcase Event 3.44
Access to Informal Mentors & Entrepreneurs
Access to Peer Mentoring
Pitch Day or Similar Showcase Event
3.70Business Strategy Planning Support
3.67Access to Peer Mentoring
3.57Business Plan Development
3.30Links to Strategic Partners
3.30Access to Informal Mentors & Entrepreneurs
Median
$0 - $100,000$13,536
$9,200
$5,000
$4,500 $0 - $35,000
Average Range
Early StageEnterprises
Growth StageEnterprises
HIGHEST VALUE REPORTED BY INDIVIDUAL ENTERPRISES:
Early: Unreasonable $100,000 GSBI $25,000
Growth: New Ventures Mexico $35,000 GSBI $25,000
7
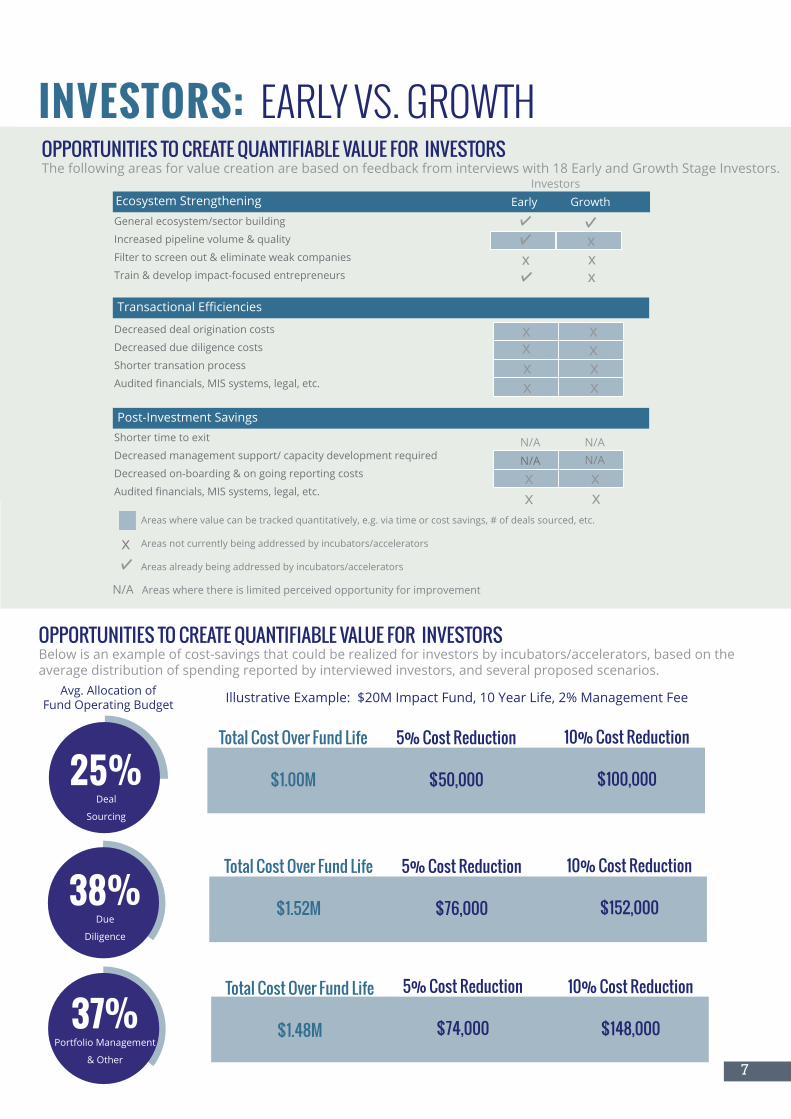
OPPORTUNITIES TO CREATE QUANTIFIABLE VALUE FOR INVESTORSThe following areas for value creation are based on feedback from interviews with 18 Early and Growth Stage Investors.
INVESTORS: EARLY VS. GROWTH
OPPORTUNITIES TO CREATE QUANTIFIABLE VALUE FOR INVESTORSBelow is an example of cost-savings that could be realized for investors by incubators/accelerators, based on the average distribution of spending reported by interviewed investors, and several proposed scenarios.
Avg. Allocation of Fund Operating Budget
38%Due
Diligence
37%Portfolio Management
& Other
25%Deal
Sourcing
Total Cost Over Fund Life
$1.00M
5% Cost Reduction
$50,000
10% Cost Reduction
$100,000
Total Cost Over Fund Life
$1.48M
5% Cost Reduction
$74,000
10% Cost Reduction
$148,000
Total Cost Over Fund Life
$1.52M
5% Cost Reduction
$76,000
10% Cost Reduction
$152,000
Illustrative Example: $20M Impact Fund, 10 Year Life, 2% Management Fee
Ecosystem Strengthening
General ecosystem/sector building
Increased pipeline volume & quality
Filter to screen out & eliminate weak companies
Train & develop impact-focused entrepreneurs
Decreased deal origination costs
Decreased due diligence costs
Shorter transation process
Audited financials, MIS systems, legal, etc.
Shorter time to exit
Decreased management support/ capacity development required
Decreased on-boarding & on going reporting costs
Audited financials, MIS systems, legal, etc.x xx
N/AN/A
Ecosystem Strengthening
Transactional Efficiencies
Post-Investment Savings
N/AN/A
x
x
x
Areas where value can be tracked quantitatively, e.g. via time or cost savings, # of deals sourced, etc.
Areas not currently being addressed by incubators/accelerators
Areas already being addressed by incubators/accelerators
Growth
x
Early
x x
Investors
x xxxx
xx
x
N/A Areas where there is limited perceived opportunity for improvement
8
ESTABLISHING A
FRAMEWORKIn order to measure the extent to which incubator/accelerator programs are creating value for their key stakeholders, we have developed the proposed framework (included in the appendix) to be used by the sector as a standardized tool for comparing average performance over time, across entire program portfolios. The proposed framework was designed after consulting numerous incubators/accelerators and target stakeholders, and is an initial version of an assessment tool that, once implemented, will help sector participants (SGBs, investors, and program funders) evaluate and compare the quantitative, as well as qualitative value created by these programs. The metrics in the framework have been broken down into three main components based on stakeholder group:
• SGBs or Enterprises that have participated in an incubator/accelerator program• Investors with informal/formal partnerships that have not invested in graduate incubees• Investors with informal/formal partnerships that have invested in graduate incubees
SGBs or Enterprises: The SGB component of the framework seeks to evaluate enterprise growth and performance over time, rational for program participation and satisfaction with the program’s services. To do this, the SGB component of the framework has been divided into 3 sections: 1) General Business Information,2)QuantitativeValueCreation,and3)QualitativeValueCreation.Selectquestionsfromeachsection should be completed by incubees upon application/entry into the program, upon graduation from the program, and for 5 (ideally) subsequent years after program completion. Post-program data collection is quantitative only to reduce the burden and logistics of data collection over the longer-term. Once the data for each program incubee is aggregated, the average values across any one incubator’s/accelerator’s entire portfolio should give an insightful view of the program’s key strengths, key weaknesses and the average performance across its alumni over time (overall portfolio performance). Investors: The investor component of the framework seeks to evaluate quantitative and qualitative value creation for investors in three buckets 1) Ecosystem support and strengthening (e.g. growing and strengtheningdealpipeline),2)Reductionincost/timeofatransaction(e.g.reduceddealsourcingorduediligence costs/time), and 3) Post investment performance, or reduction in cost/time of average portfolio company management (e.g. faster growing SGBs with less need for capacity development support). To ensure consistent feedback, the investor section of the framework should be completed on an annual or bi-annual basis (or after each cycle of the incubation/acceleration program) by investors that have formal/informal engagement with incubator/accelerator programs. The transaction related section of the framework should be completed by investors who have invested in a recent incubee (within 2 years of program completion) after each transaction closing. These metrics will help investors evaluate whichprogramsaregeneratingthemostamountofdealflowbystageofbusiness,whichprogramsarebest preparing their cohorts for the investment process/investment readiness, and which programs are helping to support the best performing incubees- all areas where investors have indicated a willingness to compensateprogramsforreal,quantifiablevaluecreation.
9
RESEARCH
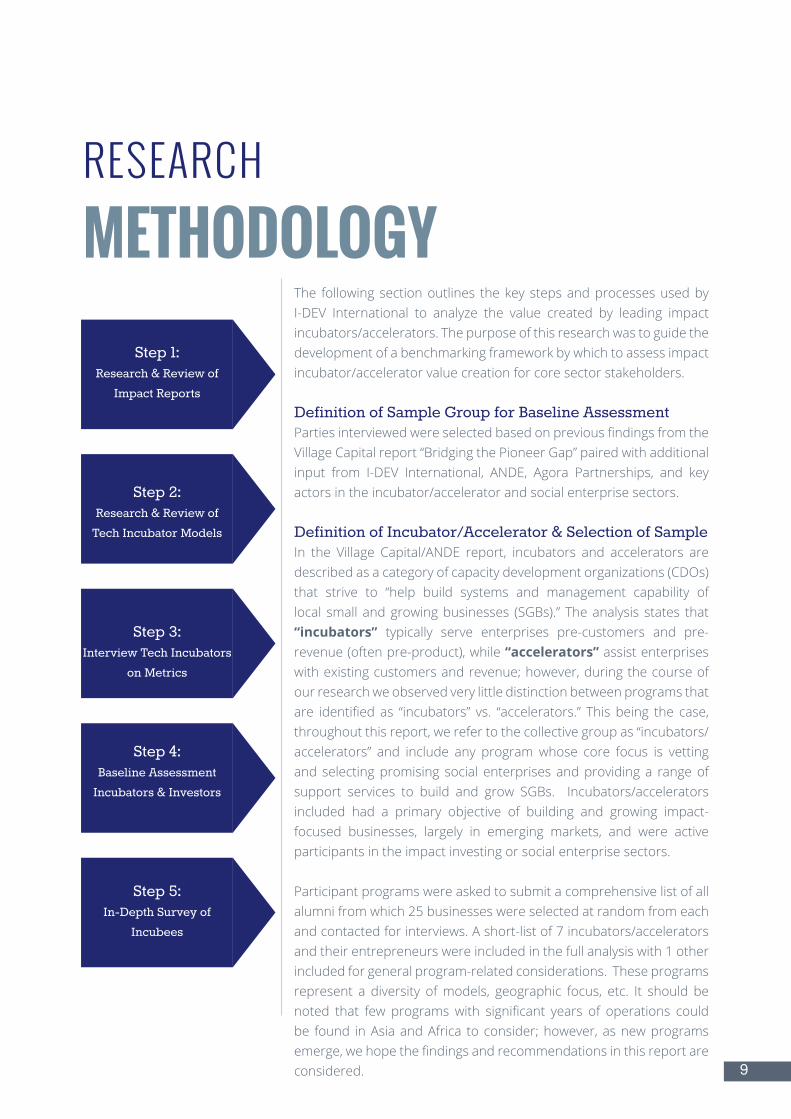
METHODOLOGY The following section outlines the key steps and processes used by I-DEV International to analyze the value created by leading impact incubators/accelerators. The purpose of this research was to guide the development of a benchmarking framework by which to assess impact incubator/accelerator value creation for core sector stakeholders.
Definition of Sample Group for Baseline Assessment PartiesinterviewedwereselectedbasedonpreviousfindingsfromtheVillageCapitalreport“BridgingthePioneerGap”pairedwithadditionalinput from I-DEV International, ANDE, Agora Partnerships, and key actors in the incubator/accelerator and social enterprise sectors.
Definition of Incubator/Accelerator & Selection of Sample In the Village Capital/ANDE report, incubators and accelerators aredescribedasacategoryofcapacitydevelopmentorganizations(CDOs)that strive to “help build systems and management capability oflocal small andgrowingbusinesses (SGBs).” Theanalysis states that“incubators” typically serve enterprises pre-customers and pre-revenue (often pre-product), while “accelerators” assist enterprises with existing customers and revenue; however, during the course of our research we observed very little distinction between programs that are identified as “incubators” vs. “accelerators.” This being the case,throughoutthisreport,werefertothecollectivegroupas“incubators/accelerators” and include any programwhose core focus is vettingand selecting promising social enterprises and providing a range of support services to build and grow SGBs. Incubators/accelerators included had a primary objective of building and growing impact-focused businesses, largely in emerging markets, and were active participants in the impact investing or social enterprise sectors.
Participant programs were asked to submit a comprehensive list of all alumni from which 25 businesses were selected at random from each and contacted for interviews. A short-list of 7 incubators/accelerators and their entrepreneurs were included in the full analysis with 1 other included for general program-related considerations. These programs represent a diversity of models, geographic focus, etc. It should be noted that few programswith significant years of operations couldbe found in Asia and Africa to consider; however, as new programs emerge,wehopethefindingsandrecommendationsinthisreportareconsidered.
Step 1:Research & Review of
Impact Reports
Step 2:Research & Review of
Tech Incubator Models
Step 3:Interview Tech Incubators
on Metrics
Step 4:Baseline Assessment
Incubators & Investors
Step 5:In-Depth Survey of
Incubees
10
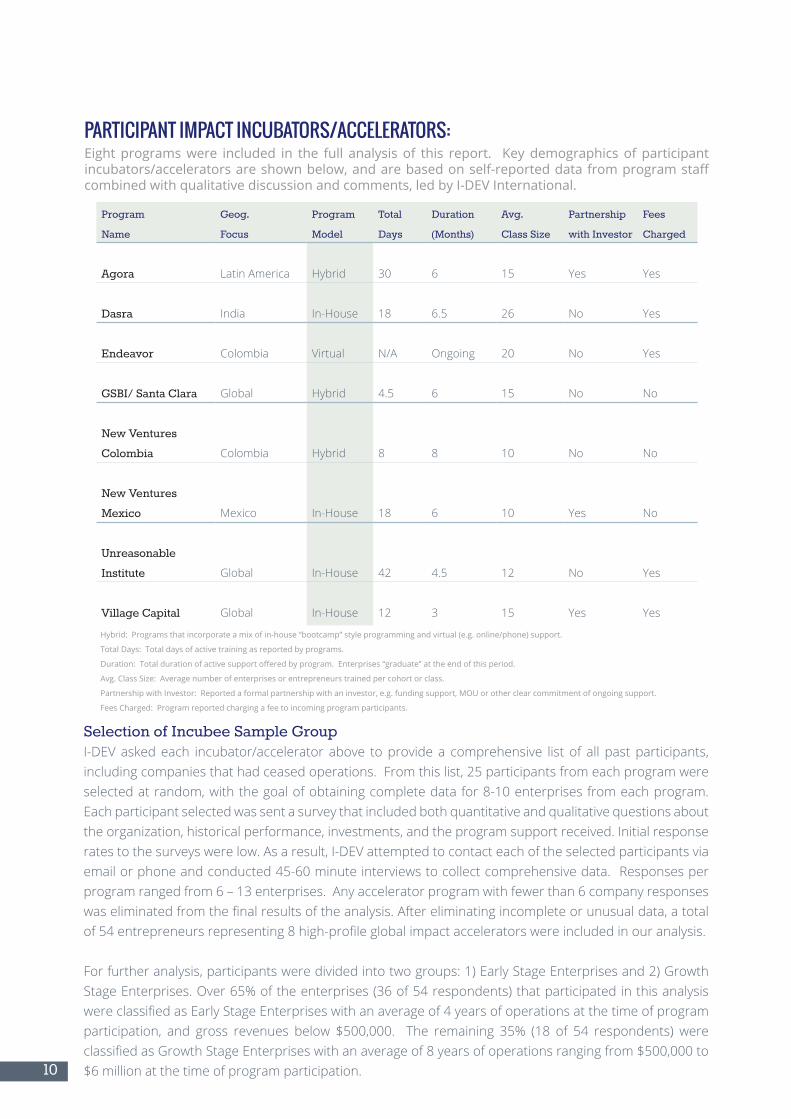
PARTICIPANT IMPACT INCUBATORS/ACCELERATORS:Eight programs were included in the full analysis of this report. Key demographics of participant incubators/accelerators are shown below, and are based on self-reported data from program staff combined with qualitative discussion and comments, led by I-DEV International.
Program
Name
Geog.
Focus
Program
Model
Total
Days
Duration
(Months)
Avg.
Class Size
Partnership
with Investor
Fees
Charged
Agora Latin America Hybrid 30 6 15 Yes Yes
Dasra India In-House 18 6.5 26 No Yes
Endeavor Colombia Virtual N/A Ongoing 20 No Yes
GSBI/ Santa Clara Global Hybrid 4.5 6 15 No No
New Ventures
Colombia Colombia Hybrid 8 8 10 No No
New Ventures
Mexico Mexico In-House 18 6 10 Yes No
Unreasonable
Institute Global In-House 42 4.5 12 No Yes
Village Capital Global In-House 12 3 15 Yes Yes
Selection of Incubee Sample GroupI-DEV asked each incubator/accelerator above to provide a comprehensive list of all past participants, including companies that had ceased operations. From this list, 25 participants from each program were selected at random, with the goal of obtaining complete data for 8-10 enterprises from each program. Each participant selected was sent a survey that included both quantitative and qualitative questions about the organization, historical performance, investments, and the program support received. Initial response rates to the surveys were low. As a result, I-DEV attempted to contact each of the selected participants via emailorphoneandconducted45-60minuteinterviewstocollectcomprehensivedata.Responsesperprogram ranged from 6 – 13 enterprises. Any accelerator program with fewer than 6 company responses waseliminatedfromthefinalresultsoftheanalysis.Aftereliminatingincompleteorunusualdata,atotalof54entrepreneursrepresenting8high-profileglobalimpactacceleratorswereincludedinouranalysis.
For further analysis, participants were divided into two groups: 1) Early Stage Enterprises and 2) Growth StageEnterprises.Over65%oftheenterprises(36of54respondents)thatparticipatedinthisanalysiswereclassifiedasEarlyStageEnterpriseswithanaverageof4yearsofoperationsatthetimeofprogramparticipation, and gross revenues below $500,000. The remaining 35% (18 of 54 respondents) wereclassifiedasGrowthStageEnterpriseswithanaverageof8yearsofoperationsrangingfrom$500,000to$6 million at the time of program participation.
Hybrid: Programs that incorporate a mix of in-house “bootcamp” style programming and virtual (e.g. online/phone) support.
Total Days: Total days of active training as reported by programs.
Duration: Total duration of active support offered by program. Enterprises “graduate” at the end of this period.
Avg. Class Size: Average number of enterprises or entrepreneurs trained per cohort or class.
Partnership with Investor: Reported a formal partnership with an investor, e.g. funding support, MOU or other clear commitment of ongoing support.
Fees Charged: Program reported charging a fee to incoming program participants.
11
Definition of Impact Investor & Selection of Sample Incubee GroupImpact Investor refers to any individual, fund or foundation that seeks to invest in social enterprises and socialimpact-orientedSGBs(Small,GrowingBusinesses).Impactinvestorsincludedinthefinalanalysiswereaskedtosubmitasurveywithconfidentialdata,aswellasparticipateinafollowoninterviewtoreviewresponses.Severalinvestorswereonlywillingtospeak“off-the-record”orprovideinformalinformationthat was included in some general comments and recommendations in this report and excluded from quantitative analysis.
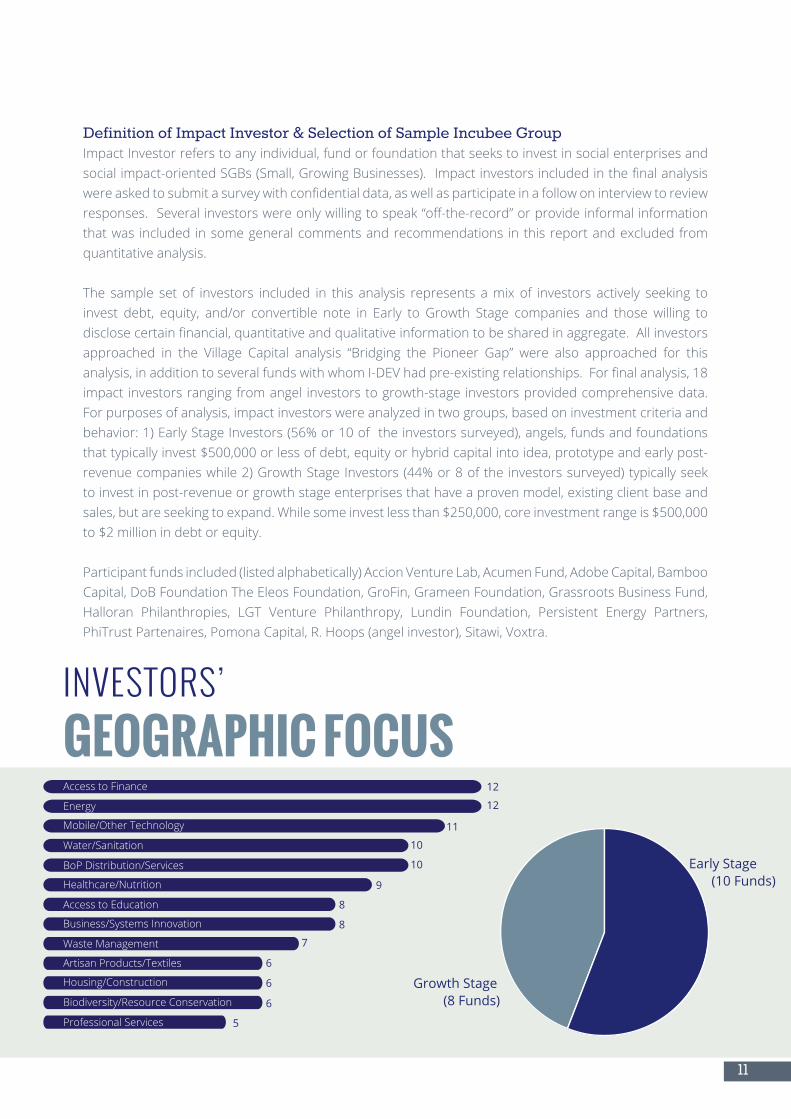
The sample set of investors included in this analysis represents a mix of investors actively seeking to invest debt, equity, and/or convertible note in Early to Growth Stage companies and those willing to disclosecertainfinancial,quantitativeandqualitativeinformationtobesharedinaggregate.Allinvestorsapproached in the Village Capital analysis “Bridging the Pioneer Gap” were also approached for thisanalysis,inadditiontoseveralfundswithwhomI-DEVhadpre-existingrelationships.Forfinalanalysis,18impact investors ranging from angel investors to growth-stage investors provided comprehensive data. For purposes of analysis, impact investors were analyzed in two groups, based on investment criteria and behavior:1)EarlyStageInvestors(56%or10oftheinvestorssurveyed),angels,fundsandfoundationsthat typically invest $500,000 or less of debt, equity or hybrid capital into idea, prototype and early post-revenuecompanieswhile2)GrowthStageInvestors(44%or8oftheinvestorssurveyed)typicallyseekto invest in post-revenue or growth stage enterprises that have a proven model, existing client base and sales, but are seeking to expand. While some invest less than $250,000, core investment range is $500,000 to $2 million in debt or equity.
Participantfundsincluded(listedalphabetically)AccionVentureLab,AcumenFund,AdobeCapital,BambooCapital,DoBFoundationTheEleosFoundation,GroFin,GrameenFoundation,GrassrootsBusinessFund,Halloran Philanthropies, LGT Venture Philanthropy, Lundin Foundation, Persistent Energy Partners, PhiTrustPartenaires,PomonaCapital,R.Hoops(angelinvestor),Sitawi,Voxtra.
Mobile/Other Technology
Water/Sanitation
BoP Distribution/Services
Healthcare/Nutrition
Access to Education
Business/Systems Innovation
Artisan Products/Textiles
Housing/Construction
Biodiversity/ResourceConservation
Professional Services
INVESTORS’
GEOGRAPHIC FOCUS
Early Stage(10 Funds)
Growth Stage(8 Funds)
12
12
11
10
10
9
8
8
7
6
6
6
5
Access to Finance
Energy
Waste Management
12
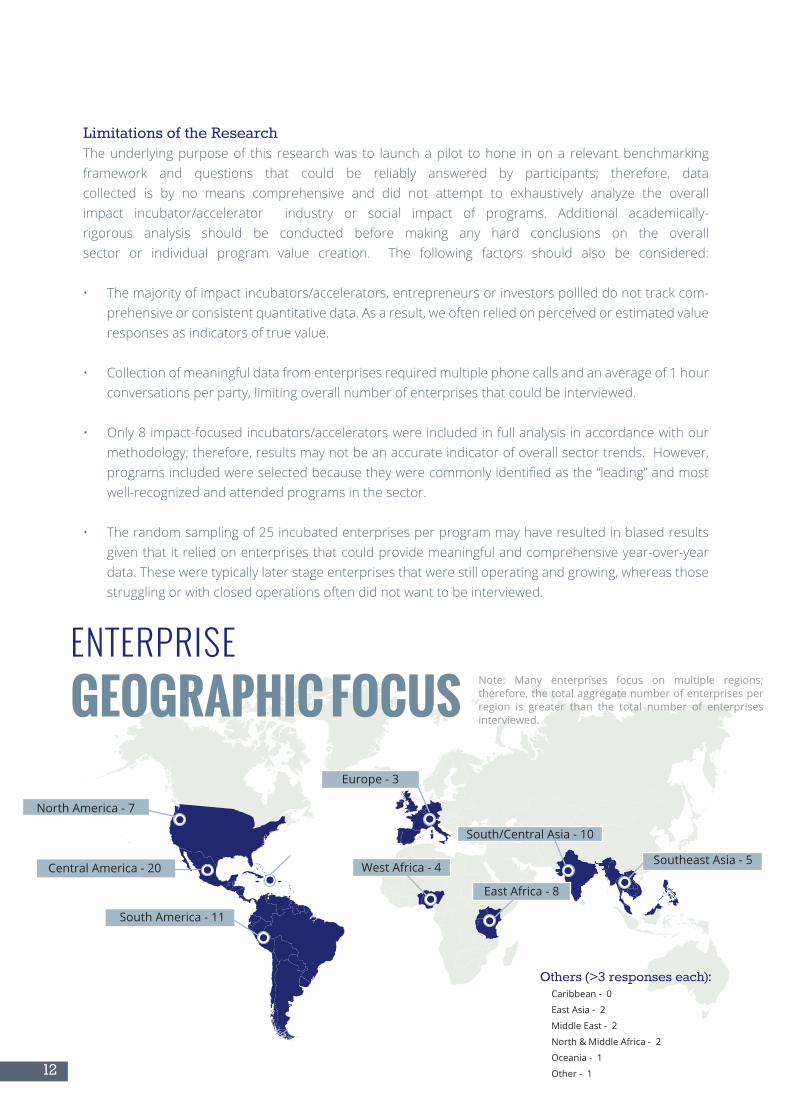
Limitations of the ResearchThe underlying purpose of this research was to launch a pilot to hone in on a relevant benchmarking framework and questions that could be reliably answered by participants; therefore, data collected is by no means comprehensive and did not attempt to exhaustively analyze the overall impact incubator/accelerator industry or social impact of programs. Additional academically-rigorous analysis should be conducted before making any hard conclusions on the overall sector or individual program value creation. The following factors should also be considered:
• The majority of impact incubators/accelerators, entrepreneurs or investors pollled do not track com-prehensive or consistent quantitative data. As a result, we often relied on perceived or estimated value responses as indicators of true value.
• Collectionofmeaningfuldatafromenterprisesrequiredmultiplephonecallsandanaverageof1hourconversations per party, limiting overall number of enterprises that could be interviewed.
• Only 8 impact-focused incubators/accelerators were included in full analysis in accordance with our methodology; therefore, results may not be an accurate indicator of overall sector trends. However, programsincludedwereselectedbecausetheywerecommonlyidentifiedasthe“leading”andmostwell-recognized and attended programs in the sector.
• The random sampling of 25 incubated enterprises per program may have resulted in biased results given that it relied on enterprises that could provide meaningful and comprehensive year-over-year data. These were typically later stage enterprises that were still operating and growing, whereas those struggling or with closed operations often did not want to be interviewed.
East Africa - 8
ENTERPRISE
GEOGRAPHIC FOCUSEurope - 3
South/Central Asia - 10
Southeast Asia - 5West Africa - 4Central America - 20
South America - 11
North America - 7
Others (>3 responses each):Caribbean - 0
East Asia - 2
Middle East - 2
North & Middle Africa - 2
Oceania - 1
Other - 1
Note: Many enterprises focus on multiple regions; therefore, the total aggregate number of enterprises per region is greater than the total number of enterprises interviewed.
Entry Statisticsfor Participants
100%Growth Stage
SGBs
40%Early Stage
SGBs
95%Growth
Stage SGBs
100%Growth
Stage SGBs
Post-Revenue Upon Entry
Enterprise was the Primary Source of
Income for Management
Profitable Upon Entry
81%Early Stage
SGBs
89%Early Stage
SGBs
13
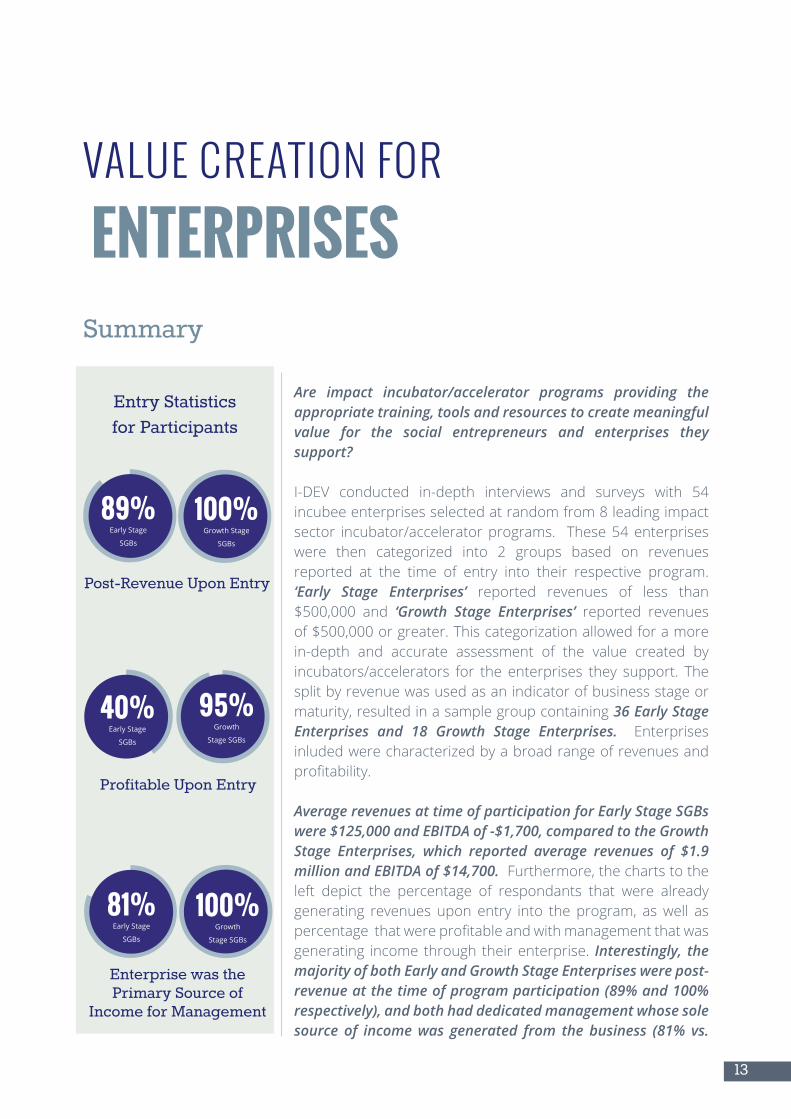
Are impact incubator/accelerator programs providing the appropriate training, tools and resources to create meaningful value for the social entrepreneurs and enterprises they support?
I-DEV conducted in-depth interviews and surveys with 54 incubee enterprises selected at random from 8 leading impact sector incubator/accelerator programs. These 54 enterprises were then categorized into 2 groups based on revenues reported at the time of entry into their respective program. ‘Early Stage Enterprises’ reported revenues of less than $500,000 and ‘Growth Stage Enterprises’ reported revenues of $500,000 or greater. This categorization allowed for a more in-depth and accurate assessment of the value created by incubators/accelerators for the enterprises they support. The split by revenue was used as an indicator of business stage or maturity, resulted in a sample group containing 36 Early Stage Enterprises and 18 Growth Stage Enterprises. Enterprises inluded were characterized by a broad range of revenues and profitability.
Average revenues at time of participation for Early Stage SGBs were $125,000 and EBITDA of -$1,700, compared to the Growth Stage Enterprises, which reported average revenues of $1.9 million and EBITDA of $14,700. Furthermore, the charts to the left depict the percentage of respondants that were already generating revenues upon entry into the program, as well as percentagethatwereprofitableandwithmanagementthatwasgenerating income through their enterprise. Interestingly, the majority of both Early and Growth Stage Enterprises were post-revenue at the time of program participation (89% and 100% respectively), and both had dedicated management whose sole source of income was generated from the business (81% vs.
VALUE CREATION FOR
ENTERPRISESSummary
14
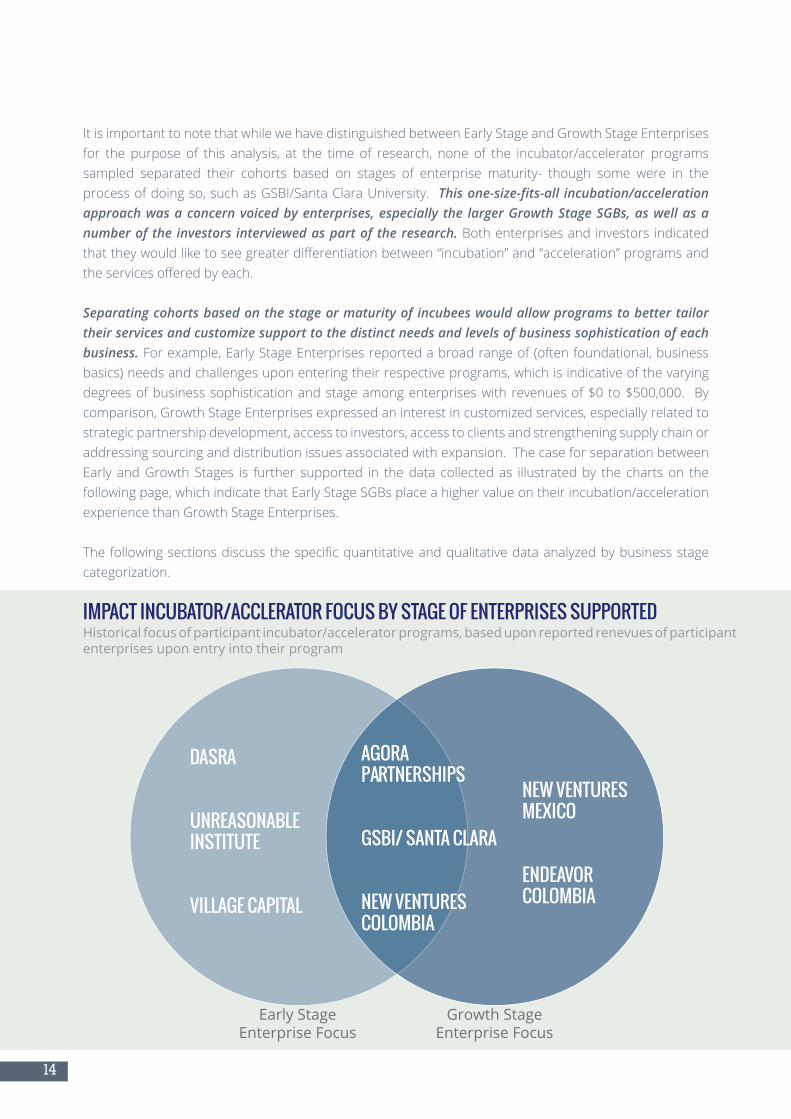
It is important to note that while we have distinguished between Early Stage and Growth Stage Enterprises for the purpose of this analysis, at the time of research, none of the incubator/accelerator programs sampled separated their cohorts based on stages of enterprise maturity- though some were in the processofdoingso,suchasGSBI/SantaClaraUniversity. This one-size-fits-all incubation/acceleration approach was a concern voiced by enterprises, especially the larger Growth Stage SGBs, as well as a number of the investors interviewed as part of the research. Both enterprises and investors indicated thattheywouldliketoseegreaterdifferentiationbetween“incubation”and“acceleration”programsandtheservicesofferedbyeach.
Separating cohorts based on the stage or maturity of incubees would allow programs to better tailor their services and customize support to the distinct needs and levels of business sophistication of each business. For example, Early Stage Enterprises reported a broad range of (often foundational, business basics) needs and challenges upon entering their respective programs, which is indicative of the varying degrees of business sophistication and stage among enterprises with revenues of $0 to $500,000. By comparison, Growth Stage Enterprises expressed an interest in customized services, especially related to strategic partnership development, access to investors, access to clients and strengthening supply chain or addressing sourcing and distribution issues associated with expansion. The case for separation between Early and Growth Stages is further supported in the data collected as illustrated by the charts on the following page, which indicate that Early Stage SGBs place a higher value on their incubation/acceleration experience than Growth Stage Enterprises.
Thefollowingsectionsdiscussthespecificquantitativeandqualitativedataanalyzedbybusinessstagecategorization.
IMPACT INCUBATOR/ACCLERATOR FOCUS BY STAGE OF ENTERPRISES SUPPORTEDHistorical focus of participant incubator/accelerator programs, based upon reported renevues of participant enterprises upon entry into their program
DASRA
UNREASONABLEINSTITUTE
VILLAGE CAPITAL
AGORAPARTNERSHIPS
GSBI/ SANTA CLARA
NEW VENTURES COLOMBIA
NEW VENTURES MEXICO
ENDEAVOR COLOMBIA
Early Stage Enterprise Focus
Growth Stage Enterprise Focus
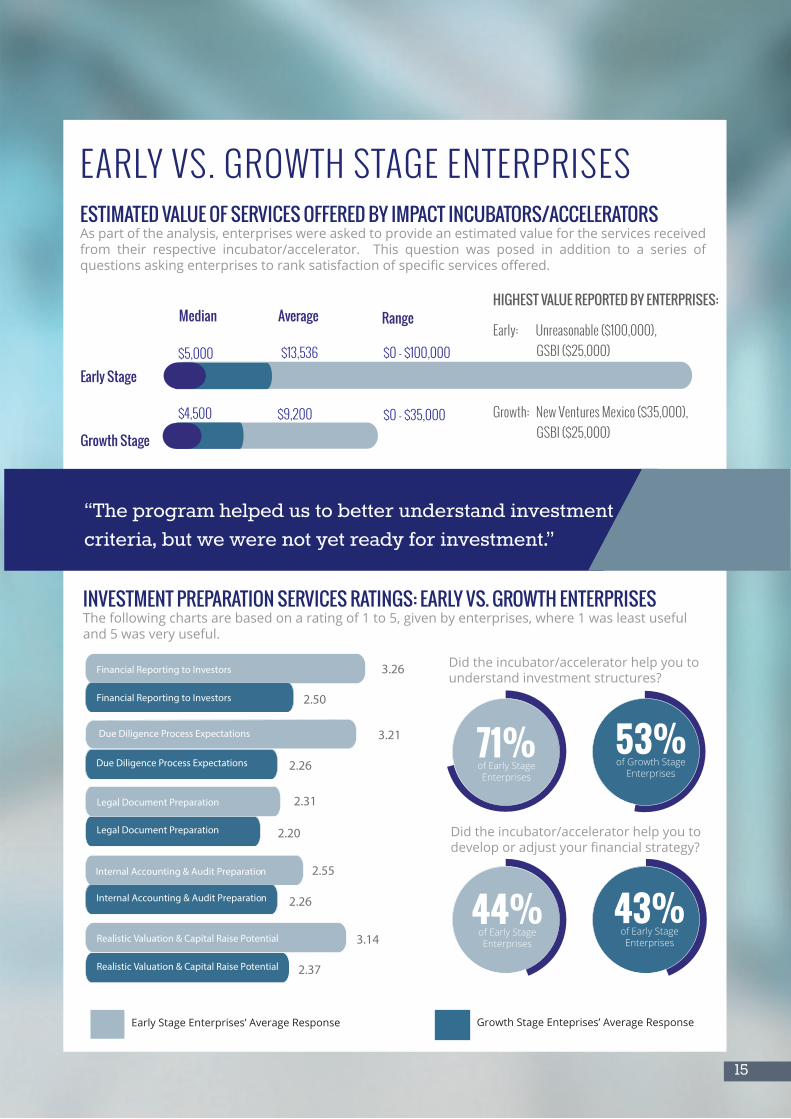
ESTIMATED VALUE OF SERVICES OFFERED BY IMPACT INCUBATORS/ACCELERATORSAs part of the analysis, enterprises were asked to provide an estimated value for the services received from their respective incubator/accelerator. This question was posed in addition to a series of questions asking enterprises to rank satisfaction of specific services offered.
INVESTMENT PREPARATION SERVICES RATINGS: EARLY VS. GROWTH ENTERPRISES The following charts are based on a rating of 1 to 5, given by enterprises, where 1 was least useful and 5 was very useful.
Median
$0 - $100,000$13,536
$9,200
$5,000
$4,500 $0 - $35,000
Average Range
Early Stage
Growth Stage
HIGHEST VALUE REPORTED BY ENTERPRISES:
Early: Unreasonable ($100,000), GSBI ($25,000)
Growth: New Ventures Mexico ($35,000), GSBI ($25,000)
Internal Accounting & Audit Preparation 2.55
Access to Informal Mentors & Entrepreneurs
Due Diligence Process Expectations
Realistic Valuation & Capital Raise Potential
2.50
2.26Due Diligence Process Expectations
2.20Legal Document Preparation
2.26Internal Accounting & Audit Preparation
2.37Realistic Valuation & Capital Raise Potential
3.26
3.21
Legal Document Preparation 2.31
3.14
Financial Reporting to Investors
Financial Reporting to Investors
Did the incubator/accelerator help you to understand investment structures?
15
EARLY VS. GROWTH STAGE ENTERPRISES
“The program helped us to better understand investment criteria, but we were not yet ready for investment.”
Early Stage Enterprises’ Average Response Growth Stage Enteprises’ Average Response
44%of Early Stage Enterprises
43%of Early Stage Enterprises
71%of Early Stage Enterprises
53%of Growth Stage
Enterprises
16
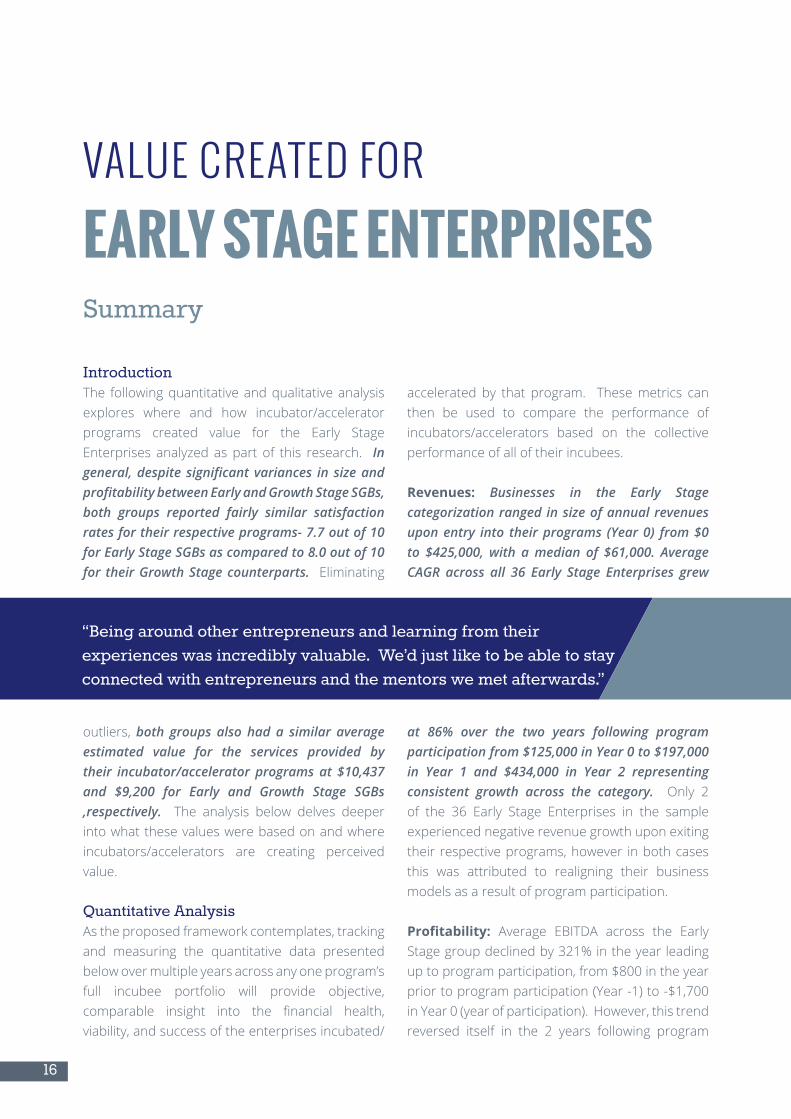
VALUE CREATED FOR
EARLY STAGE ENTERPRISES Summary
IntroductionThe following quantitative and qualitative analysis explores where and how incubator/accelerator programs created value for the Early Stage Enterprises analyzed as part of this research. In general, despite significant variances in size and profitability between Early and Growth Stage SGBs, both groups reported fairly similar satisfaction rates for their respective programs- 7.7 out of 10 for Early Stage SGBs as compared to 8.0 out of 10 for their Growth Stage counterparts. Eliminating
outliers, both groups also had a similar average estimated value for the services provided by their incubator/accelerator programs at $10,437 and $9,200 for Early and Growth Stage SGBs ,respectively. The analysis below delves deeper into what these values were based on and where incubators/accelerators are creating perceived value.
Quantitative AnalysisAs the proposed framework contemplates, tracking and measuring the quantitative data presented below over multiple years across any one program’s full incubee portfolio will provide objective, comparable insight into the financial health,viability, and success of the enterprises incubated/
accelerated by that program. These metrics can then be used to compare the performance of incubators/accelerators based on the collective performance of all of their incubees.
Revenues: Businesses in the Early Stage categorization ranged in size of annual revenues upon entry into their programs (Year 0) from $0 to $425,000, with a median of $61,000. Average CAGR across all 36 Early Stage Enterprises grew
at 86% over the two years following program participation from $125,000 in Year 0 to $197,000 in Year 1 and $434,000 in Year 2 representing consistent growth across the category. Only 2 of the 36 Early Stage Enterprises in the sample experienced negative revenue growth upon exiting their respective programs, however in both cases this was attributed to realigning their business models as a result of program participation.
Profitability: Average EBITDA across the Early Stagegroupdeclinedby321%intheyearleadingup to program participation, from $800 in the year prior to program participation (Year -1) to -$1,700 in Year 0 (year of participation). However, this trend reversed itself in the 2 years following program
“Being around other entrepreneurs and learning from their experiences was incredibly valuable. We’d just like to be able to stay connected with entrepreneurs and the mentors we met afterwards.”
EARLY STAGE ENTERPRISES: ACCESS TO CAPITAL THROUGH AN INCUBATOR/ACCELERATOR
17
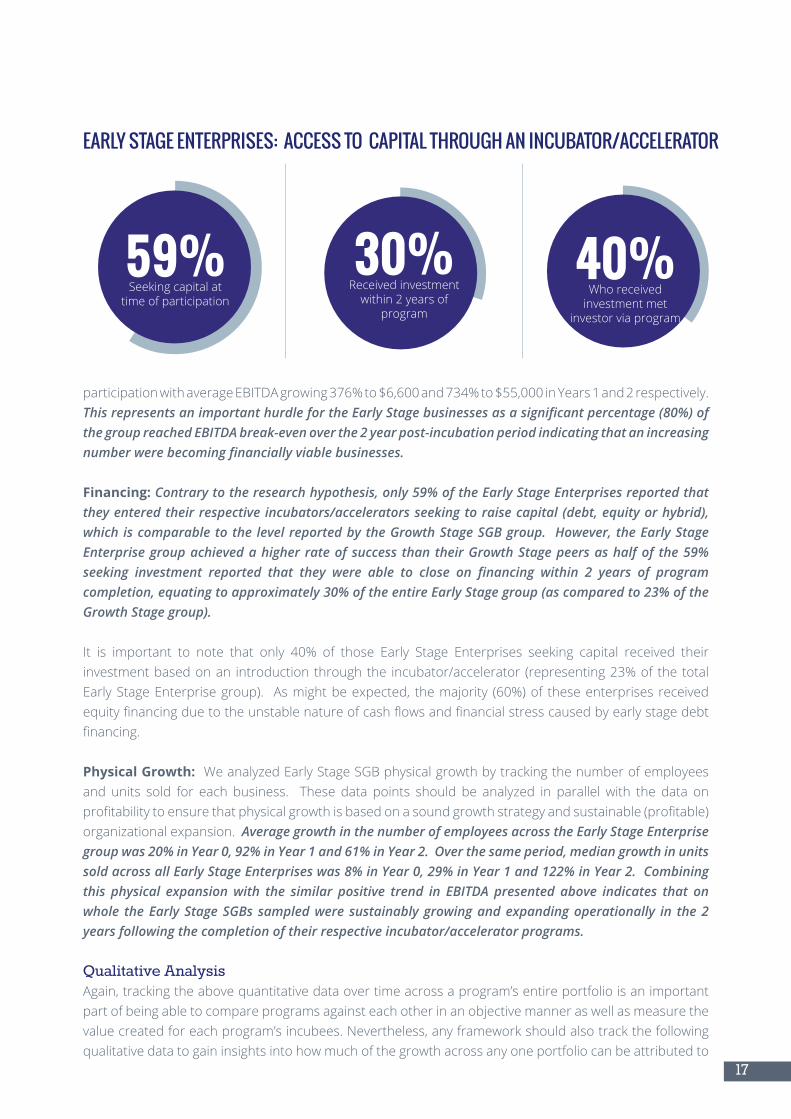
participationwithaverageEBITDAgrowing376%to$6,600and734%to$55,000inYears1and2respectively.This represents an important hurdle for the Early Stage businesses as a significant percentage (80%) of the group reached EBITDA break-even over the 2 year post-incubation period indicating that an increasing number were becoming financially viable businesses.
Financing: Contrary to the research hypothesis, only 59% of the Early Stage Enterprises reported that they entered their respective incubators/accelerators seeking to raise capital (debt, equity or hybrid), which is comparable to the level reported by the Growth Stage SGB group. However, the Early Stage Enterprise group achieved a higher rate of success than their Growth Stage peers as half of the 59% seeking investment reported that they were able to close on financing within 2 years of program completion, equating to approximately 30% of the entire Early Stage group (as compared to 23% of the Growth Stage group).
It is important to note that only 40% of those Early Stage Enterprises seeking capital received theirinvestmentbasedonan introductionthroughthe incubator/accelerator (representing23%of thetotalEarlyStageEnterprisegroup). Asmightbeexpected, themajority (60%)of theseenterprisesreceivedequityfinancingduetotheunstablenatureofcashflowsandfinancialstresscausedbyearlystagedebtfinancing.
Physical Growth: We analyzed Early Stage SGB physical growth by tracking the number of employees and units sold for each business. These data points should be analyzed in parallel with the data on profitabilitytoensurethatphysicalgrowthisbasedonasoundgrowthstrategyandsustainable(profitable)organizational expansion. Average growth in the number of employees across the Early Stage Enterprise group was 20% in Year 0, 92% in Year 1 and 61% in Year 2. Over the same period, median growth in units sold across all Early Stage Enterprises was 8% in Year 0, 29% in Year 1 and 122% in Year 2. Combining this physical expansion with the similar positive trend in EBITDA presented above indicates that on whole the Early Stage SGBs sampled were sustainably growing and expanding operationally in the 2 years following the completion of their respective incubator/accelerator programs.
Qualitative Analysis Again, tracking the above quantitative data over time across a program’s entire portfolio is an important part of being able to compare programs against each other in an objective manner as well as measure the value created for each program’s incubees. Nevertheless, any framework should also track the following qualitative data to gain insights into how much of the growth across any one portfolio can be attributed to
40%Who received
investment met investor via program
59%Seeking capital at
time of participation
30%Receivedinvestment
within 2 years ofprogram
LOWEST RATED SERVCES BY EARLY STAGE ENTERPRISES
Rated Most Interesting & Most Useful Rated Least Interesting or Least Useful
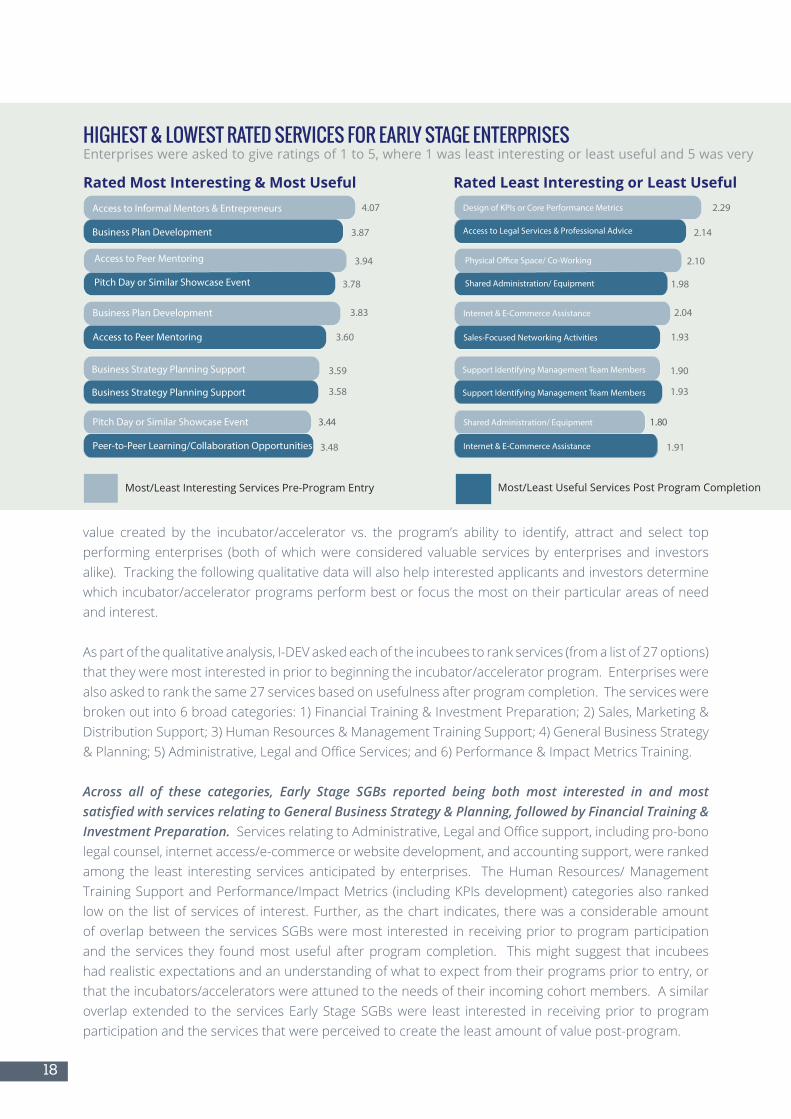
HIGHEST & LOWEST RATED SERVICES FOR EARLY STAGE ENTERPRISESEnterprises were asked to give ratings of 1 to 5, where 1 was least interesting or least useful and 5 was very
Most/Least Interesting Services Pre-Program Entry Most/Least Useful Services Post Program Completion
Internet & E-Commerce Assistance
Support Identifying Management Team Members
2.10
2.04
1.90
2.29
Pitch Day or Similar Showcase Event 1.80
Design of KPIs or Core Performance Metrics
Shared Administration/ Equipment
Support Identifying Management Team Members 1.93
Access to Legal Services & Professional Advice
Shared Administration/ Equipment
Internet & E-Commerce Assistance
2.14
1.98
Sales-Focused Networking Activities 1.93
1.91
Business Plan Development
Business Strategy Planning Support
3.94
3.83
3.59
4.07
Pitch Day or Similar Showcase Event 3.44
Access to Informal Mentors & Entrepreneurs
Access to Peer Mentoring
Pitch Day or Similar Showcase Event
Business Strategy Planning Support 3.58
Business Plan Development
Pitch Day or Similar Showcase Event
Peer-to-Peer Learning/Collaboration Opportunities
3.87
3.78
Access to Peer Mentoring 3.60
3.48
18
value created by the incubator/accelerator vs. the program’s ability to identify, attract and select top performing enterprises (both of which were considered valuable services by enterprises and investors alike). Tracking the following qualitative data will also help interested applicants and investors determine which incubator/accelerator programs perform best or focus the most on their particular areas of need and interest.
As part of the qualitative analysis, I-DEV asked each of the incubees to rank services (from a list of 27 options) that they were most interested in prior to beginning the incubator/accelerator program. Enterprises were also asked to rank the same 27 services based on usefulness after program completion. The services were broken out into 6 broad categories: 1) Financial Training & Investment Preparation; 2) Sales, Marketing & DistributionSupport;3)HumanResources&ManagementTrainingSupport;4)GeneralBusinessStrategy&Planning;5)Administrative,LegalandOfficeServices;and6)Performance&ImpactMetricsTraining.
Across all of these categories, Early Stage SGBs reported being both most interested in and most satisfied with services relating to General Business Strategy & Planning, followed by Financial Training & Investment Preparation.ServicesrelatingtoAdministrative,LegalandOfficesupport,includingpro-bonolegal counsel, internet access/e-commerce or website development, and accounting support, were ranked among the least interesting servicesanticipatedbyenterprises. TheHumanResources/ManagementTraining Support and Performance/Impact Metrics (including KPIs development) categories also ranked low on the list of services of interest. Further, as the chart indicates, there was a considerable amount of overlap between the services SGBs were most interested in receiving prior to program participation and the services they found most useful after program completion. This might suggest that incubees had realistic expectations and an understanding of what to expect from their programs prior to entry, or that the incubators/accelerators were attuned to the needs of their incoming cohort members. A similar overlap extended to the services Early Stage SGBs were least interested in receiving prior to program participation and the services that were perceived to create the least amount of value post-program.
Rated Least Interesting or Least Useful
19
Someoverlapmayalsobeattributedtoparticipants’ focusandgreatereffort inareasofcore interest,resultinginaself-fulfillingprophecy.
Furthermore,I-DEVaskedincubeesaseriesofquestionsspecificallyrelatedtotheprogram’sinvestmentreadiness and investment process preparation services. Within the Early Stage enterprise group, value-created and quality of investment readiness preparation was mixed. In general, ratings on value created pertaining to investment readiness and investment process preparation were in line with the relatively low number of investments that were facilitated by most incubators/accelerators. Nonetheless, as the chart illustrates on page 15, Early Stage SGBs ranked the quality of investment readiness services provided by their programs significantly higher than their Growth Stage peers from the same programs. Further analysis and multi-year data across full incubee portfolios is needed to more accurately assess true causality and to draw concrete conclusions.
20
VALUE CREATED FOR
GROWTH STAGE ENTERPRISESSummary
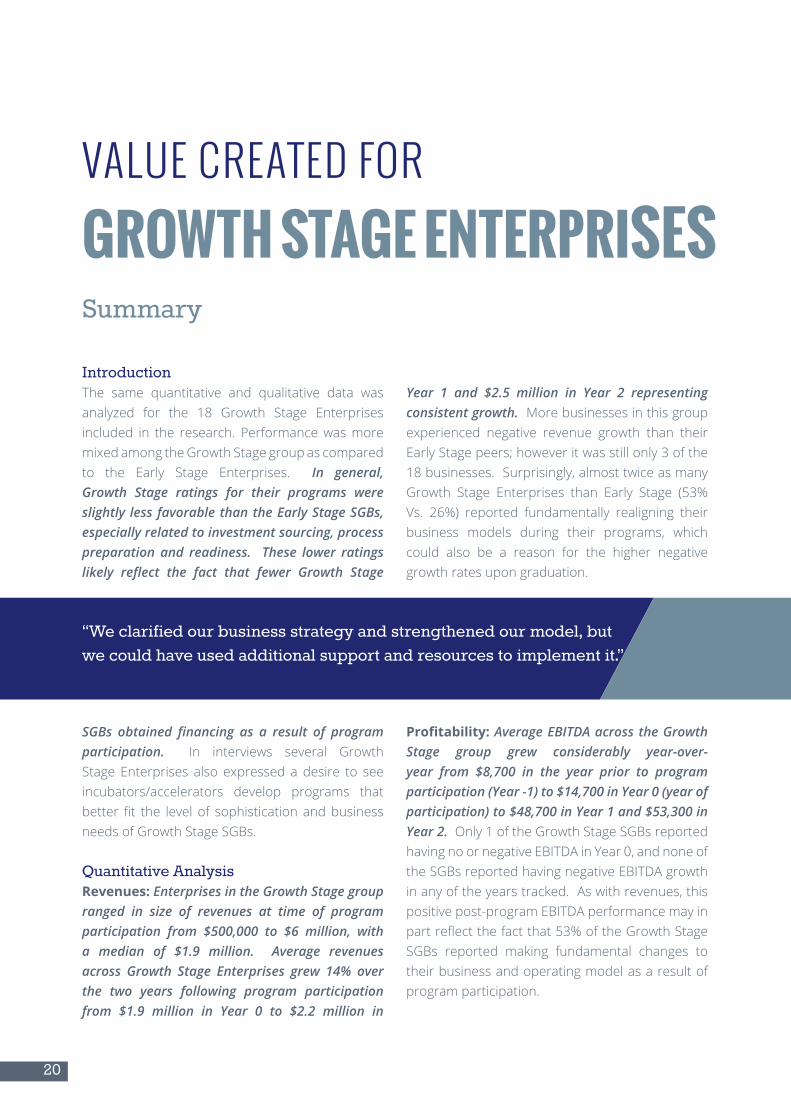
IntroductionThe same quantitative and qualitative data was analyzed for the 18 Growth Stage Enterprises included in the research. Performance was more mixed among the Growth Stage group as compared to the Early Stage Enterprises. In general, Growth Stage ratings for their programs were slightly less favorable than the Early Stage SGBs, especially related to investment sourcing, process preparation and readiness. These lower ratings likely reflect the fact that fewer Growth Stage
SGBs obtained financing as a result of program participation. In interviews several Growth Stage Enterprises also expressed a desire to see incubators/accelerators develop programs that better fit the level of sophistication andbusinessneeds of Growth Stage SGBs.
Quantitative Analysis Revenues: Enterprises in the Growth Stage group ranged in size of revenues at time of program participation from $500,000 to $6 million, with a median of $1.9 million. Average revenues across Growth Stage Enterprises grew 14% over the two years following program participation from $1.9 million in Year 0 to $2.2 million in
Year 1 and $2.5 million in Year 2 representing consistent growth. More businesses in this group experienced negative revenue growth than their Early Stage peers; however it was still only 3 of the 18 businesses. Surprisingly, almost twice as many Growth Stage Enterprises than Early Stage (53%Vs. 26%) reported fundamentally realigning theirbusiness models during their programs, which could also be a reason for the higher negative growth rates upon graduation.
Profitability: Average EBITDA across the Growth Stage group grew considerably year-over-year from $8,700 in the year prior to program participation (Year -1) to $14,700 in Year 0 (year of participation) to $48,700 in Year 1 and $53,300 in Year 2. Only 1 of the Growth Stage SGBs reported having no or negative EBITDA in Year 0, and none of the SGBs reported having negative EBITDA growth in any of the years tracked. As with revenues, this positive post-program EBITDA performance may in partreflectthefactthat53%oftheGrowthStageSGBs reported making fundamental changes to their business and operating model as a result of program participation.
“We clarified our business strategy and strengthened our model, but we could have used additional support and resources to implement it.”
GROWTH STAGE ENTERPRISE: ACCESS TO CAPITAL THROUGH AN INCUBATOR/ACCELERATOR
21
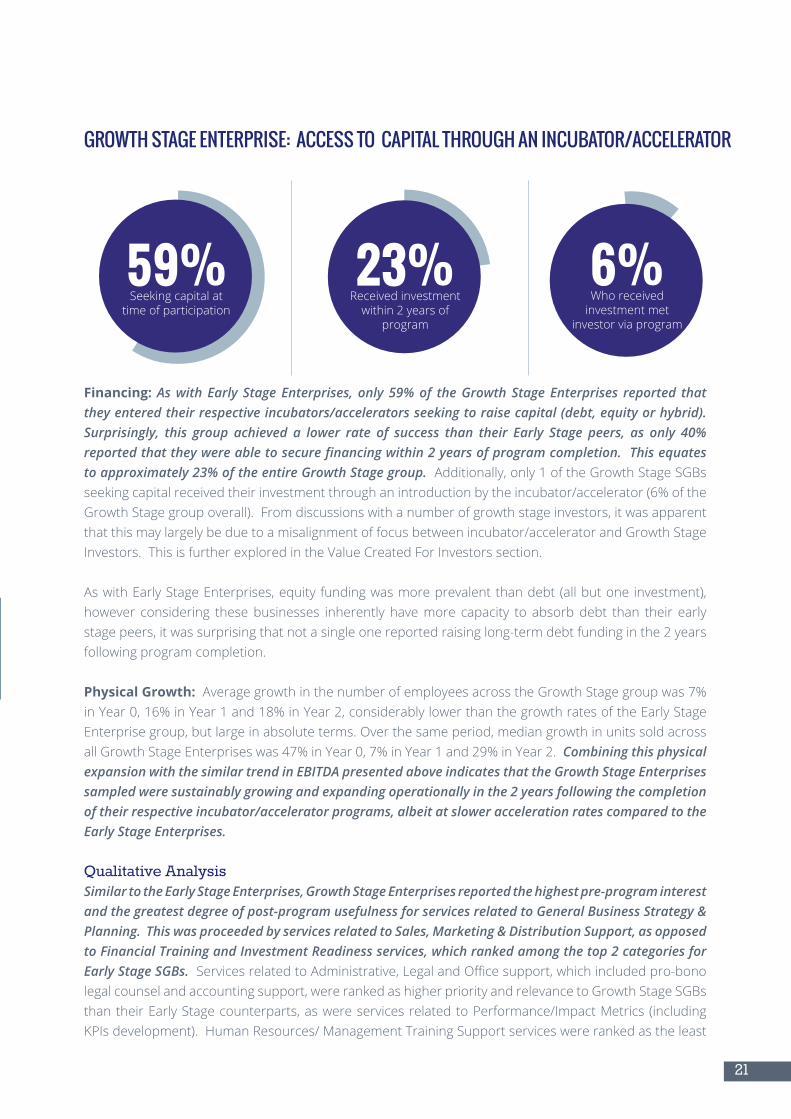
Financing: As with Early Stage Enterprises, only 59% of the Growth Stage Enterprises reported that they entered their respective incubators/accelerators seeking to raise capital (debt, equity or hybrid). Surprisingly, this group achieved a lower rate of success than their Early Stage peers, as only 40% reported that they were able to secure financing within 2 years of program completion. This equates to approximately 23% of the entire Growth Stage group. Additionally, only 1 of the Growth Stage SGBs seekingcapitalreceivedtheirinvestmentthroughanintroductionbytheincubator/accelerator(6%oftheGrowth Stage group overall). From discussions with a number of growth stage investors, it was apparent that this may largely be due to a misalignment of focus between incubator/accelerator and Growth Stage Investors.ThisisfurtherexploredintheValueCreatedForInvestorssection.
As with Early Stage Enterprises, equity funding was more prevalent than debt (all but one investment), however considering these businesses inherently have more capacity to absorb debt than their early stage peers, it was surprising that not a single one reported raising long-term debt funding in the 2 years following program completion.
Physical Growth: AveragegrowthinthenumberofemployeesacrosstheGrowthStagegroupwas7%inYear0,16%inYear1and18%inYear2,considerablylowerthanthegrowthratesoftheEarlyStageEnterprise group, but large in absolute terms. Over the same period, median growth in units sold across allGrowthStageEnterpriseswas47%inYear0,7%inYear1and29%inYear2.Combining this physical expansion with the similar trend in EBITDA presented above indicates that the Growth Stage Enterprises sampled were sustainably growing and expanding operationally in the 2 years following the completion of their respective incubator/accelerator programs, albeit at slower acceleration rates compared to the Early Stage Enterprises.
Qualitative Analysis Similar to the Early Stage Enterprises, Growth Stage Enterprises reported the highest pre-program interest and the greatest degree of post-program usefulness for services related to General Business Strategy & Planning. This was proceeded by services related to Sales, Marketing & Distribution Support, as opposed to Financial Training and Investment Readiness services, which ranked among the top 2 categories for Early Stage SGBs. ServicesrelatedtoAdministrative,LegalandOfficesupport,whichincludedpro-bonolegal counsel and accounting support, were ranked as higher priority and relevance to Growth Stage SGBs than their Early Stage counterparts, as were services related to Performance/Impact Metrics (including KPIsdevelopment).HumanResources/ManagementTrainingSupportserviceswererankedastheleast
6%Who received
investment met investor via program
59%Seeking capital at
time of participation
23%Receivedinvestment
within 2 years ofprogram
22
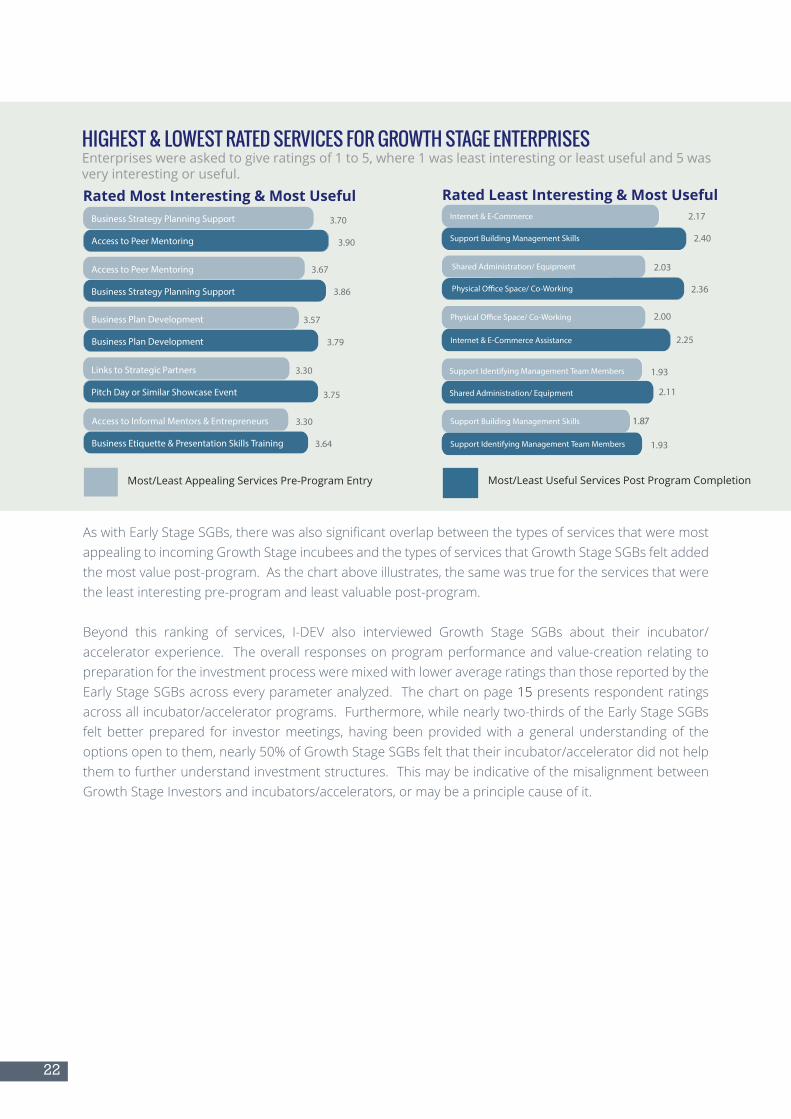
AswithEarlyStageSGBs,therewasalsosignificantoverlapbetweenthetypesofservicesthatweremostappealing to incoming Growth Stage incubees and the types of services that Growth Stage SGBs felt added the most value post-program. As the chart above illustrates, the same was true for the services that were the least interesting pre-program and least valuable post-program.
Beyond this ranking of services, I-DEV also interviewed Growth Stage SGBs about their incubator/accelerator experience. The overall responses on program performance and value-creation relating to preparation for the investment process were mixed with lower average ratings than those reported by the Early Stage SGBs across every parameter analyzed. The chart on page 15 presents respondent ratings across all incubator/accelerator programs. Furthermore, while nearly two-thirds of the Early Stage SGBs felt better prepared for investor meetings, having been provided with a general understanding of the optionsopentothem,nearly50%ofGrowthStageSGBsfeltthattheirincubator/acceleratordidnothelpthem to further understand investment structures. This may be indicative of the misalignment between Growth Stage Investors and incubators/accelerators, or may be a principle cause of it.
Rated Most Interesting & Most Useful
HIGHEST & LOWEST RATED SERVICES FOR GROWTH STAGE ENTERPRISESEnterprises were asked to give ratings of 1 to 5, where 1 was least interesting or least useful and 5 was very interesting or useful.
Support Identifying Management Team Members
2.03
2.00
1.93
2.17
Pitch Day or Similar Showcase Event 1.87
Internet & E-Commerce
Shared Administration/ Equipment
Support Building Management Skills
Shared Administration/ Equipment 2.11
Support Building Management Skills
Support Identifying Management Team Members
2.40
2.36
Internet & E-Commerce Assistance 2.25
1.93
Rated Least Interesting & Most Useful
3.90Access to Peer Mentoring
3.86Business Strategy Planning Support
3.79Business Plan Development
3.75Pitch Day or Similar Showcase Event
3.64Business Etiquette & Presentation Skills Training
3.70Business Strategy Planning Support
3.67Access to Peer Mentoring
3.57Business Plan Development
3.30Links to Strategic Partners
3.30Access to Informal Mentors & Entrepreneurs
Most/Least Appealing Services Pre-Program Entry Most/Least Useful Services Post Program Completion
Avg. Allocation of Fund Operating Budget
23
Rated Least Interesting & Most Useful
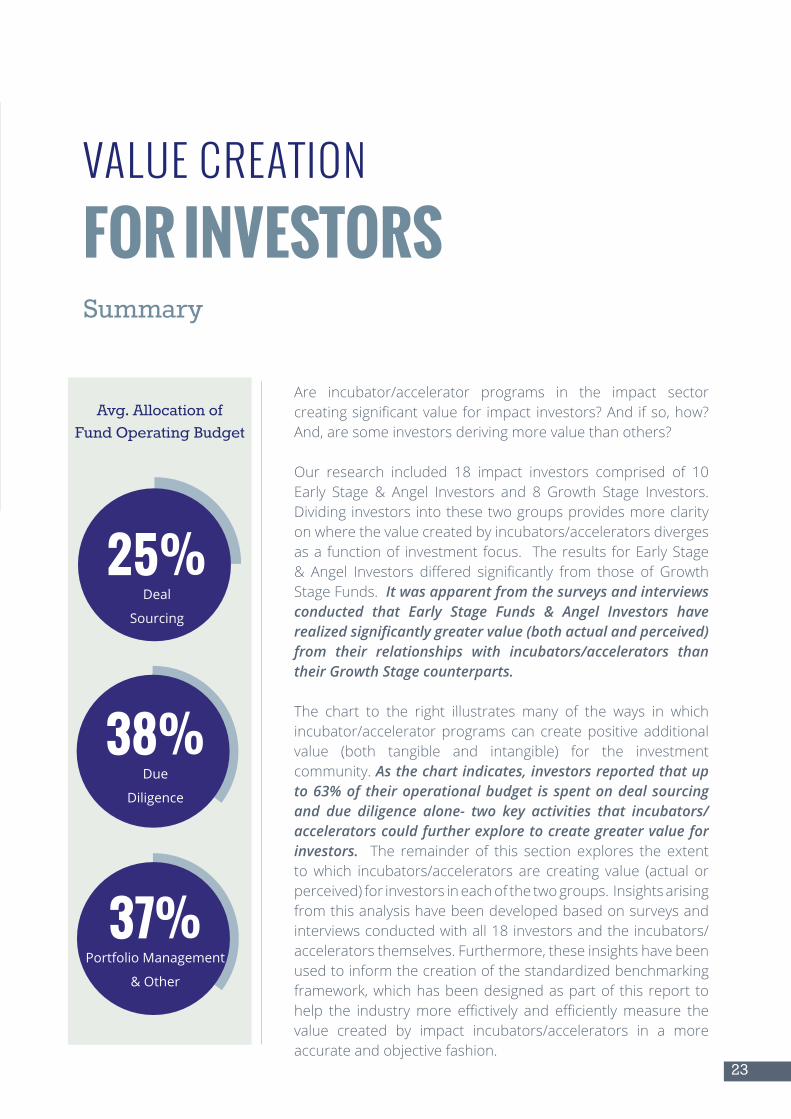
Are incubator/accelerator programs in the impact sector creatingsignificantvaluefor impact investors?Andifso,how?And,aresomeinvestorsderivingmorevaluethanothers?
Our research included 18 impact investors comprised of 10 Early Stage & Angel Investors and 8 Growth Stage Investors. Dividing investors into these two groups provides more clarity on where the value created by incubators/accelerators diverges as a function of investment focus. The results for Early Stage & Angel Investors differed significantly from those of GrowthStage Funds. It was apparent from the surveys and interviews conducted that Early Stage Funds & Angel Investors have realized significantly greater value (both actual and perceived) from their relationships with incubators/accelerators than their Growth Stage counterparts.
The chart to the right illustrates many of the ways in which incubator/accelerator programs can create positive additional value (both tangible and intangible) for the investment community. As the chart indicates, investors reported that up to 63% of their operational budget is spent on deal sourcing and due diligence alone- two key activities that incubators/accelerators could further explore to create greater value for investors. The remainder of this section explores the extent to which incubators/accelerators are creating value (actual or perceived) for investors in each of the two groups. Insights arising from this analysis have been developed based on surveys and interviews conducted with all 18 investors and the incubators/accelerators themselves. Furthermore, these insights have been used to inform the creation of the standardized benchmarking framework, which has been designed as part of this report to help the industrymore effictively and efficientlymeasure thevalue created by impact incubators/accelerators in a more accurate and objective fashion.
VALUE CREATION
FOR INVESTORSSummary
38%Due
Diligence
25%Deal
Sourcing
37%Portfolio Management
& Other
(1 sourced deals via an incubator/accelerator)
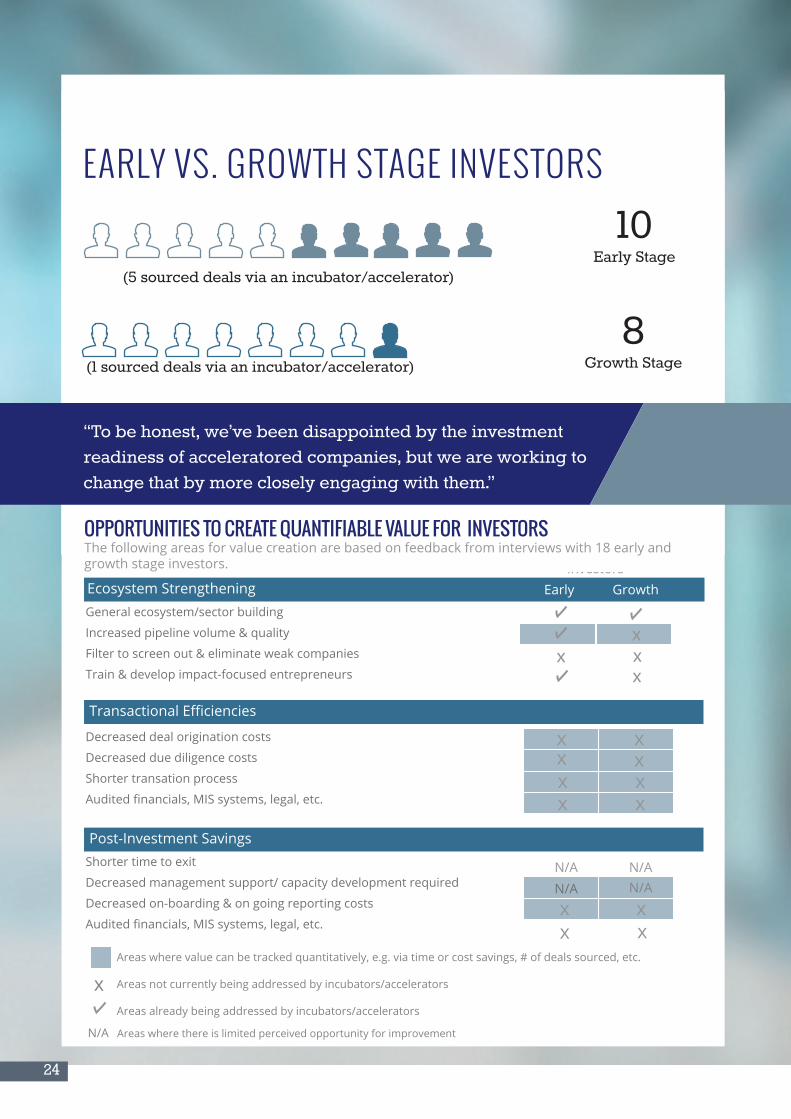
N/A Areas where there is limited perceived opportunity for improvement
(5 sourced deals via an incubator/accelerator)
OPPORTUNITIES TO CREATE QUANTIFIABLE VALUE FOR INVESTORSThe following areas for value creation are based on feedback from interviews with 18 early and growth stage investors.
(1 sourced deals via an incubator/accelerator)
24
EARLY VS. GROWTH STAGE INVESTORS
10 Early Stage
8Growth Stage
Ecosystem Strengthening
General ecosystem/sector building
Increased pipeline volume & quality
Filter to screen out & eliminate weak companies
Train & develop impact-focused entrepreneurs
Decreased deal origination costs
Decreased due diligence costs
Shorter transation process
Audited financials, MIS systems, legal, etc.
Shorter time to exit
Decreased management support/ capacity development required
Decreased on-boarding & on going reporting costs
Audited financials, MIS systems, legal, etc.x xx
N/AN/A
Ecosystem Strengthening
Transactional Efficiencies
Post-Investment Savings
N/AN/A
x
x
x
Areas where value can be tracked quantitatively, e.g. via time or cost savings, # of deals sourced, etc.
Areas not currently being addressed by incubators/accelerators
Areas already being addressed by incubators/accelerators
Growth
x
Early
x x
Investors
x xxxx
xx
x
“To be honest, we’ve been disappointed by the investment readiness of acceleratored companies, but we are working to change that by more closely engaging with them.”
25
VALUE CREATED FOR
EARLY STAGE INVESTORS Investors typically investing under $500,000
SummaryThe Early Stage investment community is comprised of a diverse set of players including angel investors, investor networks, early stage funds and foundations. They invest using the entire array of instruments available from pure equity to hybrid debt and mezzanine structures to venture grants. However, the early stage focus of these organizations means that all investments tend to be focused on opportunities requiring less than $1 million in capital and targeting idea-stage through
post-revenue, pre-profit enterprises. While some Early Stage Investors are able to invest up to $1 million, the typical commitment size for this group is less than $500,000 and often less than $250,000 in a single round. In general, the Early Stage Investors interviewed as part of this study felt that impact incubator/accelerator programs create value on two key fronts: 1) Ecosystem building/sector strengthening, and 2) Potential reductions in investment transaction costs.
ComparedtoGrowthStageInvestorsinterviewed,Early Stage Investors in the sample group had
smaller teams (often 1 person as is the case with most Angels), limited on-the-ground presence and less developed operational infrastructure. Additionally, most of the enterprises they had provided financing to were less mature andrequiredsignificantlymorecapacitydevelopment,coaching, and management support. As a result, the Early Stage Investors interviewed generally seemed to realize greater value from working closely with incubator/accelerator programs than
was expressed by the Growth Stage Investor group. This was additionally supported by the fact that 40% of the Early Stage Investors interviewed had sourced at least one deal directly through an incubator/accelerator program, compared to only 12.5% (1 fund) from the Growth Stage Investorgroup. Furthermore, of the Investors which had sourced deals from incubators/accelerators, the average number of deals sourced by Early Stage Investors was higher at 3 per investor than the average number that been sourced by Growth Stage Investors at 1. Additionally,60%oftheEarlyStage Investors in the sample group had provided funding (primarily grants) directly to an incubator/accelerator, while 30% had developed formal
“There is a need for more ‘geling’ in the sector between investors and incubators.”
26
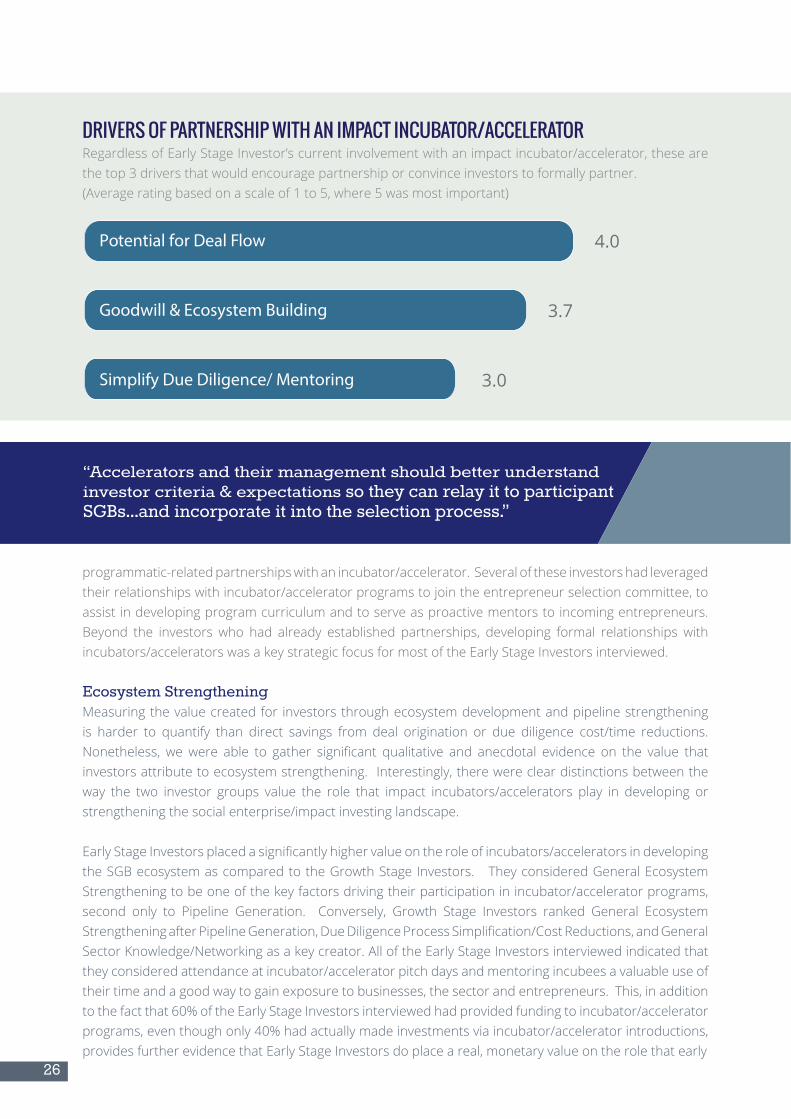
DRIVERS OF PARTNERSHIP WITH AN IMPACT INCUBATOR/ACCELERATORRegardlessofEarlyStageInvestor’scurrentinvolvementwithanimpactincubator/accelerator,thesearethe top 3 drivers that would encourage partnership or convince investors to formally partner. (Average rating based on a scale of 1 to 5, where 5 was most important)
programmatic-related partnerships with an incubator/accelerator. Several of these investors had leveraged their relationships with incubator/accelerator programs to join the entrepreneur selection committee, to assist in developing program curriculum and to serve as proactive mentors to incoming entrepreneurs. Beyond the investors who had already established partnerships, developing formal relationships with incubators/accelerators was a key strategic focus for most of the Early Stage Investors interviewed.
Ecosystem StrengtheningMeasuring the value created for investors through ecosystem development and pipeline strengthening is harder to quantify than direct savings from deal origination or due diligence cost/time reductions.Nonetheless, we were able to gather significant qualitative and anecdotal evidence on the value thatinvestors attribute to ecosystem strengthening. Interestingly, there were clear distinctions between the way the two investor groups value the role that impact incubators/accelerators play in developing or strengthening the social enterprise/impact investing landscape.
EarlyStageInvestorsplacedasignificantlyhighervalueontheroleofincubators/acceleratorsindevelopingthe SGB ecosystem as compared to the Growth Stage Investors. They considered General Ecosystem Strengthening to be one of the key factors driving their participation in incubator/accelerator programs, second only to Pipeline Generation. Conversely, Growth Stage Investors ranked General EcosystemStrengtheningafterPipelineGeneration,DueDiligenceProcessSimplification/CostReductions,andGeneralSector Knowledge/Networking as a key creator. All of the Early Stage Investors interviewed indicated that they considered attendance at incubator/accelerator pitch days and mentoring incubees a valuable use of their time and a good way to gain exposure to businesses, the sector and entrepreneurs. This, in addition tothefactthat60%oftheEarlyStageInvestorsinterviewedhadprovidedfundingtoincubator/acceleratorprograms,eventhoughonly40%hadactuallymadeinvestmentsviaincubator/acceleratorintroductions,provides further evidence that Early Stage Investors do place a real, monetary value on the role that early
“Accelerators and their management should better understand investor criteria & expectations so they can relay it to participant SGBs...and incorporate it into the selection process.”
Potential for Deal Flow
Goodwill & Ecosystem Building
Simplify Due Diligence/ Mentoring
4.0
3.7
3.0
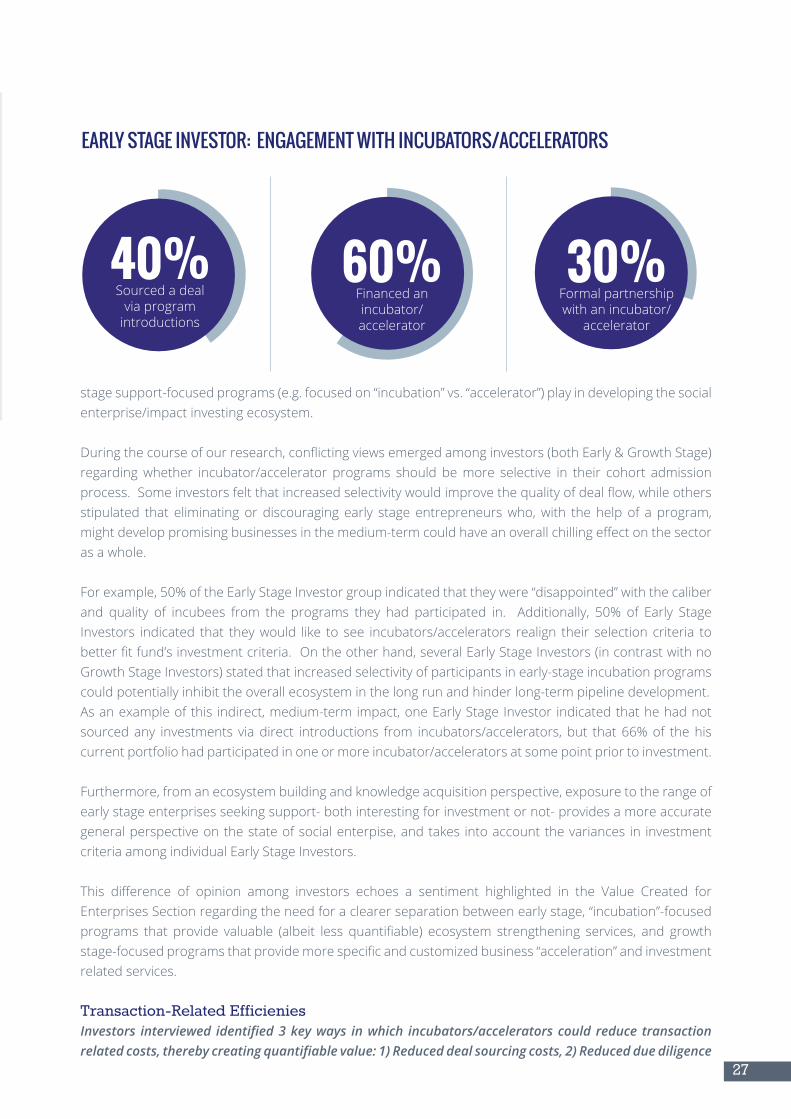
EARLY STAGE INVESTOR: ENGAGEMENT WITH INCUBATORS/ACCELERATORS
27
stagesupport-focusedprograms(e.g.focusedon“incubation”vs.“accelerator”)playindevelopingthesocialenterprise/impact investing ecosystem.
Duringthecourseofourresearch,conflictingviewsemergedamonginvestors(bothEarly&GrowthStage)regarding whether incubator/accelerator programs should be more selective in their cohort admission process.Someinvestorsfeltthatincreasedselectivitywouldimprovethequalityofdealflow,whileothersstipulated that eliminating or discouraging early stage entrepreneurs who, with the help of a program, mightdeveloppromisingbusinessesinthemedium-termcouldhaveanoverallchillingeffectonthesectoras a whole.
Forexample,50%oftheEarlyStageInvestorgroupindicatedthattheywere“disappointed”withthecaliberand quality of incubees from the programs they had participated in. Additionally, 50% of Early StageInvestors indicated that they would like to see incubators/accelerators realign their selection criteria to betterfitfund’sinvestmentcriteria.Ontheotherhand,severalEarlyStageInvestors(incontrastwithnoGrowth Stage Investors) stated that increased selectivity of participants in early-stage incubation programs could potentially inhibit the overall ecosystem in the long run and hinder long-term pipeline development. As an example of this indirect, medium-term impact, one Early Stage Investor indicated that he had not sourcedany investments viadirect introductions from incubators/accelerators,but that66%of thehiscurrent portfolio had participated in one or more incubator/accelerators at some point prior to investment.
Furthermore, from an ecosystem building and knowledge acquisition perspective, exposure to the range of early stage enterprises seeking support- both interesting for investment or not- provides a more accurate general perspective on the state of social enterpise, and takes into account the variances in investment criteria among individual Early Stage Investors.
This difference of opinion among investors echoes a sentiment highlighted in the Value Created forEnterprisesSectionregardingtheneedforaclearerseparationbetweenearlystage,“incubation”-focusedprograms that provide valuable (albeit less quantifiable) ecosystem strengthening services, and growthstage-focusedprogramsthatprovidemorespecificandcustomizedbusiness“acceleration”andinvestmentrelated services.
Transaction-Related EfficieniesInvestors interviewed identified 3 key ways in which incubators/accelerators could reduce transaction related costs, thereby creating quantifiable value: 1) Reduced deal sourcing costs, 2) Reduced due diligence
30%Formal partnership with an incubator/
accelerator
40%Sourced a deal
via program introductions
60%Financed an incubator/ accelerator
28
costs, and 3) Shorter transaction processes. However, most investors from both groups indicated that impact incubator/accelerator programs were largely unsuccessful at providing services that directly lead to these costs/time savings. Thiswaseitherbecausetheyfeltthattheserviceswerenotbeingofferedbythe programs or that they were not creating the desired value or impact.
Specific services that investors felt would lead to the most measurable cost/time savings during the transaction process included implementing better management processes and systems, providing access to professional legal support on formation through term negotiations, developing stronger training and preparation on the transaction process and common deal terms, compiling professionally prepared financials (or audited financials), and preparing due diligence materials- among others.
Post-Investment SavingsAll of the Early Stage Investors interviewed ranked opportunities to reduce post-investment portfolio company integration and management costs as the lowest or least likely way that incubator/accelerator programs could create additional value for them. These post-investment opportunities include implementing professional accounting and legal structures into portfolio companies as part of incubator services, establishing formal legal, management and board structures and processes, and helping to develop valuable, long-term partnerships with industry experts or strategic partners, among others.
Incubator/accelerator programs could further reduce costs in the post-investment stage if incubated enterprises required less technical assistance and presented earlier exit opportunities over and above equivalent portfolio companies that have not received the same training and preparation. However, Early Stage Investors in the sample group, for the most part, did not formally track internal costs or post-investmenttimeallocationtoportfoliocompaniesmakingitdifficulttomeasure.Thiswasanoticeablecontrast from the Growth Stage Investor counterparts, who are typically required by their Limited Partners or investors to closely track operational and investment data.
In addition, to effectively quantifying value creation post-investment, incubator/accelerator programswould need to track data on their alumni, which is not yet common practice.
“[Incubators/accelerators should] provide capacity building beyond the duration of the formal program, especially on financial modeling, corporate governance and capital raise.”
29
VALUE CREATED FOR
GROWTH STAGE INVESTORS Investors typically investing $500,000 or higher
SummaryFor this analysis, Growth Stage Investors have been classified as funds seeking to invest in post-revenue enterprises that have proven business models, existing client bases, and are ready to scale. The typical target for this investor category ranges from $500,000 to $2 million in debt, equity, or hybrid mezzanine financing. Given this investment range and generally more stringent investment criteria, in theory, Growth Stage Investors should be more in alignment
with “acceleration”-focused programs, which helpscale established, rapidly growing enterprises (as compared to earlier stage, “incubation” focusedprograms). However, based on feedback from both groups of investors, there did not appear to be many (if any) incubator/accelerator programs in the impact space that focused primarily on acceleration services to growth stage enterprises. As the following sections highlight, this ‘stage misalignment’ was a critical factor limiting the value that Growth Stage Investors felt incubator/accelerator programs have created for them.
Ecosystem BuildingOnly 1 (or 12.5%) of the Growth Stage Investors
included in the sample group indicated that it had made an investment via a direct introduction from and incubator/accelerator program. This low transaction level was largely attributed to the early stage of incubees, poor deal quality and concerns about management capabilities. The chart on the following page illustrates the key reasons why transaction levels between Growth Stage Investors and incubees has been so low to date (as reported by the sample group of Growth Stage Investors).
Despite the low levels of investment sourcing, all of the Growth Stage Investors that participated in this study indicated that SGB ecosystem development and strengthening was a valuable aspect of impact sector incubator/accelerator programs’ work. However, none ranked ecosystem building as something they would pay incubator/accelerator programs to provide. Interviews with the Growth Stage Investors in the sample group brought to light several reasons for this seemingly contradictory position. As previously indicated, the Growth Stage Investors in the sample group indicated that there wassignificantmisalignmentbetweenthestageofbusinesses they look to invest in and the stage of businesses that were coming out of impact sector incubator/accelerator programs. In fact, the early-
“[Incubators/accelerators] have broad selection criteria- sectors & stages, which makes the odds of alignment with our investment crite-ria low…This may be good for them, but it is not ideal for us.”
30
41%
21%
14%
11%
stage nature of enterprises graduating from impact sector incubator/accelerator programs, and general misalignment of services, were the two fundamental reasons why most of the Growth Stage Investors interviewed(65%)hadnotbuiltformalpartnershipswithprograms.
Another reason was that many of the Growth Stage Funds interviewed have larger operating budgets, larger locally-based teams, and well-established on-the-ground networks that they are able to leverage for originating and managing deals. This broader network, local presence and larger budget reduces Growth Stage Investors reliance on incubator/accelerator programs for deal origination and pipeline development, making them just one of many potential partners. Infact,75%ofGrowthStageInvestorsreported relyingonawidearrayofpartnersand intermediaries, suchas local lawfirms,NGOs, andimpactsectorconsultingfirmstogeneratedealflow.Severalinvestorsindicatedthattheyhaddevelopedpartnershipswithnon-incubator/acceleratorprograms,suchasconsultingfirms,whofocusonhelpingto scale and accelerate growth-stage SGBs. Several of these investors indicated that they had or would pay partner organizations a commission or referral fee for deal introductions that they ended up closing. Conversely, none of the Growth Stage Investors in the sample group had similar agreements in place with incubator/accelerator programs at the time of research. Although several indicated that theywouldbeopentoexploringsimilarsuccessbasedpartnershipswithprogramsthatfitwiththeirfocus and criteria.
Despite the sentiments expressed by Growth Stage Investors regarding deal misalignment and a lack of direct value creation for their funds, most of the investors interviewed did feel that impact incubator/accelerator programs played a valuable role in developing and generally strengthening the sector’s SGB ecosystem. This is evidenced not only by their commentary, but also by the fact that 87.5% of the Growth Stage Investors interviewed actively participated in one or more incubator/accelerator program in some way, generally as advisors, mentors or pitch day participants. Additionally, 3 of the Growth Stage Investors indicated that they had formal relationships with incubator/accelerator programs, either as members of their selection committee or for direct deal origination. It is important to note that 1 of these funds was actually spun out of the incubator program it has a formal relationship with. Nevertheless, unlike the Early Stage Investor group, no Growth Stage Investors had yet provided
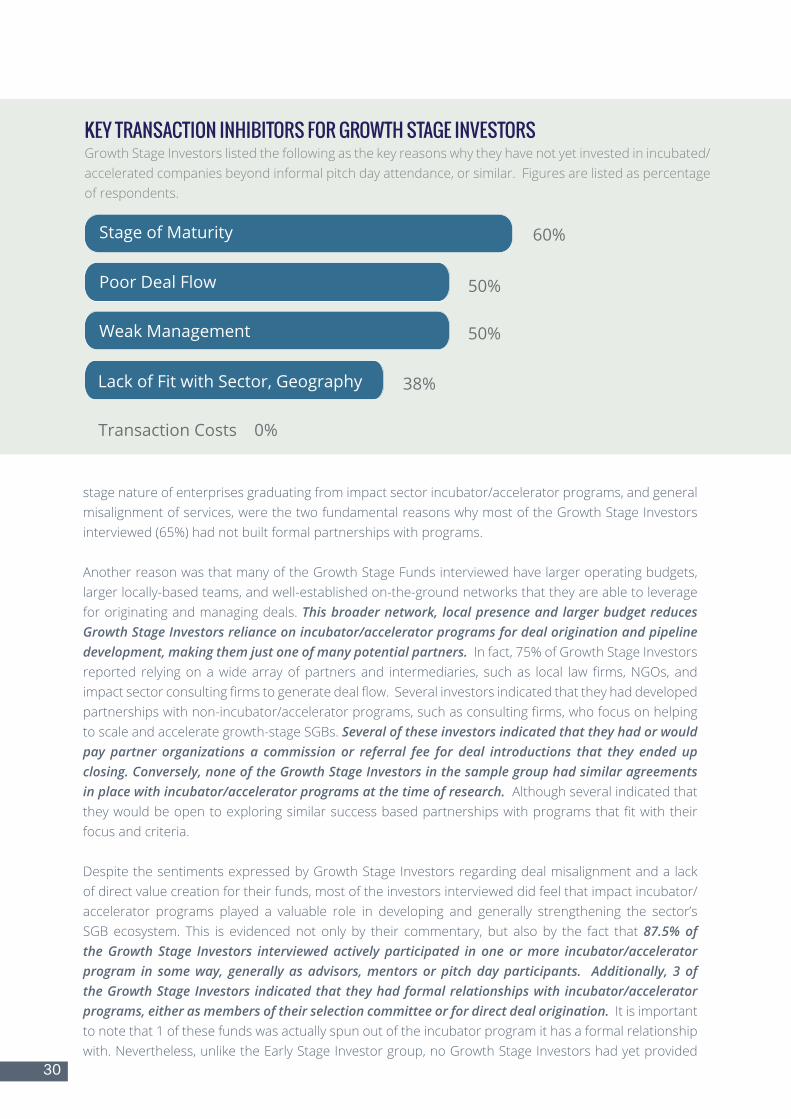
KEY TRANSACTION INHIBITORS FOR GROWTH STAGE INVESTORSGrowth Stage Investors listed the following as the key reasons why they have not yet invested in incubated/accelerated companies beyond informal pitch day attendance, or similar. Figures are listed as percentage of respondents.
Poor Deal Flow
Weak Management
Lack of Fit with Sector, Geography
50%
50%
38%
60%Stage of Maturity
Transaction Costs 0%
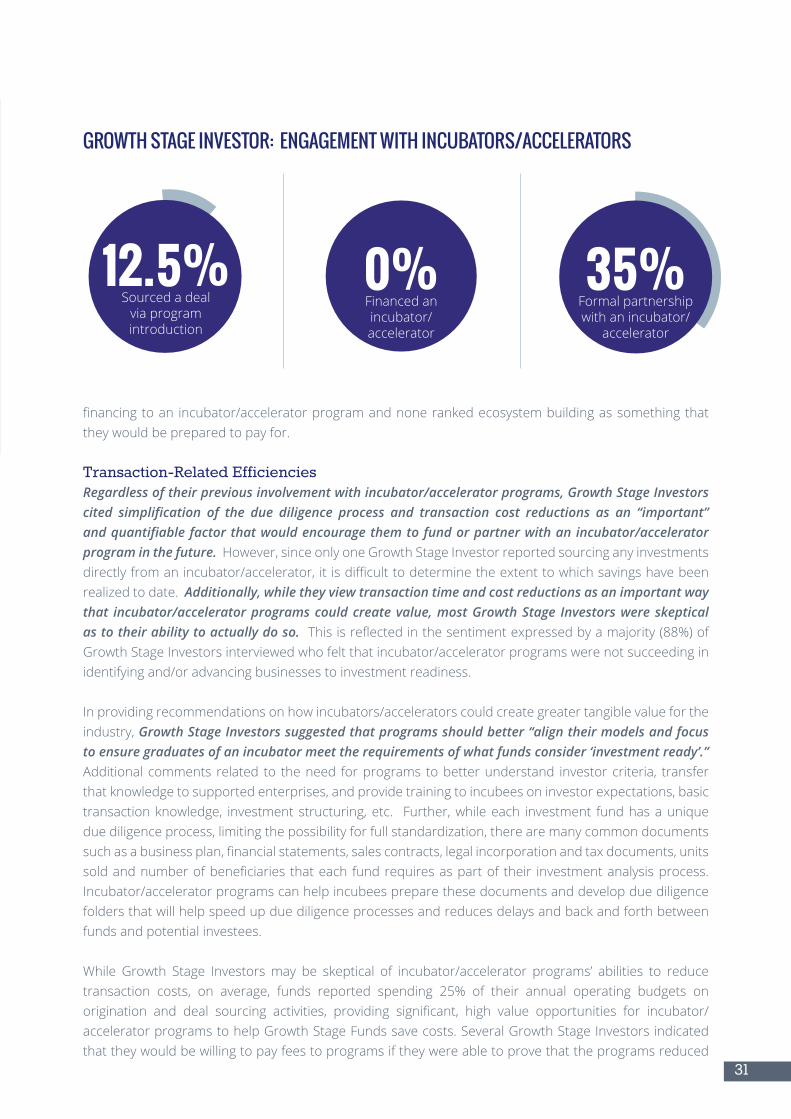
GROWTH STAGE INVESTOR: ENGAGEMENT WITH INCUBATORS/ACCELERATORS
31
financingtoan incubator/acceleratorprogramandnonerankedecosystembuildingassomethingthatthey would be prepared to pay for.
Transaction-Related EfficienciesRegardless of their previous involvement with incubator/accelerator programs, Growth Stage Investors cited simplification of the due diligence process and transaction cost reductions as an “important” and quantifiable factor that would encourage them to fund or partner with an incubator/accelerator program in the future. However, since only one Growth Stage Investor reported sourcing any investments directlyfromanincubator/accelerator,itisdifficulttodeterminetheextenttowhichsavingshavebeenrealized to date. Additionally, while they view transaction time and cost reductions as an important way that incubator/accelerator programs could create value, most Growth Stage Investors were skeptical as to their ability to actually do so. Thisisreflectedinthesentimentexpressedbyamajority(88%)ofGrowth Stage Investors interviewed who felt that incubator/accelerator programs were not succeeding in identifying and/or advancing businesses to investment readiness.
In providing recommendations on how incubators/accelerators could create greater tangible value for the industry, Growth Stage Investors suggested that programs should better “align their models and focus to ensure graduates of an incubator meet the requirements of what funds consider ‘investment ready’.” Additional comments related to the need for programs to better understand investor criteria, transfer that knowledge to supported enterprises, and provide training to incubees on investor expectations, basic transaction knowledge, investment structuring, etc. Further, while each investment fund has a unique due diligence process, limiting the possibility for full standardization, there are many common documents suchasabusinessplan,financialstatements,salescontracts,legalincorporationandtaxdocuments,unitssoldandnumberofbeneficiaries thateach fundrequiresaspartof their investmentanalysisprocess.Incubator/accelerator programs can help incubees prepare these documents and develop due diligence folders that will help speed up due diligence processes and reduces delays and back and forth between funds and potential investees.
While Growth Stage Investors may be skeptical of incubator/accelerator programs’ abilities to reduce transaction costs, on average, funds reported spending 25% of their annual operating budgets onorigination and deal sourcing activities, providing significant, high value opportunities for incubator/accelerator programs to help Growth Stage Funds save costs. Several Growth Stage Investors indicated that they would be willing to pay fees to programs if they were able to prove that the programs reduced
35%Formal partnership with an incubator/
accelerator
12.5%Sourced a deal
via program introduction
0%Financed an incubator/accelerator
32
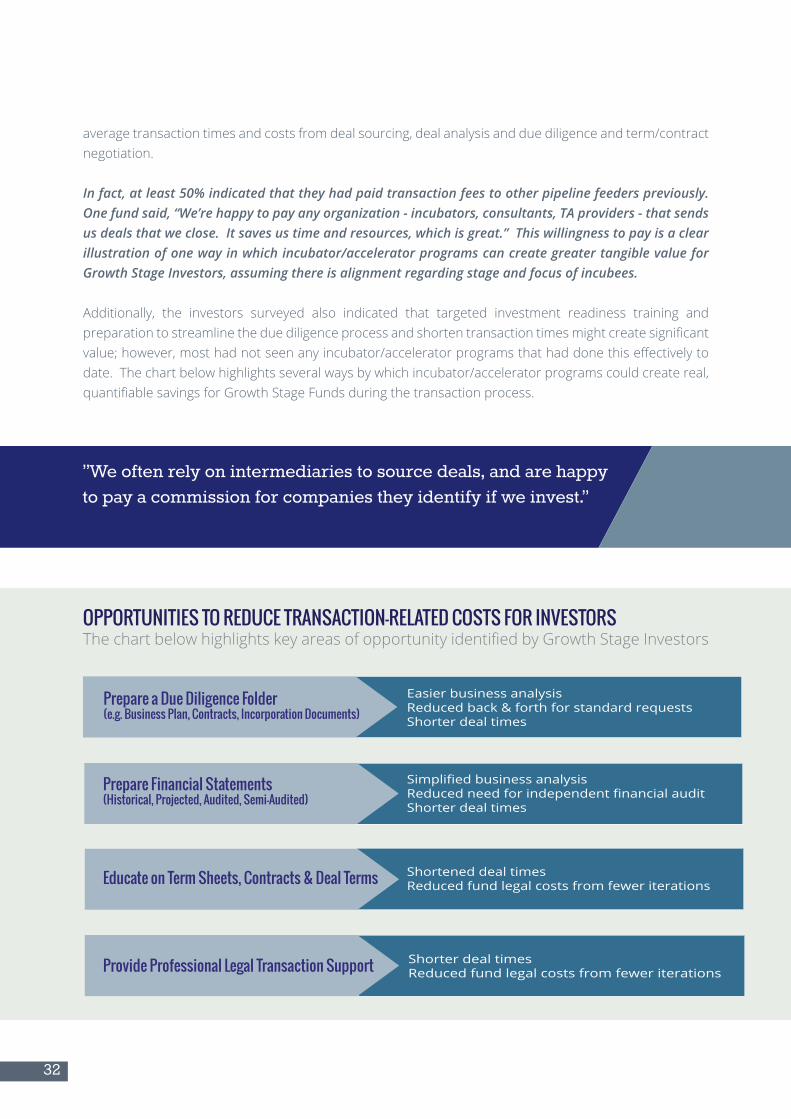
average transaction times and costs from deal sourcing, deal analysis and due diligence and term/contract negotiation.
In fact, at least 50% indicated that they had paid transaction fees to other pipeline feeders previously. One fund said, “We’re happy to pay any organization - incubators, consultants, TA providers - that sends us deals that we close. It saves us time and resources, which is great.” This willingness to pay is a clear illustration of one way in which incubator/accelerator programs can create greater tangible value for Growth Stage Investors, assuming there is alignment regarding stage and focus of incubees.
Additionally, the investors surveyed also indicated that targeted investment readiness training and preparationtostreamlinetheduediligenceprocessandshortentransactiontimesmightcreatesignificantvalue;however,mosthadnotseenanyincubator/acceleratorprogramsthathaddonethiseffectivelytodate. The chart below highlights several ways by which incubator/accelerator programs could create real, quantifiablesavingsforGrowthStageFundsduringthetransactionprocess.
Prepare a Due Diligence Folder(e.g. Business Plan, Contracts, Incorporation Documents)
Prepare Financial Statements(Historical, Projected, Audited, Semi-Audited)
Educate on Term Sheets, Contracts & Deal Terms
Provide Professional Legal Transaction Support
Easier business analysisReduced back & forth for standard requestsShorter deal times
Shortened deal timesReduced fund legal costs from fewer iterations
Shorter deal timesReduced fund legal costs from fewer iterations
”We often rely on intermediaries to source deals, and are happy to pay a commission for companies they identify if we invest.”
OPPORTUNITIES TO REDUCE TRANSACTION-RELATED COSTS FOR INVESTORSThechartbelowhighlightskeyareasofopportunityidentifiedbyGrowthStageInvestors
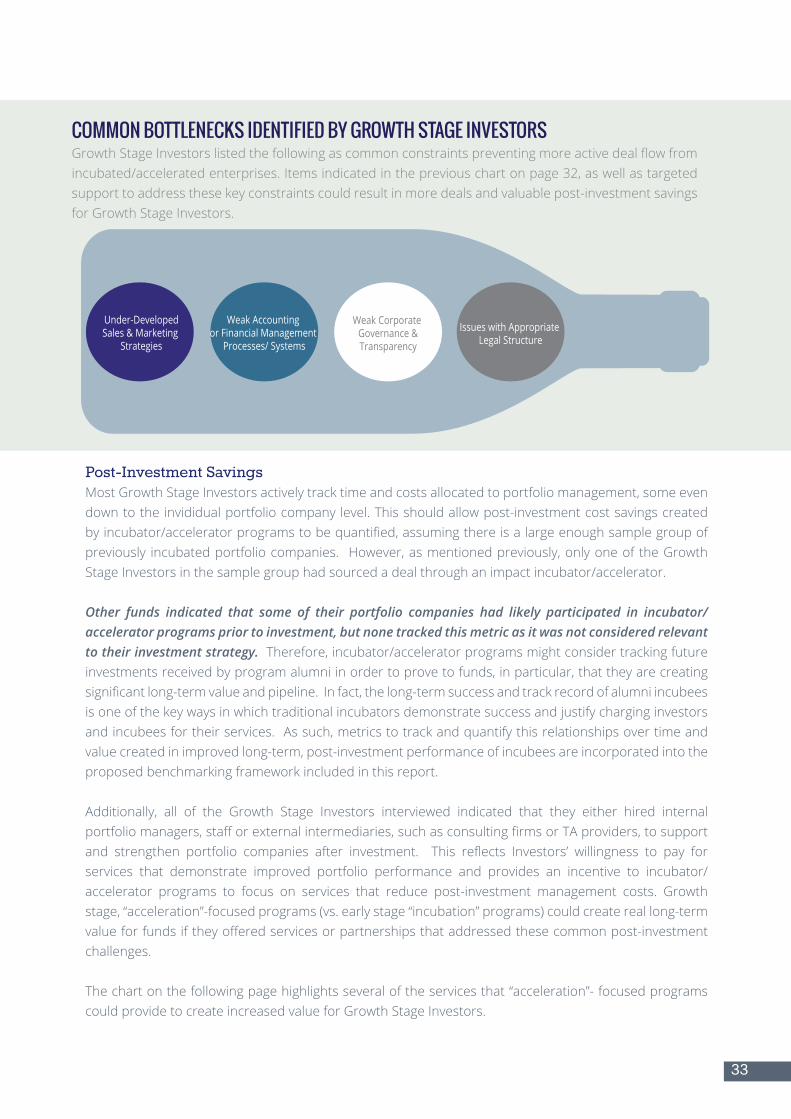
33
Post-Investment SavingsMost Growth Stage Investors actively track time and costs allocated to portfolio management, some even down to the invididual portfolio company level. This should allow post-investment cost savings created byincubator/acceleratorprogramstobequantified,assumingthereisalargeenoughsamplegroupofpreviously incubated portfolio companies. However, as mentioned previously, only one of the Growth Stage Investors in the sample group had sourced a deal through an impact incubator/accelerator.
Other funds indicated that some of their portfolio companies had likely participated in incubator/accelerator programs prior to investment, but none tracked this metric as it was not considered relevant to their investment strategy. Therefore, incubator/accelerator programs might consider tracking future investments received by program alumni in order to prove to funds, in particular, that they are creating significantlong-termvalueandpipeline.Infact,thelong-termsuccessandtrackrecordofalumniincubeesis one of the key ways in which traditional incubators demonstrate success and justify charging investors and incubees for their services. As such, metrics to track and quantify this relationships over time and value created in improved long-term, post-investment performance of incubees are incorporated into the proposed benchmarking framework included in this report.
Additionally, all of the Growth Stage Investors interviewed indicated that they either hired internal portfoliomanagers,stafforexternalintermediaries,suchasconsultingfirmsorTAproviders,tosupportand strengthen portfolio companies after investment. This reflects Investors’ willingness to pay forservices that demonstrate improved portfolio performance and provides an incentive to incubator/accelerator programs to focus on services that reduce post-investment management costs. Growth stage,“acceleration”-focusedprograms(vs.earlystage“incubation”programs)couldcreatereallong-termvalueforfundsiftheyofferedservicesorpartnershipsthataddressedthesecommonpost-investmentchallenges.
Thechartonthefollowingpagehighlightsseveraloftheservicesthat“acceleration”-focusedprogramscould provide to create increased value for Growth Stage Investors.
COMMON BOTTLENECKS IDENTIFIED BY GROWTH STAGE INVESTORSGrowthStageInvestorslistedthefollowingascommonconstraintspreventingmoreactivedealflowfromincubated/accelerated enterprises. Items indicated in the previous chart on page 32, as well as targeted support to address these key constraints could result in more deals and valuable post-investment savings for Growth Stage Investors.
Under-DevelopedSales & Marketing
Strategies
Weak Accounting or Financial Management
Processes/ Systems
Weak Corporate Governance &Transparency
Issues with Appropriate Legal Structure
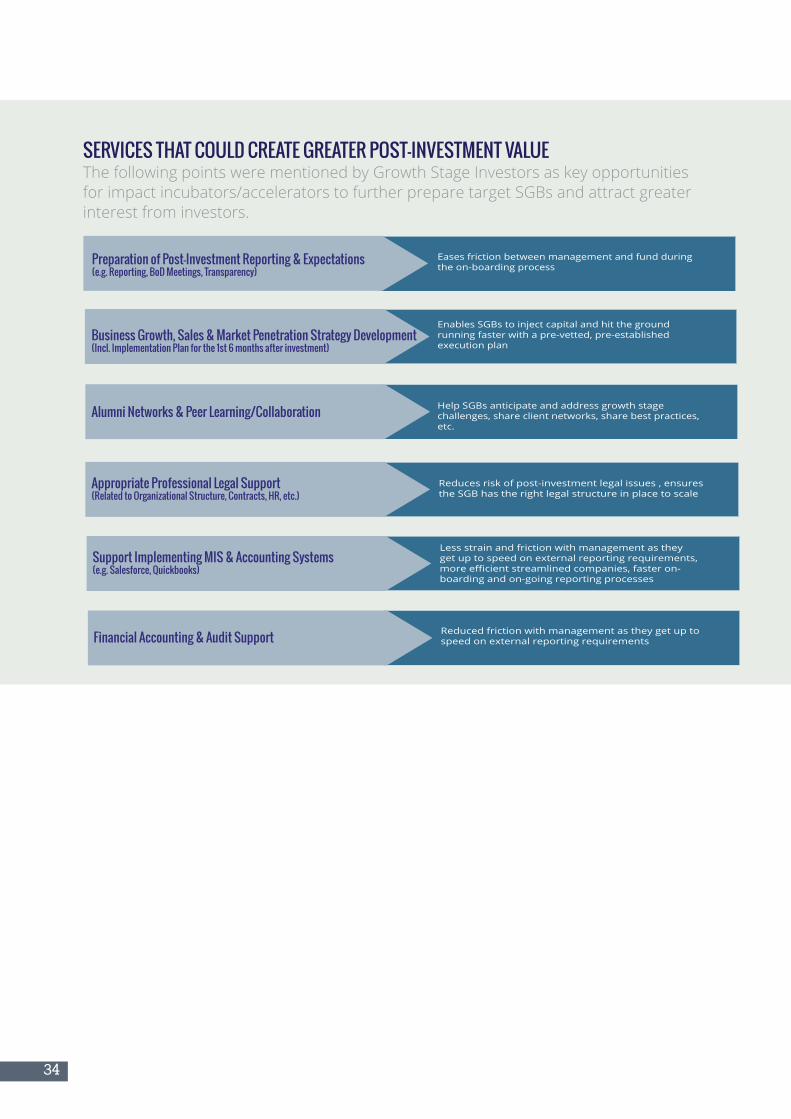
34
SERVICES THAT COULD CREATE GREATER POST-INVESTMENT VALUE The following points were mentioned by Growth Stage Investors as key opportunities for impact incubators/accelerators to further prepare target SGBs and attract greater interest from investors.
Preparation of Post-Investment Reporting & Expectations(e.g. Reporting, BoD Meetings, Transparency)
Business Growth, Sales & Market Penetration Strategy Development(Incl. Implementation Plan for the 1st 6 months after investment)
Alumni Networks & Peer Learning/Collaboration
Appropriate Professional Legal Support (Related to Organizational Structure, Contracts, HR, etc.)
Eases friction between management and fund during the on-boarding process
Enables SGBs to inject capital and hit the ground running faster with a pre-vetted, pre-established execution plan
Help SGBs anticipate and address growth stage challenges, share client networks, share best practices, etc.
Reduces risk of post-investment legal issues , ensuresthe SGB has the right legal structure in place to scale
Support Implementing MIS & Accounting Systems(e.g. Salesforce, Quickbooks)
Financial Accounting & Audit Support Reduced friction with management as they get up to speed on external reporting requirements
35
Agora Partnerships, Eleos Foundation & GSBI/Santa Clara University Collaborate to Facilitate Early-Stage Impact Investment in Maya Mountain Cacao
In 2012, Agora Partnerships and the Eleos Foundation created the Agora-Eleos LatAm Women’s Fund to provide opportunities for early stage impact investors to accelerate the success of women-run companies and companies that support the empowerment of women and girls in Latin America.
Agora Partnerships, through its Impact Accelerator, supports high-potential entrepreneurs seeking to create impact and then provides them with strategic consulting, mentoring, leadership development and a community of peers. The Eleos Foundation, working with Agora, conducts due diligence on companies in the Accelerator that meet its investment criteria and then assumes the role of lead investor in those companies in which it decides to invest. Once due diligence is complete, the investment opportunity is made available to other investors who can co-invest at their discretion. The Fund makes this easy for investorsbyusingEleos’swhollyownedsubsidiary,EleosInvestmentManagementLLC,tocreatedistinctinvestment vehicles for each individual investment in each company.
EmilyStone,founderofMayaMountainCacao(MMC),wasrecruitedbyAgoraforthe2013Accelerator.Agora matched MMC with Eleos and worked with Emily to prepare MMC to meet Eleos’ criteria forinvestment. Once the due diligence was complete, Agora worked with Emily and Eleos to implement the Demand Dividend investment model, an innovative investment structure developed by John Kohler and TomSabelofSantaClara’sGSBI.TheDemandDividendmodelcombinesequityanddebttoresolvemanyof the challenges posed by existing impact investing structures. It features an initial investment followed by a 1-2 year repayment holiday during which the entrepreneur grows the business, but makes no payment. Then,paymentsarebasedonfreecashflowratherthanafixedcapital+interestamortizationschedule.Repayments continueuntil a specified target is reached (generally 1.5x-3x return), atwhichpoint, theinvestment is closed and the investor retains no further interest in the company. Investors are attracted bythereliableexitwithapredictabletimeframewhileentrepreneursareattractedbytheflexiblecapitaland repayment term. This model has enormous potential to unlock new capital, particularly for early-stage, post-revenue companies with rapid growth prospects.
Using this model, Eleos attracted 20 investors to each contribute $10,000 to the fund, resulting ininvestmentof$200,000intoMayaMountainCacao-thefirstever investmentmadeusingthedemanddividend structure.MMC shortens cacao supply chains and leverages direct trade to obtain premiumpricesforbaseofthepyramidfarmersinBelize.TheinvestmenthasallowedMMCtogrowitssupplybyplanting additional trees, subsidize smallholder farmer expansion, and enter Guatemala.
CASE STUDY:
A PARTNERSHIP FOR IMPACT
36
Inadditiontothesummaryfindingspresented,I-DEVhasidentifiedkeytake-awaysandrecommendationsthat may help strengthen the value created by impact incubator/accelerator programs for both enterprises and investors. These points are highlighted below:
Track Data & Standardize Collection MethodologyA key ongoing limitation to assessing or quantifying the value created through an impact incubator/accelerator is that few of the key ecosystem players track consistent and reliable data, and therefore, limited conclusions can be made on value creation over time. This lack of consistent data collection across incubator/acceleratorprogramshasperpetuatedthequestion“WhatandhowmuchvaluedoincubatorsoracceleratorsofferinbuildingthesocialenterpriseandSGBlandscape?”Furthermore,ithasleftprogramswith limited evidence to respond or demonstrate value creation. While funders of most impact investment fundsrequireextensivedatatrackingandreportingtogaugebothfinancialandsocialreturnoninvestment,impact incubators/accelerators have, for the most part, not been required to do so. In conducting our broader initial interviews of incubators/accelerators, it became apparent that most programs do not trackevenbasicinformationontheirincubeesandalumnisuchasrevenuesandprofitabilityovertime,capital raised, or introductions to investors facilitated. Incubators/accelerators did express an interest in developing more robust data tracking capabilities (and several were in the process of doing so at the time of this research); however, they also indicated that they lack the funding and bandwidth necessary to do so. The foundations and development organizations that fund incubators/accelerators can be a catalyst behind impact incubator/accelerator formalization by requiring that investee programs carefully collect more robust data from their incubees and alumni and by providing the budgets and resources necessary to do so. In the following recommendations and with the standardized framework we propose, we hope to help incubators/accelerators save time that is needed to research and develop their own data collection methodologies, as well as reduce the time required for program-related data collection and analysis.
Define and Implement Industry-Wide Standardized Benchmarking FrameworkOnce impact incubator/accelerator programs begin to track data for their incubees and alumni, program funders,investors,andpotentialincubeesshouldencourageallincubator/acceleratorprogramstodefineand implement an industry-widebenchmarking framework.Until a standardized andhigh-quality datacollection protocol is established and implemented by stakeholders, we can only gain loose insights into the specificnatureof value createdby incubators/accelerators. A frameworkwill allowprogramsto be compared against one another and also allow applicants, program funders, and investors to more accurately select which programs to dedicate their time and resources to. It should be noted that in-depth data collection of non-incubated companies is also required to serve as a baseline or control group. The researchconductedbyPeterRobertsatEmoryUniversity,andalsofundedbyANDE,hasbeguntocollectthis data and will provide additional insights. The framework included as part of this report may be used asabaselineand“steppingstone”towardsdevelopingametricsframeworkthatenablesallstakeholdersto evaluate the performance and value created by each incubator/accelerator program objectively.
SUMMARY
RECOMMENDATIONS
37
In addition, we suggest that the proposed framework be integrated into the incubator/accelerator application process, in order to collect baseline data on maturity and performance of enterprises and to familiarize enterprises with standard questions they will be asked to answer upon exit from the incubator/accelerator and in subsequent years to track progress, as well as if they ever enter due diligence with a potential investor! While collecting accurate and consistent data from alumni can be challenging, we recommend a few approaches that can increase ongoing engagement:
• Develop strong alumni programs & follow-on support to continually engage past participants
• Integrate training on proper calculation and completion of the framework upon entry into the incubator/accelerator,explainingthatdatacollectedreflectdatathatpotential investorswillexpectto see, including year-over-year historical performance. By sharing this data with the incubator/accelerator, the program will also be better positioned to assist the incubee with a future capital raise.
• Have enterprises sign a commitment to provide year-over-year performance data for a minimum of 3yearsaftergraduationaspartof theirnon-financialcommitmentor “payment”tothe incubator/accelerator program if they are admitted.
Develop More Robust Alumni Programs & Follow-On SupportOne common complaint of incubator/accelerator alumni is that programs did not provide enough follow-on support once the formal program came to an end, as well as when participants were then required to implementandworkthroughthenewstrategiesidentifiedduringtheprogram.Severalparticipantssaidthat they struggled to access the resources or ongoing support to translate plans into action. In particular, participants said that an online platform that allowed program alumni to connect, share experiences, andaccessmentors theyhadmetduring theprogramwouldbeparticularly beneficial. Furthermore,additionallivetrainingoronlineresourceswerealsomentionedasvaluedadditionalservices.Creatingthisongoing value and network for alumni will also increase sense of ongoing involvement and commitment to promoting and further engaging in the incubator/accelerator, for example, in reporting year-over-year financial and growth data that the program can use to promote its long-term value creation forparticipants. Providing additional services such as trainings or capital raise support can also serve as a revenue generator for programs. Key areas where alumni suggested a need for additional customized or advanced support include legal services, market penetration strategy, accounting, investor connections or capital raise, and strengthening supply chains for growth.
Separate Incubation from Acceleration or Cohorts By IndustryAstheanalysisinthisreporthighlights,EarlyStageandGrowthStageEnterpriseshaveverydifferentlevelsofsophisticationandrequiredifferenttypesofsupporttoachievethenextlevelofgrowthanddevelopment.Whilecurrentlythereareprogramsthatcallthemselves“incubators”or“accelerators”,thereisverylittledifferentiationbetweenthetwobasedonstageofcompaniesortypeofsupportoffered.Instead,mostprogramshaveattemptedtocreateaone-size-fits-alltrainingsolution.Thiswasaconcernexpressedbyincubeesandinvestorsalike.Werecommendthatprogramsformallydifferentiatebetween“Incubation”(earlierstage)and“Acceleration”(growthstage)cohortsandgroupincubeesaccordingly.Thiswillenableprograms to better customize support, better target the right types of mentors and relationships, attract more appropriate investors and ultimately attract higher performing, later stage incubees. Alternatively, programsmightchoosetodifferentiatetheirprogrambasedonindustry(e.g.acohortfocusedonagri-business or BoP hardware-based businesses.
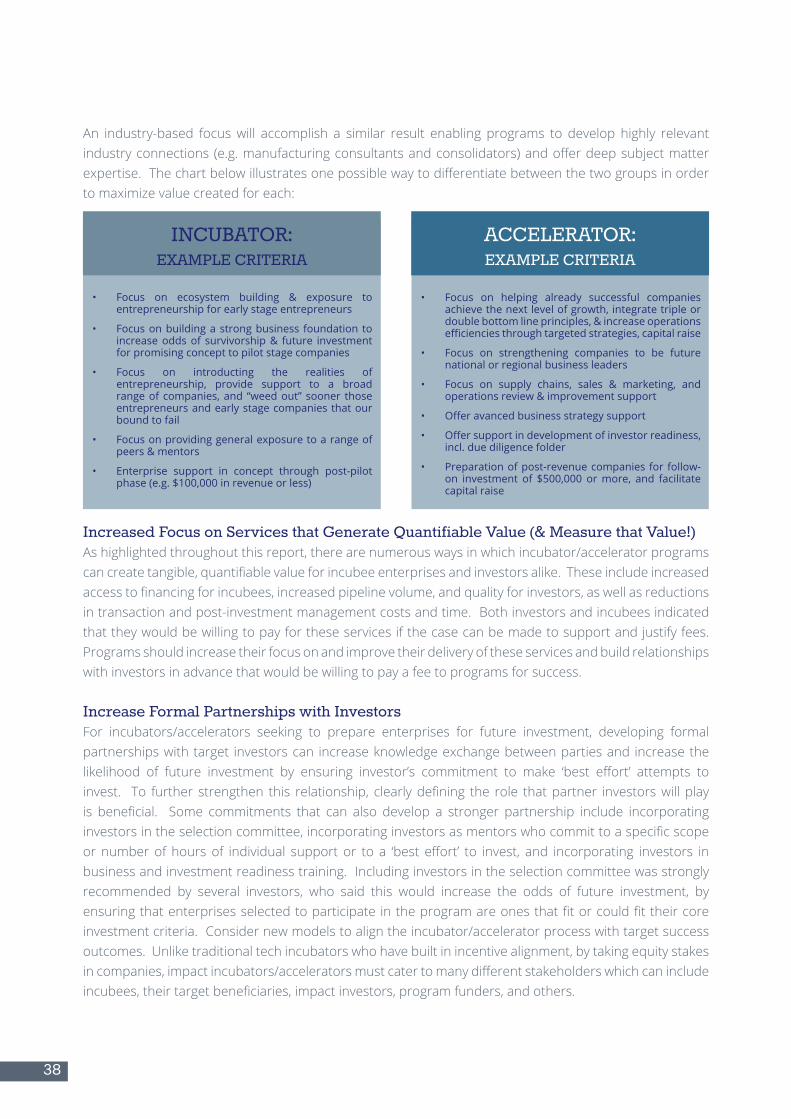
38
An industry-based focus will accomplish a similar result enabling programs to develop highly relevant industryconnections (e.g.manufacturingconsultantsandconsolidators)andofferdeepsubjectmatterexpertise.Thechartbelowillustratesonepossiblewaytodifferentiatebetweenthetwogroupsinorderto maximize value created for each:
Increased Focus on Services that Generate Quantifiable Value (& Measure that Value!)As highlighted throughout this report, there are numerous ways in which incubator/accelerator programs cancreatetangible,quantifiablevalueforincubeeenterprisesandinvestorsalike.Theseincludeincreasedaccesstofinancingforincubees,increasedpipelinevolume,andqualityforinvestors,aswellasreductionsin transaction and post-investment management costs and time. Both investors and incubees indicated that they would be willing to pay for these services if the case can be made to support and justify fees. Programs should increase their focus on and improve their delivery of these services and build relationships with investors in advance that would be willing to pay a fee to programs for success.
Increase Formal Partnerships with InvestorsFor incubators/accelerators seeking to prepare enterprises for future investment, developing formal partnerships with target investors can increase knowledge exchange between parties and increase the likelihood of future investment by ensuring investor’s commitment to make ‘best effort’ attempts toinvest. To further strengthen this relationship, clearlydefining the role thatpartner investorswillplayis beneficial. Some commitments that can also develop a stronger partnership include incorporatinginvestorsintheselectioncommittee,incorporatinginvestorsasmentorswhocommittoaspecificscopeornumberof hoursof individual support or to a ‘best effort’ to invest, and incorporating investors inbusiness and investment readiness training. Including investors in the selection committee was strongly recommended by several investors, who said this would increase the odds of future investment, by ensuringthatenterprisesselectedtoparticipateintheprogramareonesthatfitorcouldfittheircoreinvestmentcriteria.Considernewmodelstoaligntheincubator/acceleratorprocesswithtargetsuccessoutcomes.Unliketraditionaltechincubatorswhohavebuiltinincentivealignment,bytakingequitystakesincompanies,impactincubators/acceleratorsmustcatertomanydifferentstakeholderswhichcanincludeincubees,theirtargetbeneficiaries,impactinvestors,programfunders,andothers.
• Focus on ecosystem building & exposure to entrepreneurship for early stage entrepreneurs
• Focus on building a strong business foundation to increase odds of survivorship & future investment for promising concept to pilot stage companies
• Focus on introducting the realities of entrepreneurship, provide support to a broad range of companies, and “weed out” sooner those entrepreneurs and early stage companies that our bound to fail
• Focus on providing general exposure to a range of peers & mentors
• Enterprise support in concept through post-pilot phase (e.g. $100,000 in revenue or less)
• Focus on helping already successful companies achieve the next level of growth, integrate triple or double bottom line principles, & increase operations efficiencies through targeted strategies, capital raise
• Focus on strengthening companies to be future national or regional business leaders
• Focus on supply chains, sales & marketing, and operations review & improvement support
• Offer avanced business strategy support
• Offer support in development of investor readiness, incl. due diligence folder
• Preparation of post-revenue companies for follow-on investment of $500,000 or more, and facilitate capital raise
INCUBATOR:EXAMPLE CRITERIA
ACCELERATOR:EXAMPLE CRITERIA
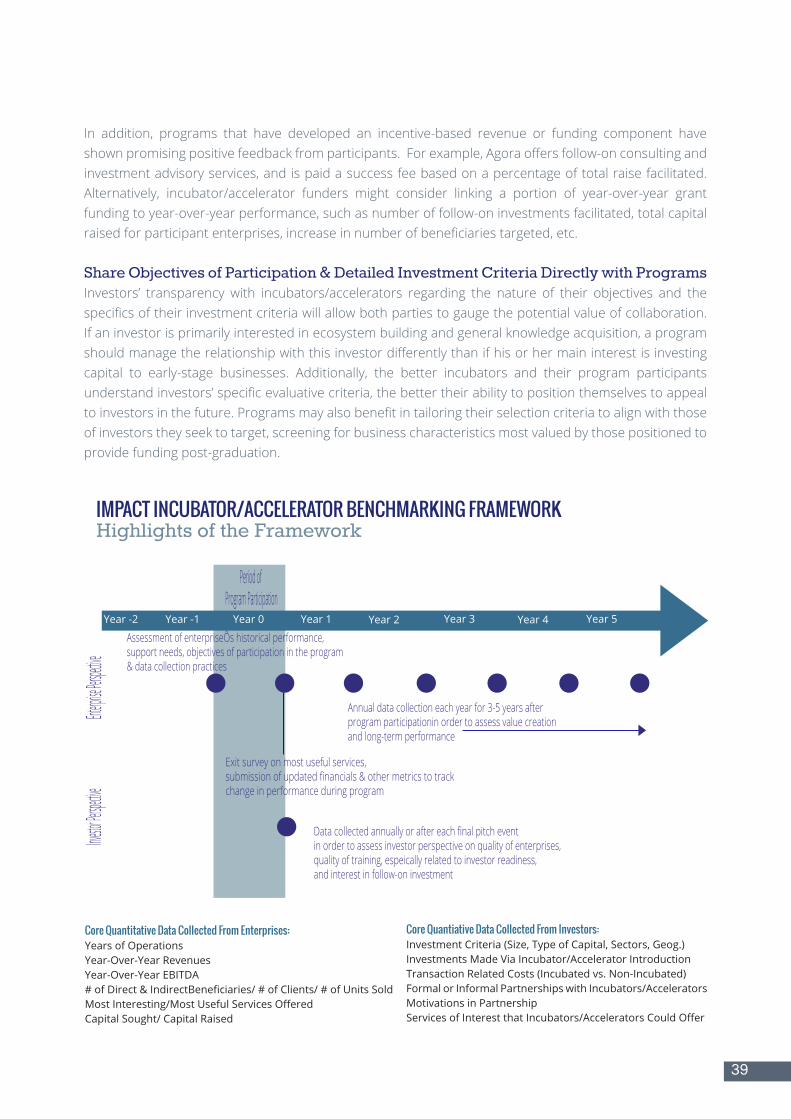
39
IMPACT INCUBATOR/ACCELERATOR BENCHMARKING FRAMEWORK Highlights of the Framework
In addition, programs that have developed an incentive-based revenue or funding component have shownpromisingpositivefeedbackfromparticipants.Forexample,Agoraoffersfollow-onconsultingandinvestment advisory services, and is paid a success fee based on a percentage of total raise facilitated. Alternatively, incubator/accelerator funders might consider linking a portion of year-over-year grant funding to year-over-year performance, such as number of follow-on investments facilitated, total capital raisedforparticipantenterprises,increaseinnumberofbeneficiariestargeted,etc.
Share Objectives of Participation & Detailed Investment Criteria Directly with ProgramsInvestors’ transparency with incubators/accelerators regarding the nature of their objectives and the specificsoftheirinvestmentcriteriawillallowbothpartiestogaugethepotentialvalueofcollaboration.If an investor is primarily interested in ecosystem building and general knowledge acquisition, a program shouldmanagetherelationshipwiththisinvestordifferentlythanifhisorhermaininterestisinvestingcapital to early-stage businesses. Additionally, the better incubators and their program participants understandinvestors’specificevaluativecriteria,thebettertheirabilitytopositionthemselvestoappealtoinvestorsinthefuture.Programsmayalsobenefitintailoringtheirselectioncriteriatoalignwiththoseof investors they seek to target, screening for business characteristics most valued by those positioned to provide funding post-graduation.
Core Quantitative Data Collected From Enterprises:Years of OperationsYear-Over-Year RevenuesYear-Over-Year EBITDA# of Direct & IndirectBeneficiaries/ # of Clients/ # of Units SoldMost Interesting/Most Useful Services OfferedCapital Sought/ Capital Raised
Core Quantiative Data Collected From Investors:Investment Criteria (Size, Type of Capital, Sectors, Geog.)Investments Made Via Incubator/Accelerator IntroductionTransaction Related Costs (Incubated vs. Non-Incubated)Formal or Informal Partnerships with Incubators/AcceleratorsMotivations in PartnershipServices of Interest that Incubators/Accelerators Could Offer
Period of Program Participation
Enterprise
Perspectiv
eInves
tor Perspec
tive
Assessment of enterpriseÕs historical performance, support needs, objectives of participation in the program& data collection practices
Annual data collection each year for 3-5 years after program participationin order to assess value creation and long-term performance
Year -2 Year -1 Year 0 Year 1 Year 2 Year 3 Year 4 Year 5
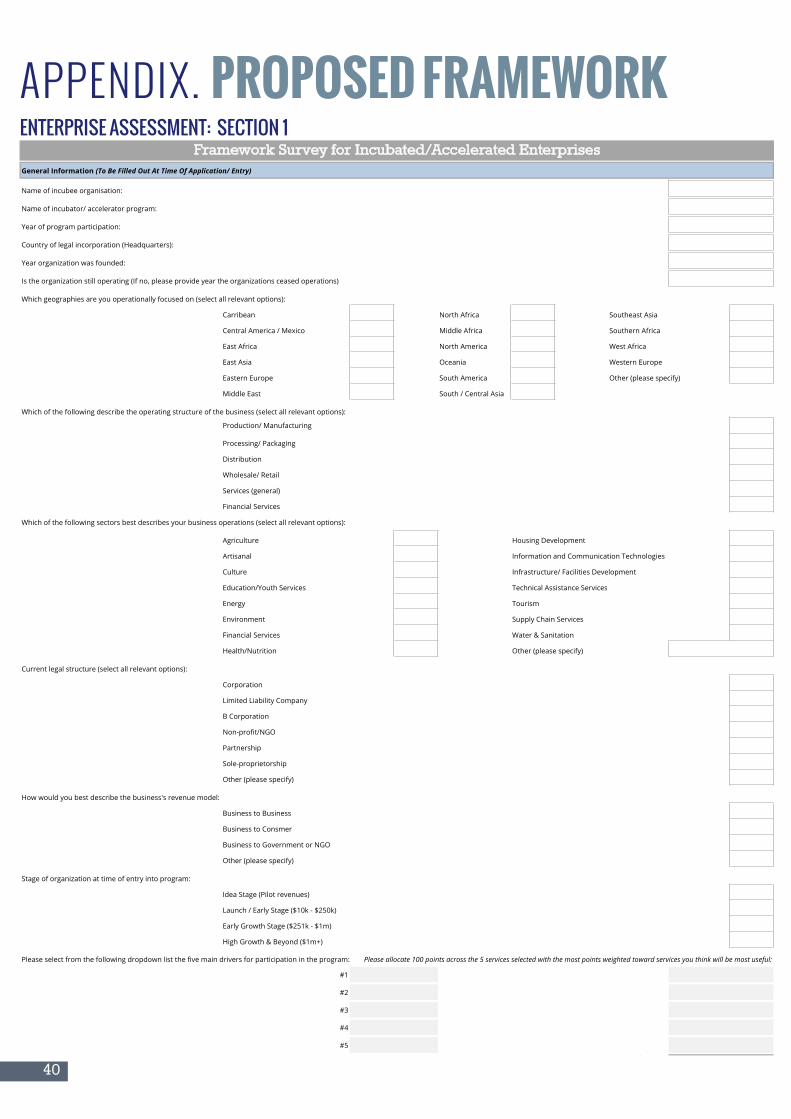
40
General Information (To Be Filled Out At Time Of Application/ Entry)
Name of incubee organisation:
Name of incubator/ accelerator program:
Year of program participation:
Country of legal incorporation (Headquarters):
Year organization was founded:
Is the organization still operating (If no, please provide year the organizations ceased operations)
Which geographies are you operationally focused on (select all relevant options):
Carribean North Africa Southeast Asia
Central America / Mexico Middle Africa Southern Africa
East Africa North America West Africa
East Asia Oceania Western Europe
Eastern Europe South America Other (please specify)
Middle East South / Central Asia
Which of the following describe the operating structure of the business (select all relevant options):
Production/ Manufacturing
Processing/ Packaging
Distribution
Wholesale/ Retail
Services (general)
Financial Services
Which of the following sectors best describes your business operations (select all relevant options):
Agriculture Housing Development
Artisanal Information and Communication Technologies
Culture Infrastructure/ Facilities Development
Education/Youth Services Technical Assistance Services
Energy Tourism
Environment Supply Chain Services
Financial Services Water & Sanitation
Health/Nutrition Other (please specify)
Current legal structure (select all relevant options):
Corporation
Limited Liability Company
B Corporation
Non-profit/NGO
Partnership
Sole-proprietorship
Other (please specify)
How would you best describe the business's revenue model:
Business to Business
Business to Consmer
Business to Government or NGO
Other (please specify)
Stage of organization at time of entry into program:
Idea Stage (Pilot revenues)
Launch / Early Stage ($10k - $250k)
Early Growth Stage ($251k - $1m)
High Growth & Beyond ($1m+)
Please select from the following dropdown list the five main drivers for participation in the program: Please allocate 100 points across the 5 services selected with the most points weighted toward services you think will be most useful:
#1
#2
#3
#4
#5Total (should equal 100):
Framework Survey for Incubated/Accelerated EnterprisesENTERPRISE ASSESSMENT: SECTION 1
APPENDIX. PROPOSED FRAMEWORK
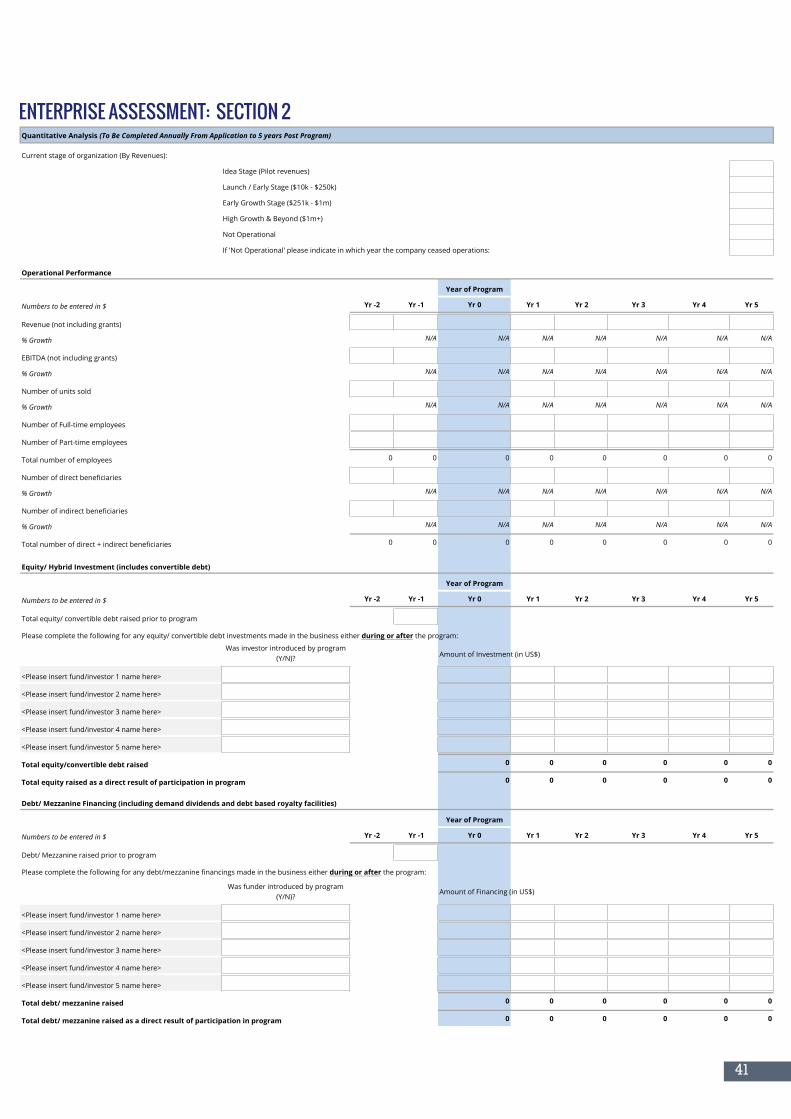
41
ENTERPRISE ASSESSMENT: SECTION 2Quantitative Analysis (To Be Completed Annually From Application to 5 years Post Program)
Current stage of organization (By Revenues):
Idea Stage (Pilot revenues)
Launch / Early Stage ($10k - $250k)
Early Growth Stage ($251k - $1m)
High Growth & Beyond ($1m+)
Not Operational
If 'Not Operational' please indicate in which year the company ceased operations:
Operational Performance
Year of Program
Numbers to be entered in $ Yr -2 Yr -1 Yr 0 Yr 1 Yr 2 Yr 3 Yr 4 Yr 5
Revenue (not including grants)
% Growth N/A N/A N/A N/A N/A N/A N/A
EBITDA (not including grants)
% Growth N/A N/A N/A N/A N/A N/A N/A
Number of units sold
% Growth N/A N/A N/A N/A N/A N/A N/A
Number of Full-time employees
Number of Part-time employees
Total number of employees 0 0 0 0 0 0 0 0
Number of direct beneficiaries
% Growth N/A N/A N/A N/A N/A N/A N/A
Number of indirect beneficiaries
% Growth N/A N/A N/A N/A N/A N/A N/A
Total number of direct + indirect beneficiaries 0 0 0 0 0 0 0 0
Equity/ Hybrid Investment (includes convertible debt)
Year of Program
Numbers to be entered in $ Yr -2 Yr -1 Yr 0 Yr 1 Yr 2 Yr 3 Yr 4 Yr 5
Total equity/ convertible debt raised prior to program
Please complete the following for any equity/ convertible debt investments made in the business either during or after the program:
Was investor introduced by program (Y/N)? Amount of Investment (in US$)
<Please insert fund/investor 1 name here>
<Please insert fund/investor 2 name here>
<Please insert fund/investor 3 name here>
<Please insert fund/investor 4 name here>
<Please insert fund/investor 5 name here>
Total equity/convertible debt raised 0 0 0 0 0 0
Total equity raised as a direct result of participation in program 0 0 0 0 0 0
Debt/ Mezzanine Financing (including demand dividends and debt based royalty facilities)
Year of Program
Numbers to be entered in $ Yr -2 Yr -1 Yr 0 Yr 1 Yr 2 Yr 3 Yr 4 Yr 5
Debt/ Mezzanine raised prior to program
Please complete the following for any debt/mezzanine financings made in the business either during or after the program:
Was funder introduced by program (Y/N)?
Amount of Financing (in US$)
<Please insert fund/investor 1 name here>
<Please insert fund/investor 2 name here>
<Please insert fund/investor 3 name here>
<Please insert fund/investor 4 name here>
<Please insert fund/investor 5 name here>
Total debt/ mezzanine raised 0 0 0 0 0 0
Total debt/ mezzanine raised as a direct result of participation in program 0 0 0 0 0 0
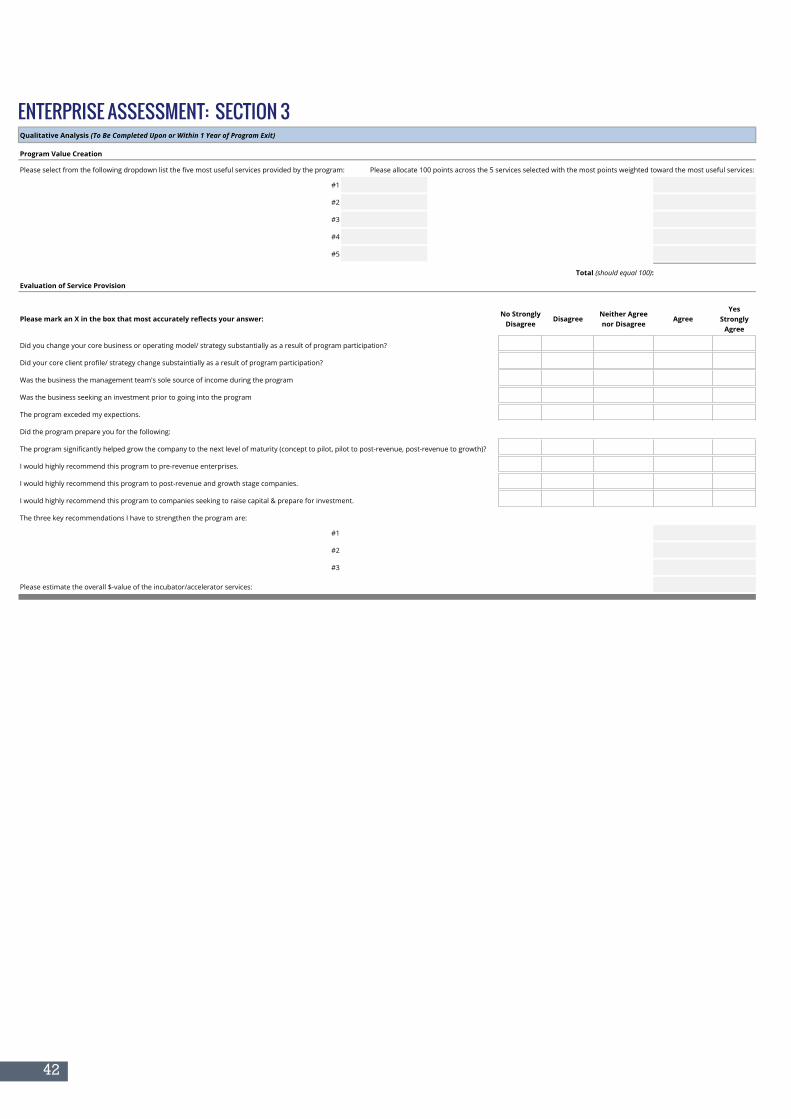
42
ENTERPRISE ASSESSMENT: SECTION 3Qualitative Analysis (To Be Completed Upon or Within 1 Year of Program Exit)
Program Value Creation
Please select from the following dropdown list the five most useful services provided by the program: Please allocate 100 points across the 5 services selected with the most points weighted toward the most useful services:
#1
#2
#3
#4
#5
Total (should equal 100):
Evaluation of Service Provision
Please mark an X in the box that most accurately reflects your answer:No Strongly
DisagreeDisagree
Neither Agree nor Disagree
AgreeYes
Strongly Agree
Did you change your core business or operating model/ strategy substantially as a result of program participation?
Did your core client profile/ strategy change substaintially as a result of program participation?
Was the business the management team's sole source of income during the program
Was the business seeking an investment prior to going into the program
The program exceded my expections.
Did the program prepare you for the following:
The program significantly helped grow the company to the next level of maturity (concept to pilot, pilot to post-revenue, post-revenue to growth)?
I would highly recommend this program to pre-revenue enterprises.
I would highly recommend this program to post-revenue and growth stage companies.
I would highly recommend this program to companies seeking to raise capital & prepare for investment.
The three key recommendations I have to strengthen the program are:
#1
#2
#3
Please estimate the overall $-value of the incubator/accelerator services:
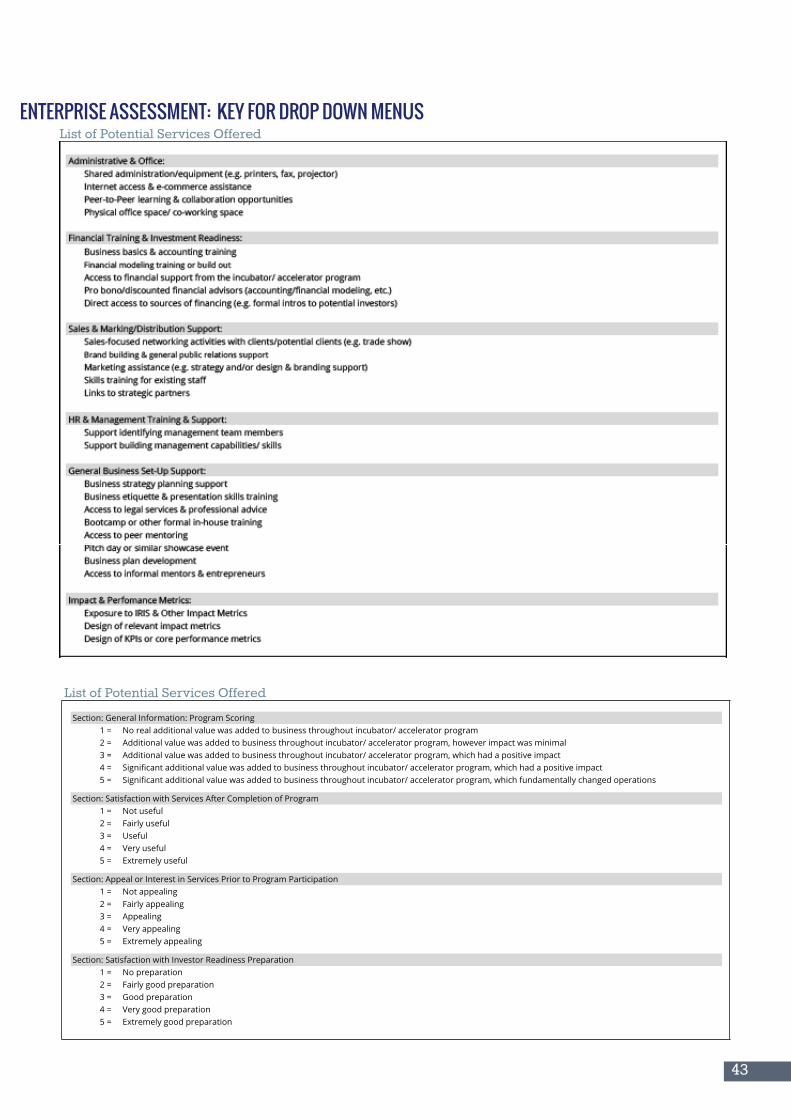
43
ENTERPRISE ASSESSMENT: KEY FOR DROP DOWN MENUS
Section: General Information: Program Scoring1 = No real additional value was added to business throughout incubator/ accelerator program2 = Additional value was added to business throughout incubator/ accelerator program, however impact was minimal3 = Additional value was added to business throughout incubator/ accelerator program, which had a positive impact4 = Significant additional value was added to business throughout incubator/ accelerator program, which had a positive impact5 = Significant additional value was added to business throughout incubator/ accelerator program, which fundamentally changed operations
Section: Satisfaction with Services After Completion of Program1 = Not useful2 = Fairly useful3 = Useful4 = Very useful5 = Extremely useful
Section: Appeal or Interest in Services Prior to Program Participation1 = Not appealing2 = Fairly appealing3 = Appealing4 = Very appealing5 = Extremely appealing
Section: Satisfaction with Investor Readiness Preparation1 = No preparation2 = Fairly good preparation3 = Good preparation4 = Very good preparation5 = Extremely good preparation
List of Potential Services Offered
List of Potential Services Offered
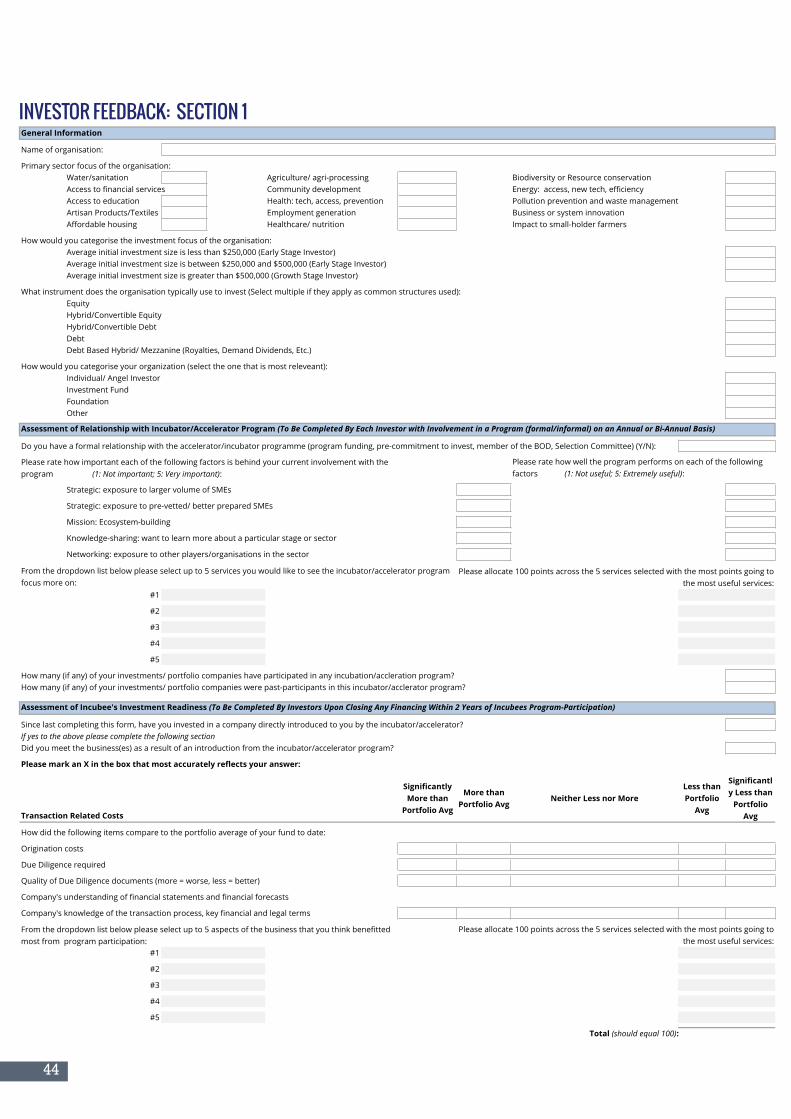
44
General Information
Name of organisation:
Primary sector focus of the organisation:Water/sanitation Agriculture/ agri-processing Biodiversity or Resource conservationAccess to financial services Community development Energy: access, new tech, efficiencyAccess to education Health: tech, access, prevention Pollution prevention and waste management Artisan Products/Textiles Employment generation Business or system innovationAffordable housing Healthcare/ nutrition Impact to small-holder farmers
How would you categorise the investment focus of the organisation:Average initial investment size is less than $250,000 (Early Stage Investor)Average initial investment size is between $250,000 and $500,000 (Early Stage Investor)Average initial investment size is greater than $500,000 (Growth Stage Investor)
What instrument does the organisation typically use to invest (Select multiple if they apply as common structures used):EquityHybrid/Convertible EquityHybrid/Convertible DebtDebtDebt Based Hybrid/ Mezzanine (Royalties, Demand Dividends, Etc.)
How would you categorise your organization (select the one that is most releveant):Individual/ Angel InvestorInvestment FundFoundationOther
Assessment of Relationship with Incubator/Accelerator Program (To Be Completed By Each Investor with Involvement in a Program (formal/informal) on an Annual or Bi-Annual Basis)
Do you have a formal relationship with the accelerator/incubator programme (program funding, pre-commitment to invest, member of the BOD, Selection Committee) (Y/N):
Strategic: exposure to larger volume of SMEs
Strategic: exposure to pre-vetted/ better prepared SMEs
Mission: Ecosystem-building
Knowledge-sharing: want to learn more about a particular stage or sector
Networking: exposure to other players/organisations in the sector
#1
#2
#3
#4
#5
How many (if any) of your investments/ portfolio companies have participated in any incubation/accleration program? How many (if any) of your investments/ portfolio companies were past-participants in this incubator/acclerator program?
Assessment of Incubee's Investment Readiness (To Be Completed By Investors Upon Closing Any Financing Within 2 Years of Incubees Program-Participation)
Since last completing this form, have you invested in a company directly introduced to you by the incubator/accelerator? If yes to the above please complete the following sectionDid you meet the business(es) as a result of an introduction from the incubator/accelerator program?
Please mark an X in the box that most accurately reflects your answer:
Transaction Related Costs
Significantly More than
Portfolio Avg
More than Portfolio Avg
Neither Less nor MoreLess than Portfolio
Avg
Significantly Less than
Portfolio Avg
How did the following items compare to the portfolio average of your fund to date:
Origination costs
Due Diligence required
Quality of Due Diligence documents (more = worse, less = better)
Company's understanding of financial statements and financial forecasts
Company's knowledge of the transaction process, key financial and legal terms
#1
#2
#3
#4
#5
Total (should equal 100):
How long was the transaction process from initiation of contact to final contract signing (in # of months)
How long is the typical transaction cycle from initiation of contact to disbursement for existing portfolio companies (in # of months)
Total months saved/(lost) on incubated company compared to portfolio average 0
What were the estimated external transaction costs for the transaction (accountants, lawyers, consultants, etc.)
What are the average external transaction costs for a typical transaction (accountants, lawyers, consultants, etc.)
Total dollars saved/(lost) on incubated company compared to portfolio average 0
What were the estimated number of hours spent by your organization's team on the transaction
What is the average number of hours spent by your organization's team on a typical transaction
Total hours saved/(lost) on incubated company compared to portfolio average 0
What were the estimated total internal expenses on the transaction (travel costs, etc.)
What are the average total internal expenses on a typical transaction (travel costs, etc.)
Total dollars saved/(lost) on incubated company compared to portfolio average 0
Assessment of Incubee's Post Investment Performance (To Be Completed Annually or Bi-Annually By Investors That Have Financed an Incubee)
Please mark an X in the box that most accurately reflects your answer:Significantly Weaker than Portfolio Avg
Weaker than Portfolio Avg
Neither Stronger nor Weaker
Stronger than
Portfolio Avg
Significantly Stronger
than Portfolio
Avg
How did the following items compare to the portfolio average of your fund to date:
Strength of administrative processes and systems
Ability to regularly report financial performance
Establishment of governance structure
Capacity development needs
What were the estimated external new portfolio company on-boarding costs for the transaction (accountants, lawyers, consultants, etc.)
What are the average external new portfolio company on-boarding costs for a typical business (accountants, lawyers, consultants, etc.)
Total dollars saved/(lost) on incubated company compared to portfolio average 0
What were the estimated number of hours spent by your organization's team to manage the incubee portfolio company
What is the average number of hours spent by your organization's team to manage a typical portfolio company
Total hours saved/(lost) on incubated company compared to portfolio average 0
What are the estimated total professional services/ capacity development expenses of the incubee portfolio company (accountants, lawyers, consultants, certifiers, etc.)
What are the average professional services/ capacity development expenses of a typical portfolio company (accountants, lawyers, consultants, certifiers, etc.)
Total dollars saved/(lost) on incubated company compared to portfolio average 0
From the dropdown list below please select up to 5 aspects of the business that you think benefitted most from program participation:
Please allocate 100 points across the 5 services selected with the most points going to the most useful services:
From the dropdown list below please select up to 5 services you would like to see the incubator/accelerator program focus more on:
Please rate how well the program performs on each of the following factors (1: Not useful; 5: Extremely useful):
Please rate how important each of the following factors is behind your current involvement with the program (1: Not important; 5: Very important):
Please allocate 100 points across the 5 services selected with the most points going to the most useful services:
INVESTOR FEEDBACK: SECTION 1
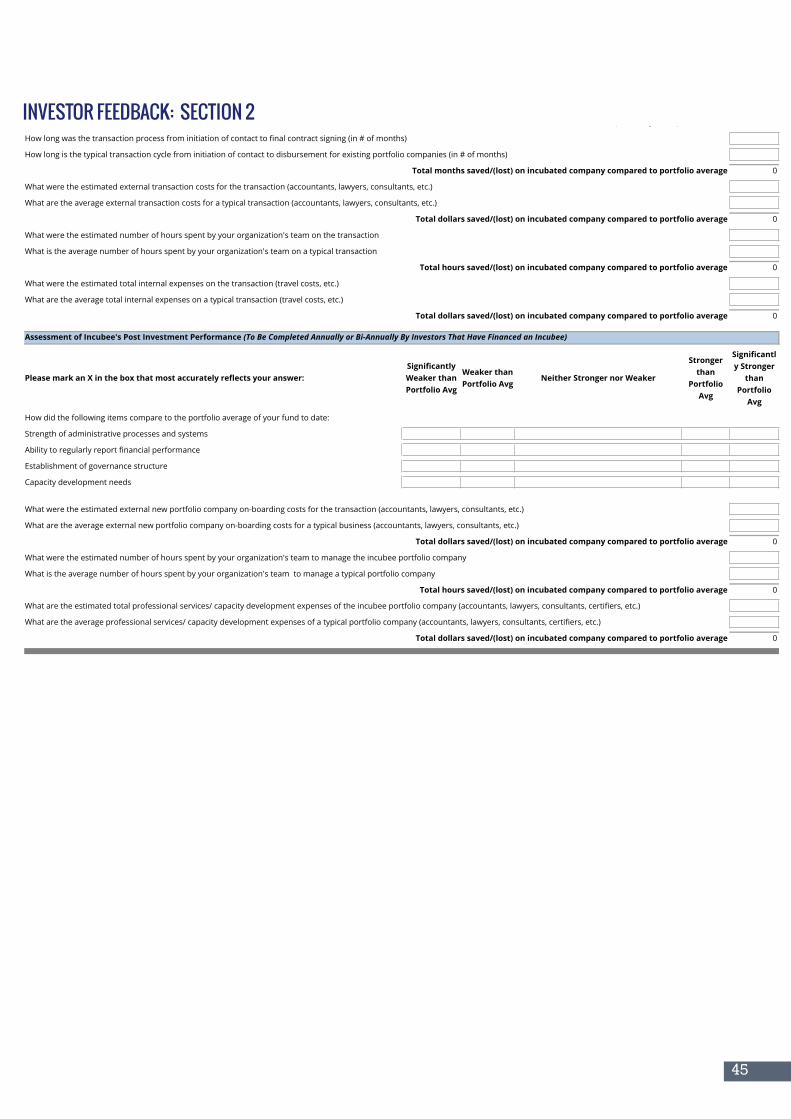
45
INVESTOR FEEDBACK: SECTION 2
General Information
Name of organisation:
Primary sector focus of the organisation:Water/sanitation Agriculture/ agri-processing Biodiversity or Resource conservationAccess to financial services Community development Energy: access, new tech, efficiencyAccess to education Health: tech, access, prevention Pollution prevention and waste management Artisan Products/Textiles Employment generation Business or system innovationAffordable housing Healthcare/ nutrition Impact to small-holder farmers
How would you categorise the investment focus of the organisation:Average initial investment size is less than $250,000 (Early Stage Investor)Average initial investment size is between $250,000 and $500,000 (Early Stage Investor)Average initial investment size is greater than $500,000 (Growth Stage Investor)
What instrument does the organisation typically use to invest (Select multiple if they apply as common structures used):EquityHybrid/Convertible EquityHybrid/Convertible DebtDebtDebt Based Hybrid/ Mezzanine (Royalties, Demand Dividends, Etc.)
How would you categorise your organization (select the one that is most releveant):Individual/ Angel InvestorInvestment FundFoundationOther
Assessment of Relationship with Incubator/Accelerator Program (To Be Completed By Each Investor with Involvement in a Program (formal/informal) on an Annual or Bi-Annual Basis)
Do you have a formal relationship with the accelerator/incubator programme (program funding, pre-commitment to invest, member of the BOD, Selection Committee) (Y/N):
Strategic: exposure to larger volume of SMEs
Strategic: exposure to pre-vetted/ better prepared SMEs
Mission: Ecosystem-building
Knowledge-sharing: want to learn more about a particular stage or sector
Networking: exposure to other players/organisations in the sector
#1
#2
#3
#4
#5
How many (if any) of your investments/ portfolio companies have participated in any incubation/accleration program? How many (if any) of your investments/ portfolio companies were past-participants in this incubator/acclerator program?
Assessment of Incubee's Investment Readiness (To Be Completed By Investors Upon Closing Any Financing Within 2 Years of Incubees Program-Participation)
Since last completing this form, have you invested in a company directly introduced to you by the incubator/accelerator? If yes to the above please complete the following sectionDid you meet the business(es) as a result of an introduction from the incubator/accelerator program?
Please mark an X in the box that most accurately reflects your answer:
Transaction Related Costs
Significantly More than
Portfolio Avg
More than Portfolio Avg
Neither Less nor MoreLess than Portfolio
Avg
Significantly Less than
Portfolio Avg
How did the following items compare to the portfolio average of your fund to date:
Origination costs
Due Diligence required
Quality of Due Diligence documents (more = worse, less = better)
Company's understanding of financial statements and financial forecasts
Company's knowledge of the transaction process, key financial and legal terms
#1
#2
#3
#4
#5
Total (should equal 100):
How long was the transaction process from initiation of contact to final contract signing (in # of months)
How long is the typical transaction cycle from initiation of contact to disbursement for existing portfolio companies (in # of months)
Total months saved/(lost) on incubated company compared to portfolio average 0
What were the estimated external transaction costs for the transaction (accountants, lawyers, consultants, etc.)
What are the average external transaction costs for a typical transaction (accountants, lawyers, consultants, etc.)
Total dollars saved/(lost) on incubated company compared to portfolio average 0
What were the estimated number of hours spent by your organization's team on the transaction
What is the average number of hours spent by your organization's team on a typical transaction
Total hours saved/(lost) on incubated company compared to portfolio average 0
What were the estimated total internal expenses on the transaction (travel costs, etc.)
What are the average total internal expenses on a typical transaction (travel costs, etc.)
Total dollars saved/(lost) on incubated company compared to portfolio average 0
Assessment of Incubee's Post Investment Performance (To Be Completed Annually or Bi-Annually By Investors That Have Financed an Incubee)
Please mark an X in the box that most accurately reflects your answer:Significantly Weaker than Portfolio Avg
Weaker than Portfolio Avg
Neither Stronger nor Weaker
Stronger than
Portfolio Avg
Significantly Stronger
than Portfolio
Avg
How did the following items compare to the portfolio average of your fund to date:
Strength of administrative processes and systems
Ability to regularly report financial performance
Establishment of governance structure
Capacity development needs
What were the estimated external new portfolio company on-boarding costs for the transaction (accountants, lawyers, consultants, etc.)
What are the average external new portfolio company on-boarding costs for a typical business (accountants, lawyers, consultants, etc.)
Total dollars saved/(lost) on incubated company compared to portfolio average 0
What were the estimated number of hours spent by your organization's team to manage the incubee portfolio company
What is the average number of hours spent by your organization's team to manage a typical portfolio company
Total hours saved/(lost) on incubated company compared to portfolio average 0
What are the estimated total professional services/ capacity development expenses of the incubee portfolio company (accountants, lawyers, consultants, certifiers, etc.)
What are the average professional services/ capacity development expenses of a typical portfolio company (accountants, lawyers, consultants, certifiers, etc.)
Total dollars saved/(lost) on incubated company compared to portfolio average 0
From the dropdown list below please select up to 5 aspects of the business that you think benefitted most from program participation:
Please allocate 100 points across the 5 services selected with the most points going to the most useful services:
From the dropdown list below please select up to 5 services you would like to see the incubator/accelerator program focus more on:
Please rate how well the program performs on each of the following factors (1: Not useful; 5: Extremely useful):
Please rate how important each of the following factors is behind your current involvement with the program (1: Not important; 5: Very important):
Please allocate 100 points across the 5 services selected with the most points going to the most useful services: