measuring vulnerability to stereotype threat
TRANSCRIPT
Electronic Journal of Research in Educational Psychology, N. 14, Vol 6 (1), 2008. ISSN: 1696-2095. pp: 51-64 - 51 -
Measuring vulnerability to stereotype
threat
Lucy Barnard, Hansel Burley, Arturo Olivarez,
Steven Crooks
Department of Educational Psychology,
Texas Tech University, Lubbock
USA
L. Barnard. P.O. Box 41071. Lubbock, TX. 79409
© Education & Psychology I+D+i and Editorial EOS (Spain)
- 52 - Electronic Journal of Research in Educational Psychology, N. 14, Vol 6 (1), 2008. ISSN: 1696-2095. pp: 51-64
Lucy Barnard et al.
Abstract
Introduction. In this study, we examined the psychometric properties of an instrument in-
tended to measure vulnerability to stereotype threat.
Method. We revised the instrument through assessing score reliability and then examined a
domain specific model using confirmatory factor analyses. After examining the responses of
the total sample consisting of mainly freshmen and sophomores (N = 414) at a large, public
research-intensive university in the Southwestern United States, we attempted to establish
configural and metric factorial invariance with gender as our grouping variable.
Results. The revised domain specific version of the scale does not appear to consistently
measure vulnerability to stereotype threat across gender.
Discussion and Conclusion. These results suggest that this measure should be used with cau-
tion for across gender comparisons.
Keywords: Stereotype threat, gender, measurement, psychometrics
Received: 05-21-07 Initial acceptance: 08-19-07 Final acceptance: 09-28-07
Electronic Journal of Research in Educational Psychology, N. 14, Vol 6 (1), 2008. ISSN: 1696-2095. pp: 51-64 - 53 -
Measuring vulnerability to stereotype threat
Resumen
Introducción. En este estudio examinamos las propiedades psicométricas de un instrumento
construido para medir la vulnerabilidad hacia la amenaza de estereotipo.
Método. Se revisó el instrumento evaluando fiabilidad de puntuaciones y examinando un
modelo de dominio específico utilizando análisis factorial confirmatorio. Tras examinar las
respuestas de la muestra completa de estudiantes de primer y segundo curso (N=414) de una
universidad pública del suroeste de los Estados Unidos, intentamos establecer la invarianza
factorial usando género como variable de agrupación.
Resultados. La versión de la escala revisada, específica de dominio, no parece medir de for-
ma consistente la vulnerabilidad a la amenaza de estereotipo en los dos géneros.
Conclusión. Los resultados sugieren utilizar esta medida con precaución para realizar compa-
raciones de género.
Palabras Clave: estereotipo, género, medida, índices psicométricos.
Recibido: 21-05-07 Aceptación provisional: 19-08-07 Aceptación definitiva: 28-09-07
- 54 - Electronic Journal of Research in Educational Psychology, N. 14, Vol 6 (1), 2008. ISSN: 1696-2095. pp: 51-64
Lucy Barnard et al.
Introduction
As a rule, the trip to the higher echelons of society involves mastery of math, hard sci-
ences and technology. Logically, proportionate percentages of ethnic and gender groups
should be perusing these fields. However, fields of study and jobs that are heavily dependent
upon the use and understanding of math, hard sciences and technology are dominated by whi-
te males and growing numbers of Asian males. How can we explain this discrepancy, this gap
between the performance of ethnic groups and genders? In 1969, Arthur Jensen argued that
test score gap was innate, a function of genetics, and he severely downplayed the role of the
environment. In the mid-1990s, Herrnstein and Murray (1994) published The Bell Curve fa-
mously reaching similar conclusions. Both publications launched a range of fields of study
that examined testing bias, the interaction effects of race, gender, and socio-economic status,
the mediating effects of home environment on achievement among ethnic groups and diffe-
rences in test score between ethnic groups at elite American universities and in schools
(Jencks & Phillips, 1998) and the study of gender differences. Taken together, these studies
conclude that numerous factors contribute to observed test differences among ethnic groups,
with the vast majority of them being environmental. One of the most recent strands in the
examination of environmental causes of performance differences between ethnic groups has
been that of stereotype threat.
Despite its relatively short history in research literature beginning with the work of
Steele and Aronson (1995), the concept of stereotype threat has been studied and documented
in numerous instances over the past decade (Brown & Josephs, 1999; Keller & Dauenheimer,
2003; Kray, Thompson, & Galinsky, 2001; Roberson, Deitch, Brief, & Block, 2003). As con-
ceived by Steele and Aronson (1995), stereotype threat may occur when any person feels that
their performance in a particular situation may confirm a negative stereotype about a relevant
group that they identify with. For instance, the negative stereotype that females cannot per-
form as well on math tasks as males would threaten the performance of a female student in a
math testing situation when identifying with this stereotype (Brown & Josephs, 1999). Under
the phenomenon of stereotype threat, the presence of a negative stereotype can be viewed as
threatening the performance of an individual given a particular performance situation, when
that individual is aware of and identifies with such a negative stereotype. Typically, the more
Electronic Journal of Research in Educational Psychology, N. 14, Vol 6 (1), 2008. ISSN: 1696-2095. pp: 51-64 - 55 -
Measuring vulnerability to stereotype threat
widely a negative stereotype is known, the more devaluing it is for the individual. Practically
speaking students who experience stereotype threat fail to identify with school because deve-
loping an identity based on school competence means dealing with the negative stereotype on
a daily basis (Steele, 1997).
What we call stereotype threat has also been referred to as stigma consciousness or the
extent to which individuals are self-conscious of their stigmatized status (Pinel, 1999). The
perceived stigma has been explained as producing additional cognitive workload that is rooted
in the fear that a testing situation will confirm a negative stereotype (Croizet, Després, Gau-
zins, Huguet, Leyens & Méot, 2004). This extra mental pressure or cognitive load can interfe-
re with performance, producing a self-fulfilling prophecy for the individual. The performance
situation that may trigger the threat of a negative stereotype appears to be dependent on the
awareness and identification of the individual with this negative stereotype. As such, the de-
gree to which a stereotype may threaten the performance of an individual appears to be do-
main or task specific as dependent upon the performance situation.
Since Steele and Aronsons’ (1995) work, numerous studies have sought to test the ex-
ternal or ecological validity of stereotype threat across a variety of groups and performance
situations. Steele and Aronson (1995) examined this phenomenon with a group of African
American and Anglo American undergraduate students attending an Ivy League university in
both diagnostic and non-diagnostic conditions. African American students, who were infor-
med that the experiment was non-diagnostic in nature performed just as well as their Anglo
American counterparts. Conversely, African American students in the diagnostic condition
performed less well when being informed that the same test would be used for diagnostic pur-
poses. The literature has found similar results from studies of Latino students (Aronson &
Salinas, 1997) and with individuals from lower socioeconomic status groups (Croizet & Clai-
re, 1998).
In studies of gender and stereotype threat, Spencer, Steele, and Quinn (1999) found
that mathematically talented women performed, who were informed that a test was gender-
biased in a treatment condition performed worse than those women who were informed that
the test was gender neutral. Using a situational cue such as the gender composition of a group
in a testing situation, Inzlicht and Ben-Zeev (2000) reported that as the proportion of men in a
treatment increased, the performance of women in that treatment decreased. Other researchers
- 56 - Electronic Journal of Research in Educational Psychology, N. 14, Vol 6 (1), 2008. ISSN: 1696-2095. pp: 51-64
Lucy Barnard et al.
found that self-consciousness about stigmatized status varied across women as women who
scored high in terms of stigma consciousness scored worse on a math test versus women who
scored low in terms of stigma consciousness. Gonzales, Blanton, and Williams (2002) exa-
mined the interactive effects of double-minority status for Latino women. They found lowe-
red performance for Latinos in general and for Latino women, but not for white women.
Measures used to predict the existence of constructs related to stereotype threat in in-
dividuals have varied, with most using researcher-created items that on their face appear to
measure the construct of stereotype threat. Gonzales, Blanton, and Williams (2002) employed
a self-report measure of effort on a cognitive test to assess stereotype threat. Brown and Pinel
(2004) employed the stigma consciousness scale (Pinel, 1999), a 10-item scale designed to so
it can be modified to apply to any stigmatized group. Pronin, Steele, and Lee (2004) used a
modified a self-schema scale. Finally, as an example of the variety of scales used to measure
threat, Croizet, et al., (2004) utilized measures of heart rate and respiratory activity as indica-
tors of mental load. To measure vulnerability to stereotype threat in particular, Spencer (1993)
developed a measure to assess the degree to which a person may be vulnerable to stereotype
threat in a particular performance situation. Potentially, the intent of the instrument is to mi-
nimize the effects of stereotype threat in such testing situations. The purpose of this study is
to examine the psychometric properties of an instrument intended to measure vulnerability to
stereotype threat in order to provide a reliable and valid instrument for practical and research
applications. In examining the psychometric properties of the instrument, the researchers stu-
died s domain specific (mathematics) version of the instrument in relation to gender.
Method
Participants
A sample of college students was selected from a required college-wide computer lit-
eracy course offered at a large, public research-intensive university located in the Southwest,
United States in an educational setting (computer lab classroom). Of these students, 414 self-
selected to volunteer for partial course credit, a replacement grade for lowest scored class as-
signment (one of twelve class assignments). Participants were informed as to the voluntary
nature of the study and that they could withdraw from the study at any time without penalty.
Participants were also ensured as to the confidentiality of their responses. The majority of the
students were classified as freshmen and sophomores (71.3%). Fifty-four percent of the parti-
Measuring vulnerability to stereotype threat
Electronic Journal of Research in Educational Psychology, N. 14, Vol 6 (1), 2008. ISSN: 1696-2095. pp: 51-64 - 57 -
cipants identified themselves as female and 76.5% as Anglo-Americans (white). Additionally,
twenty-four percent of the sample (n = 102) identified themselves as being from an ethnic
minority background. A total of 34 different majors (the most common majors being from the
social sciences and human services fields).
Instrumentation
The Stereotype Vulnerability Scale (SVS) is a unidimensional scale developed as part
of a funded dissertation project (Spencer, 1993). The SVS is an eight item scale with a seven
point, Likert-type response format ranging from strongly disagree to strongly agree. The SVS
purports to measure the degree to which college students report feeling threatened by a nega-
tive stereotype threat about their academic success. For the purposes of our study, we contex-
tualized the SVS to create a domain specific version of the instrument. The following is an
example of a domain specific format of an item:
• My math success may have been easier for people of my gender.
In scoring the instrument, we reverse scaled two of the items according to the instructions of
the original instrument.
Procedure
We administered the instrument online in a classroom environment. All participants
were assured that their responses would remain anonymous and confidential. Data were co-
llected via MS Excel and readied for analysis over the course of two administrations in one
long semester. Values for missing data were imputed in a linear trend at point analysis per-
formed with SPSS (v. 12.0).
Statistical Analysis
Prior to analyses, we examined the data for the presence of univariate and multivariate
outliers (Tabachnick & Fidell, 2007). Univariate outliers were analyzed through standardized
scores (|z| > 3.00) while multivariate outliers were analyzed through Mahalanobis Distance (p
< .001) for the domain specific version of the SVS. Few outliers were identified but to retain
the information from these outliers, data were transformed using an area under curve trans-
formation rather than remove them from analysis. For the first phase of analysis, we calcula-
ted Cronbach’s alphas for the SVS. In performing the CFA, five statistics reflecting fit will be
reported: the chi-square statistic; the ratio of chi-square statistic to degrees of freedom; the
Lucy Barnard et al.
- 58 - Electronic Journal of Research in Educational Psychology, N. 14, Vol 6 (1), 2008. ISSN: 1696-2095. pp: 51-64
root mean square error of approximation (RMSEA); the Tucker Lewis Index (TLI), also
known as the Non Normed Fit Index (NNFI); and the Comparative Fit Index (CFI). As multi-
group modeling in SEM permits the psychometric properties of a measure to be assessed
across groups (Joreskog, 1971), we then tested the model for configural, metric, and scalar
invariance across gender as the grouping variable.
Results
Internal Consistency
The scores obtained from the original (domain specific) measure as developed by
Spencer (1993) with a heterogeneous sample of undergraduate students demonstrated rela-
tively adequate internal consistency (α = .67). In using a domain specific version of the SVS,
Steele, James, and Barnett (2002) reported that the scores obtained revealed an acceptable
internal consistency with α = .84. The scores obtained from the domain-specific version of
the SVS in our sample revealed an overall internal consistency of α = .60. In examining the
internal consistency of scores, three items from the domain specific version of the SVS were
removed from analysis as not contributing to score reliability and having redundant content.
Scores obtained for the revised for the domain specific version of the instrument (SVS-R)
revealed an internal consistency of α = .82.
Confirmatory Factor Analyses
For the domain specific version of the SVS-R, the chi-square goodness-of-fit statistic
was not significant indicating that the data may fit the model (χ2(5) = 9.90, p = .077). The chi-
square statistic has been indicated as being sensitive to sample size thus an adjunct discrepan-
cy-based fit index may be used as the ratio of chi-square to degrees of freedom (χ2/df). A χ
2/df
ratio value less than 5 has been suggested as indicating an acceptable fit between the hypot-
hesized model and the sample data (MacCallum, Brown, & Sugawara, 1996). With a χ2/df
ratio value of 1.98, the proposed model indicates an acceptable fit. The root mean square error
of approximation (RMSEA) as compensating for the effects of model complexity was 0.05,
which according to Browne and Cudek (1993) indicates an acceptable fit of the model being
less than or close to 0.05. The value of Tucker Lewis Index (TLI), also known as the Non
Normed Fit Index (NNFI) was .97 and value of the Comparative Fit Index (CFI) was .935.
Hu and Bentler (1999) note that fit index values of .95 (or close to it) are indicative of good
Measuring vulnerability to stereotype threat
Electronic Journal of Research in Educational Psychology, N. 14, Vol 6 (1), 2008. ISSN: 1696-2095. pp: 51-64 - 59 -
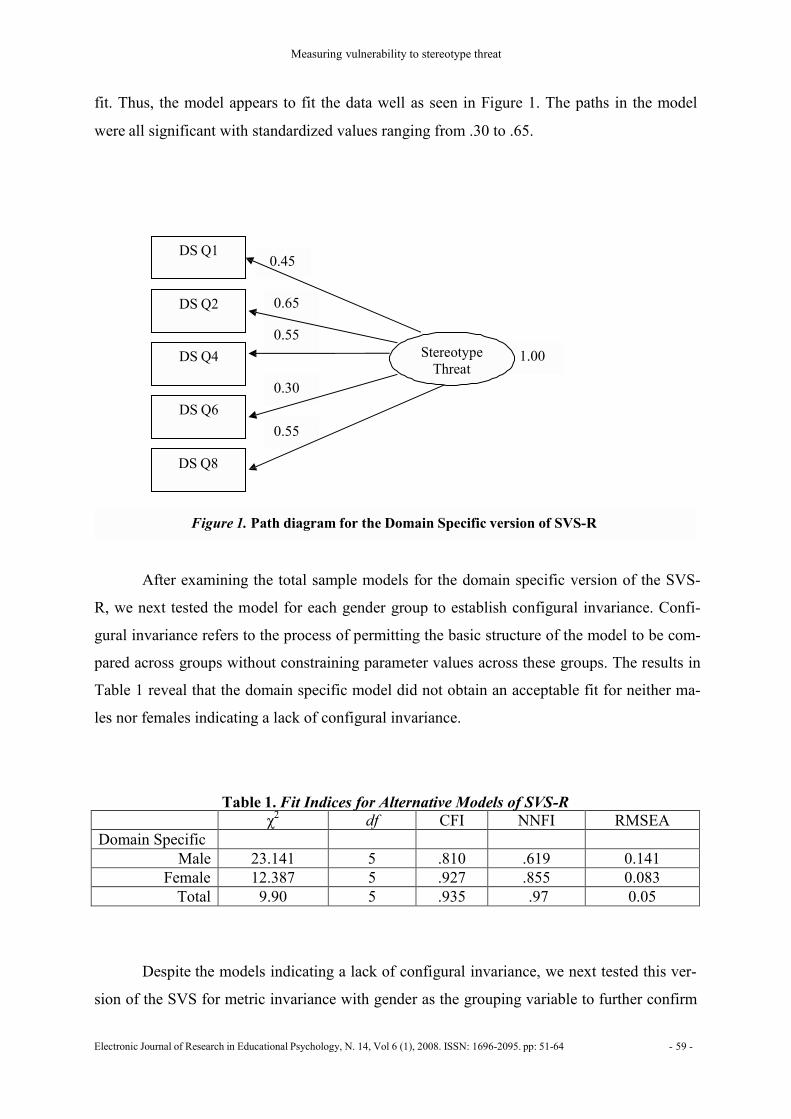
fit. Thus, the model appears to fit the data well as seen in Figure 1. The paths in the model
were all significant with standardized values ranging from .30 to .65.
DS Q1
0.45
DS Q2 0.65
DS Q4
DS Q6
0.55
0.30
0.55
Stereotype
Threat
1.00
DS Q8
Figure 1. Path diagram for the Domain Specific version of SVS-R
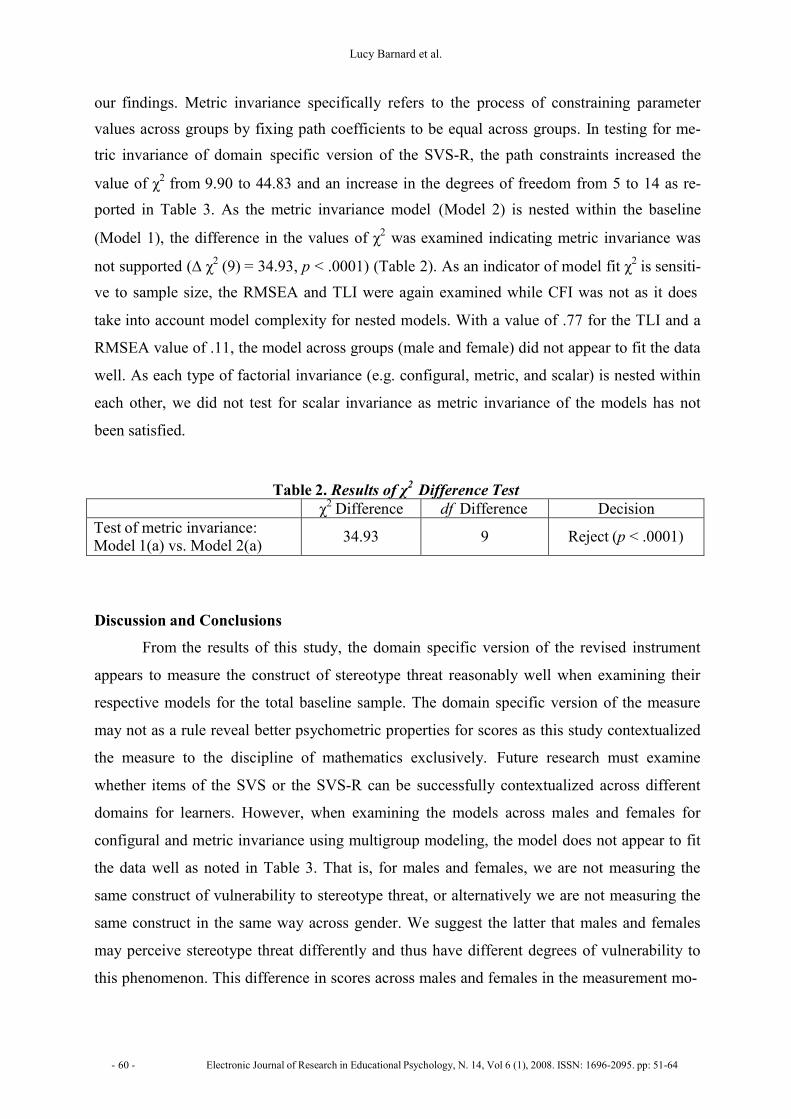
After examining the total sample models for the domain specific version of the SVS-
R, we next tested the model for each gender group to establish configural invariance. Confi-
gural invariance refers to the process of permitting the basic structure of the model to be com-
pared across groups without constraining parameter values across these groups. The results in
Table 1 reveal that the domain specific model did not obtain an acceptable fit for neither ma-
les nor females indicating a lack of configural invariance.
Table 1. Fit Indices for Alternative Models of SVS-R
χ2 df CFI NNFI RMSEA
Domain Specific
Male 23.141 5 .810 .619 0.141
Female 12.387 5 .927 .855 0.083
Total 9.90 5 .935 .97 0.05
Despite the models indicating a lack of configural invariance, we next tested this ver-
sion of the SVS for metric invariance with gender as the grouping variable to further confirm
Lucy Barnard et al.
- 60 - Electronic Journal of Research in Educational Psychology, N. 14, Vol 6 (1), 2008. ISSN: 1696-2095. pp: 51-64
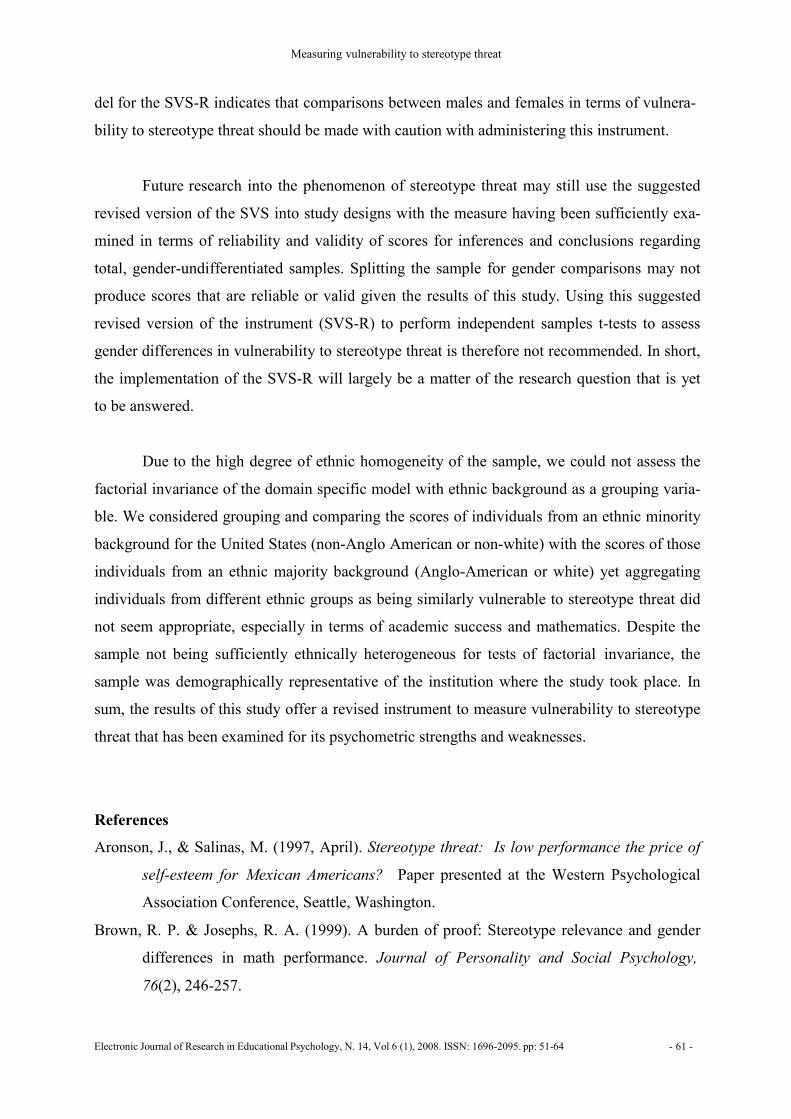
our findings. Metric invariance specifically refers to the process of constraining parameter
values across groups by fixing path coefficients to be equal across groups. In testing for me-
tric invariance of domain specific version of the SVS-R, the path constraints increased the
value of χ2
from 9.90 to 44.83 and an increase in the degrees of freedom from 5 to 14 as re-
ported in Table 3. As the metric invariance model (Model 2) is nested within the baseline
(Model 1), the difference in the values of χ2
was examined indicating metric invariance was
not supported (∆ χ2
(9) = 34.93, p < .0001) (Table 2). As an indicator of model fit χ2
is sensiti-
ve to sample size, the RMSEA and TLI were again examined while CFI was not as it does
take into account model complexity for nested models. With a value of .77 for the TLI and a
RMSEA value of .11, the model across groups (male and female) did not appear to fit the data
well. As each type of factorial invariance (e.g. configural, metric, and scalar) is nested within
each other, we did not test for scalar invariance as metric invariance of the models has not
been satisfied.
Table 2. Results of χ2
Difference Test
χ2
Difference df Difference Decision
Test of metric invariance: Model 1(a) vs. Model 2(a)
34.93
9
Reject (p < .0001)
Discussion and Conclusions
From the results of this study, the domain specific version of the revised instrument
appears to measure the construct of stereotype threat reasonably well when examining their
respective models for the total baseline sample. The domain specific version of the measure
may not as a rule reveal better psychometric properties for scores as this study contextualized
the measure to the discipline of mathematics exclusively. Future research must examine
whether items of the SVS or the SVS-R can be successfully contextualized across different
domains for learners. However, when examining the models across males and females for
configural and metric invariance using multigroup modeling, the model does not appear to fit
the data well as noted in Table 3. That is, for males and females, we are not measuring the
same construct of vulnerability to stereotype threat, or alternatively we are not measuring the
same construct in the same way across gender. We suggest the latter that males and females
may perceive stereotype threat differently and thus have different degrees of vulnerability to
this phenomenon. This difference in scores across males and females in the measurement mo-
Measuring vulnerability to stereotype threat
Electronic Journal of Research in Educational Psychology, N. 14, Vol 6 (1), 2008. ISSN: 1696-2095. pp: 51-64 - 61 -
del for the SVS-R indicates that comparisons between males and females in terms of vulnera-
bility to stereotype threat should be made with caution with administering this instrument.
Future research into the phenomenon of stereotype threat may still use the suggested
revised version of the SVS into study designs with the measure having been sufficiently exa-
mined in terms of reliability and validity of scores for inferences and conclusions regarding
total, gender-undifferentiated samples. Splitting the sample for gender comparisons may not
produce scores that are reliable or valid given the results of this study. Using this suggested
revised version of the instrument (SVS-R) to perform independent samples t-tests to assess
gender differences in vulnerability to stereotype threat is therefore not recommended. In short,
the implementation of the SVS-R will largely be a matter of the research question that is yet
to be answered.
Due to the high degree of ethnic homogeneity of the sample, we could not assess the
factorial invariance of the domain specific model with ethnic background as a grouping varia-
ble. We considered grouping and comparing the scores of individuals from an ethnic minority
background for the United States (non-Anglo American or non-white) with the scores of those
individuals from an ethnic majority background (Anglo-American or white) yet aggregating
individuals from different ethnic groups as being similarly vulnerable to stereotype threat did
not seem appropriate, especially in terms of academic success and mathematics. Despite the
sample not being sufficiently ethnically heterogeneous for tests of factorial invariance, the
sample was demographically representative of the institution where the study took place. In
sum, the results of this study offer a revised instrument to measure vulnerability to stereotype
threat that has been examined for its psychometric strengths and weaknesses.
References
Aronson, J., & Salinas, M. (1997, April). Stereotype threat: Is low performance the price of
self-esteem for Mexican Americans? Paper presented at the Western Psychological
Association Conference, Seattle, Washington.
Brown, R. P. & Josephs, R. A. (1999). A burden of proof: Stereotype relevance and gender
differences in math performance. Journal of Personality and Social Psychology,
76(2), 246-257.
Lucy Barnard et al.
- 62 - Electronic Journal of Research in Educational Psychology, N. 14, Vol 6 (1), 2008. ISSN: 1696-2095. pp: 51-64
Browne, M. W. & Cudek, R. (1993). Alternative ways of assessing models fit. In K. A. Bo-
llen & J. S. Long (Eds.), Testing structural equation models. Newbury Park, CA: SA-
GE.
Croizet, J. & Claire, T. (1998). Extending the concept of stereotype and threat to social class:
The intellectual underperformance of students from low socioeconomic backgrounds.
Personality and Social Psychology Bulletin, 24, 588-594.
Croizet, J., Després, G. Gauzins, M., Huguet, P. Leyens, J. & Méot, A. (2004). Stereotype
threat undermines intellectual performance by triggering a disruptive mental load.
Personality and Social Psychology Bulletin, 30(6), 721-731.
Gonzales, P. Blanton, H., & Williams, K. (2002). The effects of stereotype threat and the
double-minority status on the test performance of Latino Women. Personality and So-
cial Psychology Bulletin, 28(5), 659-670.
Herrnstein, R., & Murray, C. (1994). The Bed Curve: Intelligence and Class Structure in
American Life. Free Press.
Hu, L. & Bentler, P. M. (1999). Cutoff criteria for fit indices in covariance structure analysis:
Conventional criteria versus new alternatives. Structural Equation Modeling, 6, 1-55.
Jencks, C. & Phillips, M. (Eds.). (1998). The Black-White Test Score Gap. Washington, DC:
Brookings Institutuion Press. Retrieved March 21, 2007, from Questia database:
http://www.questia.com/PM.qst?a=o&d=91819577
Inzlicht, M., & Ben-Zeev, T. (2000). A threatening intellectual environment: Why females are
susceptible to experiencing problem-solving deficits in the presence of males, 11(5),
365-371.
Jensen, A. (1969). How Much Can We Boost IQ and Scholastic Achievement? Harvard Edu-
cational Review, 39,1-123.
Joreskog, K. G. (1971). Simultaneous factor analysis in several populations. Psychometrika,
36, 409-426.
Keller, J. & Dauenheimer, D. (2003). Stereotype threat in the classroom: Dejection mediates
the disrupting threat effect on women’s math performance. Society for Personality and
Social Psychology, 29(3), 371-381.
Kray, L. J., Thomspon, L., & Galinsky, A. (2001). Battle of the sexes: Gender stereotype con-
firmation and reactance in negotiations. Journal of Personality and Social Psychology,
80(6), 942-952.
Measuring vulnerability to stereotype threat
Electronic Journal of Research in Educational Psychology, N. 14, Vol 6 (1), 2008. ISSN: 1696-2095. pp: 51-64 - 63 -
MacCallum, R. C., Browne, M. W., & Sugawara, H. M. (1996). Power analysis and determi-
nation of sample size for covariance structure modeling. Psychological Methods, 1,
130-149.
Pinel, E. (1999). Stigma consciousness: the psychological legacy of social stereotypes. Jour-
nal of Personality and Social Psychology, 76, 114-128.
Pronin, E. Steele, C., and Ross, L. (2004). Identity bifurcation in response to stereotype
threat: Women and mathematics. Journal of Experimental Social Psychology, 40,
152-168.
Roberson, L., Deitch, E. A., Brief, A. P., & Block, C. J. (2003). Stereotype threat and feed-
back seeking in the workplace. Journal of Vocational Behavior, 62(1), 176-188.
Spencer, S. J. (1993). The effect of stereotype vulnerability on women’s math performance.
Unpublished doctoral dissertation, University of Michigan, Ann Arbor.
Spencer, S., Steele, C., & Quinn, d. (1999). Stereotype threat and women’s math performan-
ce. Journal of Experimental Social Psychology, 35, 4-28.
Steele, C. (1997). A Threat in the Air: How Stereotypes Shape Intellectual Identity and Per-
formance. American Psychologist, 52(6), 613-29.
Steele, C. M. & Aronson, J. (1995). Stereotype Threat and the intellectual test performance of
African Americans. Journal of Personality and Social Psychology, 69(5), 797-811.
Steele, J., James, J. B., & Barnett, R. C. (2002). Learning in a man’s world: Examining the
perceptions of undergraduate women in male dominated academic areas. Psychology
of Women Quarterly, 26(1), 46-51.
Tabachnick, B. G., and Fidell, L. S. (2007). Using Multivariate Statistics (5th
ed.). Boston:
Allyn and Bacon.
- 64 - Electronic Journal of Research in Educational Psychology, N. 14, Vol 6 (1), 2008. ISSN: 1696-2095. pp: 51-64
[Página en blanco por razones de paginación]