measuring what matters in your agile transformation
TRANSCRIPT
www.agile42.com | All rights reserved. Copyright © 2007 - 2015.
agile42 - The Agile Coaching Company
agile42 | The Agile Coaching Company
Measuring What Matters "in your Agile Transformation
www.agile42.com | All rights reserved. Copyright © 2007 - 2015. agile42 | The Agile Coaching Company
Brad Swanson Enterprise Agile Coach
@bradswanson
www.agile42.com | All rights reserved. Copyright © 2007 - 2015. agile42 | The Agile Coaching Company
Goal PSF NC
Agile Strategy Map™
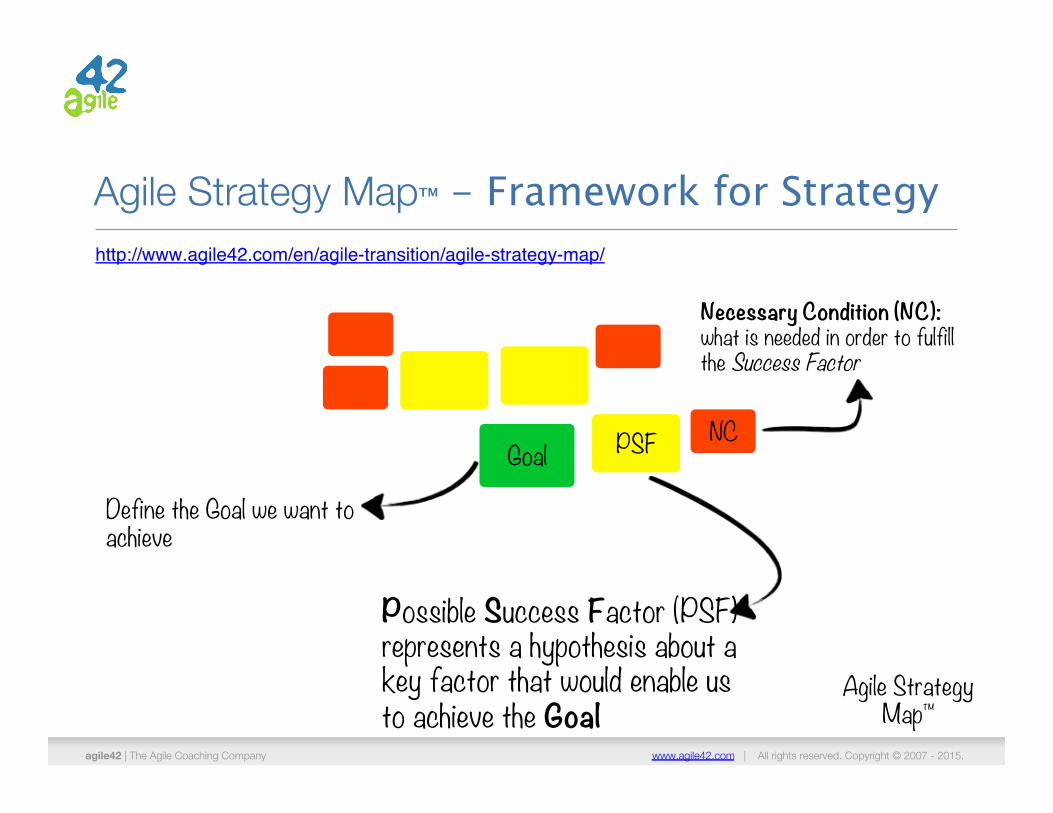
Define the Goal we want to achieve
Possible Success Factor (PSF) represents a hypothesis about a key factor that would enable us to achieve the Goal
Necessary Condition (NC): what is needed in order to fulfill the Success Factor
http://www.agile42.com/en/agile-transition/agile-strategy-map/
Agile Strategy Map™ - Framework for Strategy
www.agile42.com | All rights reserved. Copyright © 2007 - 2015. agile42 | The Agile Coaching Company
Goal CSF#1 NC#1.1
NC#1.2
Agile Strategy Map™
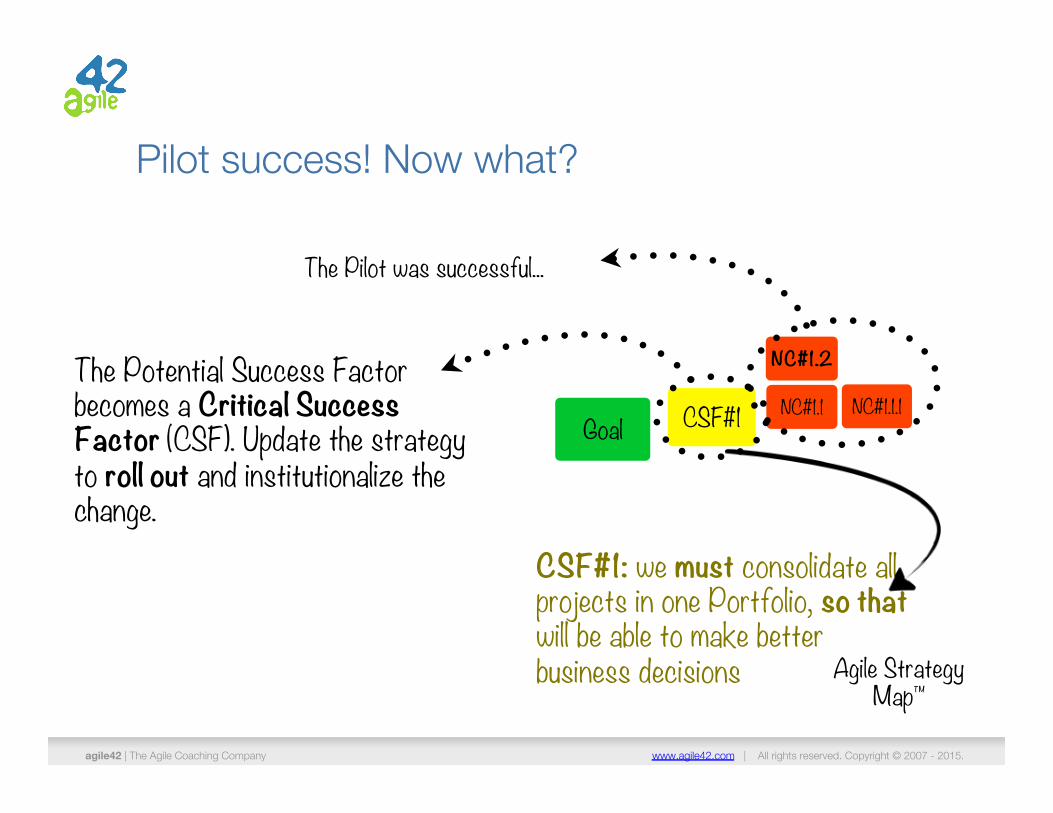
CSF#1: we must consolidate all projects in one Portfolio, so that will be able to make better business decisions
NC#1.1.1
The Pilot was successful...
The Potential Success Factor becomes a Critical Success Factor (CSF). Update the strategy to roll out and institutionalize the change.
Pilot success! Now what?
www.agile42.com | All rights reserved. Copyright © 2007 - 2015. agile42 | The Agile Coaching Company
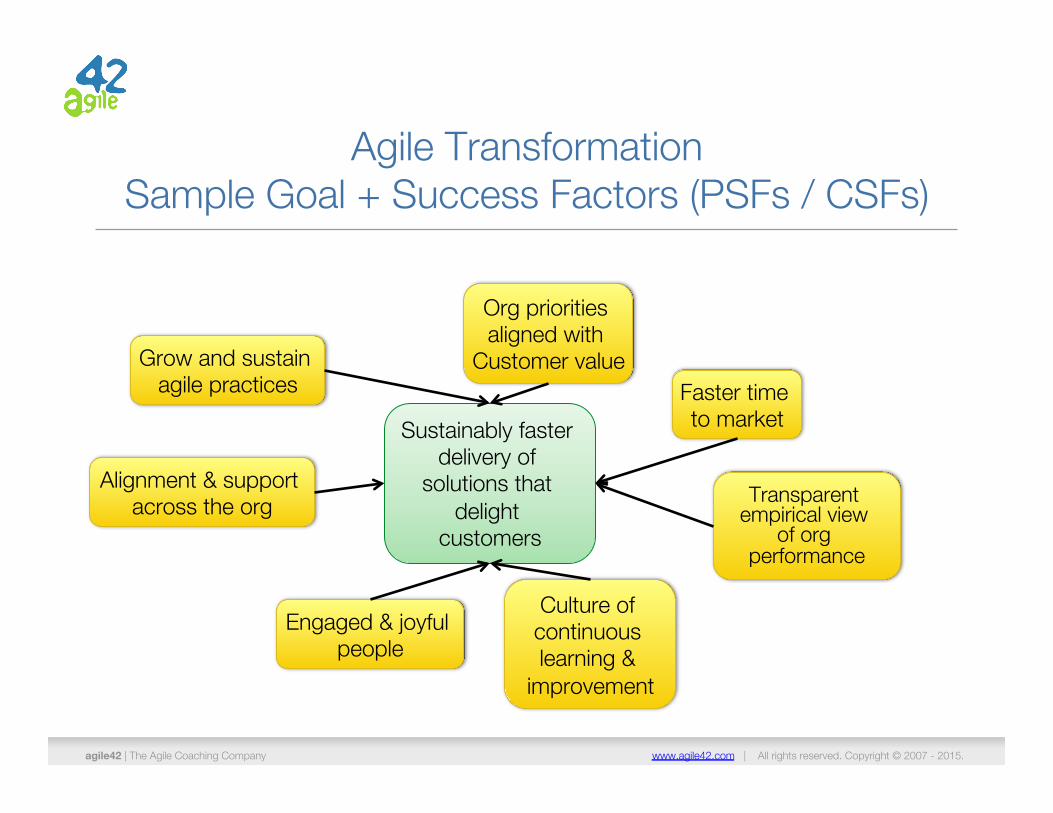
Sustainably faster delivery of
solutions that delight
customers
Faster time to market
Alignment & support across the org
Engaged & joyful people
Transparent empirical view
of org performance
Grow and sustain agile practices
Culture of continuous learning &
improvement
Org priorities aligned with
Customer value
Agile Transformation"Sample Goal + Success Factors (PSFs / CSFs)
www.agile42.com | All rights reserved. Copyright © 2007 - 2015. agile42 | The Agile Coaching Company
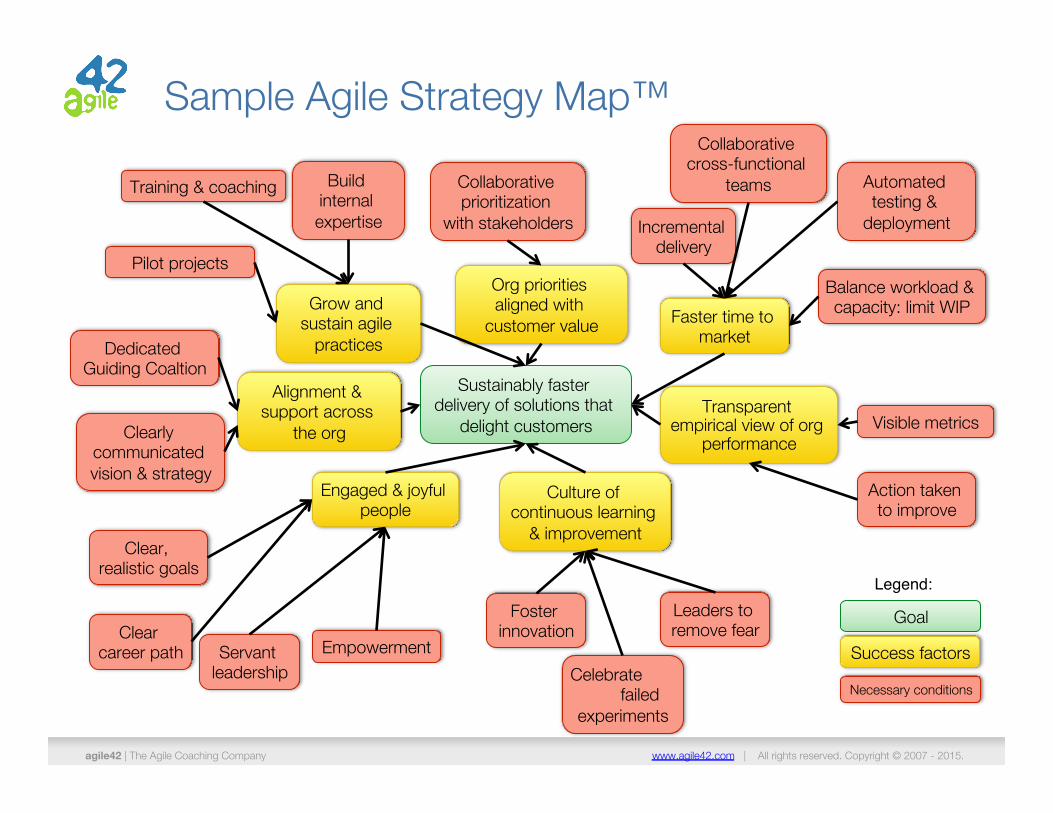
Sustainably faster delivery of solutions that
delight customers
Faster time to market
Balance workload & capacity: limit WIP
Alignment & support across
the org
Engaged & joyful people
Transparent empirical view of org
performance
Grow and sustain agile
practices
Culture of continuous learning
& improvement
Org priorities aligned with
customer value Dedicated "
Guiding Coaltion
Pilot projects
Clearly communicated vision & strategy
Training & coaching Build "internal "expertise
Collaborative prioritization
with stakeholders
Collaborative "cross-functional "
teams Automated testing &
deployment Incremental delivery
Visible metrics
Leaders to remove fear
Empowerment
Clear, "realistic goals
Servant leadership
Action taken to improve
Foster innovation
Celebrate failed "experiments
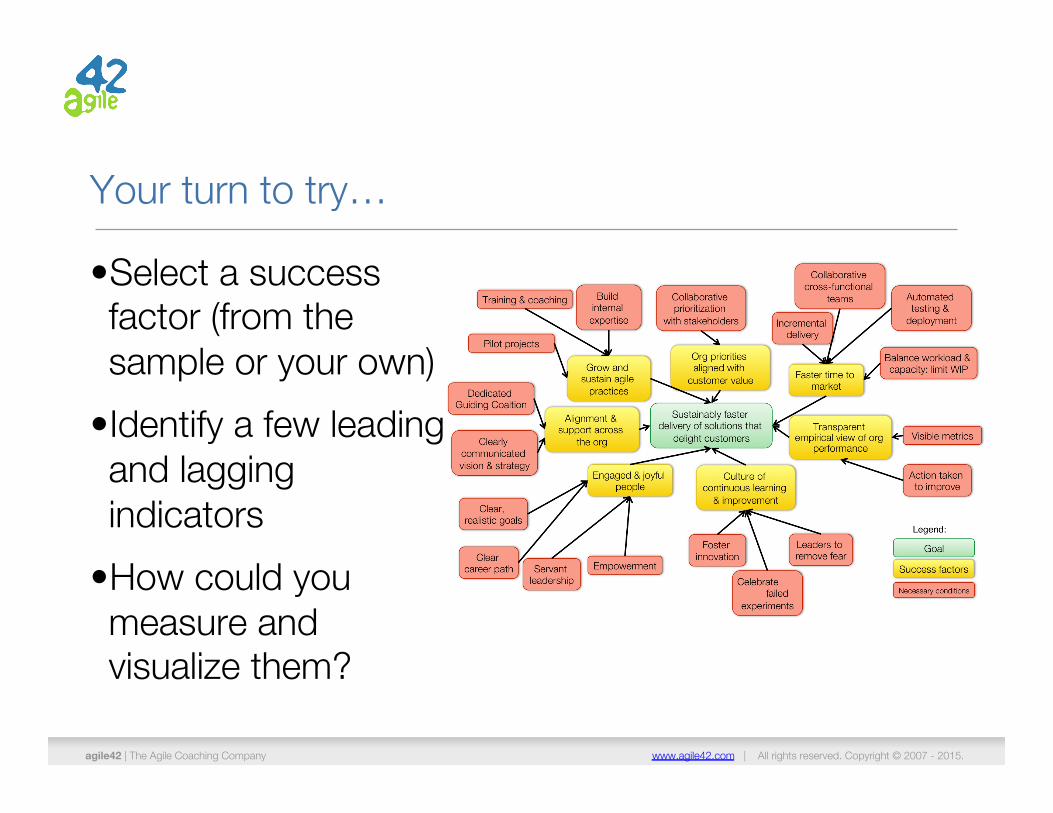
Sample Agile Strategy Map™
Clear career path
Goal
Success factors
Necessary conditions
Legend:
www.agile42.com | All rights reserved. Copyright © 2007 - 2015. agile42 | The Agile Coaching Company
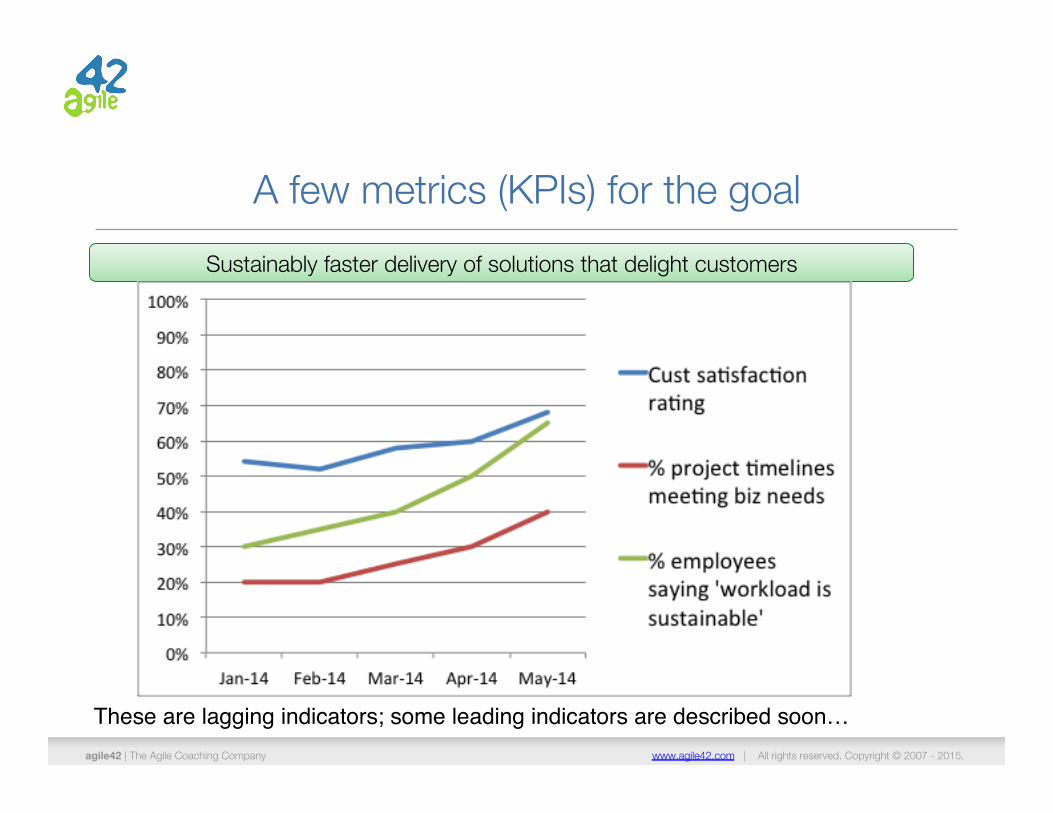
A few metrics (KPIs) for the goal Sustainably faster delivery of solutions that delight customers
These are lagging indicators; some leading indicators are described soon…
www.agile42.com | All rights reserved. Copyright © 2007 - 2015. agile42 | The Agile Coaching Company
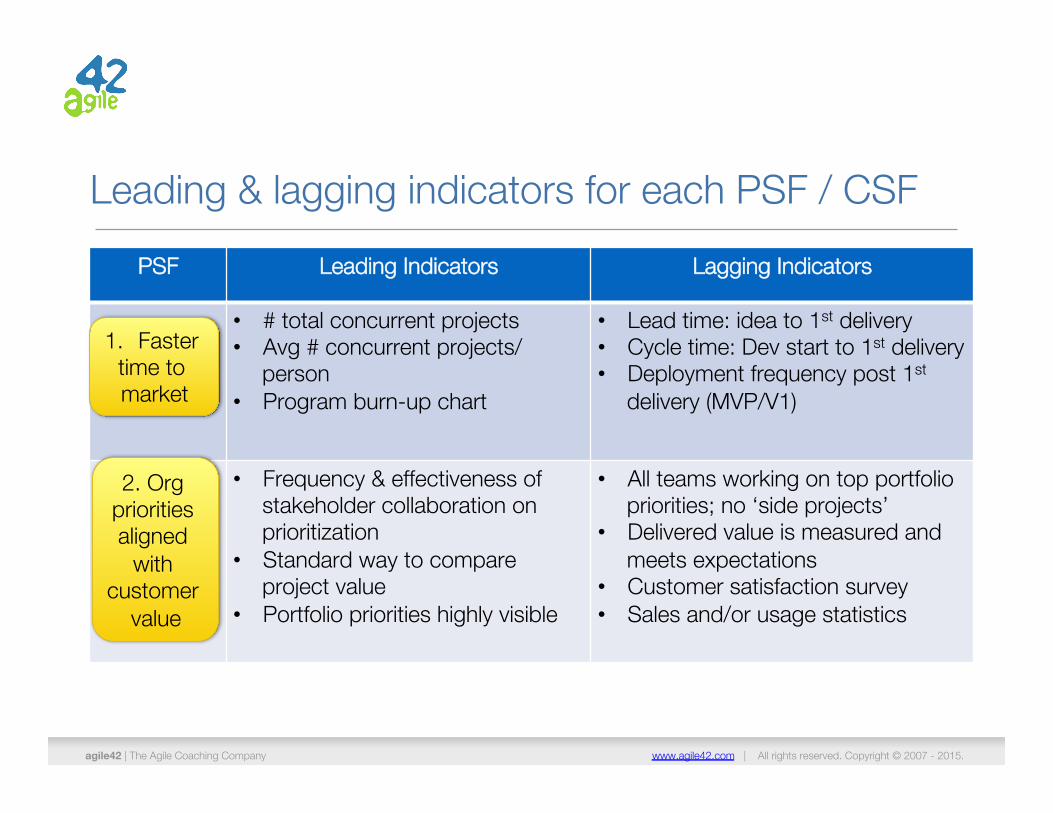
Leading & lagging indicators for each PSF / CSF PSF Leading Indicators Lagging Indicators
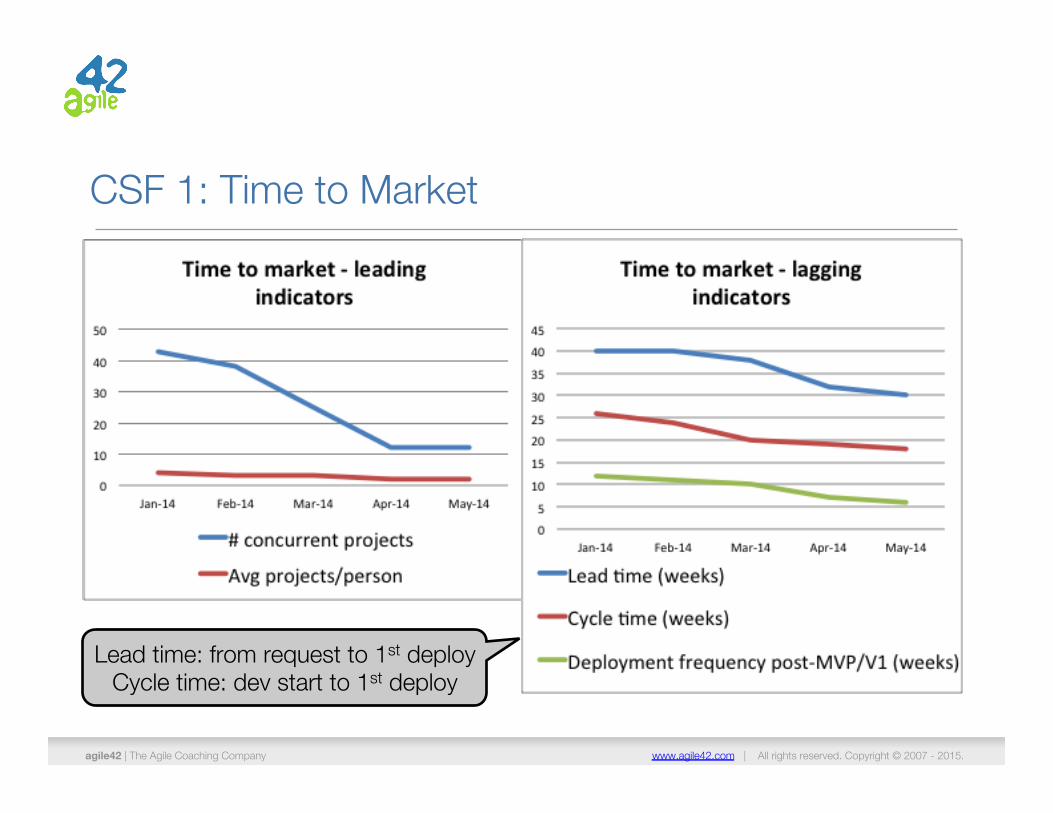
• # total concurrent projects • Avg # concurrent projects/
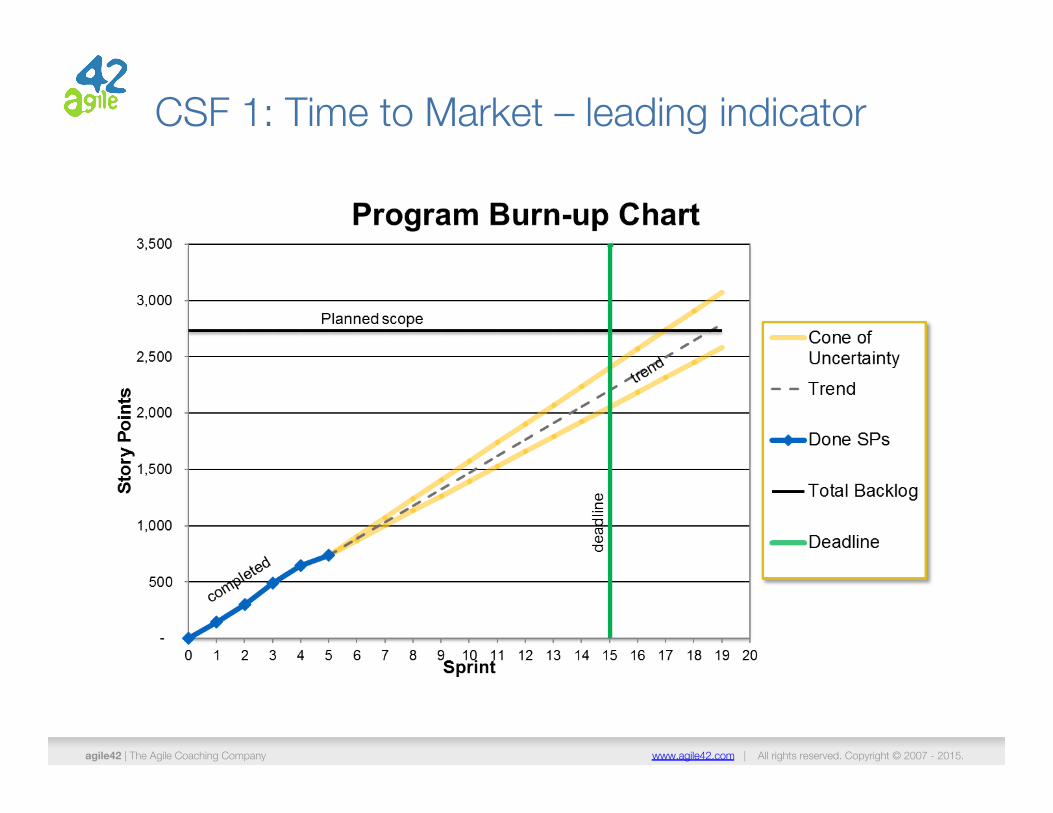
person • Program burn-up chart
• Lead time: idea to 1st delivery • Cycle time: Dev start to 1st delivery • Deployment frequency post 1st
delivery (MVP/V1)
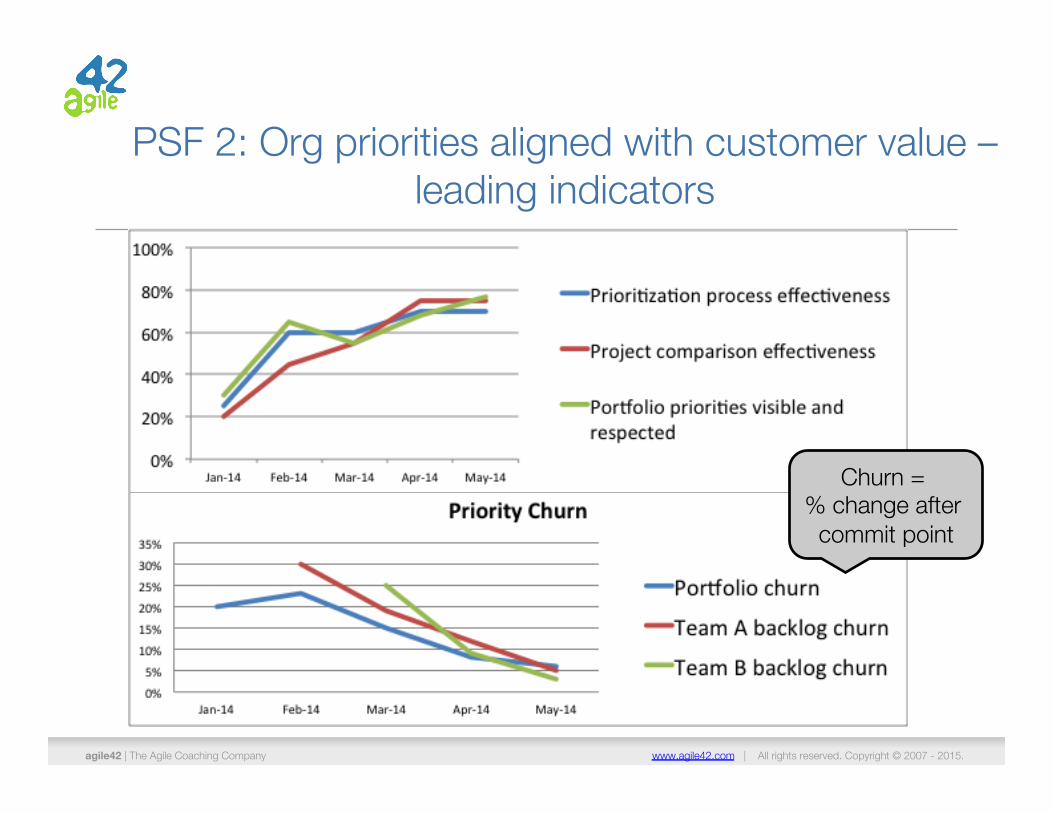
• Frequency & effectiveness of stakeholder collaboration on prioritization
• Standard way to compare project value
• Portfolio priorities highly visible
• All teams working on top portfolio priorities; no ‘side projects’
• Delivered value is measured and meets expectations
• Customer satisfaction survey • Sales and/or usage statistics
1. Faster time to market
2. Org priorities aligned
with customer
value
www.agile42.com | All rights reserved. Copyright © 2007 - 2015. agile42 | The Agile Coaching Company
CSF 1: Time to Market
Lead time: from request to 1st deploy Cycle time: dev start to 1st deploy
www.agile42.com | All rights reserved. Copyright © 2007 - 2015. agile42 | The Agile Coaching Company
CSF 1: Time to Market – leading indicator
agile42 | The Agile Coaching Company www.agile42.com | All rights reserved. Copyright © 2007 - 2015.
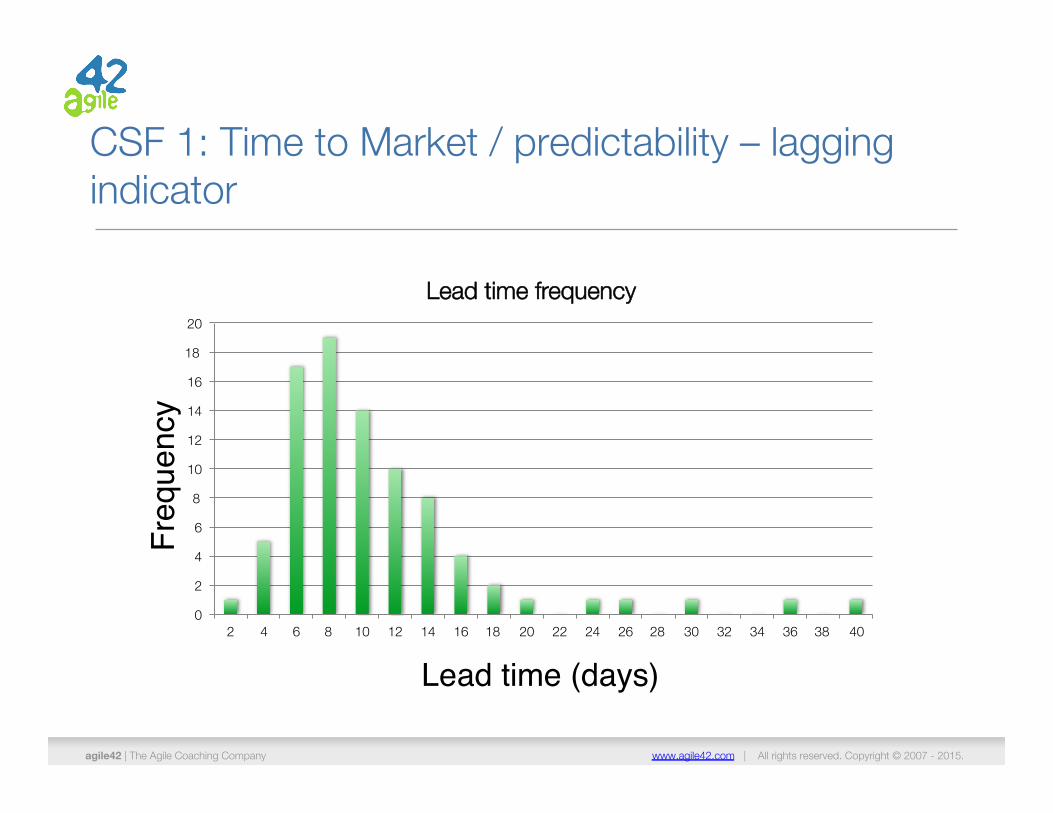
CSF 1: Time to Market / predictability – lagging indicator
0
2
4
6
8
10
12
14
16
18
20
2 4 6 8 10 12 14 16 18 20 22 24 26 28 30 32 34 36 38 40
Lead time frequency
Lead time (days)
Freq
uenc
y
agile42 | The Agile Coaching Company www.agile42.com | All rights reserved. Copyright © 2007 - 2015.
PSF 2: Org priorities aligned with customer value –"leading indicators
Churn = % change after
commit point
agile42 | The Agile Coaching Company www.agile42.com | All rights reserved. Copyright © 2007 - 2015.
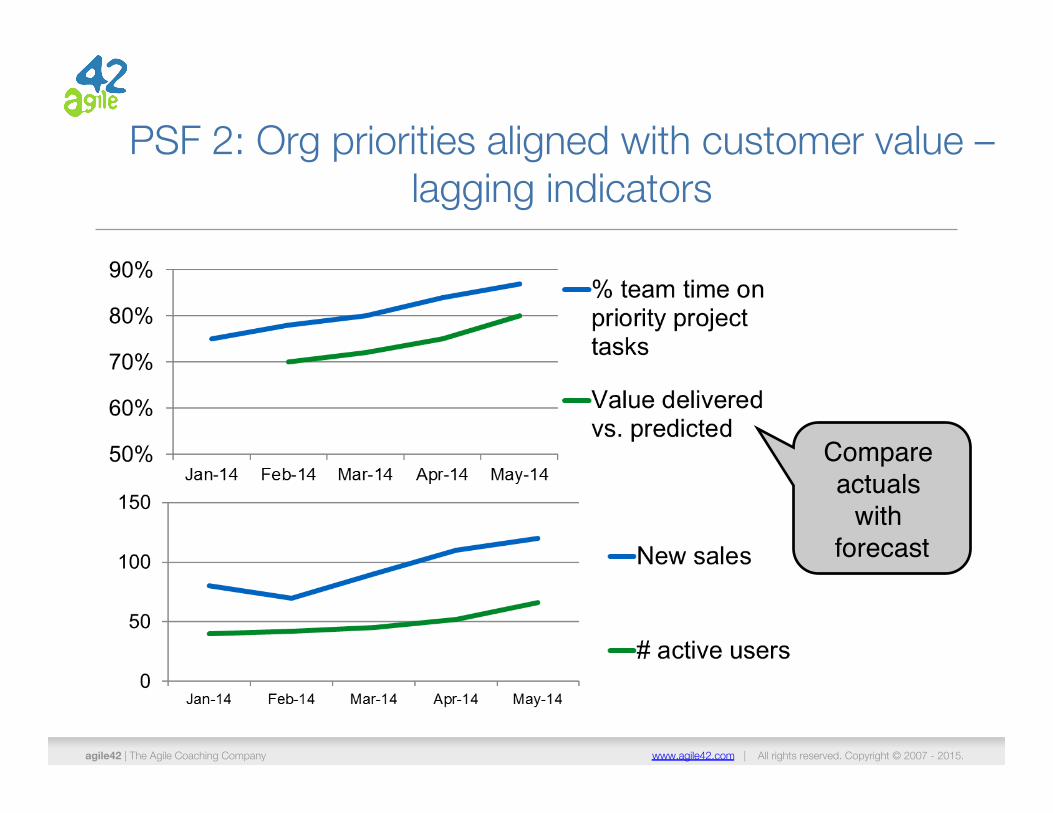
Compare actuals
with forecast
PSF 2: Org priorities aligned with customer value –"lagging indicators
www.agile42.com | All rights reserved. Copyright © 2007 - 2015. agile42 | The Agile Coaching Company
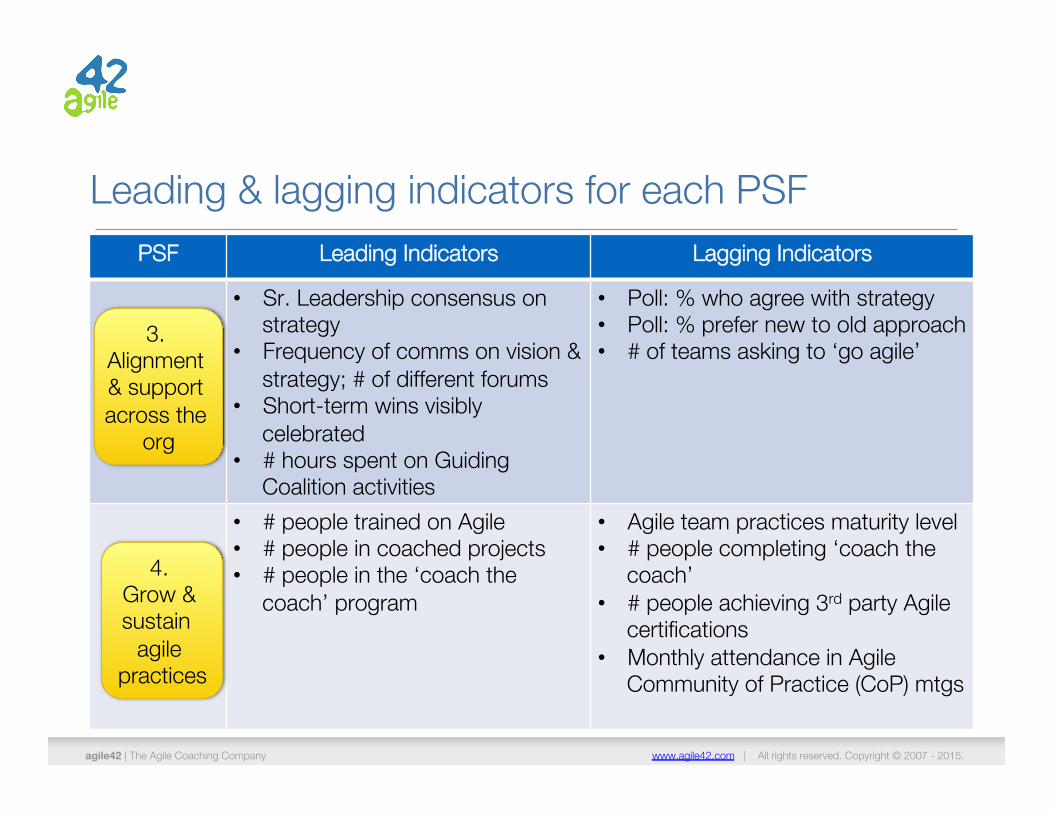
Leading & lagging indicators for each PSF PSF Leading Indicators Lagging Indicators
• Sr. Leadership consensus on strategy
• Frequency of comms on vision & strategy; # of different forums
• Short-term wins visibly celebrated
• # hours spent on Guiding Coalition activities
• Poll: % who agree with strategy • Poll: % prefer new to old approach • # of teams asking to ‘go agile’
• # people trained on Agile • # people in coached projects • # people in the ‘coach the
coach’ program
• Agile team practices maturity level • # people completing ‘coach the
coach’ • # people achieving 3rd party Agile
certifications • Monthly attendance in Agile
Community of Practice (CoP) mtgs
4. Grow & sustain
agile practices
3. Alignment & support across the
org
agile42 | The Agile Coaching Company www.agile42.com | All rights reserved. Copyright © 2007 - 2015.
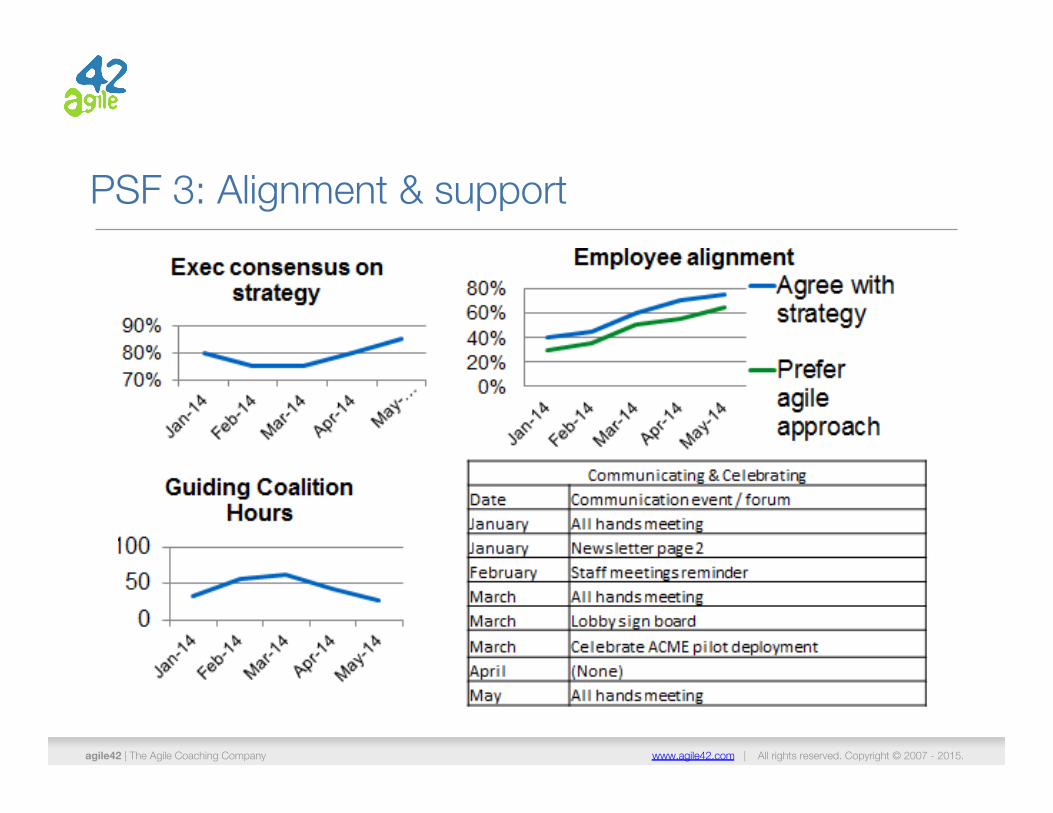
PSF 3: Alignment & support
agile42 | The Agile Coaching Company www.agile42.com | All rights reserved. Copyright © 2007 - 2015.
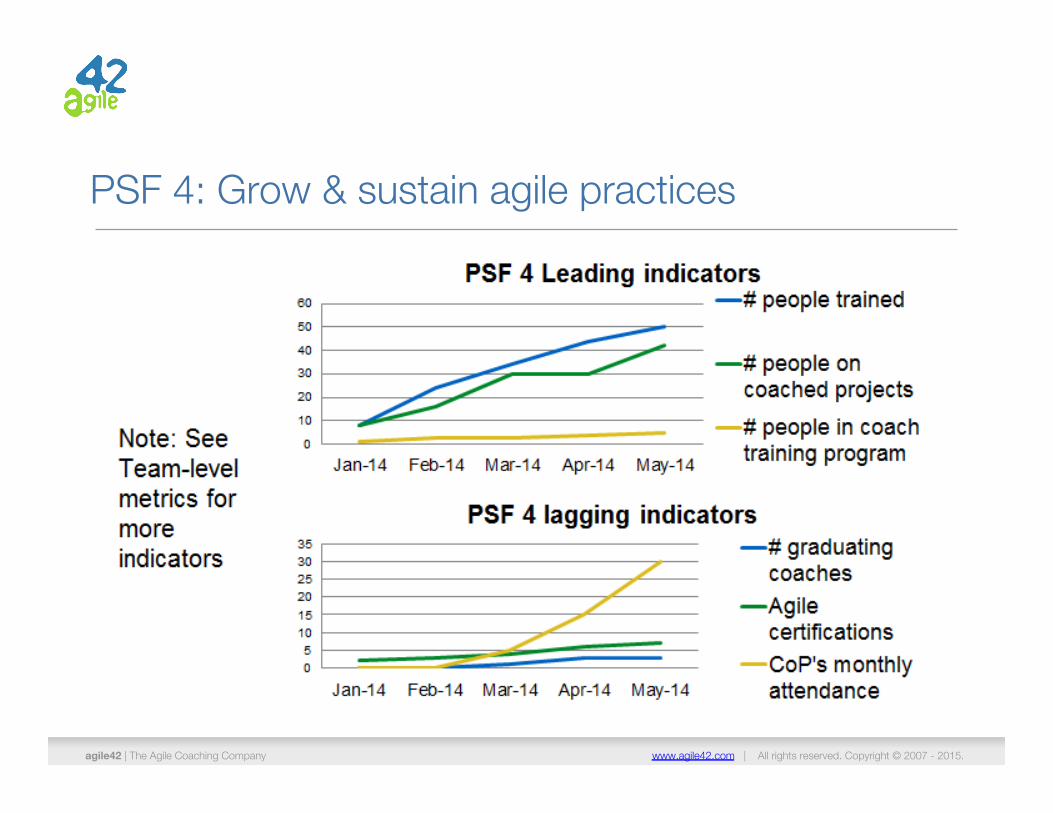
PSF 4: Grow & sustain agile practices
agile42 | The Agile Coaching Company www.agile42.com | All rights reserved. Copyright © 2007 - 2015.
Your turn to try…
• Select a success factor (from the sample or your own)
• Identify a few leading and lagging indicators
• How could you measure and visualize them?
agile42 | The Agile Coaching Company www.agile42.com | All rights reserved. Copyright © 2007 - 2015.
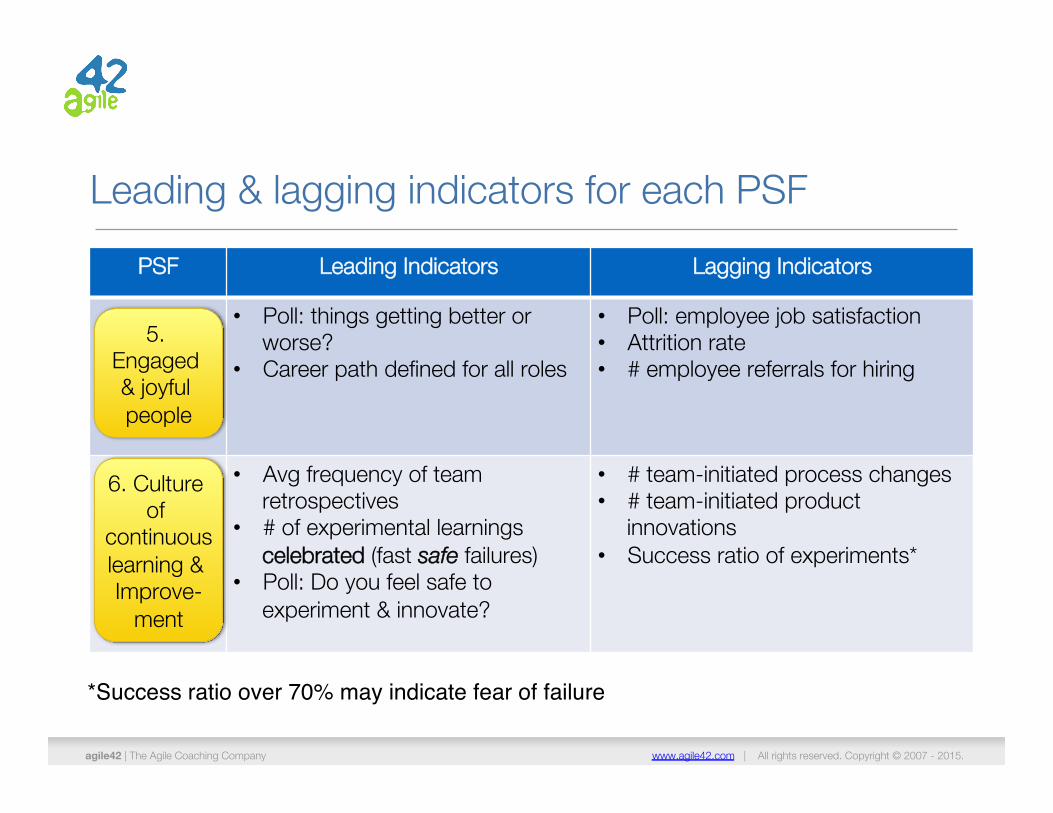
Leading & lagging indicators for each PSF
*Success ratio over 70% may indicate fear of failure
PSF Leading Indicators Lagging Indicators
• Poll: things getting better or worse?
• Career path defined for all roles
• Poll: employee job satisfaction • Attrition rate • # employee referrals for hiring
• Avg frequency of team retrospectives
• # of experimental learnings celebrated (fast safe failures)
• Poll: Do you feel safe to experiment & innovate?
• # team-initiated process changes • # team-initiated product
innovations • Success ratio of experiments*
5. Engaged & joyful people
6. Culture of
continuous learning & Improve-
ment
www.agile42.com | All rights reserved. Copyright © 2007 - 2015.
agile42 - The Agile Coaching Company
agile42 | The Agile Coaching Company
Attack of the Killer Metrics!"
"When metrics
go bad…
agile42 | The Agile Coaching Company www.agile42.com | All rights reserved. Copyright © 2007 - 2015.
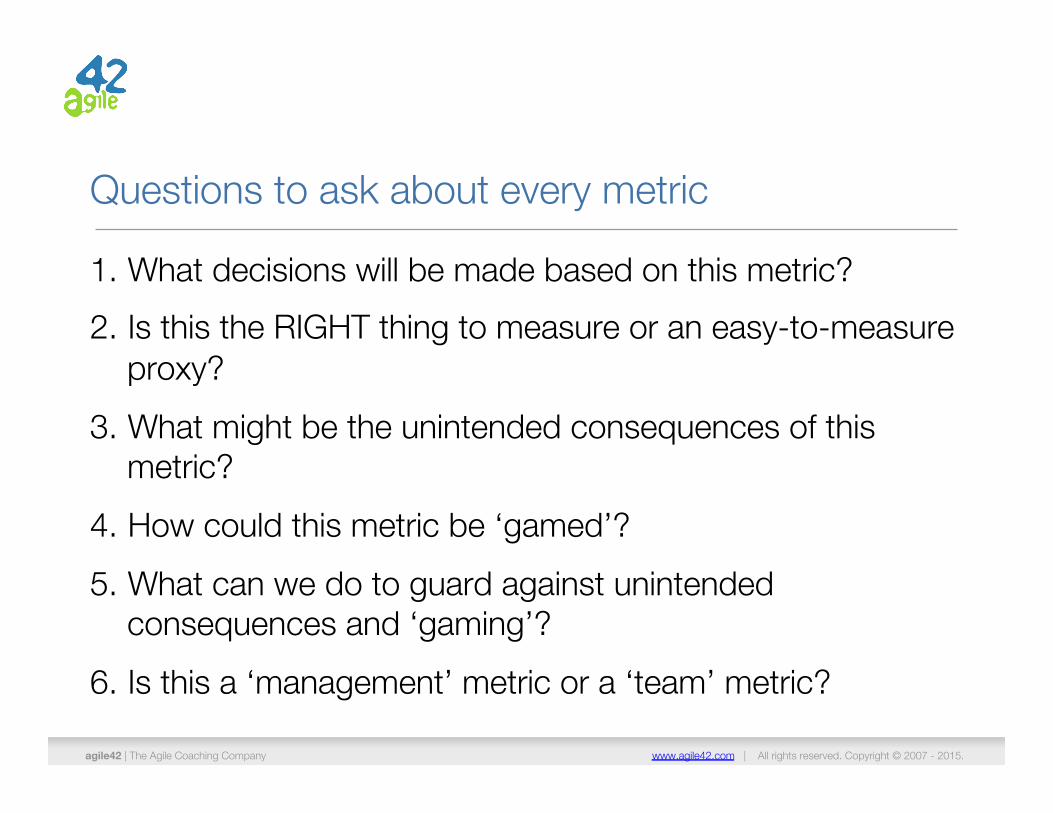
Questions to ask about every metric
1. What decisions will be made based on this metric? 2. Is this the RIGHT thing to measure or an easy-to-measure
proxy? 3. What might be the unintended consequences of this
metric? 4. How could this metric be ‘gamed’? 5. What can we do to guard against unintended
consequences and ‘gaming’? 6. Is this a ‘management’ metric or a ‘team’ metric?
agile42 | The Agile Coaching Company www.agile42.com | All rights reserved. Copyright © 2007 - 2015.
Compensating / Balancing Metrics
• What unintended consequences might happen if you measure speed of delivery?
• What is a compensating metric to counteract it? • Measure speed AND quality!
www.agile42.com | All rights reserved. Copyright © 2007 - 2015. agile42 | The Agile Coaching Company
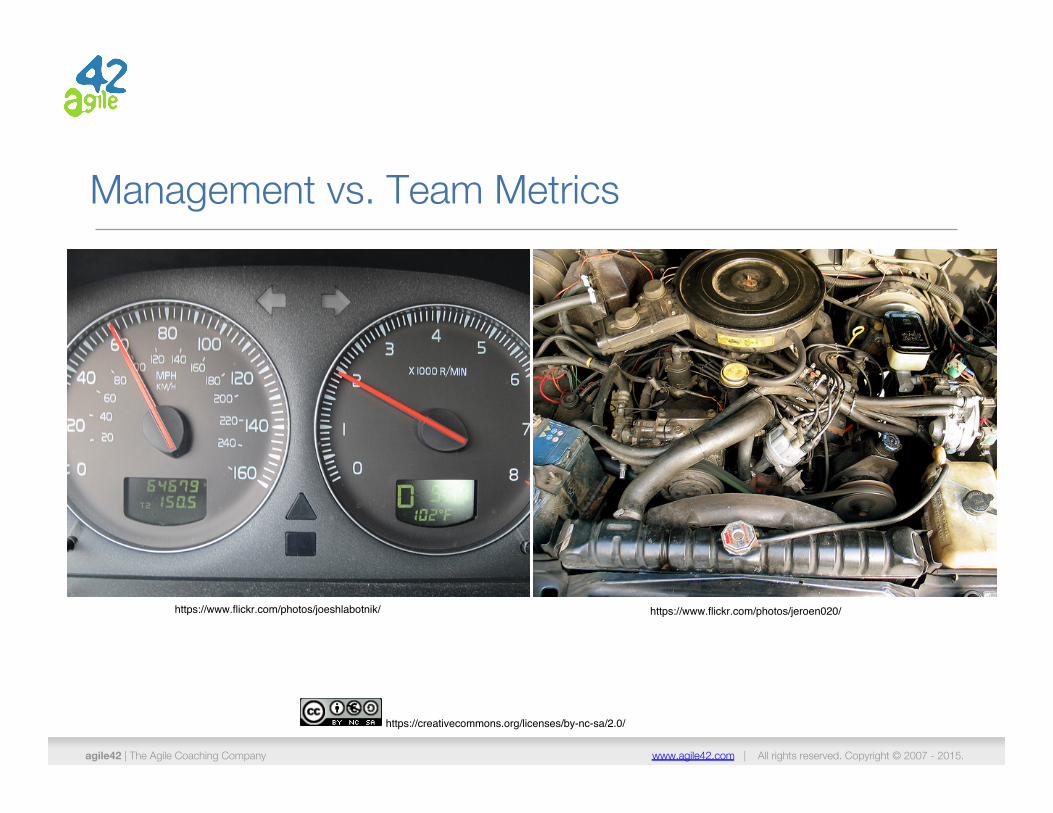
Management vs. Team Metrics
https://creativecommons.org/licenses/by-nc-sa/2.0/
https://www.flickr.com/photos/joeshlabotnik/ https://www.flickr.com/photos/jeroen020/
agile42 | The Agile Coaching Company www.agile42.com | All rights reserved. Copyright © 2007 - 2015.
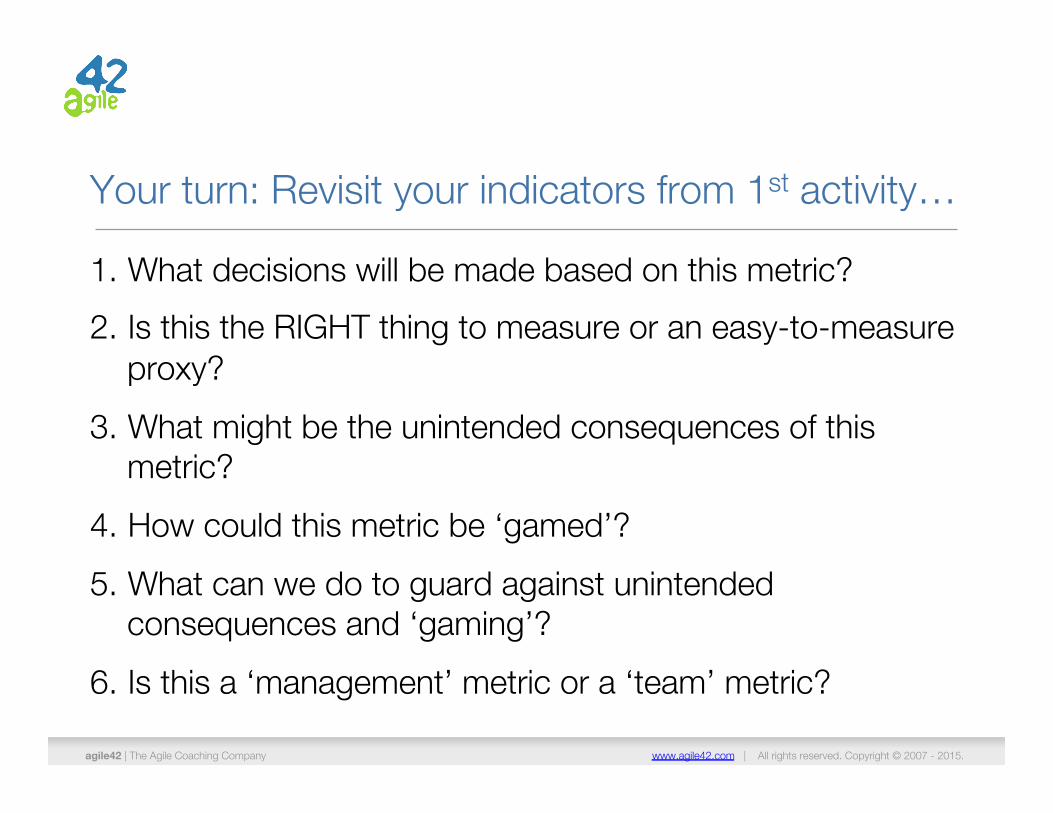
Your turn: Revisit your indicators from 1st activity…
1. What decisions will be made based on this metric? 2. Is this the RIGHT thing to measure or an easy-to-measure
proxy? 3. What might be the unintended consequences of this
metric? 4. How could this metric be ‘gamed’? 5. What can we do to guard against unintended
consequences and ‘gaming’? 6. Is this a ‘management’ metric or a ‘team’ metric?
www.agile42.com | All rights reserved. Copyright © 2007 - 2015.
agile42 - The Agile Coaching Company
agile42 | The Agile Coaching Company
Thank you!
Brad Swanson Senior Agile Coach
@bradswanson