mechanical and physical properties of concrete containing...
TRANSCRIPT

1
MECHANICAL AND PHYSICAL PROPERTIES OF CONCRETE CONTAINING FGD WASTE
J M Khatib1*, (BEng, MSc, PhD, CEng, FHEA), Professor Faculty of Science and Engineering, University of Wolverhampton, Wulfruna Street, Wolverhampton, WV1 1LY; Email: [email protected] P S Mangat2, (PhD, CEng), Director Centre for Infrastructure Management, MERI, Sheffield Hallam University, Howard Street, Sheffield, S1 1WB, UK; Email: [email protected] L Wright3, (PhD), Senior Structural Engineer Pick Everard, Halford House, Charles Street, Leicester, LE1 1HA, UK; Email: [email protected] *Corresponding author: Faculty of Science and Engineering, University of Wolverhampton, Wulfruna Street, Wolverhampton, WV1 1LY; Email: [email protected] Article type: Paper Date text reviewed: 15 May 2015
Number of words in your main text and tables, followed by the number of figures:
Manuscript (4692) + Table (86) = 4831 2 Tables 10 Figures
2
MECHANICAL AND PHYSICAL PROPERTIES OF CONCRETE CONTAINING FGD WASTE
J M Khatib1*, (BEng, MSc, PhD, CEng, FHEA), Professor Faculty of Science and Engineering, University of Wolverhampton, Wulfruna Street, Wolverhampton, WV1 1LY; Email: [email protected] P S Mangat2, (PhD, CEng), Professor & Director Centre for Infrastructure Management, MERI, Sheffield Hallam University, Howard Street, Sheffield, S1 1WB, UK; Email: [email protected] L Wright3, (PhD), Senior Structural Engineer Pick Everard, Halford House, Charles Street, Leicester, LE1 1HA, UK; Email: [email protected] *Corresponding author: Faculty of Science and Engineering, University of Wolverhampton, Wulfruna Street, Wolverhampton, WV1 1LY; Email: [email protected]
Abstract
The paper is part of a wide ranging research project on the optimum use of waste from the dry and
semi dry flue gas desulphurisation (FGD) processes in concrete. It examines the influence of a typical
simulated desulphurised waste (SDW) on the physical and mechanical and physical properties of
concrete. SDW was chosen due to the wider variability in the composition of actual FGD waste. Two
binder systems were investigated (i) cement and SDW (C-SDW) and (ii) cement, slag and SDW (C-S-
SDW). The SDW content ranged from 0-70% and the slag from 0-90% as partial replacement of the
cement. The properties examined included compressive and flexural strength, water absorption,
shrinkage and expansion. The results showed that replacing cement with SDW beyond 20%
systematically reduce strength. An increase in SDW reduces shrinkage. The presence of small
amounts of slag allows the use of high proportions of SDW. The use of desulphurised waste in
concrete applications is possible as adequate strength can be achieved.
Keywords: concrete technology & manufacture, recycling & reuse of materials, environment.
3
1. Introduction
The presence of certain amounts of gypsum (G) in concrete affects its strength. Lerch (1946) reported
that gypsum in cement generally increased strength. However, the optimal G content depends mainly
on the clinker used. The three main factors influencing optimum G content are fineness, C3A content
and the alkalis (Na2O, K2O) present in the clinker used. The presence of sulphate in blended cement
containing slag, fly ash and silica fume improve performance (Poon et al 2001; Wang & Song 2013).
Bentur (1976) and Shiyuan (1982) reported that incorporating between 2-4% G in cement paste leads
to an increase in strength whereas reduction occurs beyond this level. Increasing the G content
increases the C/S ratio of the C-S-H formed, which corresponded to a decrease in strength of the C-S-
H gel. The strength of mortars was found to decrease as the G content increased, irrespective of the
curing condition.
The large variation in composition of coal combustion wastes form dry and semi-dry desulphurisation
process means that the strength properties of binders containing such wastes are significantly
different. There have been attempts to investigate the strength of such materials in cement-based
systems and non-cement based systems, however, the results seem specific to each investigation
(Jeppesen 1990). Demirbas and Aslan (1999) reported that using desulphurised wastes, reduced the
early strength however, the strength at 28 days was either equal to or greater than the reference. It
was suggested that the strength was dependent on the composition of the waste, and an increase in
the SiO2+Al2O3+Fe2O3 (SAF) resulted in a strength decrease. Wastes containing high SAF contents
are generally classified as pozzolanic and, therefore, the positive effects of these ashes may not have
been observed during the first 28 days. The wastes that performed the best were low in SAF and
consisted mainly of CaO and are similar to fly ash with high lime contents (ASTM Class C), which
exhibit both cementitious and pozzolanic properties.
Spray dry absorption wastes (SDA) are a semi-dry waste and consist of fly ash, sulphates and
sulphites. Cornelissen (1991) reported the strength of concretes containing simulated SDA waste with
various sulphate-sulphite ratios. As with other desulphurised wastes, the setting times were slightly
retarded meaning that strength development was slightly slower. After 28 days, the strength of the
SDA mixes was significantly lower than the reference and increasing the sulphate-sulphite ratio
decreased the strength. Drottner and Havlica (1997) indicated the strength development properties of
mortars containing fluidised bed combustion ash (FBC) and found the strength is dependent on the
content of FBC in the mix and the age of curing.
In this paper, an experimental investigation was carried out to evaluate the properties of concrete
containing FGD waste to partially replace the cement. Due to the wider variability in compositions of
actual FGD waste, simulated desulphurised waste (SDW) was used which was a blend of fly ash and
gypsum. In addition, the influence of including ground granulated blastfurnace slag in these binder
systems on concrete properties was investigated. The properties determined were consistence,
density, compressive and flexural strength, water absorption and length change.

4
2. Experimental
2.1 Materials
A standard 42.5N cement (C) and fly ash (FA) conformed to BS12: 1996 and BS3892: 1997
respectively. Ground granulated blastfurnace slag (S) conforming to BS6699: 1992 and wallboard
grade quality Gypsum (G) with a CaSO4.2H2O purity of 95% were used. The typical simulated
desulphurised waste (SDW) was a blend of 15% gypsum and 85% fly ash to achieve an SO3 content
of 8.87% by weight (Khatib et al, 2008). The fine aggregate used was class M sand in accordance
with BS 882:1983. The coarse aggregate was crushed 10mm single sized aggregate in accordance
with BS 882:1983. Further information on chemical and physical properties of the constituent materials
is given elsewhere (Mangat et al, 2006; Khatib et al, 2013).
2.2 Mix proportions
A total of 13 mixes were used to determine the mechanical and physical properties of concrete
containing SDW. The proportions by weight of binder to fine aggregate to coarse aggregate were
1:2:3.5 respectively. The water/binder was 0.5. The binder consists of cement and all cement
replacement materials. The replacement materials include slag (S) and simulated desulphurised
waste.
Mix 1 represents a reference mix [REF(100c)] where the binder is 100% cement. Mixes 2 to 7 contain
different blends of cement (C) and a typical simulated desulphurised waste (SDW) and were referred
to as C-SDW. The cement was replaced with increasing levels of SDW from 0 to 90%. The proportion
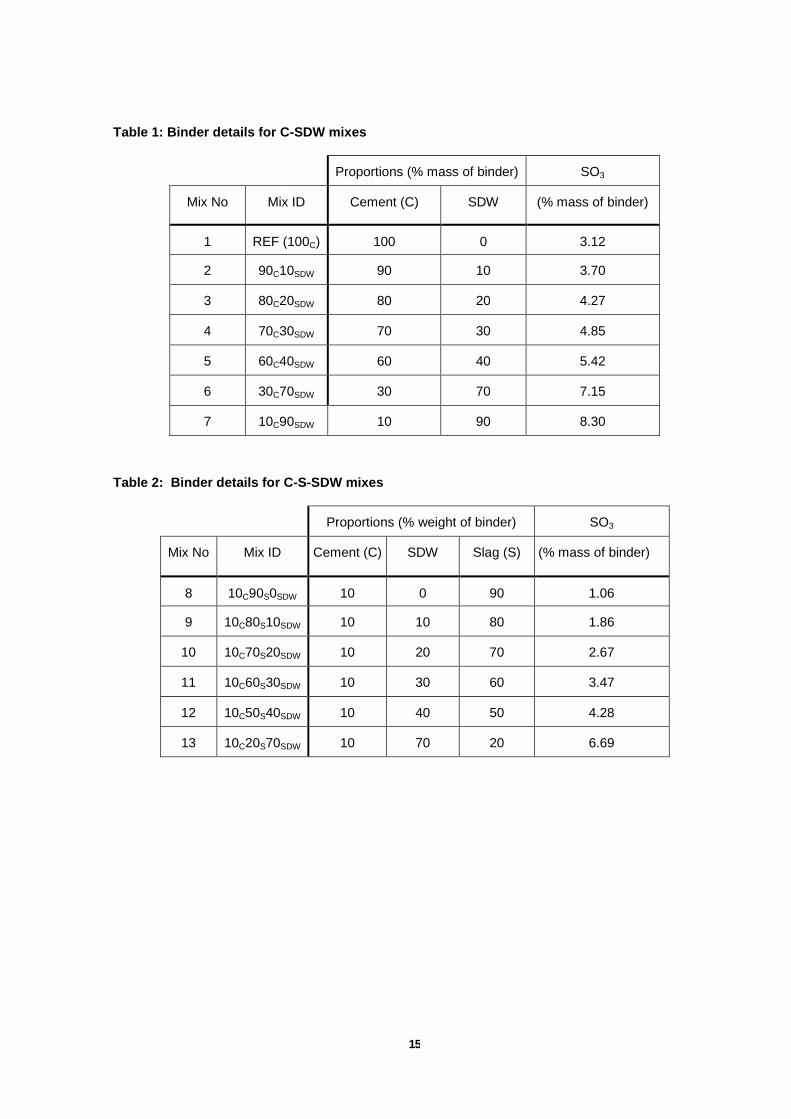
of the SDW was 85% fly ash and 15% gypsum. Table 1 shows the proportion of the mixes
investigated. The mix ID (column 2) in mixes 2 to 7 represents the constituents of the binder. For
example, mix 70C30SDW represents a binder containing 70% cement and 30% of SDW by mass of
binder. Columns 3 and 4 show the cement (C) and typical simulated desulphurised waste (SDW)
contents respectively.
Mixes 8 to 13 contain different blends of C, S and SDW (C-S-SDW blends). The C content was kept
constant at 10% to initiate the reactivity of the slag and to maximise waste content. The slag content
ranged from 90 to 20%, and the SDW content ranged from 0 to 70%. Table 2 shows the proportions of
C-S-SDW mixes. The mix ID (column 2) of mixes 8 to 13 represents the constituent of the binder. For
example mix 10C70S20SDW represents a binder containing 10% cement, 70% slag and 20% SDW by
weight of binder. Columns 3 to 5 show the C, S and SDW content respectively.
2.3 Casting
For each mix, eighteen 100mm cubes, six 75mm cubes and four 75mm x 75mm x 300mm prisms
were cast in steel moulds. After casting, all specimens were placed in a mist curing room at 20ºC±1ºC
and 95%±5% relative humidity until demoulding. For most specimens the initial mist curing was for 24
hours, however, several specimens required a longer initial period due to an increase in setting times.
Theses generally included C-SDW blends that contained large amounts of gypsum and all the C-S-
SDW blends (i.e. mixes 8-13), in which case the specimens were left for a further 24 hours in the mist
5
room. After demoulding, all cubes and two of the prisms were cured in water at 20ºC until testing. The
other two prisms were continuously cured in air at 20ºC±1ºC and 60%±5% relative humidity.
2.4 Testing
The consistence of concrete was measured using the slump and Vebe tests in accordance with British
Standard (BS EN 12350-3, 2009) and (BS EN 12350-2, 2009) respectively.
Compressive strength was conducted on the 100mm cubes at 1 day, 7, 28, and 365 days according to
British Standard (BS EN 12390-3, 2009).
Water absorption was carried out on the 75mm cubes. Measurements were taken at 28, 90 and 365
days. At the desired age, samples were removed from the water, oven dried at 105ºC±5ºC until a
constant mass was achieved. This took approximately 48 hours. The samples were then cooled for 24
hours in a desiccator over silica gel crystals. After drying the samples were submerged in water to a
depth of 25mm±5 mm below the water surface. The increase in mass due to absorption of water was
then recorded after 30 minutes. The water absorption was expressed as a percentage of the original
dry mass of the sample.
Drying shrinkage and expansion were conducted on the prisms which were cured in air at 20ºC,
65%RH and in water respectively. Two steel demec discs were fixed to each of the longitudinal faces
of the prisms at a spacing of 200mm. Therefore, each measurement is the average of eight readings.
At the end of the length change monitoring period, flexural strength test was carried out on the prisms
in accordance with British Standard (BS EN 12390-5, 2009).
3. Results
3.1 Consistence
Figure 1 (a & b) shows the consistence of concrete containing C-SDW and C-S-SDW blends
respectively. Both slump and Vebe time are plotted with respect to SDW content. Generally, an
increase of simulated desulphurised waste (SDW) content reduced consistence. Based on the Vebe
time recorded, an increase in the SDW content from 0 to 70% changed the mix from a stiff plastic to
an extremely dry mix. The replacement of cement with S in mix 10C90S0SDW increased consistence
(Figure 1-b). The consistence of the C-S-SDW concrete was reduced when S was replaced with
increasing levels of SDW. The consistence was significantly reduced when the SDW content
exceeded 40%, after which the mix classification goes from stiff to extremely dry based on the Vebe
time test (Neville 2011). The consistence of C-SDW and C-S-SDW concretes is similar for equivalent
SDW contents.
3.2 Compressive strength
The influence of SDW content on the compressive strength of concretes containing C-SDW blends
(mixes 1-7) at the different curing times is shown in Figure 2. The use of 10% SDW as partial
replacement of cement is beneficial especially with regard to long-term strength in that the strength is
higher than the reference. At 20% SDW replacement the long-term strength is equivalent to the
control. Replacement levels beyond 20% SDW cause a gradual decrease in strength with increasing

6
amounts of SDW. At 90% SDW the long-term strength is 75% less than the reference. The relative
strength (RS) to the control for the majority of C-SDW blends decreased during the first 7 days of
curing. Between 7 and 90 days of curing, there is large increase in RS for all C-SDW concretes
indicating higher rate of strength development. After 90 days the rate of increase in RS is slowed down
but still higher than the reference.
Replacing cement with 10% SDW (mix 90C10SDW), slightly retards the strength up to 7 days compared
to the reference. After 7 days, an increase in strength was observed, and the strength surpassed the
reference between 28 and 90 days. After 90 days, the strength continued to increase and at 365 days,
it was 20% higher than the reference.
An increase in the SDW content from 10% to 40% decreased the RS. A negative effect on the rate of
RS development was observed during the first seven days. Between 7 and 28 days, a large increase
in RS was observed. After 90 days, the rate of increase in RS was similar to the mix containing 10%
SDW, and greater than the reference mix. At 20% SDW replacement, the strength was equal to the
reference mix at 365 days. Mixes containing 30% and 40% SDW exhibit a RS of 90% and 85%
respectively at 365 days of curing.
The RS at of mixes 30C70SDW and 10C90SDW during the first seven days, was very low. Between 7 and
28 days, both mixes exhibit a similar rate of increase in RS, which was greater than that exhibited by
the reference. Between 28 and 90 days, the mix containing 70% SDW, exhibited a similar rate of RS
development as other mixes but the 90% SDW mix did not exhibit an increase in RS.
The compressive strength of concretes containing C-S-SDW blends are shown in Figure 3. In general,
all mixes exhibit a decrease in strength compared to the reference at all ages. At 7 days, all C-S-SDW
concretes exhibit an RS of approximately 30%. After 7 days, the increase in RS is negligible for all C-
S-SDW concretes, and at 365 days the RS is between 35% and 50%.
3.3 Flexural strength
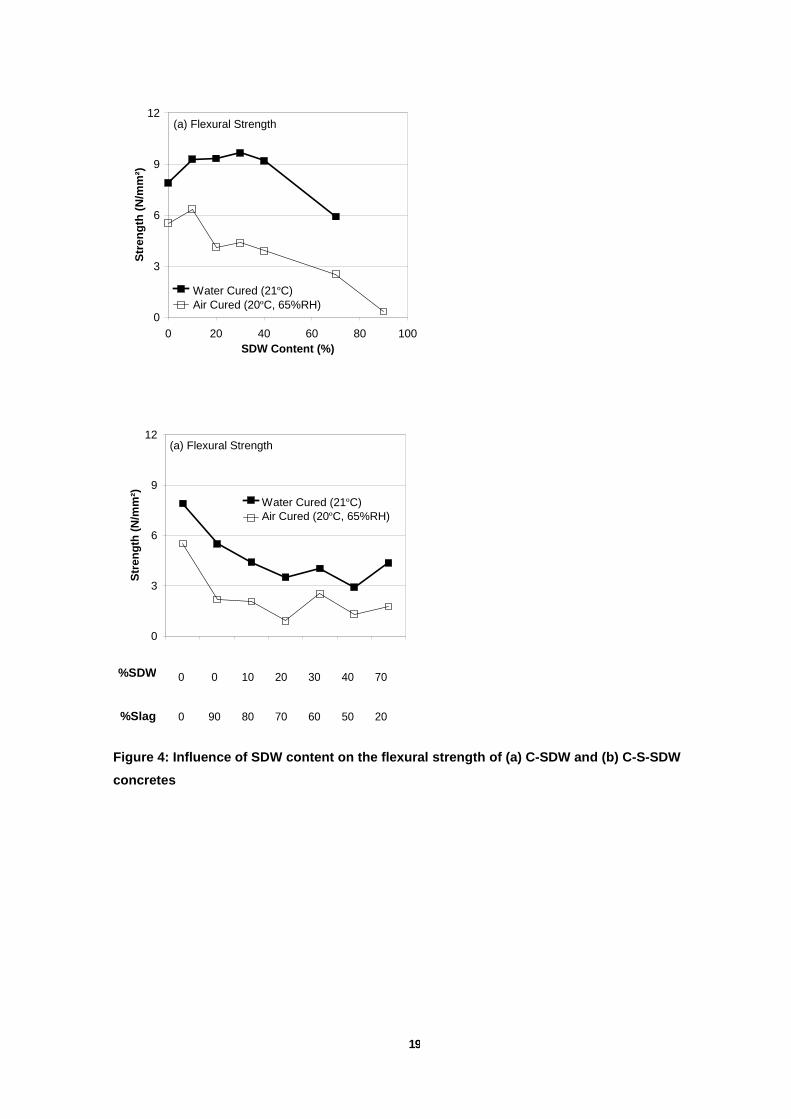
Figure 4 (a) and (b) show the flexural strength of C-SDW and C-S-SDW concretes cured in air at 20ºC
and 65% relative humidity, and in water at 20ºC. The tests were carried out at 570 days on samples
used to measure length change. The strength is plotted with respect to SDW content. The figure
shows that water cured samples exhibited greater strength than samples cured in air. An increase in
SDW content resulted in a larger difference between the strength of water and air cured samples. For
example, the reference mix exhibited a difference of about 30% between the flexural strength of air
and water cured samples, whereas, the mix containing 70% SDW (30C70SDW), exhibited a flexural
strength in water more than twice that of air cured samples. It is noticeable that the trend between
strength and SDW content was similar for flexural strength (Figures 2 and 4). In addition, water cured
mixes containing up to 40% SDW exhibited a higher flexural strength than the reference mix. Under air
curing, only the 10% SDW concrete showed a flexural higher than the reference mix.
The strength of C-S-SDW concretes cured in water was greater than under air curing (Figure 4-b).
There was little difference in the flexural strength for all the C-S-SDW concretes (excluding the

7
reference) when cured in air or water. Water curing resulted in higher flexural strength compared with
air curing.
3.4 Water absorption (WA)
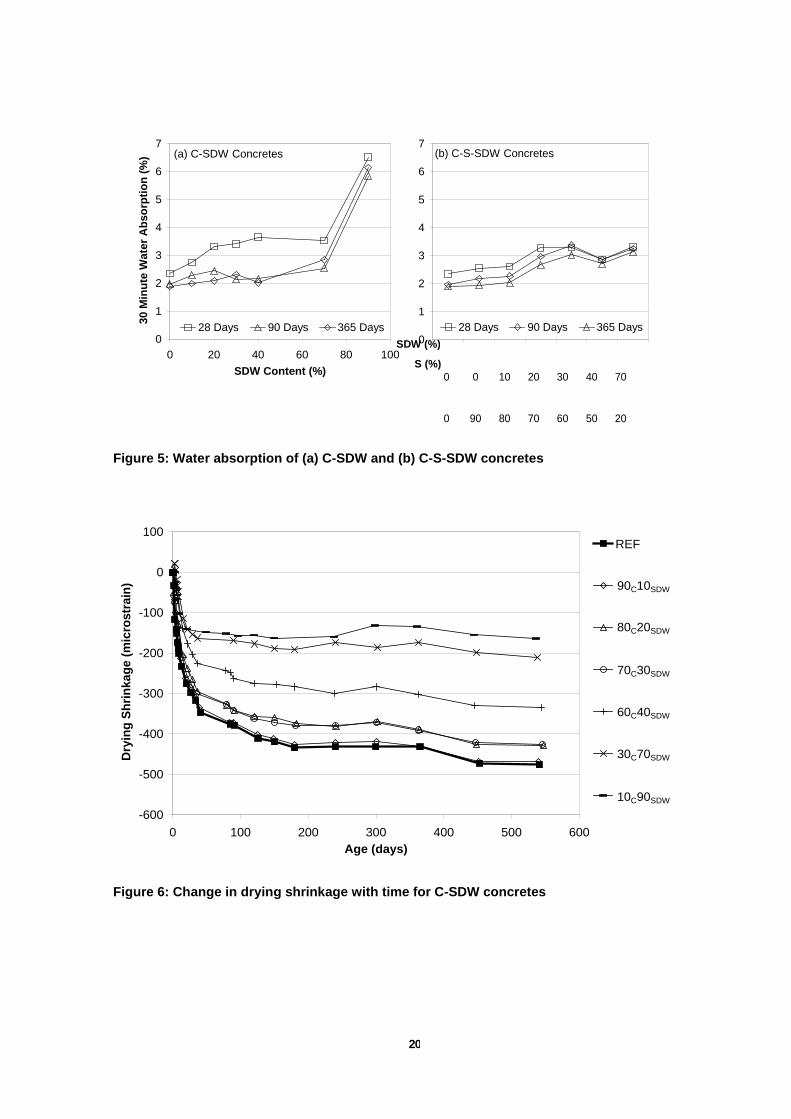
Figure 4 (a) and (b) shows the influence of SDW content on the water absorption (WA) of respectively
C-SDW and C-S-SDW concretes at 28 and 365 days. An increase in the SDW content generally
increased the WA. Concrete is defined to have low, medium and high absorption if the WA is below
3%, between 3% and 5%, and above 5% respectively (Concrete Society 2008).
At 28 days the WA increased with increasing SDW content. Concretes with SDW contents of 0 or 10%
exhibit low WA. Mixes with SDW ranging of 20 to 40% exhibit medium WA whereas high WA is
obtained at 70% SDW. All SDW concretes exhibit a reduction in WA between 28 and 365 days, the
365 days values being under 3%. For the mix containing 70% SDW, there was little change in WA
between 28 and 365 days, giving a value of about 6%. The trend in the absorption is similar to the of
total pore volume reported elsewhere (Khatib et al, 2013; Khatib et al, 2014)
For the C-S-SDW concretes (Fig. 4-b), the WA was in the range of low to medium at all ages based on
limits set down by the concrete society. The values of WA decreased slightly with age of the C-S-SDW
concretes. The increase in SDW content made a modest increase in WA.
3.5 Drying shrinkage
Figure 6 shows the drying shrinkage-time relationship for C-SDW concretes. For all mixes, the
majority of shrinkage occurs during the first 30 days. After that shrinkage reduces with increasing
SDW content. At 90% SDW, the long-term shrinkage is about 30% of the reference.
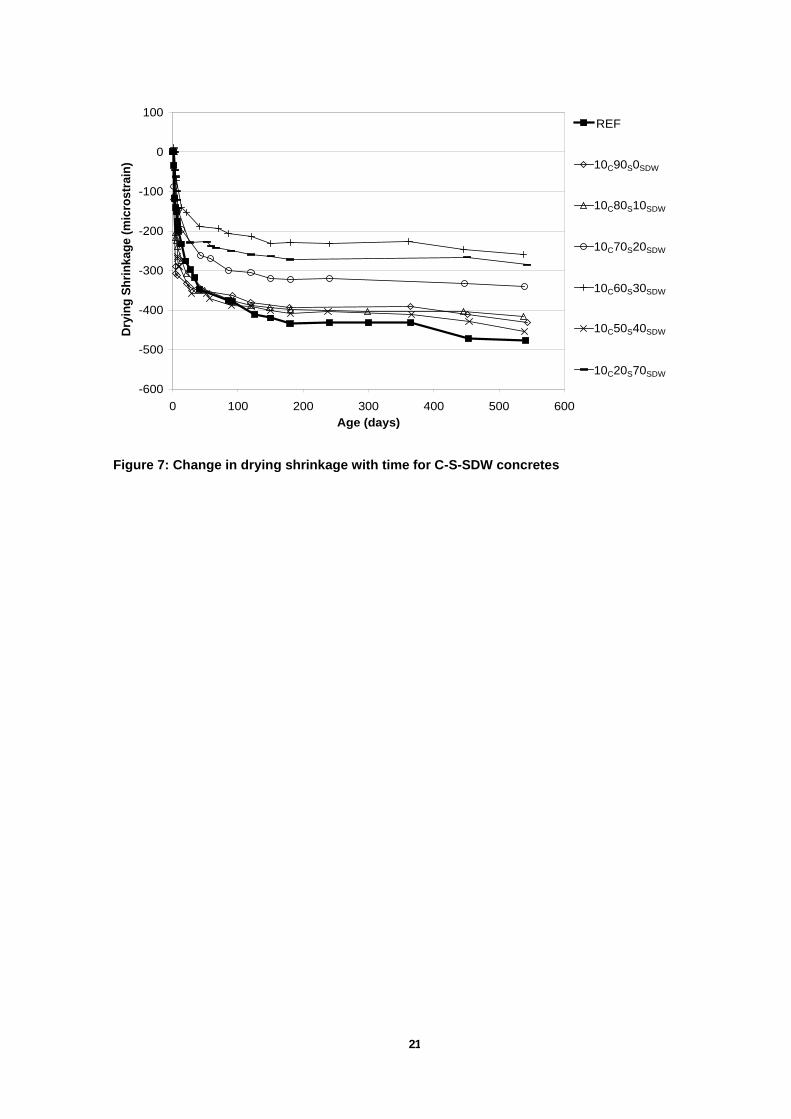
Figure 8 shows the change in drying shrinkage-time relationship for C-S-SDW concretes. Most of the
drying shrinkage occurred during the first 28 days. Unlike with C-SDW concretes (Fig. 6) there
appears to be no relationship between drying shrinkage and the SDW content of the C-S-SDW blends.
The effect of SDW content on the 28 and 365 days drying shrinkage for concretes with and without S
is shown in Figure 7. An increase in the SDW content of C-SDW concretes shows a decrease in
shrinkage, however, the shrinkage of the C-S-SDW concretes shows no clear trend.
3.6 Expansion
Figure 8 shows the expansion-time relationship for C-SDW concretes. Most expansion for C-SDW
concretes occurred during the first 28 days. After 90 days, there is hardly any expansion. Generally,
an increase in the SDW content increased the expansion of the concretes. There is no significant
expansion up to 20% SDW content. Expansion of 1100µs was observed for mix containing 70% SDW.
Figure 9 shows the expansion with time for C-S-SDW concretes. As in Figure 8, most of the expansion
occurred during the first 28 days followed by hardly any expansion. There was no apparent
relationship between SDW content and expansion. During the first seven days, mixes containing 10%
and 40% SDW exhibit shrinkage, whereas, mixes containing 20%, 30% and 70% SDW all exhibit
expansions. The mix containing 70% SDW (10C20S70SDW), exhibits the largest expansion of 500µm.
8
4. Discussion
4.1. Consistence
The consistence of C-SDW and C-S-SDW concretes, as measured by Vebe time, was significantly
reduced once the SDW content exceeded 20%. An increase in the SDW content from 40% to 70%,
and subsequently to 90%, resulted in the mix changing from a stiff mix, to a very stiff mix, and then to
an extremely dry mix (Concrete Society 2008). The SDW contains approximately 85% fly ash, which is
known to increase the consistence of cement mixes (Bai et al 1999). The increase in consistence is
generally attributed to the spherical nature of the fly ash particles, which has a deflocculating effect on
the cement particles, and allows them to flow more easily. In addition, the introduction of fly ash into
cement can retard hydration, thus reducing the amount of hydration products formed, which could
enhance or prolong consistence (Taylor 1997). The continuous decrease in consistence with
increasing SDW contents may be attributed, therefore, to the presence of gypsum. The SDW contains
15% gypsum, which in normal cements is used to regulate setting and avoid flash setting of the clinker
minerals. However, in binders with high gypsum contents, a rapid setting and subsequent hardening
occurs as in gypsum plasters (Karni and Karni 1995, Kovler 1998). This may explain the reduction in
consistence with the increase in gypsum content.
4.2. Strength
The effect of SDW content on the retardation of C-SDW and C-S-SDW concretes was more apparent
in the compressive strength data. Strength provides an indirect measurement of the rate and degree of
hydration. The replacement of cement with SDW resulted in a loss of strength during the first 28 days
compared to the reference mix. An increase in the SDW content increased the strength reduction
during this period. After seven days, all mixes show an increase in relative strength with age, the rate
of increase was higher in lower SDW content mixes. C-SDW concretes containing 10% and 20% SDW
exhibit a compressive strength greater than the reference mix. The optimum SDW content was 10%,
which gave the maximum relative strength of 120% at 365 days. However, all C-S-SDW mixes
showed systematic reduction in strength with the increase in SDW content.
Replacing cement with SDW in concrete has a retarding effect on strength. This retardation increased
as the level of SDW in the concrete increased. The SDW composition was 85% fly ash and 15%
gypsum both of which have retarding effects on the hydration of cement (Lea 1998; Wild et al 1995).
Gypsum is generally introduced to regulate the setting of cement, or more specifically the hydration of
the C3A component, in addition, fly ash retards the hydration of clinker minerals such as C3S and C3A
(Fajun et al 1985). The CH, which is commonly supplied by cement, reacts with the silica and alumina
parts of the fly ash to form additional calcium silicate and aluminate hydrates (C-S-H, C-A-H).
However, compared to Portland cement, the reaction of fly ash is relatively slow (Khatib and Mangat,
1995; Khatib and Mangat, 2002). An increase in the SDW content, increased the proportion of fly ash
in the mix, therefore, reducing the reaction rates (Khatib, 2008). Hence, the early strength
9
development of fly ash cements is retarded. This would explain the reduction in early strength as the
SDW in the C-SDW content was increased.
The blending of gypsum and fly ash in C-SDW concretes may also improve strength compared to
normal fly ash concretes based on evidence from tests on pastes and mortars in which blending fly
ash and gypsum did result in higher long-term strengths than fly ash alone (Poon et al 2001). The
aluminate phase of the fly ash reacts with the sulphate ions, which breaks down the glassy and
crystalline phases of the fly ash (Uchikawa, 1986). The addition of gypsum was shown to accelerate
the reaction of fly ash with calcium hydroxide (CH) supplied by the cement, and strengthen the bond
between the fly ash grains and the hydrates around them. Increasing the gypsum content beyond the
optimum amount tends to reduce early strength but considerably increases long-term strength
(Shiyuan 1982).
For the C-S-SDW concretes, strength development was greatly retarded compared to the reference
mix. Even at 365 days, the relative strength of the C-S-SDW concrete ranged between 35% and 50%
of the reference. The reduction in strength may be attributed to the reduction in alkali to allow the slag
and the SDW to react. The use of slag usually requires some form of alkali activator such as CH,
which reacts with its glassy parts to form C-S-H (Neville 2011). The contribution to strength usually
occurs between 7 and 90 days depending on the slag content. Optimum cement replacement levels of
slag, for maximising strength, lies between 40 to 50% (Roy and Idorn, 1982; Khatib and Hibberd,
2005). Improvements in strength for mixes containing up to 40% slag is commonly attributed to
changes in the microstructure of the cement matrix. In slag cements, the amount of calcium hydroxide
(CH) formed is reduced, and additional calcium silicate hydrates (C-S-H) are formed, which produce a
much denser microstructure (Neville 2011). Slag content exceeding 50% reduce strength due to a lack
of calcium hydroxide (CH), which reacts with the slag. The C-S-SDW concretes contain 10% cement,
which was insufficient to produce strength similar to the reference mix. When cured in water the C-S-
SDW concretes possessed a much more durable structure and damage to the samples was less
common. The C-S-SDW concrete containing no SDW, (mix 10C90S0SDW), exhibit an increase in
strength after 28 days compared to the remaining C-S-SDW concretes. This is because slag
possesses hydraulic properties and was more reactive than the fly ash present in the SDW (Concrete
Society 2011).
4.3. Length change
The replacement of cement with fly ash generally has little effect on the drying shrinkage of fly ash
concretes compared to reference concretes (Baoju et al 2000). Drying shrinkage for fly ash concrete
lies between 500µs and 600µs at 365 days, which is also common for normal concretes. However, an
increase in the SDW content in C-SDW concretes resulted in a decrease in the drying shrinkage.
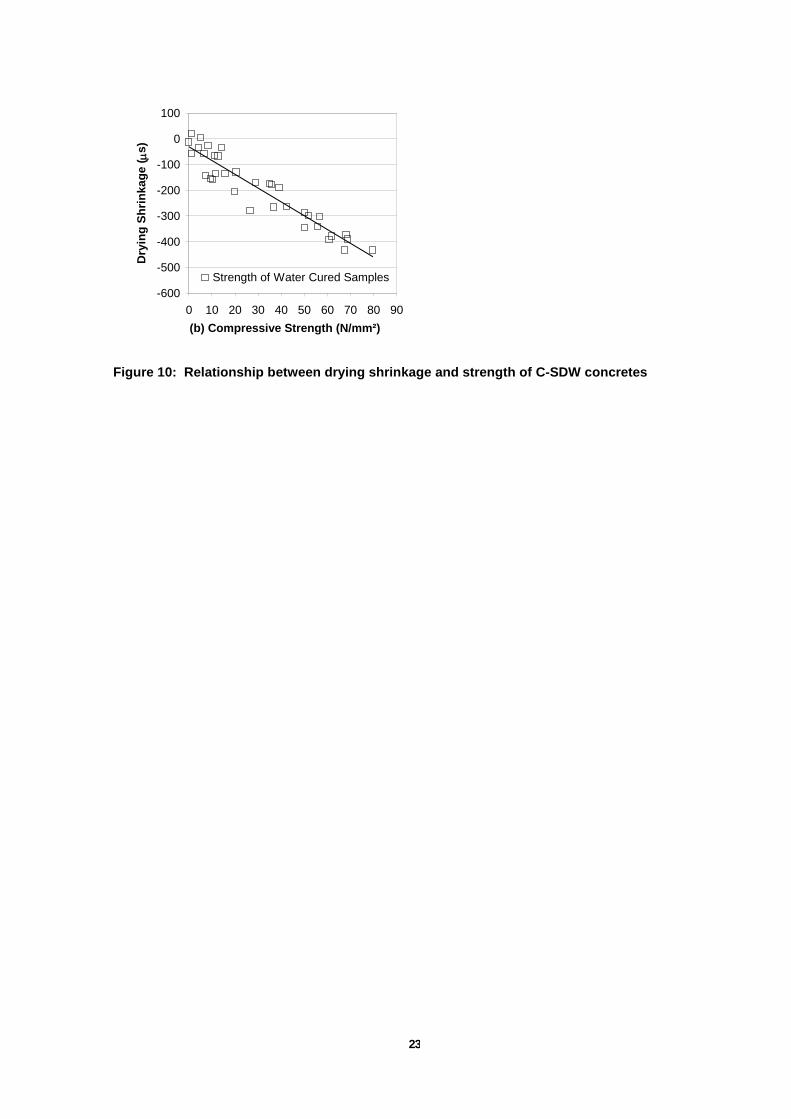
Figure 10 shows the relationship between drying shrinkage and compressive strength of cubes cured
in water at different curing times. The relationship suggests that an increase in compressive strength
leads to an increase in drying shrinkage. This indicates that drying shrinkage is related to the degree
of hydration. A decrease in hydration will reduce the surface area of the gel formed, and would reduce
the adsorbed water on the surface of the gel particles, thus minimising the shrinkage on drying. In

10
addition, drying shrinkage occurs from the removal of intracrystalline water from the C-S-H (Neville
2011). Therefore, a reduction in the C-S-H formed due to the retardation of the hydration process may
contribute to the reduction in drying shrinkage.
The drying shrinkage of C-S-SDW concretes follows no apparent trend with respect to SDW content
and varied between 250µs and 500µs at 365 days. Hogan and Meusel (1981) reported that the drying
shrinkage of concrete containing 50% slag generally increased at all ages compared to normal
concretes. However, the presence of slag in the C-S-SDW concretes does not lead to any significant
drying shrinkage. It was suggested that the shrinkage could be reduced with the addition of gypsum.
This may explain why the C-S-SDW concretes all exhibit a drying shrinkage similar to or less than the
reference mix. All C-S-SDW concretes possess lower compressive strengths than the reference mix,
however, the drying shrinkage of several C-S-SDW concretes was similar to the reference mix.
Therefore, it is more likely that the drying shrinkage is governed by the physical properties of the
binder materials such as fineness, water reducing properties or even the type of hydrates formed
during hydration.
The expansion of C-SDW concretes cured in water exhibited the opposite trend to drying shrinkage,
i.e. an increase in the SDW content, increased the expansion in the C-SDW mixes. The increase in
expansion with increasing SDW content was accompanied by a retardation of strength. Expansion
appeared to cease in C-SDW concretes once the compressive strength reached approximately
15N/mm². For the reference mix, this occurred between one and three days, whereas, for the mix
containing 70% SDW (mix 30C70SDW) this occurred between 28 and 90 days. The expansion of C-S-
SDW concretes follows no particular trend with respect to SDW content. The only significant
observation was that C-S-SDW concretes, which exhibit a large drying shrinkage, also exhibit small
expansion. In mixes containing 10% SDW (10C80S10SDW) and 40% SDW (10C50S40SDW) there was an
initial shrinkage followed by a small expansion with time.
Increasing the SDW content increased the gypsum content in the mix, which can influence expansive
properties of concrete (Pickett 1947). Lerch (1946) reported that in normal cements and under moist
curing conditions, minimal expansions were observed at SO3 contents up to 4%. Many researchers
have reported results on why calcium sulphate and the ratio of SO3/Al2O3 cause expansions in cement
(Sorka and Abayneh 1986; Mulongo and Ekolu 2013). However, many views are contradictory. The
consensus is that large amounts of gypsum in the mix can result in excessive ettringite formation, and
subsequent expansions.
5. Conclusions
Physical and mechanical properties were tested on concrete with proportions of binder to sand to
coarse aggregate of 1:2:3.5, and a water/binder (w/b) of 0.5. The influence of cement replacement
level with a typical simulated desulphurised waste (SDW) was evaluated for binders containing cement
and SDW (C-SDW blends), and cement, ground granulated blastfurnace slag and SDW (C-S-SDW
blends). There is a potential to use desulphurised wastes in construction applications provided the
limitations of the materials are recognised.
11
The replacement of cement with increasing levels of SDW beyond 10% generally reduced
compressive strength, drying shrinkage and increased water absorption and expansion.
The drying shrinkage of C-SDW concrete appeared to be related to the degree of hydration and
strength. Increasing the SDW content retards strength, which coincided with a decrease in drying
shrinkage for samples cured in air. All C-SDW concretes exhibited a drying shrinkage lower than the
reference concrete. For example, the reference mix exhibited a drying shrinkage of 500µs, however,
an increase in the SDW content up to 70% decreased drying shrinkage to 150µs.
The expansion of C-SDW concretes appeared to be inversely related to drying shrinkage, i.e. an
increase in drying shrinkage was accompanied by a decrease in expansion. An increase in expansion
occurred when the level of SDW was increased. For example, the reference mix exhibited no
expansion, however, an increase in the SDW content up to 70% increased the expansion to 1100µs.
The performance of all C-S-SDW concrete was inferior to the reference concrete. Generally,
compressive strength, drying shrinkage were decreased, and water absorption and expansion were
increased. However, if sufficient curing was provided it was possible to produce concrete with waste
contents as high as 90% (slag and SDW). For example, the strength of all C-S-SDW concretes was
approximately 35 N/mm² at 365 days, compared to 67 N/mm² for the reference concrete.
There appears to be a relationship between drying shrinkage and expansion, i.e. large expansions
were observed for mixes that exhibited small drying shrinkage. The expansion of C-S-SDW concretes
was less than the expansion exhibited by the C-SDW concretes with equivalent SDW contents. For
example, C-S-SDW concrete containing 70% SDW exhibited an expansion of 500µs, whereas the C-
SDW concrete containing the same level of SDW exhibited an expansion of 1100µs after 570 days.
6. Recommendations for practical mix design
The research reported in this paper was part of a larger project funded by the EC, on FGD waste
produced by the semi-dry and dry desulphurisation processes used in Eastern Europe. The variability
of the FGD ashes produced by different power stations was significant and, therefore, mix design can
only be based on any specific selected source. Chemical characterisation and grading of these FGD
ashes would be the first step leading towards their application. 10 – 15% replacement of cement with
FGD waste in plain concrete mixes would be a suitable mix design for products without steel
reinforcement. Durability of steel reinforcement in the material needs to be verified before its use in
reinforced concrete.
Acknowledgment
The authors gratefully acknowledge the funding provided by the European Commission (Inco
Copernicus) for the research project (Project No. ERBIC 15 CT 960741) on the waste of the dry and
semi dry FGD processes.
12
References
Baoju L, Youjun W, Shiqiong Z, Qianlian Y (2000), Influence of ultrafine fly ash composite on the
fluidity and compressive strength of concrete, Cement and Concrete Research, 30: 1489-
1493.
Bentur A (1976), Effect of gypsum on hydration and strength of C3S pastes, Journal of the American
Ceramic Society, 59: 210-213.
BS EN 12350-2 (2009), British Standard Institution, Testing fresh concrete. Slump test. BSI, London,
UK.
BS EN 12350-3 (2009), British Standard Institution, Testing fresh concrete. Vebe test. BSI, London,
UK.
BS EN 12390-2 (2009), British Standard Institution, Testing hardened concrete. Flexural strength of
test specimens. BSI, London, UK.
BS EN 12390-3 (2009), British Standard Institution, Testing hardened concrete. Compressive strength
of concrete specimens. BSI, London, UK.
Concrete Society (2008), Permeability testing of site concrete, Report TR31, London.
Concrete Society (2011), Cementitious materials, Report TR74, London
Cornelissen HAW (1991), Spray dry absorption residue in concrete products, Studies in Environmental
Sciences 48, Waste Materials in Construction, Ed. Goumans, van der Sloot and Aalbers,
Amsterdam, Netherlands, Elsevier Science, 499-506.
Demirabas A, Aslan A (1999), Evaluation of lignite combustion residues as cement additives, Cement
and Concrete Research, 29: 983-987.
Drottner J and Havlica J (1997), Low lime binders based on fluidised bed ash, Studies in
Environmental Sciences 71, Waste Materials in Construction, Ed. Goumans, Senden and van
der Sloot, 401-410.
Fajun W, Grutzeck MW and Roy DM (1985), The retarding effects of fly ash upon the hydration of
cement pastes: The first 24 hours, Cement and Concrete Research, 15:174-184.
Hogan FJ and Meusel (1981), Evaluation for durability and strength development of a ground
granulated blastfurnace slag, Cement, Concrete and Aggregates, CCAGDP, 3(1): 40-52.
Jeppesen K (1990), The effect on cement mortar and concrete by admixture of spray drying
absorption products, Fly ash and coal conversion by-products: Characterisation, utilisation and
disposal VI, Boston, MA, USA, 29 Nov-1 Dec 1989, Materials Research Society Symposium
Proceedings, Vol. 178, ed. Day and Glasser, Pittsburgh, PA, USA, Materials Research
Society, 267-278.
Karni J and Karni E (1995), Gypsum in construction: origin and properties, Materials and Structures,
28: 92-100.
13
Khatib J M (2008) Performance of self-compacting concrete containing fly ash, Construction and
Building Materials, 22(9): 1963-1971.
Khatib J M and Hibbert J J (2005), Selected engineering properties of concrete incorporating slag and
metakaolin, Construction and Building Materials , 19(6): pp 460-472.
Khatib J M and Mangat P S (1995), Absorption characteristics of concrete as a function of location
relative to the casting position, Cement and Concrete Research, 25(5): 999-1010.
Khatib J M and Mangat P S (2002), Influence of high temperature and low humidity curing on chloride
penetration in blended cement concrete, Cement and Concrete Research, 32(11): 1743-1753.
Khatib J M, Mangat P S and Wright L (2008), Sulphate resistance of blended binders containing FGD
waste , Proceedings of the Institution of Civil Engineers (ICE)- Construction Materials, 161(3):
119-128.
Khatib J M, Mangat P S and Wright L (2013), Early age porosity and pore size distribution of cement
paste with flue gas desulphurisation (FGD) waste, Civil Engineering and Management,19(5): 622-627.
Khatib J M, Mangat P S and Wright L (2014), Pore size distribution of cement pastes containing fly
ash-gypsum blends cured for 7 days, Korean Society of Civil Engineering (KSCE), 18(4):
1091-1096.
Khatib J M, Wright L and Mangat P S (2013), Porosity and pore size distribution of cement-fly ash-
gypsum blended pastes, Advances in Applied Ceramics, Structural, Functional and
Bioceramics, 112(4): 207-201.
Kovler K (1998), Setting and hardening of gypsum-Portland cement-silica fume blends, Part 2: Early
strength, DTA, XRD, and SEM observations, Cement and Concrete Research, 28(4): 523-
531.
Lea FM (1998), LEA’S Chemistry of Cement and Concrete, 4th Edition, Arnold, ISBN 0 340 56589 6,
Chapter 6 - Hydration, Setting, and Hardening of Portland Cement, 241-299.
Lerch W (1946), The influence of gypsum on the hydration and properties of Portland cement pastes,
Proceeding of the American Society for Testing Materials (ASTM), Vol.46.
Mangat P S, Khatib J M and Wright L (2006), Optimum utilisation of flue gas desulphurisation (FGD)
waste in blended binder for concrete, Proceedings of the Institution of Civil Engineers-
Construction Materials, 1(2): 60-68.
Mulongo P L and Ekolu S O (2013), Kinetic model to predict cement susceptibility to delayed
ettringite formation. Part 2: Model validation and application, Magazine of Concrete
Research, 65(10): 640-646.
Neville AM (2011), Properties of concrete, Fourth Edition, Longman Group Ltd.
Pickett G (1947), Effect of gypsum content and other factors on shrinkage of concrete prisms,
American Concrete Institute, 19(2): 149-175.

14
Poon CS, Kou SC, Lam L and Lin ZS (2001), Activation of fly ash/cement systems using calcium
sulphate anhydrite (CaSO4), Cement and Concrete Research, 31: 873-881.
Shiyuan H (1982), The effect of addition of gypsum on the hydration of fly ash cement, Proceeding of
the International Symposium, The use of PFA in concrete, Vol 2, Leeds University.
Sorka I and Abayneh M (1986), Effect of gypsum on properties and internal structure of PC paste,
Cement and concrete research, 16(4): 495-504.
Taylor HFW (1997), Cement Chemistry, Second Edition, Thomas Telford.
Uchikawa H (1986), Effect of blending components on the hydration and structure formation, 8th
International Congress on the Chemistry of Cement, Rio de Janeiro, Brazil, 22-27 September, 1:.249-280.
Wang B and Song Y (2013), Methods for the control of volume stability of sulfur-rich CFBC
ash cementitious systems, Magazine of Concrete Research, 65(19): 1168 –1172
Wild S, Hadi M and Khatib J M (1995), The influence of gypsum content on the porosity and pore size
distribution of cured PFA-Lime mixes, Advances in Cement Research, 7(26): 47-55.
15
Table 1: Binder details for C-SDW mixes
Proportions (% mass of binder) SO3
Mix No Mix ID Cement (C) SDW (% mass of binder)
1 REF (100C) 100 0 3.12
2 90C10SDW 90 10 3.70
3 80C20SDW 80 20 4.27
4 70C30SDW 70 30 4.85
5 60C40SDW 60 40 5.42
6 30C70SDW 30 70 7.15
7 10C90SDW 10 90 8.30
Table 2: Binder details for C-S-SDW mixes
Proportions (% weight of binder) SO3
Mix No Mix ID Cement (C) SDW Slag (S) (% mass of binder)
8 10C90S0SDW 10 0 90 1.06
9 10C80S10SDW 10 10 80 1.86
10 10C70S20SDW 10 20 70 2.67
11 10C60S30SDW 10 30 60 3.47
12 10C50S40SDW 10 40 50 4.28
13 10C20S70SDW 10 70 20 6.69
16
Article type: paper (3000-5000 words with one illustration per 500 words). Paper
Date text written or revised.
15 May 2015
Number of words in your main text and tables, followed by the number of figures.
Manuscript (4692) + Table (86) = 4831 2 Tables 10 Figures
LIST OF TABLES
Table 1: Binder details for C-SDW mixes
Table 2: Binder details for C-S-SDW mixes
LIST OF FIGURES
Figure 1: Consistence of (a) C-SDW and (b) C-S-SDW Concretes
Figure 2: Influence of SDW content on compressive strength at different curing times.
Figure 3: Influence of SDW and S contents on compressive strength at different curing times.
Figure 4: Influence of SDW content on the flexural strength of (a) C-SDW, and (b) C-S-SDW concretes
Figure 5: Water absorption of (a) C-SDW and (b) C-S-SDW concretes
Figure 6: Change in drying shrinkage with time for C-SDW concretes
Figure 7: Change in drying shrinkage with time for C-S-SDW concretes
Figure 8: Influence of age on the expansion of C-SDW concretes
Figure 9: Influence of age on the expansion of C-S-SDW concretes
Figure 10: Relationship between drying shrinkage and strength of C-SDW concretes

17
Figure 1. Workability of (a) C-SDW and (b) C-S-SDW Concretes
Figure 1. Workability of C-SDW Concretes Figure 2. Workability of C-S-SDW Concretes
Figure 1. Workability of (a) C-SDW and (b) C-S-SDW Concretes
0
10
20
30
40
50
60
0 20 40 60 80 100SDW Content (%)
Slum
p (m
m)
0
5
10
15
20
25
30
Slump
Vebe
0
10
20
30
40
50
60
0
5
10
15
20
25
30
Vebe
(sec
)
SlumpVebe
0 0 10 20 30 40 70
0 90 80 70 60 50 20
0
10
20
30
40
50
60
0 20 40 60 80 100SDW Content (%)
Slum
p (m
m)
0
5
10
15
20
25
30
Slump
Vebe
0
10
20
30
40
50
60
0
5
10
15
20
25
30
Vebe
(sec
)
SlumpVebe
0 0 10 20 30 40 70
0 90 80 70 60 50 20
%SDW
%S
%SDW
%S

18
Figure 2: Influence of SDW content on compressive strength at different curing times.
Figure 3: Influence of SDW and S contents on compressive strength at different curing times.
1 Day 3 Days 7 Days 28 Days 90 Days 365 Days
0
20
40
60
80
100
0 20 40 60 80 100SDW Content (%)
Com
pres
sive
Str
engt
h (N
/mm
²)
(a) C-SDW Concretes
1 Day 3 Days 7 Days 28 Days 90 Days 365 Days
0
20
40
60
80
100
(b) C-S-SDW Concretes
0 0 10 20 30 40 70
0 90 80 70 60 50 20
SDW
S
19
Figure 4: Influence of SDW content on the flexural strength of (a) C-SDW and (b) C-S-SDW concretes
0
3
6
9
12
0 20 40 60 80 100SDW Content (%)
Stre
ngth
(N/m
m²)
(a) Flexural Strength
Water Cured (21ºC)Air Cured (20ºC, 65%RH)
0
3
6
9
12
Stre
ngth
(N/m
m²)
(a) Flexural Strength
Water Cured (21ºC)Air Cured (20ºC, 65%RH)
0 0 10 20 30 40 70
0 90 80 70 60 50 20
%SDW
%Slag
20
Figure 5: Water absorption of (a) C-SDW and (b) C-S-SDW concretes
Figure 6: Change in drying shrinkage with time for C-SDW concretes
0
1
2
3
4
5
6
7
0 20 40 60 80 100SDW Content (%)
30 M
inut
e W
ater
Abs
orpt
ion
(%)
28 Days 90 Days 365 Days
(a) C-SDW Concretes
0
1
2
3
4
5
6
7
28 Days 90 Days 365 Days
(b) C-S-SDW Concretes
0 0 10 20 30 40 70
0 90 80 70 60 50 20
-600
-500
-400
-300
-200
-100
0
100
0 100 200 300 400 500 600Age (days)
Dry
ing
Shrin
kage
(mic
rost
rain
)
REF
90C10SDW
30C70SDW
60C40SDW
70C30SDW
80C20SDW
10C90SDW
SDW (%)
S (%)
21
Figure 7: Change in drying shrinkage with time for C-S-SDW concretes
-600
-500
-400
-300
-200
-100
0
100
0 100 200 300 400 500 600Age (days)
Dryi
ng S
hrin
kage
(mic
rost
rain
)REF
10C80S10SDW
10C20S70SDW
10C50S40SDW
10C60S30SDW
10C70S20SDW
10C90S0SDW

22
Figure 8: Influence of age on the expansion of C-SDW concretes
Figure 9: Influence of age on the expansion of C-S-SDW concretes
-200
0
200
400
600
800
1000
1200
0 100 200 300 400 500 600Age (days)
Expa
nsio
n (m
icro
stra
in)
REF
90C10SDW
30C70SDW
60C40SDW
70C30SDW
80C20SDW
-200
-100
0
100
200
300
400
500
600
0 100 200 300 400 500 600Age (days)
Expa
nsio
n (m
icro
stra
in)
REF
10C80S10SDW
10C20S70SDW
10C50S40SDW
10C60S30SDW
10C70S20SDW
10C90S0SDW
23
Figure 10: Relationship between drying shrinkage and strength of C-SDW concretes
-600
-500
-400
-300
-200
-100
0
100
0 10 20 30 40 50 60 70 80 90(b) Compressive Strength (N/mm²)
Dry
ing
Shrin
kage
( µs)
Strength of Water Cured Samples

24