mechanical aspects of construction of new tbm tunnel under
TRANSCRIPT
ORIGINAL PAPER
Mechanical Aspects of Construction of New TBM TunnelUnder Existing Structures
Wu Ke . Zhang zheng . Li Shuchen . Zhou leisheng . Zhao Jiahui .
Zheng Yang
Received: 29 January 2021 / Accepted: 22 May 2021 / Published online: 28 May 2021
� The Author(s) 2021
Abstract It is inevitable for the construction of
subways to pass under the existing structures in the
city; this will cause settlement of the existing struc-
tures and affect their safety. The soil is a complex
mixture, and hence it is difficult to determine the
damage caused by construction using tunnel boring
machine (TBM) method to the stress balance of the
surrounding soil. Normally, settlement and uplift of
the surface are caused during tunneling. Therefore,
large-scale 3D simulations are needed to study the
interaction between mechanically driven tunnel con-
struction and the surrounding soil to estimate the
expected settlement and related damage risks to the
existing structures, especially in tunnel construction in
urban areas. Qingdao Metro Line 1 in the Haixiao
section (Xiaocunzhuang and Haiboqiao stations) was
taken up as the research object to study the trend and
degree of the effect of TBM tunnel construction using
the numerical simulation software Midas GTS NX.
The numerical simulation results and measured data
were used for the reliability analysis to study the
influence of different digging speeds and pressures in
TBM construction on ground subsidence, and the
effect of vibrations generated at the tunnel face by the
TBM cutter head on the ground structure. It is shown
that when other factors remain unchanged, the faster
the driving speed, the smaller the ground settlement;
the higher the surrounding rock pressure, the smaller
the ground settlement. The vibration of the ground
structure caused by the TBM cutter head complies
with the relevant specifications. During construction,
the driving parameters should be selected suitably
depending on the available budget.
Keywords TBM tunnel � Tunneling projects �Numerical simulation � Measured data � Mechanical
mechanism
W. Ke � Z. zheng (&) � Z. Jiahui � Z. YangSchool of Civil Engineering, Shandong University, Jinan,
China
e-mail: [email protected]
W. Ke
e-mail: [email protected]
Z. Jiahui
e-mail: [email protected]
Z. Yang
e-mail: [email protected]
L. Shuchen
School of Qilu Transportation, Shandong University,
Jinan, China
e-mail: [email protected]
Z. leisheng
Construction Management Branch, Qilu Transportation
Development Group Co., Ltd, Jinan, China
e-mail: [email protected]
123
Geotech Geol Eng (2021) 39:5727–5741
https://doi.org/10.1007/s10706-021-01860-6(0123456789().,-volV)( 0123456789().,-volV)

1 Introduction
With China’s economic development, many Chinese
cities have begun to construct or expand the subway
lines. An urban subway route inevitably undercuts the
existing structures. Different regions have various
geological conditions and subway construction meth-
ods. At present, the shield method is mainly used in
soft soil layers, while the traditional drilling and
blasting method and the modern tunnel boring
machine (TBM) method are used in relatively hard
rock and soil layers. As the project cost was low, there
was sufficient experience in drilling and blasting
methods, and these methods were used in hard rock
and soil layers in the past. It is undeniable that the
environmental impact of blasting vibrations is large,
and the progress of construction is slow.
TBM has the advantages of low environmental
impact and high efficiency, and is increasingly being
used in subway construction units (Komu et al. 2019).
The core content of the new Austrian method is to
obtain the mechanical properties and changes in the
surrounding rock, conduct monitoring and measure-
ment activities at the tunnel site, and to guide the
design and construction of the tunnel through timely
feedback of the monitoring and measurement data
(Wu et al. 2018). Among the various monitoring
methods, monitoring of convergent deformation is the
simplest, direct, and most widely used one. Based on
past experience, a larger convergence displacement is
expected near the tunnel surface. In spite of having a
lower lateral stress, the increase in lateral stress ratio
promotes the rupture of the surrounding rock, which
results in a larger range of failure zones and more
severe extrusion deformation (Aygar 2020; Liu et al.
2016). In the cross section of the tunnel, the deforma-
tion over the tunnel crown is usually the largest, and
TBM jamming is normally caused when the surround-
ing rock over the TBM squeezes the shield (Lv and
Jiang 2012). Most subways are built in cities with
complex structures, and the ground settlement caused
by tunnel construction must be strictly controlled.
TBM also causes vibration problems in construction in
the urban environment, especially in residential areas,
commercial areas, special units, bridges, stations,
equipment, and machines that are sensitive to envi-
ronmental vibrations near the tunnel sections. These
problems cannot be ignored during TBM tunnel
construction. The vibration intensity of the ground
structures is closely related to the vibration intensity of
the source, mechanical properties of the ground, and
dynamic characteristics of the building or equipment
(Kwak and Park 2015; Namli and Aras 2020). Under
complex geological conditions, finite-difference soft-
ware can be used to perform 3D simulations of TBM
and the surrounding environment. Numerical analysis
can be effectively used to assess the impact of
unfavorable geological environments on TBM traps
and to predict the performance of shield tunnels. The
thrust required during excavation is estimated in
advance for adverse ground conditions (Bahrainy
and Khosravi 2013). Considering the TBM geometry,
a comprehensive finite element analysis (FEA) was
performed to simulate the TBM tunnel, and the results
were verified by comparing with the monitoring
results. The FEA model can simulate the excavation
ground, mechanical structure, and excavation process
on the site (Hasanpour et al. 2017; Liu et al. 2020; Wu
et al. 2013). The torque and thrust of the boring
machine are the two main design parameters of the
shield TBM. The DEM can estimate the torque and
thrust of the TBM by applying the actual boundary
conditions and material properties of the model
(Faramarzi et al. 2020). The excavation process is
modeled in various ground conditions considering
different velocity-torque characteristics. Zhang found
that the torque required for excavation changes with
the strength of the ground, and that an increase in hard
surface layers increases the torque required (Zhang
et al. 2010). Pirastehfar used 3D finite element method
to study the mechanism of interaction between the
shield tunnels driven at a close range; Shiraz metro
line 2 was taken as a specific case study. It was
concluded that the interaction between the tunnels
driven by a close shield is controlled by geotechnical
parameters such as soil stiffness, cohesion, and friction
angle, and geometrically related parameters such as
the distance between the tunnels (Pirastehfar et al.
2020; Yang et al. 2020). Most of the current research
work focus on the deformation and surface settlement
during the tunnel excavation process; only a few
studies are found in the international engineering
geology and rock engineering literature on the use of
3D numerical simulation software to simulate the
entire construction process and analyze the impact of
TBM on the construction environment from the
perspective of ground vibration.
123
5728 Geotech Geol Eng (2021) 39:5727–5741

This article analyzes the impact of TBM construc-
tion for Qingdao Metro Line 1 between the Haixiao
section (Xiaocunzhuang and Haiboqiao stations)
underpass and the Renmin Road overpass on the
bridge structure. The vibration levels of key buildings
(structures) along the line are also tested and analyzed
to determine the trend and degree of the effect of TBM
excavation on the ground buildings (structure). This
work serves as a theoretical basis for building
protection during the construction of Qingdao Rail
Transit and provides valuable experience and data for
TBM application in the urban environment.
2 Project Overview
TBM technology is used for the tunnel between
Xiaocunzhuang station and Haiboqiao station on Line
1 of Qingdao Metro. The lengths of the left and right
construction sections are 818.751 m and 648 m,
respectively. The tunnel covers the area that runs
from the Haibo Bridge, north along Renmin Road to
cross Nanning Road and Fushun Road, then crosses
under Renmin Road overpass, and ends inside the
small village station. The TBM tunnel has a standard
single-hole, single-line circular cross-section. The
sectional plane line is a straight section, the line
spacing is 14–16 m, the thickness of the overburden is
20–29 m, and the maximum slope of the line is 25%(Fig. 1). The tunnel lining is made of C50 prefabri-
cated reinforced concrete segments with an outer
diameter of 6.0 m, inner diameter of 5.4 m, thickness
of 0.3 m, and ring width of 1.5 m (Fig. 2).
Drilling in the region revealed that the Quaternary
in the field has a thickness of 0.40–12.20 m and that it
is mainly composed of the Quaternary Holocene
artificial fill layer (Q4ml), Holocene alluvial layer (Q4
al ? pl), and Upper Pleistocene alluvial silty clay
layer (Q3 al ? pl). The bedrock comprises the late
Yanshan intrusive granite (c53), local granite por-
phyry (cp53), and fine-grained granite (c53) veins.
Owing to the effect of the faults, some boreholes are
found to have corresponding lithological tectonic
rocks.
Fig. 1 Project location
Fig. 2 Geometrical dimensions of the tunnel side through
structure
123
Geotech Geol Eng (2021) 39:5727–5741 5729
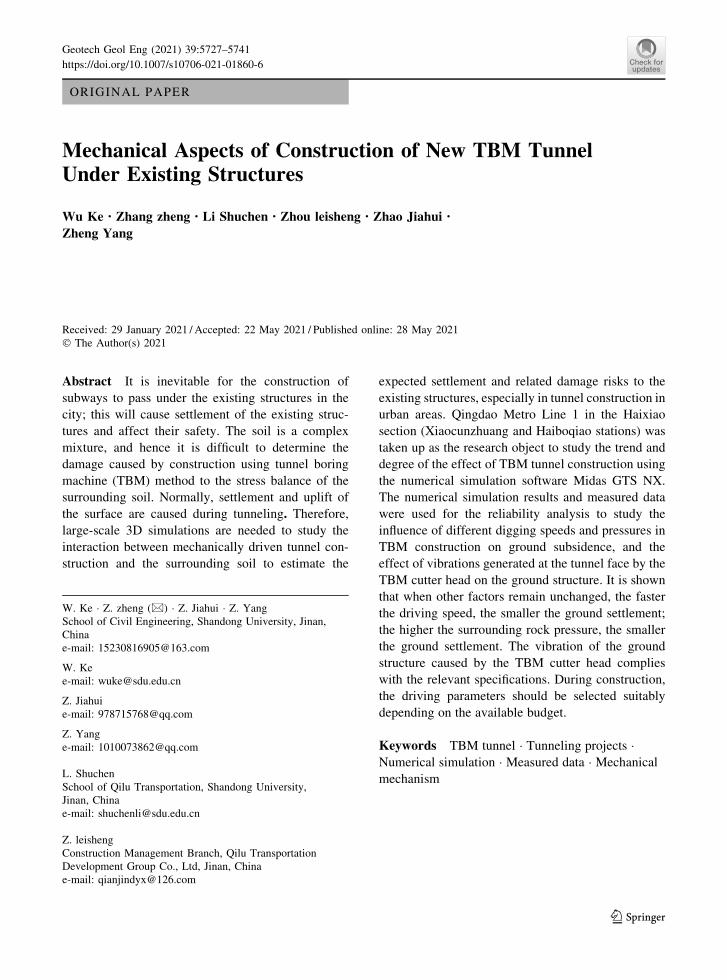
3 Calculation Model
3.1 Simulation of TBM Excavation
In TBM excavation, the hob rotates under thrust, and
the rock of the palm face breaks under the strong thrust
and torque. After the rock is broken, the initial in-situ
stress on the excavation surface is relieved. Therefore,
this process is equivalent to the digging and breaking
of the rock by excavating and unloading to simulate
the TBM (Rezaei and Ahmadi-adli 2020). Assuming
that the unloading process is linear, the TBM excava-
tion construction can be simulated by linearly remov-
ing the load when normal driving pressure and jack
load are applied on the tunnel wall within a certain
time. Midas GTS NX software is used to simulate the
TBM tunneling process. The locations of points DC1
to DC4 in the model are shown in Figs. 3 and 5.
Considering the relevant engineering experience
and theories, the relevant model size effect is consid-
ered. The distance from the left and right boundaries of
the tunnel to the edge in the model must be approx-
imately 3D–5D. From the far boundary, this value will
not be affected by excavation. If the model size is
small, then the calculation result will be inaccurate
(Yang et al. 2019). In the model, the diameter of the
shield tunnel is 6 m, the thickness of the segment is
0.3 m, and the shield segment length is 1.5 m. The
geometric size of the model is the same as that of the
surrounding rock with dimensions of 90 m 9 50 m 9
50 m. The corresponding calculation model is shown
in Figs. 4 and 5.
3.2 Model Parameter Selection
The modified Mohr–Coulomb model is used for the
soil layer. Segments, bridges, and segment grouting
are considered as solid units in the model. The plate
unit is used for simulation to establish the shield shell
and underdrain pipeline modules, as it allows easy
calculation of the model structure coupling. Based on
the on-site geological survey and numerical simula-
tion experience, the model parameters are selected;
these are listed in Table 1.
3.3 Simulation Method
The model considers only the vibration due to the
breakage of the rock by the cutter head and not the
mechanical vibration of the TBMmain engine and bolt
drilling operation (Ling et al. 2018). In the analysis of
the sensitivity of different driving speeds, the average
driving speed is 2.30 m/h for the TBM for the crossing
of the slightly weathered granite layer (Li et al. 2012).
In agreement with the on-site tunneling data, theFig. 3 Layout of monitoring points
Fig. 4 Model and stratigraphic division
Fig. 5 Tunnel and location with respect to surrounding
structures
123
5730 Geotech Geol Eng (2021) 39:5727–5741

simulation of TBM tunneling process for 1 m takes
approximately 1400 s, 1700 s, 2000 s, 2300 s, and
2600 s for digging speeds of 2.55 m/h, 2.11 m/h,
1.8 m/h, 1.56 m/h, and 1.38 m/h, respectively. These
speed values are used to study the impact of different
TBM construction digging speeds on ground settle-
ment. For the sensitivity analysis of different driving
pressures, construction reports and on-site measure-
ments revealed that the driving pressures to be used in
the TBM driving simulation are 120 kN/m2, 240 kN/
m2, 360 kN/m2, 480 kN/m2, and 600 kN/m2.
3.4 Shield Simulation Construction Steps
The actual TBM construction process is complicated.
In this study, the steps are simplified with some
approximation for the simulation, and the later con-
solidation and rheology of the soil are not considered.
The main loads applied are shown in Fig. 6.
For simulating the construction, two segments with
a size of 3 m are required as a construction step; the
excavation is conducted first on the left line and then
on the right line. A total of 36 construction steps are
performed on the left and right lines, and each
construction step is a circular excavation process.
The model simulation of TBM construction consists of
four main steps. The first is to generate an initial stress
field; the second is to simulate different TBM driving
speeds; the third is to simulate different TBM driving
pressures; and the fourth is to simulate the effect of the
vibration generated by the TBM cutter head (while
driving into the tunnel face) on the vibration of the
ground structures. The first, second, and third steps are
solved by static mode, and the fourth step is solved by
eigenvalue analysis and non-linear time history anal-
ysis (direct integration method) in the software. In the
various solution modes, the boundary conditions of the
model are set differently. In the static mode solution,
the bottom boundary nodes remain unchanged for the
fully constrained model; both ends of the model are set
as static boundaries at both ends of the normal
constrained model during the vibration analysis stage,
and the bottom boundary conditions of the model (Sun
and Yang 2019).
4 Reliability Verification
On-site monitoring data show that the total thrust in
the Haixiao section is in the range of 133–266 N/m2,
and the driving speed is in the range of 0.6–2.4 m/h.
Figures 7 and 8 show that the actual monitoring
data and numerical simulation data have the same
change trend, and that the settlement values are not
significant. The settlement at DC1 decreases with the
progress of excavation steps, and the settlement curve
at DC2 is similar in both the monitoring and simula-
tion data. Owing to various accidental factors in the
actual project that affect the settlement value, the
actual settlement on site is more than the simulated
Table 1 Mechanical parameters of geotechnical media in the model
Material Elastic modulus
(MPa)
Poisson’s
ratio
Volumetric weight
(kN/m3)
Cohesive forces
(kPa)
Friction angle
(�)
Miscellaneous fill 6.0 0.30 17.5 19.0 12
Silty clay 10.0 0.30 19.9 22.6 25
Medium-coarse sand 20.0 0.30 18.5 34.7 30
Upper subzone of strong weathered
granite
45.0 0.35 22.5 30.0 33
Lower subzone of strong weathered
granite
50.0 0.36 23.0 30.0 35
Middle zone of weathered granite 4.5*103 0.40 25.0 80.0 37
Micro-weathered granite 1.2*104 0.45 26.7 120 40
Segment/bridge 3.35*104 0.4 23.87
Shield shell 2.06*104 0.4 78.5
Pier 3.35*10 0.4 23.76
123
Geotech Geol Eng (2021) 39:5727–5741 5731

value. The settlement is large, but within the allowable
safety range, and the maximum error is 10.7%. It can
be seen from the figures that at DC1 and DC2, the
surface settlement obtained by the finite element
calculation and the actual measurement are approxi-
mately the same. Thus, the two values agree well,
indicating that it is feasible to use numerical simula-
tion to analyze the TBM construction process.
5 Sensitivity Analysis
In the TBM construction, the surrounding soil is
disturbed during the forward movement, as manifested
by ground subsidence and deformation. The ground
surface deformation during the TBM operation is
mainly manifested in three aspects: The deformation
of the ground when the TBM cutter head reaches the
tunnel face; the deformation of the ground when the
TBM cutter head reaches and passes through the
tunnel face; and consolidation at the later stage of the
surface (Avunduk and Copur 2019).
5.1 Effect of Driving Speed
The variation in the final settlement of the ground
surface under different driving speeds is shown in
Fig. 9. The entire surface of the tunnel is under sinking
state during the tunnel excavation, and the largest
surface settlement occurs at the axis of the tunnel.
Fig. 6 Mechanical loads during TBM operation
Fig. 7 Settlement curve at DC1Fig. 8 Settlement curve at DC2
123
5732 Geotech Geol Eng (2021) 39:5727–5741

Although the tunnel is constructed by double-line
excavation, no two settlement grooves are symmetri-
cal about the central axis on the surface, because the
tunnel has a large burial depth, and the effect of the
double-line tunnel excavation on ground settlement is
weakened. The subsidence of the ground surface
approximately 30 m away from the central axis of the
tunnel is within 1 mm, which has minimal influence
on the ground. The surface subsidence starts increas-
ing sharply when the distance is less than 30 m. The
figure shows that when the driving speed is 1700s/m
(2.55 m/h), 2000s/ms (2.11 m/h), 2300 s/ms (1.8 m/
h), 2600 s/m (1.56 m/h), and 2900 s/m (1.38 m/h), the
surface settlement of the central axis is 3.22, 3.43,
3.63, 3.96, and 4.18 mm, respectively. Tunneling
speed has an effect on the surface settlement; the
settlement is small when the tunneling speed is high.
To maximize the economic benefits in the TBM
construction, the driving speed should be increased as
much as possible (with control of other driving
parameters) to reduce the ground subsidence and the
impact on the surface structures (Arbabsiar et al.
2020).
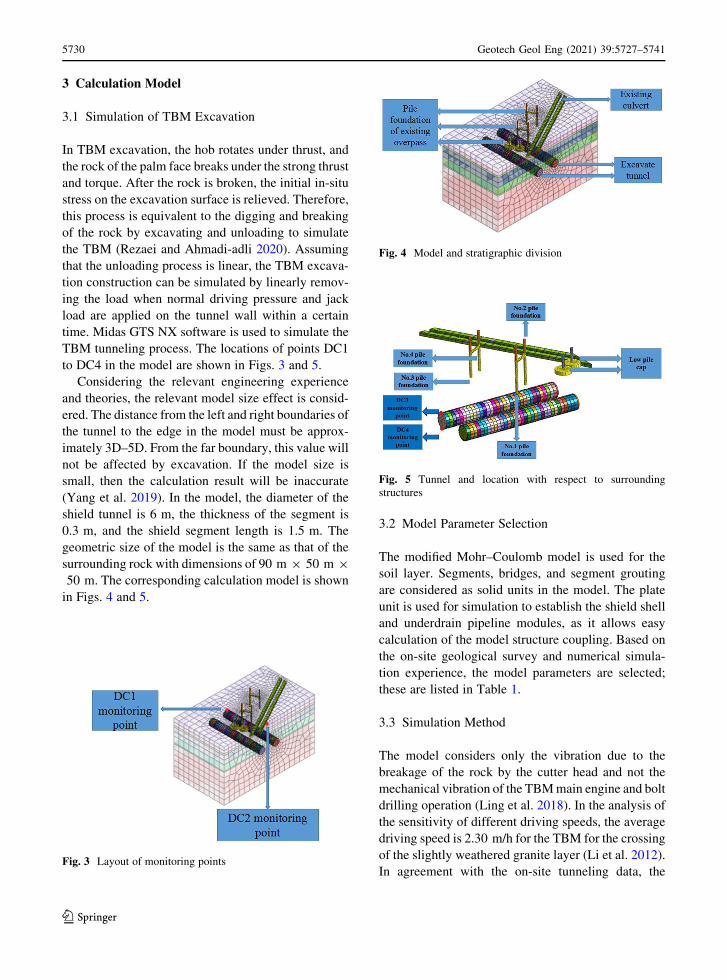
5.2 Effect of Heading Pressure
According to the relevant literature (Nagel and
Meschke 2011), subsidence occurs on the surface
when the earth pressure is less than the active earth
pressure, as shown in Fig. 10. When the earth pressure
is greater than its passive value, the earth’s surface
may exhibit an uplift. When the earth pressure is
between its active and passive values, the ground
surface neither sinks nor swells. In soft to plastic clay,
a reasonable value of pressure (P) can be determined
according to the following equation.
P ¼ k � c � H ð1Þ
where k is the earth pressure coefficient which is
normally in the range of 0.35–0.75; c is the bulk
density (weighted average) of the soil layer above the
centerline of the shield; and H is the vertical distance
of the central axis of the shield tunnel from the natural
ground, and the unit is meters.
The graphs of the maximum settlement of the
surface of the two tunnels and the centerline of the left
and right tunnels under different driving pressures are
shown in Figs. 11, 12, 13 and 14. With the increase in
tunneling pressure, the maximum settlement of the
surface of the tunnel center also increases. However,
the settlement rate decreases first, suddenly increases
after the 18th construction step, and then continues to
decrease. This phenomenon occurs because the TBM
construction in this section is conducted first on the left
line and then on the right line, with the right-line
excavation as the 18th construction step. As the
construction of the left-line tunnel progresses, the
surface settlement of the left-line tunnel is greater than
that of the right-line tunnel; when the construction of
the left-line tunnel is completed, the surface settlement
value tends to stabilize; When the right-line tunnel is
excavated, the later-excavated right-line tunnel will
continue to cause the settlement of the surface soil in
the center line of the left-line tunnel, and the left-line
tunnel that has been excavated will cause the dis-
placement field of the surrounding rock and soil of the
right-line tunnel. The change has a certain impact on
the construction of the right-line tunnel, causing the
ground settlement during the construction of the right-
line tunnel to be significantly greater than that of the
single-line tunnel excavation, and the mutual distur-
bance effect of the two-line shield excavation is
obvious. During the excavation of the left line, the
maximum settlement line of the surface is always near
the left tunnel surface. When the right line is
excavated, the maximum settlement line of the surface
is close to the surface of the center axis of the right line
tunnel, thereby causing the maximum settlement of
the ground on the central axis of the left and right
tunnels to increase suddenly. A comparison of the
Fig. 9 Final settlement of the ground
123
Geotech Geol Eng (2021) 39:5727–5741 5733
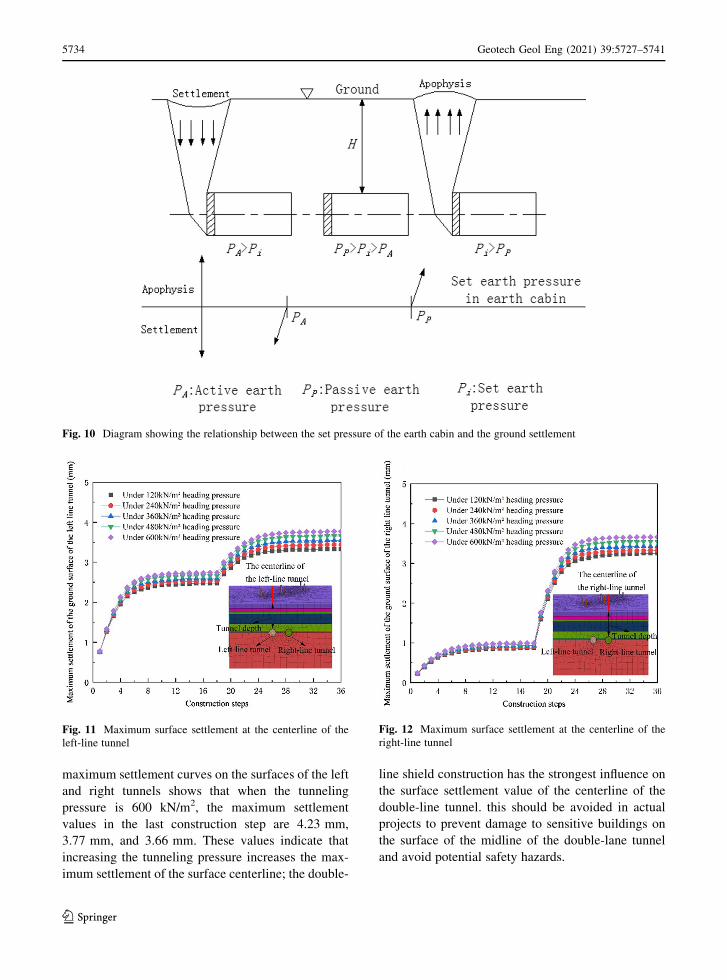
maximum settlement curves on the surfaces of the left
and right tunnels shows that when the tunneling
pressure is 600 kN/m2, the maximum settlement
values in the last construction step are 4.23 mm,
3.77 mm, and 3.66 mm. These values indicate that
increasing the tunneling pressure increases the max-
imum settlement of the surface centerline; the double-
line shield construction has the strongest influence on
the surface settlement value of the centerline of the
double-line tunnel. this should be avoided in actual
projects to prevent damage to sensitive buildings on
the surface of the midline of the double-lane tunnel
and avoid potential safety hazards.
Fig. 10 Diagram showing the relationship between the set pressure of the earth cabin and the ground settlement
Fig. 11 Maximum surface settlement at the centerline of the
left-line tunnel
Fig. 12 Maximum surface settlement at the centerline of the
right-line tunnel
123
5734 Geotech Geol Eng (2021) 39:5727–5741

Figure 15 shows that the cumulative subsidence of
the surface decreases with the increase in driving
pressure. The successively decreasing rates are 8.63%,
9.20%, 10.11%, and 11.28% at the same surface
location. In practical engineering applications, the
TBM driving pressure should be increased to maxi-
mize the economic effect and to reduce the surface
subsidence and the impact on the surface structures.
5.3 Analysis of Vertical Displacement
of Abutment Pile Foundation
The vertical displacement cloud diagram of the pile
foundation of the overpass under different driving
pressures is shown in Fig. 16.
It can be seen from Fig. 16 that the values of the
vertical displacement vary with driving pressure. The
maximum displacement values at driving pressures of
120 kN/m2, 240 kN/m2, 360 kN/m2, 480 kN/m2, and
600 kN/m2 are - 1.01 mm, - 0.93 mm, - 0.86 mm,
- 0.78 mm, and - 0.70 mm, respectively. The min-
imum displacement values are - 4.06 mm,
- 3.98 mm, - 3.91 mm, - 3.83 mm, and
- 3.76 mm corresponding to the above pressures.
The negative sign indicates that the direction is
downward, which refers to the settlement. While the
vertical displacement under a driving pressure of 120
kN/m2 has exceeded the safe limit for pile foundation
settlement by ± 4 mm, the value is not very large.
The excavation of the new subway tunnel by the TBM
process will lead to settlement of the pile foundation of
the overpass; this does not meet the requirements of
the actual engineering specification under the driving
pressure of 120 kN/m2. By analyzing the settlement, it
can be seen that as the driving pressure increases, the
pile foundation settlement of the overpass decreases.
From the values of the maximum settlement at
different driving pressures, it can be seen that the rate
of maximum settlement reduction is 2.01%, 1.79%,
2.09%, and 1.86%, and irrespective of the value of the
driving pressure, the maximum displacement appears
at the position of the low pile cap. The minimum
displacement appears at the pile foundation of pile pier
No. 1 with the greatest length, and the second is at the
pile foundation of pile pier No. 2 with the second
greatest length. It shows that the deeper the pier is, the
closer it is to the interval line from the excavation
tunnel, and the greater is the effect of excavation on
the pier. This is a key point that should be considered
in the project (Cao and Zhuge 2013).
In the process of TBM excavation, the left and right
tunnels are excavated through pile foundations No. 1,
No. 2, No. 3, and No. 4, in turn. The vertical settlement
of the pile foundation caused by different driving
pressures is shown in Figs. 17, 18, 19 and 20.
As can be seen from Figs. 17, 18, 19 and 20, the
displacement curves of pile foundations of the piled
bridge piers with different lengths and positions are
different, and the trends of the vertical displacement
curves of pile foundations No. 1, No. 2, and No. 4 are
similar. With the progress of construction steps, the
changes in vertical displacement stabilize first, and
then accelerate; subsequently, the changes continue
gradually, and finally accelerate again. The pile
foundations No. 1 and No. 4 are approximately in a
vertical plane. The effect of the TBM excavation on
these foundations is similar. However, the lengths of
the two pile foundations from the excavation surface
of the subway are different. The pile foundation No. 1
is closer to the excavation tunnel, and hence its final
vertical settlement is greater than that of pile founda-
tion No. 4. Thus, the pile foundation close to the tunnel
section line should be paid more attention during
construction. For pile foundations No. 1 and No. 2, the
length is greater, and they are located near the
centerline of the left and right tunnels. The construc-
tion of the left and right lines has the same effect on
pile foundations No. 1 and No. 2, but pile foundation
No. 2 is relatively short in length, and hence the final
Fig. 13 Maximum surface settlement at the centerline of the
left and right tunnels tunnels
123
Geotech Geol Eng (2021) 39:5727–5741 5735

settlement value is less than that in the case of pile
foundation No. 1. For the vertical displacement curves
of piles No. 1, No. 2, and No. 4, the settlement values
increase significantly at the twenty-fifth step of
construction. Considering that the left-line excavation
is conducted before the right-line excavation, it can be
concluded that the effect of the right-line construction
on the pile foundation is greater than that of the left-
line construction. The final settlement values of pile
foundations No. 1, No. 2, and No. 4 are greater than
that of pile foundation No. 3, and hence special
attention should be paid to the change in the pile
foundation settlement of pile column piers No. 1, No.
2, and No. 4 overpass during the right-line tunnel
excavation. The vertical displacement of pile column
pier No. 3 increases first and then becomes smooth
until the final settlement value is approximately 2 mm,
which is far less than the safe limit for pile foundation
Fig. 14 Cloud map of vertical displacement under different driving pressures
123
5736 Geotech Geol Eng (2021) 39:5727–5741

settlement (± 4 mm). For the vertical displacement
curves of the pile foundations under different driving
pressures, the foundations of piles No. 2 and No. 4
show significant changes in settlement values under
different driving pressures, indicating that pile foun-
dations No. 2 and No. 4 are more sensitive to changes
in driving pressure; irrespective of the pile foundation,
with the increase in driving pressure, the settlement
value decreases.
5.4 Shield Fuselage Vibration Analysis
5.4.1 Vibration Control Specifications
To date, no specific control standard has been
established for the vibrations during TBM construc-
tion in China. To evaluate the effect of the vibrations
on the structures, the main vibration frequency and
peak vibration speed are normally used in China and
other countries. Blasting safety regulations provide the
allowable particle vibration speed of various building
structures in different main vibration frequency
ranges. With reference to this standard, a safety
assessment of TBM construction vibration is con-
ducted as follows (Avunduk and Copur 2019).
5.4.2 Analysis of Simulation Results
The velocity curves in the vertical (Vy) and horizontal
(VX) directions at section DC2 in the ground are
shown in Fig. 21.
The vertical vibration velocity is the smallest near
the central axis of the two tunnels, and the largest
above the respective tunnels. The maximum vibration
speed is 3.32 mm/s near the left line and 1.94 mm/s
near the right line; the speeds gradually decrease
toward both sides. The horizontal vibration velocity is
the largest near the left tunnel with a maximum value
of 12.13 mm/s, which decreases gradually toward
both sides. The horizontal vibration speed is always
greater than the vertical vibration speed, and the
maximum vibration speed does not exceed the general
civil building requirement of 20 cm/s. Therefore, the
ground vibration speed caused by tunneling is within
the safe range; thus, the horizontal vibration plays a
key role. In practical engineering applications, the
impact of the horizontal vibration on surface vibration
should be considered.
Points DC3 and DC4 at the upper and lower parts of
the surrounding rock of the right-line tunnel are
studied to analyze the effect of the vibration caused by
TBM tunneling on the surrounding rock soil. Fig-
ure 22 shows the curve of the vibration speed at DC3
and DC4, on the surface with the construction time.
The vibration of the TBM excavation greatly influ-
ences the surrounding rock of the upper and lower
tunnels. With continued excavation, the vibration
speed shows the same increasing trend. The rate of
increase of vibration speed is the highest in the first
1000 s and gradually decreases thereafter. The upper
part receives a larger impact (higher by 1.5%) than the
lower part. In actual construction, the upper surround-
ing rock vibration support must be considered to
prevent hidden safety hazards.
6 Conclusion
In this work, referring to the TBM construction of
Qingdao Metro Line 1 in the Haixiao section, the
measured data and numerical simulation results are
compared to confirm the reliability of the simulation,
and a sensitivity analysis is performed on ground
subsidence and surrounding environment under dif-
ferent construction parameters by using the constitu-
tive model. The following conclusions are drawn.
(1) In the TBM construction, different driving
speeds have varying effects on the surface.
When the other driving parameters are
Fig. 15 Accumulated surface settlement map
123
Geotech Geol Eng (2021) 39:5727–5741 5737

123
5738 Geotech Geol Eng (2021) 39:5727–5741

controlled, the settlement is small when the
driving speed is high. To maximize the eco-
nomic benefits, the digging speed should be
increased so that the ground subsidence and
impact on the ground structures are reduced.
(2) For the construction of the double-line shield
tunnel, the left-line construction is carried out
first, and then the right-line construction. With
the construction of the left-line tunnel, the
surface settlement on the center line of the
left-line tunnel is greater than the surface
settlement on the center line of the right-line
tunnel; after the construction is completed, the
surface settlement value tends to stabilize; when
the right-line tunnel is being excavated, the
right-line tunnel excavated afterwards will con-
tinue to cause the settlement of the surface soil
in the center line of the left-line tunnel, and the
left-line tunnel that has been excavated will
change the displacement field of the rock and
soil around the right-line tunnel, which will
have a certain impact on the construction of the
right-line tunnel, causing the ground settlement
during the construction of the right-line tunnel
to be significantly greater than that of the single-
line tunnel. For tunnel excavation, the mutual
bFig. 16 Cloud map of vertical displacement of pile foundation
of overpass
Fig. 17 Vertical displacement of pile foundation No.1
Fig. 18 Vertical displacement of pile foundation No.2
Fig. 19 Vertical displacement of pile foundation No. 3
Fig. 20 Vertical displacement of pile foundation No. 4
123
Geotech Geol Eng (2021) 39:5727–5741 5739

disturbance effect of double-track shield exca-
vation is obvious. The double-line shield con-
struction has the strongest effect on the surface
settlement value of the double-line tunnel.
(3) Different tunneling pressures have varying
effects on the surface. Within a certain range,
the settlement is small when the tunneling
pressure is high. In practical engineering appli-
cations, the TBM driving pressure should be
increased to maximize the economic effect and
reduce the surface subsidence and the impact on
the surface building.
(4) For TBM construction of subway tunnels pass-
ing through pile-type piers, the closer the piers
are to the excavation tunnel section line, the
greater the impact of excavation on the piers.
Special attention should be paid to this key point
in the project. During the construction, special
attention should be paid to the pile foundation
near the tunnel section line.
(5) The horizontal vibration velocity caused by the
TBM construction in this geological environ-
ment is always greater than the vertical velocity,
and the maximum vibration velocity does not
exceed the requirement of 20 mm/s for general
civil buildings. The vibration caused by TBM
excavation greatly affects the upper and lower
surrounding rocks of the tunnel. The vibration
effect basically shows an increasing trend with
the impact on the upper side approximately
1.5% larger than that on the lower side.
Open Access This article is licensed under a Creative
Commons Attribution 4.0 International License, which
permits use, sharing, adaptation, distribution and reproduction
in any medium or format, as long as you give appropriate credit
to the original author(s) and the source, provide a link to the
Creative Commons licence, and indicate if changes were made.
The images or other third party material in this article are
included in the article’s Creative Commons licence, unless
indicated otherwise in a credit line to the material. If material is
not included in the article’s Creative Commons licence and your
intended use is not permitted by statutory regulation or exceeds
the permitted use, you will need to obtain permission directly
from the copyright holder. To view a copy of this licence, visit
http://creativecommons.org/licenses/by/4.0/.
References
Arbabsiar MH, Ebrahimi Farsangi MA, Mansouri H (2020) A
new model for predicting the advance rate of a tunnel
boring machine (Tbm) in hard rock conditions. Rudarsko-
Geolosko-Naftni Zbornik 35:57–74. https://doi.org/10.
17794/rgn.2020.2.6
Avunduk E, Copur H (2019) Effect of Clogging on EPB TBM
performance: a case study in Akfirat waste water Tunnel,
Turkey. Geotech Geol Eng 37:4789–4801. https://doi.org/
10.1007/s10706-019-00938-6
Aygar EB (2020) Evaluation of new Austrian tunnelling method
applied to Bolu tunnel’s weak rocks. J Rock Mech Geotech
Eng 12:541–556. https://doi.org/10.1016/j.jrmge.2019.12.
011
Bahrainy H, Khosravi H (2013) The impact of urban design
features and qualities on walkability and health in under-
construction environments: the case of Hashtgerd New
Town in Iran. Cities 31:17–28. https://doi.org/10.1016/j.
cities.2013.01.001
Cao YH, Zhuge AJ (2013) Effect of shield tunneling on existent
piles in soft soil area. Adv Mater Res 671–674:1093–1097.
Fig. 21 Curve of surface vibration speed
Fig. 22 Vibration speed curves at DC3 and DC4
123
5740 Geotech Geol Eng (2021) 39:5727–5741

https://doi.org/10.4028/www.scientific.net/AMR.671-674.
1093
Faramarzi L, Kheradmandian A, Azhari A (2020) Evaluation
and optimization of the effective parameters on the shield
TBM performance: Torque and Thrust—using discrete
element method (DEM). Geotech Geol Eng 38:2745–2759.
https://doi.org/10.1007/s10706-020-01183-y
Hasanpour R, Schmitt J, Ozcelik Y, Rostami J (2017) Exam-
ining the effect of adverse geological conditions on jam-
ming of a single shielded TBM in Uluabat tunnel using
numerical modeling. J Rock Mech Geotech Eng
9:1112–1122. https://doi.org/10.1016/j.jrmge.2017.05.010
Komu MP, Guney U, Kilickaya TE, Gokceoglu C (2019) Using
3D numerical analysis for the assessment of tunnel-land-
slide relationship: Bahce-Nurdag tunnel (South of Turkey).
Geotech Geol Eng 38:1237–1254. https://doi.org/10.1007/
s10706-019-01084-9
Kwak C-W, Park I-J (2015) Numerical simulation for surface
settlement considering face vibration of TBM tunnelling in
mixed-face condition. J Korean Tunn Undergr Space
Assoc 17:333–339. https://doi.org/10.9711/ktaj.2015.17.3.
333
Li C, Tiedemann J, Zhou HW (2012) Quantitative analysis of
several influencing factors on TBM advance speed. Adv
Mater Res 594–597:1318–1323. https://doi.org/10.4028/
www.scientific.net/AMR.594-597.1318
Ling J, Sun W, Yang X, Tong X, Zhang N (2018) Vibration
response and parameter influence of TBM cutterhead sys-
tem under extreme conditions. J Mech Sci Technol
32:4959–4969. https://doi.org/10.1007/s12206-018-0944-
8
Liu C, Peng Z, Pan L, Liu H, Yang Y, Chen W, Jiang H (2020)
Influence of tunnel boring machine (TBM) advance on
adjacent tunnel during ultra-rapid underground pass
(URUP) tunneling: a case study and numerical investiga-
tion. Appl Sci. https://doi.org/10.3390/app10113746
Liu Q, Huang X, Gong Q, Du L, Pan Y, Liu J (2016) Application
and development of hard rock TBM and its prospect in
China. Tunn Undergr Space Technol 57:33–46. https://doi.
org/10.1016/j.tust.2016.01.034
Lv JL, Jiang Y (2012) Mechanism analysis of the impact on
Chinese Urban rail transit construction on the surrounding
real estate prices. Appl Mech Mater 178–181:1866–1869.
https://doi.org/10.4028/www.scientific.net/AMM.178-
181.1866
Nagel F, Meschke G (2011) Grout and bentonite flow around a
TBM: computational modeling and simulation-based
assessment of influence on surface settlements. Tunn
Undergr Space Technol 26:445–452. https://doi.org/10.
1016/j.tust.2010.12.001
Namli M, Aras F (2020) Investigation of effects of dynamic
loads in metro tunnels during construction and operation on
existing buildings. Arab J Geosci. https://doi.org/10.1007/
s12517-020-05456-x
Pirastehfar K, Shivaei S, Sadaghiani MH, Nikooee E (2020) 3D
numerical investigation of the effects of driving of the new
mechanized tunnel on existing segmental linings and
ground surface settlements - a case study: Shiraz metro line
2. Int J Geotech Eng. https://doi.org/10.1080/19386362.
2020.1816381
Rezaei AH, Ahmadi-adli M (2020) The volume loss: real esti-
mation and its effect on surface settlements due to exca-
vation of tabriz metro tunnel. Geotech Geol Eng
38:2663–2684. https://doi.org/10.1007/s10706-019-
01177-5
Sun B, Yang S (2019) An improved 3D finite difference model
for simulation of double shield TBM tunnelling in heavily
jointed rock masses: the DXL tunnel case. Rock Mech
Rock Eng 52:2481–2488. https://doi.org/10.1007/s00603-
018-1730-8
Wu L, Guan T, Lei L (2013) Discrete element model for per-
formance analysis of cutterhead excavation system of EPB
machine. Tunn Undergr Space Technol 37:37–44. https://
doi.org/10.1016/j.tust.2013.03.003
Wu Z, Jiang Y, Liu Q, Ma H (2018) Investigation of the exca-
vation damaged zone around deep TBM tunnel using a
Voronoi-element based explicit numerical manifold
method. Int J RockMechMin Sci 112:158–170. https://doi.
org/10.1016/j.ijrmms.2018.10.022
Yang H, Shi H, Jiang X, Liu C, Yu L (2020) Study on influence
of construction process of double-line shield tunnels on
frame structure. Geotech Geol Eng. https://doi.org/10.
1007/s10706-020-01569-y
Yang S-Q, Tao Y, Xu P, Chen M (2019) Large-scale model
experiment and numerical simulation on convergence
deformation of tunnel excavating in composite strata. Tunn
Undergr Space Technol. https://doi.org/10.1016/j.tust.
2019.103133
Zhang K, Yu H, Liu Z, Lai X (2010) Dynamic characteristic
analysis of TBM tunnelling in mixed-face conditions.
Simul Model Pract Theory 18:1019–1031. https://doi.org/
10.1016/j.simpat.2010.03.005
Publisher’s Note Springer Nature remains neutral with
regard to jurisdictional claims in published maps and
institutional affiliations.
123
Geotech Geol Eng (2021) 39:5727–5741 5741