mechanical characterization of enamel coated steel...
TRANSCRIPT
Mechanical Characterization of Enamel Coated Steel Bars
by
Fujian Tang, Genda Chen, Jeffery S. Volz, Richard K. Brow, and Michael Koenigstein
A National University Transportation Center at Missouri University of Science and Technology
NUTC R208
Disclaimer
The contents of this report reflect the views of the author(s), who are responsible for the facts and the
accuracy of information presented herein. This document is disseminated under the sponsorship of
the Department of Transportation, University Transportation Centers Program and the Center for
Transportation Infrastructure and Safety NUTC program at the Missouri University of Science and
Technology, in the interest of information exchange. The U.S. Government and Center for
Transportation Infrastructure and Safety assumes no liability for the contents or use thereof.
NUTC ###
Technical Report Documentation Page
1. Report No.
NUTC R208
2. Government Accession No. 3. Recipient's Catalog No.
4. Title and Subtitle
Mechanical Characterization of Enamel Coated Steel Bars
5. Report Date
December 2012
6. Performing Organization Code
7. Author/s
Genda Chen
8. Performing Organization Report No.
Project # 00018130
9. Performing Organization Name and Address
Center for Transportation Infrastructure and Safety/NUTC program Missouri University of Science and Technology 220 Engineering Research Lab Rolla, MO 65409
10. Work Unit No. (TRAIS)
11. Contract or Grant No.
DTRT06-G-0014
12. Sponsoring Organization Name and Address
U.S. Department of Transportation Research and Innovative Technology Administration 1200 New Jersey Avenue, SE Washington, DC 20590
13. Type of Report and Period Covered
Final
14. Sponsoring Agency Code
15. Supplementary Notes
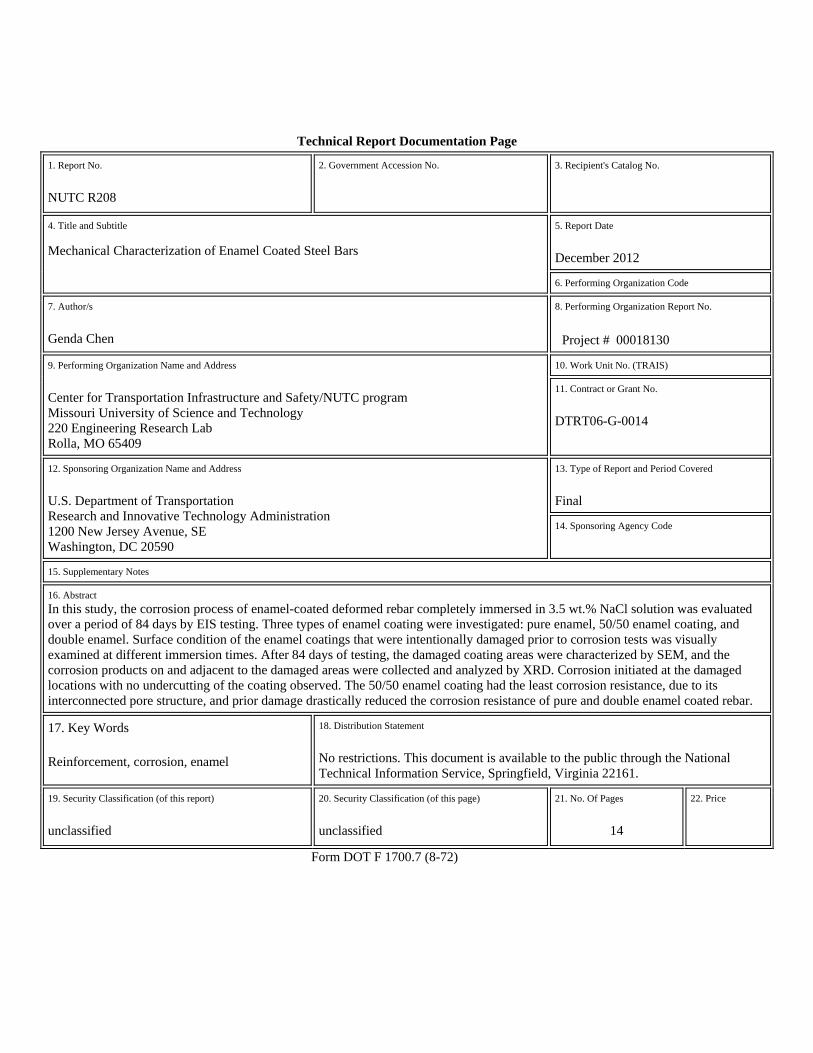
16. Abstract
In this study, the corrosion process of enamel-coated deformed rebar completely immersed in 3.5 wt.% NaCl solution was evaluated over a period of 84 days by EIS testing. Three types of enamel coating were investigated: pure enamel, 50/50 enamel coating, and double enamel. Surface condition of the enamel coatings that were intentionally damaged prior to corrosion tests was visually examined at different immersion times. After 84 days of testing, the damaged coating areas were characterized by SEM, and the corrosion products on and adjacent to the damaged areas were collected and analyzed by XRD. Corrosion initiated at the damaged locations with no undercutting of the coating observed. The 50/50 enamel coating had the least corrosion resistance, due to its interconnected pore structure, and prior damage drastically reduced the corrosion resistance of pure and double enamel coated rebar.
17. Key Words
Reinforcement, corrosion, enamel
18. Distribution Statement
No restrictions. This document is available to the public through the National Technical Information Service, Springfield, Virginia 22161.
19. Security Classification (of this report)
unclassified
20. Security Classification (of this page)
unclassified
21. No. Of Pages
14
22. Price
Form DOT F 1700.7 (8-72)
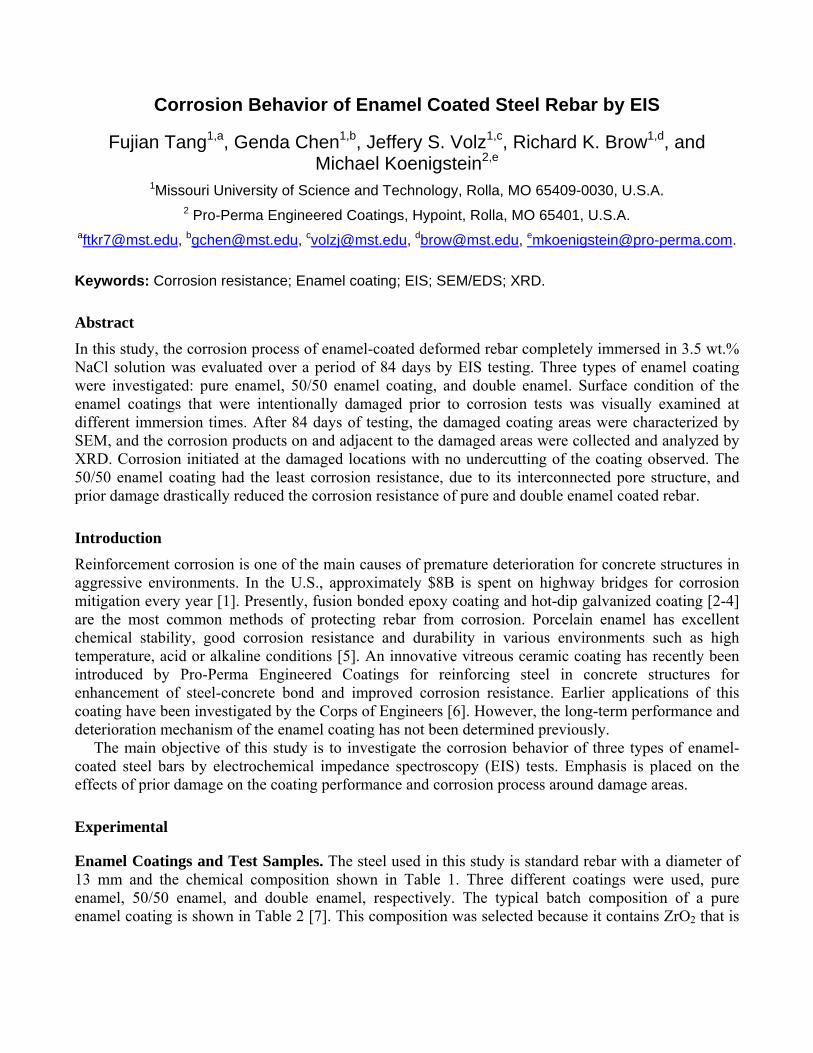
Corrosion Behavior of Enamel Coated Steel Rebar by EIS
Fujian Tang1,a, Genda Chen1,b, Jeffery S. Volz1,c, Richard K. Brow1,d, and Michael Koenigstein2,e
1Missouri University of Science and Technology, Rolla, MO 65409-0030, U.S.A. 2 Pro-Perma Engineered Coatings, Hypoint, Rolla, MO 65401, U.S.A.
[email protected], [email protected], [email protected], [email protected], [email protected].
Keywords: Corrosion resistance; Enamel coating; EIS; SEM/EDS; XRD.
Abstract
In this study, the corrosion process of enamel-coated deformed rebar completely immersed in 3.5 wt.% NaCl solution was evaluated over a period of 84 days by EIS testing. Three types of enamel coating were investigated: pure enamel, 50/50 enamel coating, and double enamel. Surface condition of the enamel coatings that were intentionally damaged prior to corrosion tests was visually examined at different immersion times. After 84 days of testing, the damaged coating areas were characterized by SEM, and the corrosion products on and adjacent to the damaged areas were collected and analyzed by XRD. Corrosion initiated at the damaged locations with no undercutting of the coating observed. The 50/50 enamel coating had the least corrosion resistance, due to its interconnected pore structure, and prior damage drastically reduced the corrosion resistance of pure and double enamel coated rebar.
Introduction
Reinforcement corrosion is one of the main causes of premature deterioration for concrete structures in aggressive environments. In the U.S., approximately $8B is spent on highway bridges for corrosion mitigation every year [1]. Presently, fusion bonded epoxy coating and hot-dip galvanized coating [2-4] are the most common methods of protecting rebar from corrosion. Porcelain enamel has excellent chemical stability, good corrosion resistance and durability in various environments such as high temperature, acid or alkaline conditions [5]. An innovative vitreous ceramic coating has recently been introduced by Pro-Perma Engineered Coatings for reinforcing steel in concrete structures for enhancement of steel-concrete bond and improved corrosion resistance. Earlier applications of this coating have been investigated by the Corps of Engineers [6]. However, the long-term performance and deterioration mechanism of the enamel coating has not been determined previously.
The main objective of this study is to investigate the corrosion behavior of three types of enamel-coated steel bars by electrochemical impedance spectroscopy (EIS) tests. Emphasis is placed on the effects of prior damage on the coating performance and corrosion process around damage areas.
Experimental
Enamel Coatings and Test Samples. The steel used in this study is standard rebar with a diameter of 13 mm and the chemical composition shown in Table 1. Three different coatings were used, pure enamel, 50/50 enamel, and double enamel, respectively. The typical batch composition of a pure enamel coating is shown in Table 2 [7]. This composition was selected because it contains ZrO2 that is
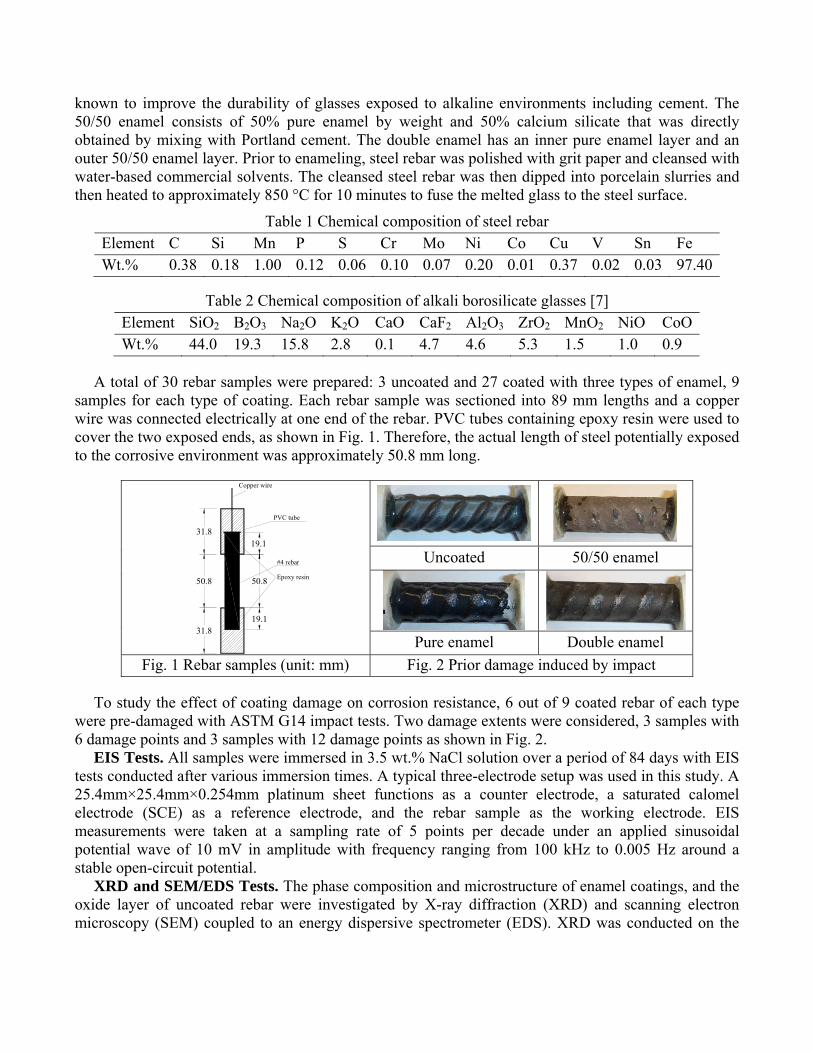
known to improve the durability of glasses exposed to alkaline environments including cement. The 50/50 enamel consists of 50% pure enamel by weight and 50% calcium silicate that was directly obtained by mixing with Portland cement. The double enamel has an inner pure enamel layer and an outer 50/50 enamel layer. Prior to enameling, steel rebar was polished with grit paper and cleansed with water-based commercial solvents. The cleansed steel rebar was then dipped into porcelain slurries and then heated to approximately 850 °C for 10 minutes to fuse the melted glass to the steel surface.
Table 1 Chemical composition of steel rebar Element C Si Mn P S Cr Mo Ni Co Cu V Sn Fe Wt.% 0.38 0.18 1.00 0.12 0.06 0.10 0.07 0.20 0.01 0.37 0.02 0.03 97.40
Table 2 Chemical composition of alkali borosilicate glasses [7] Element SiO2 B2O3 Na2O K2O CaO CaF2 Al2O3 ZrO2 MnO2 NiO CoOWt.% 44.0 19.3 15.8 2.8 0.1 4.7 4.6 5.3 1.5 1.0 0.9
A total of 30 rebar samples were prepared: 3 uncoated and 27 coated with three types of enamel, 9 samples for each type of coating. Each rebar sample was sectioned into 89 mm lengths and a copper wire was connected electrically at one end of the rebar. PVC tubes containing epoxy resin were used to cover the two exposed ends, as shown in Fig. 1. Therefore, the actual length of steel potentially exposed to the corrosive environment was approximately 50.8 mm long.
Copper wire
Epoxy resin
#4 rebar
50.8
31.8
31.8
50.8
19.1
19.1
PVC tube
Uncoated 50/50 enamel
Pure enamel Double enamel
Fig. 1 Rebar samples (unit: mm) Fig. 2 Prior damage induced by impact
To study the effect of coating damage on corrosion resistance, 6 out of 9 coated rebar of each type were pre-damaged with ASTM G14 impact tests. Two damage extents were considered, 3 samples with 6 damage points and 3 samples with 12 damage points as shown in Fig. 2.
EIS Tests. All samples were immersed in 3.5 wt.% NaCl solution over a period of 84 days with EIS tests conducted after various immersion times. A typical three-electrode setup was used in this study. A 25.4mm×25.4mm×0.254mm platinum sheet functions as a counter electrode, a saturated calomel electrode (SCE) as a reference electrode, and the rebar sample as the working electrode. EIS measurements were taken at a sampling rate of 5 points per decade under an applied sinusoidal potential wave of 10 mV in amplitude with frequency ranging from 100 kHz to 0.005 Hz around a stable open-circuit potential.
XRD and SEM/EDS Tests. The phase composition and microstructure of enamel coatings, and the oxide layer of uncoated rebar were investigated by X-ray diffraction (XRD) and scanning electron microscopy (SEM) coupled to an energy dispersive spectrometer (EDS). XRD was conducted on the
surface of as-received and enamel coated rebar samples, and SEM/EDS measurements were performed on longitudinal cross sectional samples 20 mm long. Each was polished with silicon carbide papers with grits of 80, 180, 320, 600, 800 and 1200.
Forensic Studies of Tested Samples. Surface conditions of uncoated and enamel coated samples with damage points were recorded after an immersion time of 7 days, 28 days, 56 days and 84 days, respectively. After 84 days of testing, cross sectional slices 3 mm thick were cut from the damage areas of both uncoated and enamel coated rebar samples. The slices were polished using silicon carbide papers with grits of 80, 180, 320, 600, 800 and 1200 as well. SEM was performed on these slices to investigate the development of corrosion. In addition, the corrosion products around the damage areas were also collected and analyzed by XRD.
Results and Discussions
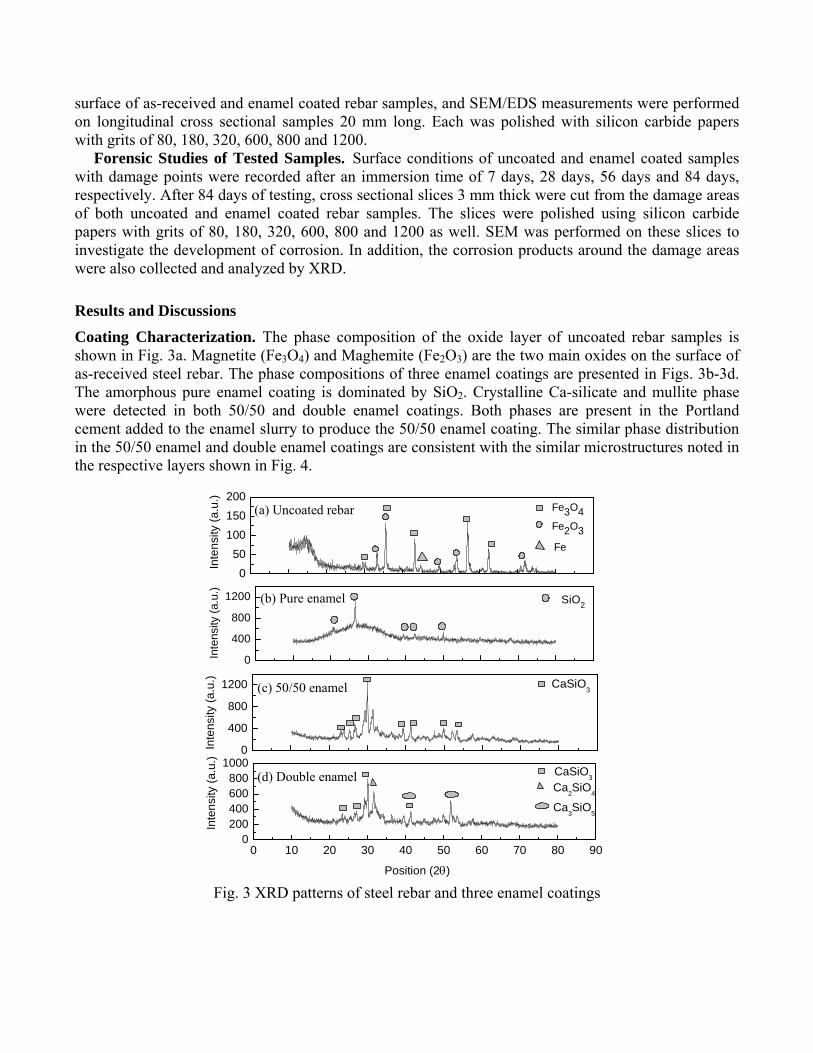
Coating Characterization. The phase composition of the oxide layer of uncoated rebar samples is shown in Fig. 3a. Magnetite (Fe3O4) and Maghemite (Fe2O3) are the two main oxides on the surface of as-received steel rebar. The phase compositions of three enamel coatings are presented in Figs. 3b-3d. The amorphous pure enamel coating is dominated by SiO2. Crystalline Ca-silicate and mullite phase were detected in both 50/50 and double enamel coatings. Both phases are present in the Portland cement added to the enamel slurry to produce the 50/50 enamel coating. The similar phase distribution in the 50/50 enamel and double enamel coatings are consistent with the similar microstructures noted in the respective layers shown in Fig. 4.
0
50
100
150
200
Fe
Fe2O3
Inte
nsi
ty (
a.u
.)
Fe3O4
0
400
800
1200
Inte
nsity
(a.
u.)
SiO2
0
400
800
1200
Inte
nsity
(a
.u.) CaSiO
3
0 10 20 30 40 50 60 70 80 900
200400600800
1000
Ca3SiO
5
Ca2SiO
4
Inte
nsi
ty (
a.u.
)
Position (2)
CaSiO3
Fig. 3 XRD patterns of steel rebar and three enamel coatings
(a) Uncoated rebar
(b) Pure enamel
(c) 50/50 enamel
(d) Double enamel
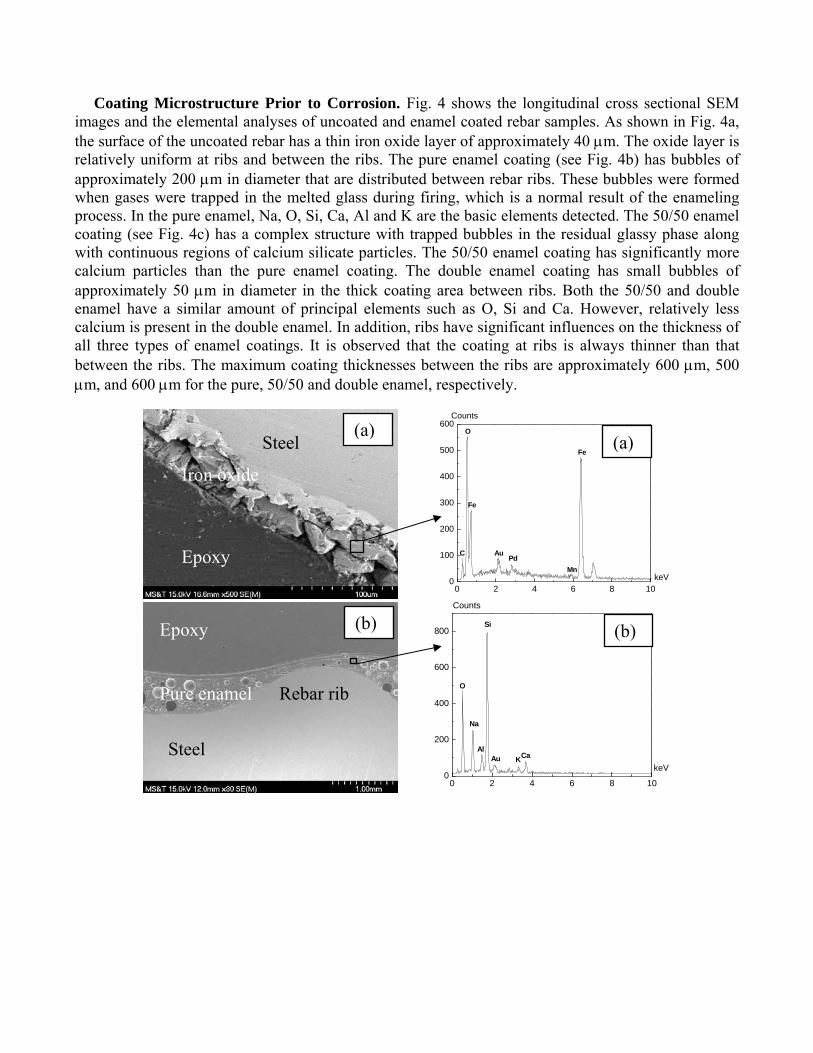
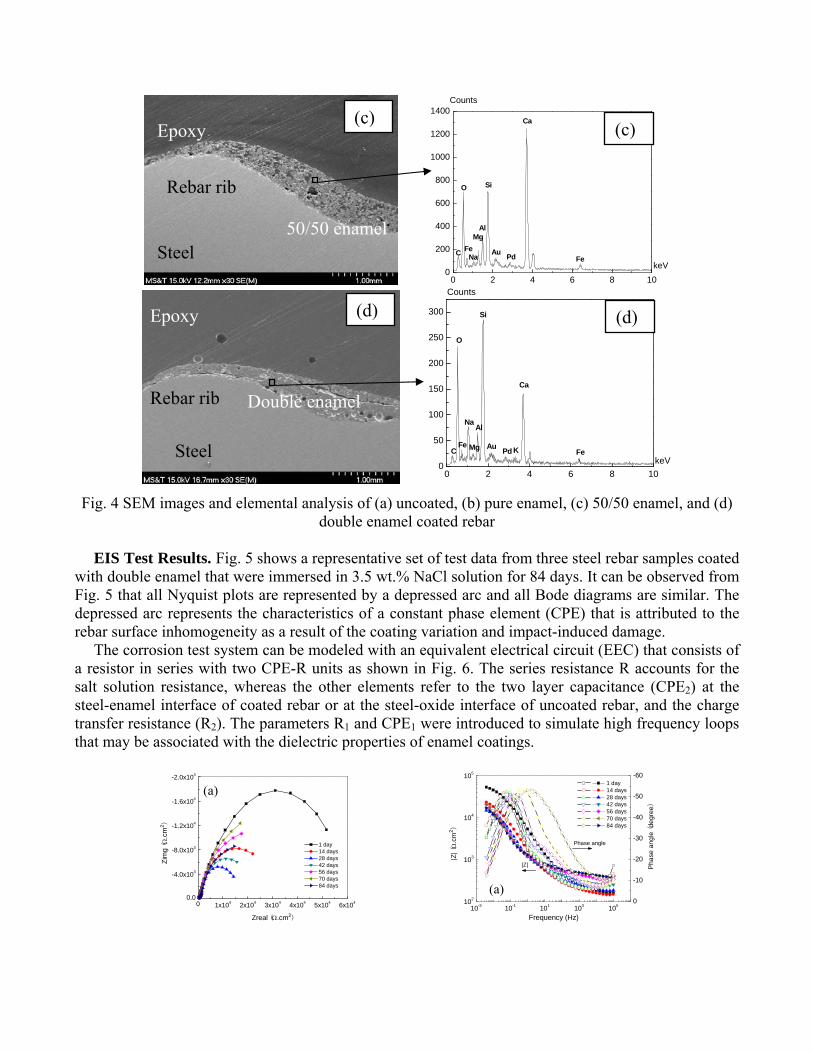
Coating Microstructure Prior to Corrosion. Fig. 4 shows the longitudinal cross sectional SEM images and the elemental analyses of uncoated and enamel coated rebar samples. As shown in Fig. 4a, the surface of the uncoated rebar has a thin iron oxide layer of approximately 40 m. The oxide layer is relatively uniform at ribs and between the ribs. The pure enamel coating (see Fig. 4b) has bubbles of approximately 200 m in diameter that are distributed between rebar ribs. These bubbles were formed when gases were trapped in the melted glass during firing, which is a normal result of the enameling process. In the pure enamel, Na, O, Si, Ca, Al and K are the basic elements detected. The 50/50 enamel coating (see Fig. 4c) has a complex structure with trapped bubbles in the residual glassy phase along with continuous regions of calcium silicate particles. The 50/50 enamel coating has significantly more calcium particles than the pure enamel coating. The double enamel coating has small bubbles of approximately 50 m in diameter in the thick coating area between ribs. Both the 50/50 and double enamel have a similar amount of principal elements such as O, Si and Ca. However, relatively less calcium is present in the double enamel. In addition, ribs have significant influences on the thickness of all three types of enamel coatings. It is observed that the coating at ribs is always thinner than that between the ribs. The maximum coating thicknesses between the ribs are approximately 600 m, 500 m, and 600 m for the pure, 50/50 and double enamel, respectively.
0 2 4 6 8 100
100
200
300
400
500
600
C
Fe
Mn
PdAu
Fe
O
keV
Counts
0 2 4 6 8 100
200
400
600
800
Ca
Si
O
Au K
Al
keV
Counts
Na
Epoxy
Epoxy
Rebar rib
Steel
Pure enamel
Iron oxide
Steel (a)
(a)
(b) (b)
0 2 4 6 8 100
200
400
600
800
1000
1200
1400
Fe
Ca
PdAu
Si
AlMg
NaFe
O
C
Counts
keV
0 2 4 6 8 10
0
50
100
150
200
250
300
Fe
Ca
KPdAu
Si
Al
Mg
Na
Fe
O
keV
Counts
C
Fig. 4 SEM images and elemental analysis of (a) uncoated, (b) pure enamel, (c) 50/50 enamel, and (d) double enamel coated rebar
EIS Test Results. Fig. 5 shows a representative set of test data from three steel rebar samples coated
with double enamel that were immersed in 3.5 wt.% NaCl solution for 84 days. It can be observed from Fig. 5 that all Nyquist plots are represented by a depressed arc and all Bode diagrams are similar. The depressed arc represents the characteristics of a constant phase element (CPE) that is attributed to the rebar surface inhomogeneity as a result of the coating variation and impact-induced damage.
The corrosion test system can be modeled with an equivalent electrical circuit (EEC) that consists of a resistor in series with two CPE-R units as shown in Fig. 6. The series resistance R accounts for the salt solution resistance, whereas the other elements refer to the two layer capacitance (CPE2) at the steel-enamel interface of coated rebar or at the steel-oxide interface of uncoated rebar, and the charge transfer resistance (R2). The parameters R1 and CPE1 were introduced to simulate high frequency loops that may be associated with the dielectric properties of enamel coatings.
0 1x10⁴ 2x10⁴ 3x10⁴ 4x10⁴ 5x10⁴ 6x1040.0
-4.0x10³
-8.0x10³
-1.2x10⁴
-1.6x10⁴
-2.0x10⁴
Zim
g (
.cm
2)
Zreal (.cm2)
1 day 14 days 28 days 42 days 56 days 70 days 84 days
10-3 10-1 101 103 105
102
103
104
105
0
-10
-20
-30
-40
-50
-60
|Z| Pha
se a
ngle
(de
gre
e)
|Z| (
.cm
2 )
Frequency (Hz)
1 day 14 days 28 days 42 days 56 days 70 days 84 days
Phase angle
Rebar rib
Steel
Double enamel
50/50 enamel
Epoxy
Epoxy
Rebar rib
Steel
(c)(c)
(d) (d)
(a)
(a)
0.0 3.0x10³ 6.0x10³ 9.0x10³ 1.2x10⁴ 1.5x1040.0
-3.0x10³
-6.0x10³
-9.0x10³
-1.2x10⁴
Zim
g (
.cm
2)
Zreal (.cm2)
1 day 14 days 28 days 42 days 56 days 70 days 84 days
10-3 10-1 101 103 105
102
103
104
0
-10
-20
-30
-40
-50
-60
-70
|Z|
Pha
se a
ngl
e (
degr
ee)
|Z| (
.cm
2 )
Frequency (Hz)
1 day 14 days 28 days 42 days 56 days 70 days 84 days
Phase angle
0.0 3.0x10³ 6.0x10³ 9.0x10³ 1.2x1040
-1x10³
-2x10³
-3x10³
-4x10³
-5x10³
-6x10³
Zim
g (
.cm
2 )
Zreal (.cm2)
1 day 14 days 28 days 42 days 56 days 70 days 84 days
10-3 10-1 101 103 105
102
103
104
0
-10
-20
-30
-40
-50
-60
-70
|Z|
Pha
se a
ngle
(d
egre
e)
|Z| (
.cm
2)
Frequency (Hz)
1 day 14 days 28 days 42 days 56 days 70 days 84 days
Phase angle
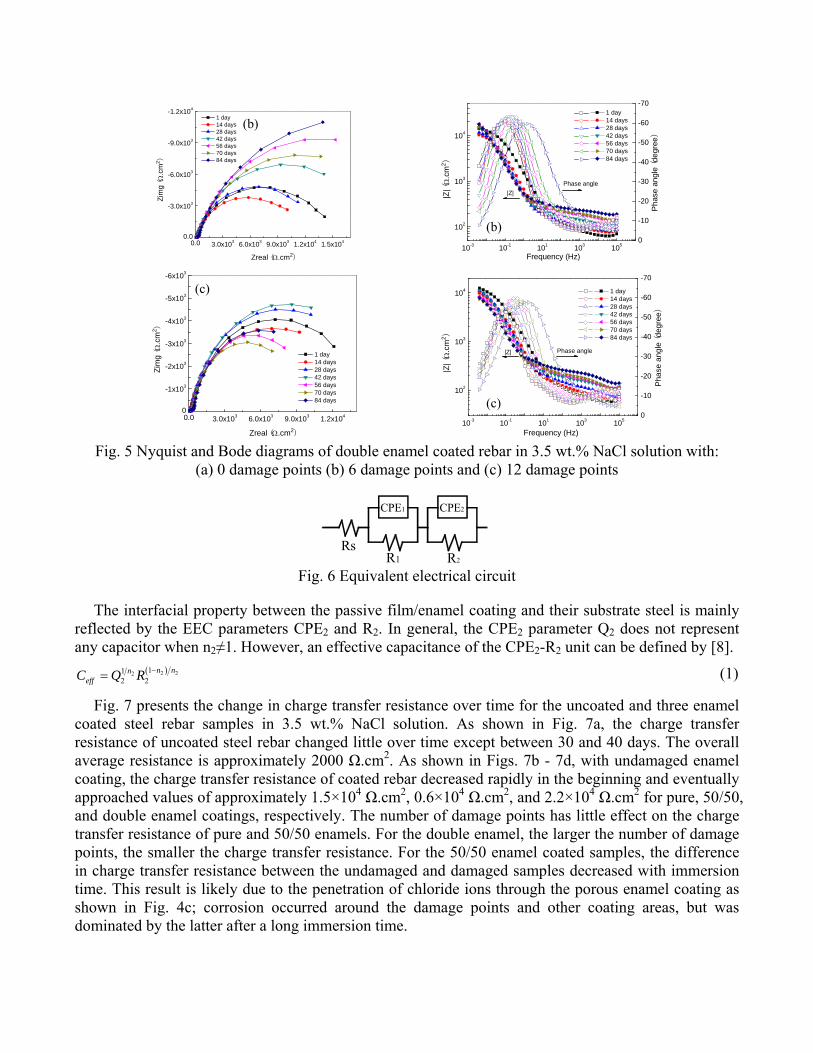
Fig. 5 Nyquist and Bode diagrams of double enamel coated rebar in 3.5 wt.% NaCl solution with:
(a) 0 damage points (b) 6 damage points and (c) 12 damage points
CPE1
RsR1 R2
CPE2
Fig. 6 Equivalent electrical circuit
The interfacial property between the passive film/enamel coating and their substrate steel is mainly reflected by the EEC parameters CPE2 and R2. In general, the CPE2 parameter Q2 does not represent any capacitor when n2≠1. However, an effective capacitance of the CPE2-R2 unit can be defined by [8].
2 22 112 2
n nneffC Q R (1)
Fig. 7 presents the change in charge transfer resistance over time for the uncoated and three enamel coated steel rebar samples in 3.5 wt.% NaCl solution. As shown in Fig. 7a, the charge transfer resistance of uncoated steel rebar changed little over time except between 30 and 40 days. The overall average resistance is approximately 2000 Ω.cm2. As shown in Figs. 7b - 7d, with undamaged enamel coating, the charge transfer resistance of coated rebar decreased rapidly in the beginning and eventually approached values of approximately 1.5×10⁴ Ω.cm2, 0.6×10⁴ Ω.cm2, and 2.2×10⁴ Ω.cm2 for pure, 50/50, and double enamel coatings, respectively. The number of damage points has little effect on the charge transfer resistance of pure and 50/50 enamels. For the double enamel, the larger the number of damage points, the smaller the charge transfer resistance. For the 50/50 enamel coated samples, the difference in charge transfer resistance between the undamaged and damaged samples decreased with immersion time. This result is likely due to the penetration of chloride ions through the porous enamel coating as shown in Fig. 4c; corrosion occurred around the damage points and other coating areas, but was dominated by the latter after a long immersion time.
(b)
(b)
(c)
(c)
0 20 40 60 80 1000.0
6.0x10²
1.2x10³
1.8x10³
2.4x10³
3.0x10³
Ch
arge
tra
nsfe
r re
sist
anc
e (
.cm
2 )
Immersion time (days)
0 20 40 60 80 100
0
1x10⁴
2x10⁴
3x10⁴
4x10⁴
Cha
rge
tran
sfer
res
ista
nce (
.cm
2 )
Immersion time (days)
Without damage points
With 6 damage points
With 12 damage points
0 20 40 60 80 1000.0
7.0x10³
1.4x10⁴
2.1x10⁴
2.8x10⁴
3.5x10⁴
Ch
arg
e tr
ansf
er
resi
sta
nce (
.cm
2 )
Immersion time (days)
Without damage points
With 6 damage points
With 12 damage points
0 20 40 60 80 100
0
1x10⁴
2x10⁴
3x10⁴
4x10⁴
5x10⁴
6x10⁴
Ch
arge
tran
sfer
res
ista
nce
(
.cm
2 )
Immersion time (days)
Without damage points
With 6 damage points
With 12 damage points
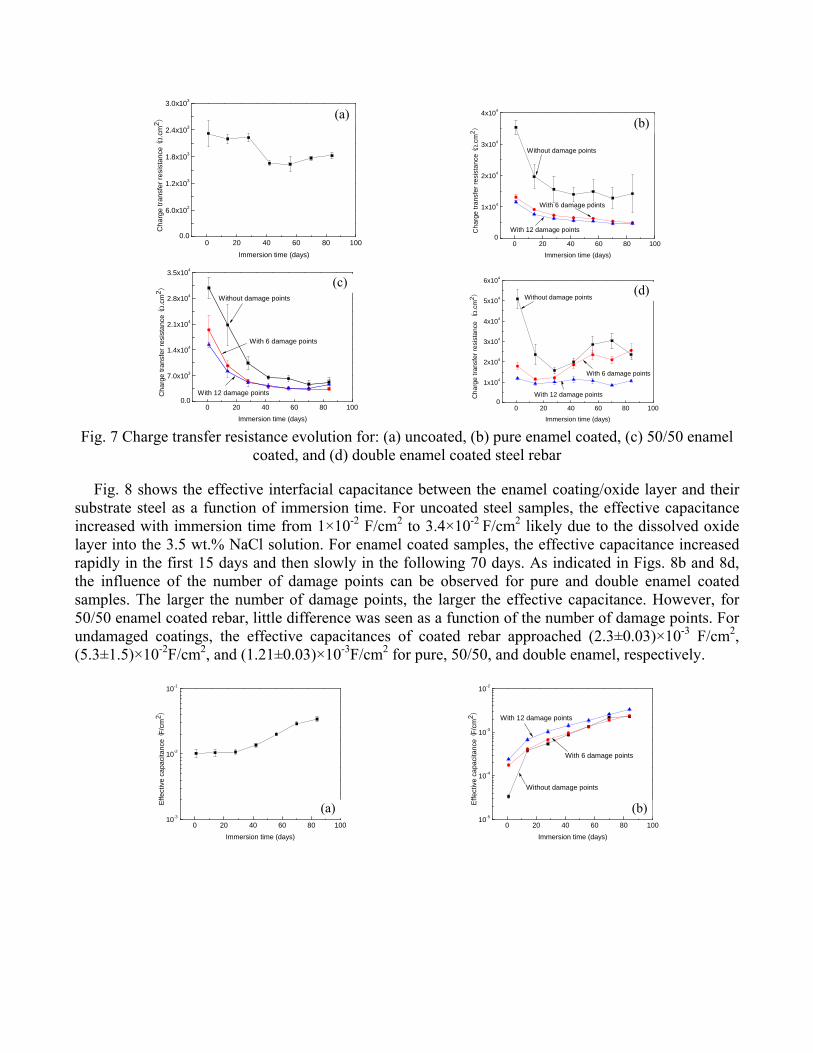
Fig. 7 Charge transfer resistance evolution for: (a) uncoated, (b) pure enamel coated, (c) 50/50 enamel
coated, and (d) double enamel coated steel rebar
Fig. 8 shows the effective interfacial capacitance between the enamel coating/oxide layer and their substrate steel as a function of immersion time. For uncoated steel samples, the effective capacitance increased with immersion time from 1×10⁻² F/cm2 to 3.4×10⁻² F/cm2 likely due to the dissolved oxide layer into the 3.5 wt.% NaCl solution. For enamel coated samples, the effective capacitance increased rapidly in the first 15 days and then slowly in the following 70 days. As indicated in Figs. 8b and 8d, the influence of the number of damage points can be observed for pure and double enamel coated samples. The larger the number of damage points, the larger the effective capacitance. However, for 50/50 enamel coated rebar, little difference was seen as a function of the number of damage points. For undamaged coatings, the effective capacitances of coated rebar approached (2.3±0.03)×10-3 F/cm2, (5.3±1.5)×10-2F/cm2, and (1.21±0.03)×10-3F/cm2 for pure, 50/50, and double enamel, respectively.
0 20 40 60 80 10010-3
10-2
10-1
Effe
ctiv
e ca
paci
tanc
e (F
/cm
2 )
Immersion time (days)
0 20 40 60 80 100
10-5
10-4
10-3
10-2
Effe
ctiv
e ca
paci
tanc
e (F
/cm
2 )
Immersion time (days)
Without damage points
With 6 damage points
With 12 damage points
(b) (a)
(c)(d)
(b) (a)
0 20 40 60 80 10010-4
10-3
10-2
10-1
Effe
ctiv
e ca
paci
tanc
e (F
/cm
2 )
Immersion time (days)
Without damage points
With 6 damage points
With 12 damage points
0 20 40 60 80 100
10-4
10-3
10-2
Effe
ctiv
e c
ap
aci
tan
ce (
F/c
m2 )
Immersion time (days)
Without damage points
With 6 damage points
With 12 damage points
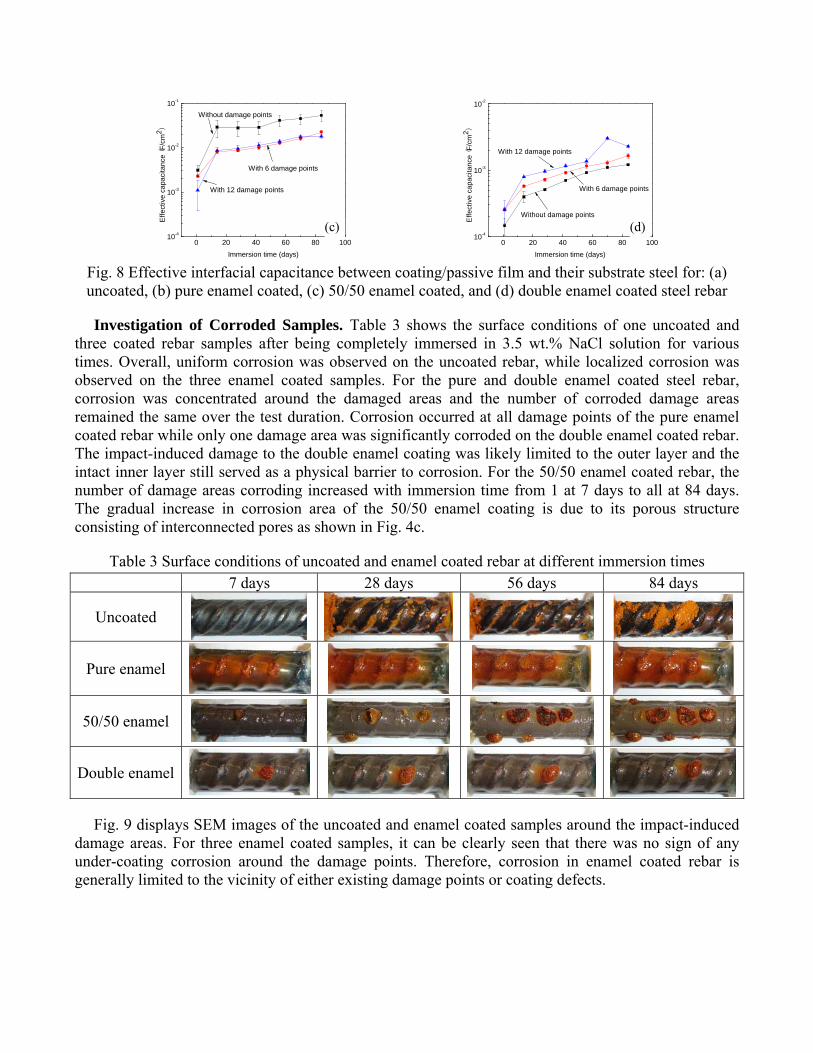
Fig. 8 Effective interfacial capacitance between coating/passive film and their substrate steel for: (a) uncoated, (b) pure enamel coated, (c) 50/50 enamel coated, and (d) double enamel coated steel rebar
Investigation of Corroded Samples. Table 3 shows the surface conditions of one uncoated and three coated rebar samples after being completely immersed in 3.5 wt.% NaCl solution for various times. Overall, uniform corrosion was observed on the uncoated rebar, while localized corrosion was observed on the three enamel coated samples. For the pure and double enamel coated steel rebar, corrosion was concentrated around the damaged areas and the number of corroded damage areas remained the same over the test duration. Corrosion occurred at all damage points of the pure enamel coated rebar while only one damage area was significantly corroded on the double enamel coated rebar. The impact-induced damage to the double enamel coating was likely limited to the outer layer and the intact inner layer still served as a physical barrier to corrosion. For the 50/50 enamel coated rebar, the number of damage areas corroding increased with immersion time from 1 at 7 days to all at 84 days. The gradual increase in corrosion area of the 50/50 enamel coating is due to its porous structure consisting of interconnected pores as shown in Fig. 4c.
Table 3 Surface conditions of uncoated and enamel coated rebar at different immersion times 7 days 28 days 56 days 84 days
Uncoated
Pure enamel
50/50 enamel
Double enamel
Fig. 9 displays SEM images of the uncoated and enamel coated samples around the impact-induced damage areas. For three enamel coated samples, it can be clearly seen that there was no sign of any under-coating corrosion around the damage points. Therefore, corrosion in enamel coated rebar is generally limited to the vicinity of either existing damage points or coating defects.
(d) (c)
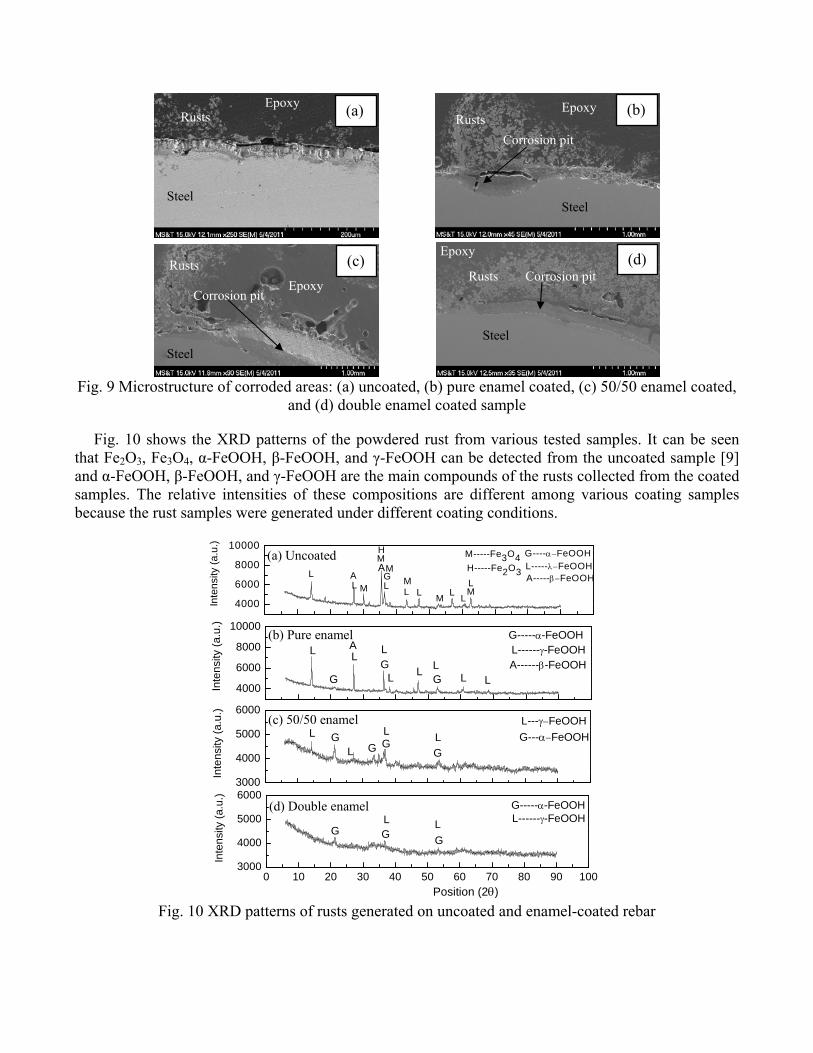
Fig. 9 Microstructure of corroded areas: (a) uncoated, (b) pure enamel coated, (c) 50/50 enamel coated,
and (d) double enamel coated sample
Fig. 10 shows the XRD patterns of the powdered rust from various tested samples. It can be seen that Fe2O3, Fe3O4, α-FeOOH, β-FeOOH, and γ-FeOOH can be detected from the uncoated sample [9] and α-FeOOH, β-FeOOH, and γ-FeOOH are the main compounds of the rusts collected from the coated samples. The relative intensities of these compositions are different among various coating samples because the rust samples were generated under different coating conditions.
0 10 20 30 40 0 60 0 80 90 100
4000
6000
8000
10000
H-----Fe2O3
M-----Fe3O4
A-----FeOOHL-----FeOOH
Inte
nsi
ty (
a.u
.)
G----FeOOH
LM
LL
LM
AMH
LA
L
MGL
MML
4000
6000
8000
10000
A-------FeOOHL-------FeOOH
Inte
nsi
ty (
a.u
.)
G------FeOOH
L
G
LGL
LL
GL
L L
A
3000
4000
5000
6000
G---FeOOH
Inte
nsi
ty (
a.u.
)
L GLGG
L
GL
L---FeOOH
0 10 20 30 40 50 60 70 80 90 1003000
4000
5000
6000
Inte
nsi
ty (
a.u
.)
GLG
L
G
L-------FeOOHG------FeOOH
Position (2)
Fig. 10 XRD patterns of rusts generated on uncoated and enamel-coated rebar
Epoxy Rusts
Epoxy
Epoxy
Epoxy
Rusts
Rusts Rusts
Steel Steel
Corrosion pit
Corrosion pit
Corrosion pit
(a) (b)
(c) (d)
(a) Uncoated
(b) Pure enamel
(d) Double enamel
(c) 50/50 enamel
Steel Steel
Conclusions
Based on the extensive experimentation and analyses, the following conclusions can be drawn: 1. Enamel coatings increase corrosion resistance of steel rebar. Both the pure and double enamel
coatings outperform the 50/50 enamel coating due to the interconnected pores present in the 50/50 enamel coating as a result of the calcium silicate addition.
2. Prior damage has significant negative influence on the corrosion resistance of pure and double enamel coatings compared to the 50/50 enamel coating, primarily due to the superior performance of the undamaged pure and double enamel coatings. Corrosion of enamel coated rebar is limited to damaged coating areas due to the strong mechanical and chemical adhesion between the enamel coating and its substrate steel.
3. Fe2O3, Fe3O4, α-FeOOH, β-FeOOH, and γ-FeOOH are the main compounds of the rust samples from uncoated steel rebar compared to α-FeOOH, β-FeOOH, and γ-FeOOH from the coated samples.
Acknowledgements
Financial support to complete this study was provided in part by the U.S. National Science Foundation (CMMI-0900159), by Roesch Inc. under Project No. 00017522, and by the Center for Transportation Infrastructure and Safety at Missouri University of Science and Technology (No. 00018130). The opinions and findings presented in this paper are those of the authors and do not necessarily represent those of the sponsors.
References
[1] G.H. Koch, M.P.H. Brongers, N.G. Thompson, Y.P. Virmani and J.H. Payer. Corrosion costs and preventive strategies in the United States. Report No. FHWA-RD-01-156, NACE International, 2002.
[2] D.G. Manning. Corrosion performance of epoxy-coated reinforcing steel: North American experience. Construction and Building Materials, Vol. 10, No. 5 (1996), p. 349.
[3] A.B. Darwin and J.D. Scantlebury. Retarding of corrosion processes on reinforcement bar in concrete with an FBE coating, Cement and Concrete Composites, Vol.24 (2002), p73.
[4] E. Sistonen, A. Cwirzen, and J. Puttonen, Corrosion mechanism of hot-dip galvanized reinforcement bar in cracked concrete. Corrosion Science, Vol.50 (2008), p3416.
[5] D. A. Jones, Principles and prevention of corrosion, 2nd Edition, 1996, Prentice-Hall, Inc.
[6] V.F. Hock, S.W. Morefield, D.C. Day, C.A. Weiss, Jr. and P.G. Malone, The use of vitreous enamel coatings to improve bonding and reduce corrosion in concrete reinforcing steel. NACE. Paper No. 08220, Corrosion 2008.
[7] NRC. International Critical Tables, National Research Council, Washington, D.C., McGraw-Hill, 1927, p.116.
[8] G.J. Brug, A.L.G. Van Den Eeden, M. Sluyters-Rehbach and J.H. Sluyters, The analysis of electrode impedances complicated by the presence of a constant phase element. Journal of Electroanalytical Chemistry and Interfacial Electrochemistry, Vol.176 (1984), p275.

[9] E. Zitrou, J. Nikolaou, P.E. Tsakiridis, and G.D. Papadimitrious. Atmospheric corrosion of steel reinforcing bars produced by various manufacturing processes, Construction and Building Materials Vol.21 (2007), p1161.