mechanical engineering team sam wilson - president andrew ...mechanical design major mechanical...
TRANSCRIPT

1
Kansas State University
Wind Turbine Technical Report
Administration
Sam Wilson - President
Andrew Rieschick - Vice President
Marlaina Markwart - Treasurer
Aswini Patro - Secretary
Carson Scott
Mechanical Engineering Team
Carson Scott - Mechanical Lead
Sam Wilson
Patrick McClanahan
Mitchell Porter
Eric Christman
Peter Mascal
Clay Thomas
Mitchell Porter
Adam Reelfs
Siting Team
Tyler Rodvel - Siting Lead
Jake Meyer
Justice Catron
Joey Pentola
Electrical Engineering Team
Andrew Rieschick - Electrical Lead
Hayden Dillavou
Patrick Flet
Andrew Dulac
Jevin Peitzmeier
Will Brownlee
Faculty Advisors:
Dr.Warren White [email protected]
Dr. Wu [email protected]
Dr. Shadmand [email protected]

2
3
4
4
4
5
6
6
7
7
9
11
12
14
16
17
19
20
21
Table of Contents:
Executive Summary…………………………………………………………….…………….…...
Electrical Analysis……………………………………………………………….….…………...
Cut in Wind Speed Task..……………………………………………………………..…
Power Curve Performance Task……………………………………………...………….
Safety Task.……………………………………………………………………….….….
Control of Rated Power and Speed Task……..………………………………….………
Durability…………………………………..………………………………………….…
Mechanical Design………………………………..………………………………………….….
Testing……………………………...……..………………………………………….….
Disc Brake…………………………………..………………………………………...….
Yaw Control-Tail……………………………………..…………...………………….….
Blades…………………………………………………….……….………………….…..
Nacelle…………………………………………………..…..…...………………………
Hub……………………………………………………………………………………….
Baseplate, Tower, and Bearing Holder……………………………………………….…..
Appendix A. Circuit Diagram…………………………………………...……………………….
Appendix B. Mechanical Drawing……………………………………...………………………..
References…………………………………………………….…...……………………………..

3
Executive Summary
Wildcat Wind Power is an extracurricular design team competing in the Collegiate Wind
Competition (CWC). Our objective is to design and construct a scaled wind turbine as well as
provide a siting and project development for a local wind farm. We are organized into three teams
to face the challenges set by CWC; Electrical, Mechanical, and Siting team.
The Electrical and Mechanical teams collaborate closely to effectively produce a scaled wind
turbine to meet the tasks set my CWC. The tasks include: Cut-In Wind Speed, Power Curve
Performance, Control of Rated Power and Rotor Speed, Safety, and Durability. These are the same
tasks as the year prior. Our previous turbine excelled during the Cut-in Wind Speed and Power
Curve tasks. However, the inability to properly measure, control, and brake led to the turbine
coming up short in the Control, Safety, and Durability sections.
Wildcat Wind Power’s primary focus has been to improve upon the weaknesses of the previous
year’s designs without compromising the strengths that made it successful. To achieve this, the
mechanical team has on focused implementing a new mechanical braking system, a nacelle design
to house the additional components, and applying incremental optimizations the tail and blade
design of the previous year. The electrical team has focused on tracking rotor speed and using that
information to control the rotor speed and power output of the turbine through the intervention of
the mechanical brake.
To measure the RPM of the rotor with our microcontroller, a photo-interrupter sensor and a custom
printed code disc have been installed into the new nacelle. The information gained is used to
control the position and torque required by the mechanical braking system. The mechanical
braking system consists of a high torque servo motor, break arm, and brake disk. When breaking
is desired, the servo motor rotates the brake arm to make contact with the brake disc. The addition
of these 5 new components, and their associated wiring and mountings, has required a brand-new
nacelle design which has been optimized to maximize space efficiency and simplify the assembly
process.
In order to excel in control, safety, and braking tasks, our team has also worked on improving
testing equipment and procedures used to simulate those tasks. Capability has been added to our
Dynamometer stand and control and more data acquisition has been added to the wind tunnel. Our
turbine design is the result of two strongly cooperative design teams, a limited yet specific goal,
and a refined testing procedure to close the design loop and allow for continuous iteration.

4
Electrical Analysis
The electrical system is composed of several fundamental elements including the generator, three-
phase rectifier, DC/DC converters, and load. Controlling the circuit is an Arduino microcontroller.
Three-phase power is supplied when the generator captures mechanical energy and rectified to DC
power. The DC power is then supplied to the load. The microcontroller will measure the power
supplied to the load and control the function of the circuit. The microcontroller is able to implement
the braking system and load detection.
Our team decided on the LD Power MT4114-320KV generator as it works efficiently for the
application. The KV value is the relationship between the number of stator windings and gauge of
the wires in the stator. The ability to produce higher voltages at low RPM is ideal for wind
turbines; as wind turbines have large and heavy blades.
The main focus for our team was to solve the issues of previous competition failures. As our turbine
was unable to complete the safety, control of rotor speed power output, and durability tasks. Our
first challenge was to track RPM, which was achieved with a opto-interrupter sensor. The next
task was to then brake and control the speed of the rotor. Our team researched two approaches:
using back EMF and using a servo actuated brake to add more friction resistance to the rotor. Back
EMF proved to be undesirable as it did not achieve our objectives. However, the servo provided
the needed stopping power to meet our objectives. The servo is powered at five volts and current
is pulsed to control the torque applied.
Using these tools, we can face challenges faced by actual turbines, including a steady power curve,
control of rotor speed and power output, cut-in wind speed, enduring and persistent functionality,
as well as safe shutdown systems. This section of the report will disclose the solution implemented
to combat the challenges listed above.
Cut-In Wind Speed Task
Typically, turbines do not produce efficient power at low wind speeds. We can find the power
generated by a turbine using the relation P=1/2 ρ×A×v^3 where ρ is the air density, A is the swept
area of the blades, and v is the wind speed. Operating at the lowest possible wind speed will allow
us to get the most power output of our turbine for the range of possible wind speeds. Using a
generator with a lower KV value allows us to lower our cut-in speed.
Power Curve Performance Task
The average wind speed across the continental United States is between 5 m/s and 8 m/s. Real
turbines need to produce optimal power in this range of wind speeds, which is a parameter provided
by the Collegiate Wind Competition. Table 1 outlines the scoring for power curve task. Figure 1
shows the power curve for our wind turbine

5
We designed our turbine and circuit to accommodate these parameters. Real turbines will also see
a variety of wind speeds including storm winds and gusts from time to time but is not common
practice to design a power generating turbine for these conditions.
Desired Power Curve Turbine Output Power as a Function of Wind Speed
Table 1 Figure 1
Safety Task
Safe construction and operation is the primary objective when designing any turbine. When the
wind reaches speeds beyond the capabilities of the turbine, we need to be able to shut down the
turbine. We are tackling this problem with a servo brake. The brake is programed for an off state
and an on state. Using a MOSFET we are able to regulate the power supplied to the brake through
pulse width modulation (PWM), in order to increase or decrease its torque. The brake will stay on
as long as there is power supplied, keeping the turbine from reaching critical speeds from excessive
winds or loss of loads. We signal the brake with a current sensor in series with a load and a manual
switch. If the current sensor reads zero Amperes or the switch is set to on, then safety protocol is
initiated. When the circumstances that initiated safety protocol become untrue, the turbine begins
operation again. Significant time was spent researching a back EMF brake, and, while it performed
well at wind speeds under 9 m/s, performance significantly declined at higher wind speeds.
Wind Speed
(m/s)
Power Increase
Factor
5 1.3
6 1.5
7 1.5
8 1.3
9 .9
10 .5
11 .3

6
Control of Rated Power and Rotor Speed Task
Sudden spikes in wind or power can be perilous for a wind turbine and power grid. The turbine is designed to operate in a certain wind range so being able to control the power output of a turbine when outside the rated wind range is an important task. We have two ways to govern the speed of our turbine: servo brake and pitch of the blades. When wind speeds exceed the desired range these two systems activate to slow the turbine. To control power output and rotor speed, our team first found measurements for both current to the load and the RPM to find stable power and speed. Using the range for stable power output and rotor speed, the microcontroller communicates with a MOSFET to supply power to the servo. Duty cycle for the MOSFET is increased allowing more power to the servo. Once power output and rotor speed is brought to the optimal range the power to the servo is reduced.
Durability
Wind turbines will experience a wide variety of weather conditions throughout their lifetimes.
Being able to provide reliable and sufficient power are vital to any generation scheme. When the
wind is not able to provide the power needed, other sources such as solar, hydroelectric, nuclear,
fossil fuel, and stored energy are implemented. The 58 Farad capacitor stores power to be used
when power levels fall during wind energy production.
This test requires two states: charging and scoring. During the first minute of the task, we need to
charge the capacitor as quickly as possible. Using a low resistance will result in a small time
constant. The capacitor will act as a power bank for the second part of the test.
The second part of the test is a scoring period, our turbine will see a relative vast range of wind
speed, along with a variable resistance load. Using the turbine and capacitor in tandem, we can
supply a constant five volts. Our DC/DC converter will ensure a reliable five volts across the
variable load, and we plan to regulate current by regulating the RPM speed of the turbine. We use
a photo-interrupt sensor in the nacelle to read the RPM of the turbine, and the Arduino
microcontroller utilizes this data to adjust the duty cycle of the power leading to the servo. This
changing duty cycle will help us adjust the torque on the break and keep the RPM constant and
keep relatively constant power across the load. Our current sensor, reading current through the
load, combined with the photo-interrupt, will allow us to accurately adjust the brake torque to keep
constant power during this task when the wind exceeds rated speed.

7
Mechanical Design
Major mechanical components for this year’s wind turbine design include a mechanical braking
system, twin plate tail, twisted blades, and an original nacelle design. The mechanical brake is a
disc partnered with a brake pad designed to maximize the surface area of the surfaces the braking
force is applied to. The twin wing tail is designed to maximize yaw rates and add the necessary
damping to reduce swinging. This design has seen only minor modifications from the previous
year. In addition to this, the twisted blades were designed to optimize both cut-in speed as well as
power produced by the turbine between 5 and 11 m/s. Lastly, the nacelle was completely
redesigned in order to incorporate the mechanical braking system, rpm sensor, and other electrical
components of the wind turbine. Figure 2 shows a completed image of the turbine. Figure 3 shows
an exploded view of the turbine.’
Turbine assembly Exploded view of turbine assembly
Figure 2 Figure 3
Testing
Testing was a key component of the Wildcat Wind Power team’s design process this year. The
team makes countless updates and modifications through feedback gained from our two primary
testing equipment: the dynamometer and the wind tunnel.
The dynamometer is used to simulate wind speeds condition, it achieves speeds up to 2400 RPM
and torque as high as 2 N-m. By mounting a prototype nacelle with generator and drive-shaft to a
testing plate, qualitative data could be gathered with quick set-up and few unknowns. Comparing
qualitative observations in the wind tunnel to the quantitative values provided by the

8
dynamometer, context between the two measurements could be achieved. For example, the effect
of breaking torque can be viewed in the wind tunnel and measured on the dynamometer.
The wind tunnel was built by the team in 2016 and was our second major resource for testing our
prototypes and optimizing our final design. The tunnel produces wind speeds up to 16 m/s and can
simulate changing wind directions through a bearing that the tower is bolted to at the bottom of
the tunnel. A LabVIEW VI was developed to continuously control the operation of the tunnel and
log data throughout the duration of the test. The data logged includes: tunnel wind speed, turbine
RPM, load resistance, and power output. The VI allows the team to streamline the testing process
and maximize the information received from testing runs. Additionally, the VI allows for data
recording at a sampling rate of 100 Hz, allowing us to detect and remove noise in our power output
readings.
The program receives a desired wind speed input from the user, runs it through a wind speed linear
calibration, and sends the appropriate voltage signal to the wind tunnel’s fan speed drive.
Additionally, the program receives signals from the load and photo-interrupt and interprets those
signals to calculate Power and RPM. During testing, live graphs of Wind Speed, RPM, and Power
are seen on the block diagram. The programs reads 10,000 samples a second and populates an
excel spreadsheet with averaged data once a second. Figure 4 Shows the LabVIEW Block Diagram
and Front panel.
LabVIEW Program for Logging Wind Tunnel Test Data
Figure 4
Another critical component of our design process is our 3D printers. Through partnerships with
other organizations, Wildcat Wind Power was able to acquire and set up two 3D printers this year
to assist our partner organizations in their outreach and improve our prototyping capabilities. The
printer models we use are the Creality CR-10 and the Prusa i3 mk3. The printers allow us to go
from 3D model to physical part quickly and easily. A significant portion of our turbine’s design is
3D printed, particularly the pieces that have seen many design iterations.

9
Disc Brake
For industrial wind turbines, one of the most important features is the safety mechanism,
something that is also of large importance for this competition. One of our main design goals for
this year was to design a mechanical braking system that will be used for the safety test and
controlling the RPM of our wind turbine. Our design is based off a basic disc brake, similar to
those used on cars and large, commercial wind turbines, to bring the blades to a stop. Our version
of this idea consists of a servo motor attached to an arm with a brake pad and a disc attached to
the main drive shaft. The design is further optimized by using a double-sided servo horn, and
making the brake pad the same size as the brake disc. The servo horn attaches the braking arm to
the servo, and by using a double sided one, we are able to maximize the torque applied on the arm
by the servo.
We chose to make the brake parts out of polycarbonate because it is stronger and more heat
resistant than the PLA that our other parts are made of. These characteristics are especially
important for this setup because the friction created between the brake pad and disc will generate
heat, and the parts must withstand the high torque applied by the servo. In addition to this, a thin
sheet of rubber was fixed to the brake pad to increase the friction and, as a result, the overall
effectiveness of the braking system.
After multiple design iterations, and testing, this design was chosen because it maximizes the
surface area that is applying pressure to the brake disc and maximizes torque applied by the servo.
We determined that by mounting the servo directly underneath the shaft, making the brake arm
vertical, was the optimal design for this system. This makes the force applied by the brake pad
perfectly horizontal at the top, which is what we want. The arm was designed to translate torque
from the top side of the servo horn directly, from the bottom through triangular members. Figures
5 and 6 illustrate the brake mechanism.
Brake arm/pad component Brake arm mounted to servo
Figure 5 Figure 6

10
To save space in the nacelle, the brake disc was designed to fit onto the shaft coupler that connects
our main shaft to the smaller shaft of the generator. It was designed to be a press-fit and utilize the
same set screw as the shaft coupler to hold it in place and prevent rotation when the brake is
applied. It also features a chamfer on the back side to add support and ensure it won’t break under
the high torque applied by the servo. Figures 7 and 8 show the shaft coupler and brake assembly,
respectively.
Brake disc mounted to shaft coupler Disc brake assembly
Figure 7 Figure 8
After several iterations on the dynamometer, we found the best servo that could produce enough
torque to braking to stop the turbine without taking too much power from the load. The servo we
decided on is a Savox low-profile, high-torque servo. It puts out 8kg-in of torque at 4.8V, which
is sufficient for our application. We needed a low-profile servo, so it would not to take up too
much room inside the nacelle. It fits nicely inside the nacelle among the other additional
assemblies added in the space. If the servo was any wider, the entire nacelle would have to be that
much wider, taking from our swept area. Figure 9 shows the servo used.
Servo used for mechanical brake
Figure 9

11
Yaw Control – Tail
Our goal for the yaw system is for the turbine to turn to face into wind at 180 degrees/second and
stay facing into the wind, with minimal or no oscillation. A successful tail design will keep the
turbine facing the direction of the wind, with turbulent wind speeds up to 20m/s.
Two different designs were considered for this year’s yaw control system. The first is a cylindrical
tail design motivated by the turbine shroud concept. The cylinder is supported by 3 supports
extruded radially from the detachable tail core, which slides into an insert in the back side of the
nacelle. The supports are located 120 degrees apart and have an airfoil shaped cross-section to
support the cylinder and reduce the effect of the wind shadow. Figures 10 and 11 show the
cylindrical tail and testing assembly.
Cylindrical tail concept Shroud tail mounted to nacelle for testing
Figure 10 Figure 11
The second tail design is a twin wing tail. Two acrylic sheets with and angle of 14 degrees are
mounted to a detachable tail core. Both tail cores are interchangeable and are mounted into a slot
at the back of the nacelle. The twin wing tail experiences yaw at the same rate as a flat tail but
shows less oscillation due to the damping produced by the wedge shape (Ebert & Wood,
1995). Figures 12 and 13 illustrate the twin tail.

12
Twin-wing tail adapter. Tail mounted to nacelle.
Figure 12 Figure 13
We brought the two different tail designs to the wind tunnel for empirical testing. Both tails
stabilized the turbine throughout the test, although the damping of the twin wing tail allowed it to
settle to equilibrium quicker than the cylindrical design. We believe this damping will be an
important factor in yaw control, especially in the 16m/s to 20m/s range we expect see at
competition but cannot test in our wind tunnel.
The controls and power wires that feed out of the nacelle through the tower are given enough slack
to allow for 2 full rotations in either direction. All wires in the nacelle are secured to a single screw
terminal board win tin the nacelle, to allow ease of access and to secure continuity as the tower
rotates during the yaw tests.
Blades
Blade analysis has been a large focus for the Wildcat Wind Power Team in previous years of
competition. The blades design we used for this year’s turbine are based on the previous year’s
design, with little modification. This design was developed using an in-house python program to
compare thousands of airfoils and find the ones with the highest lift and lowest drag for each
section of the blade. As a result of this process, the airfoils in our blade are comprised of the thin,
high lift, low drag airfoils: BE50sm and SA7024. Using Q-Blade, further optimization was
introduced by adding a twist of approximately 30 degrees.
The blades have a theoretical power coefficient of 0.52 according to QBlade. After losses, we are
going to assume the coefficient of power will be closer to 0.42. Figure 14 shows FEA analysis
performed in QBlade on our twisted blades based on a tip speed ratio of 4. According to these
calculations, the maximum stress that the blade will see is roughly 11 MPa. The breaking point
would be located near the root of the blade, with a factor of safety of roughly 3.4, given that the
ultimate tensile strength of PLA plastic is 37 MPa.

13
QBlade FEA analysis on twisted blades.
Figure 14
This year, further optimization has been added to the manufacturing of the blades. The slicer
settings for the 3D printer were optimized to allow for more accurate printing of thin features along
the edge of the blade. Additionally, blades with different print materials and blade orientation were
compared in order to maximize durability and print quality. The different materials tested are PLA
and Polycarbonate (PC). Although the PC has more strength, the PLA blades were chosen because
the print quality of the PC blades suffered.
To experimentally determine which RPM was optimal for our turbine, we ran the turbine through
3 different wind speeds each at 10 different resistances. All the tunnel data was measured and
logged using our new LabVIEW control system. Although the Q-blade analysis suggest a tip speed
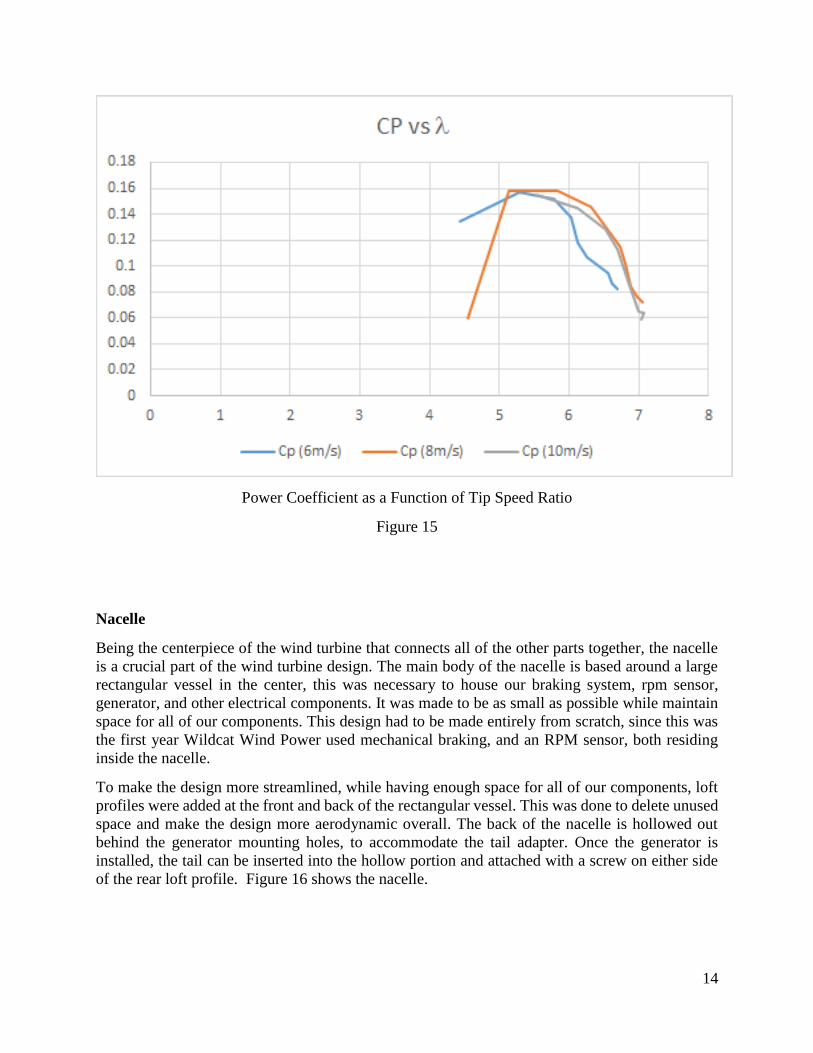
ratio of 4, our results shown in Figure 15 supports a tip speed ratio closer to 5. We are not satisfied
with a maximum power coefficient of 0.16, which is well below our 0.42 prediction. We suspect
additional losses within our new nacelle design. With the time we have before competition, the
mechanical team will work to reduce these losses and maximize the power coefficient.
14
Power Coefficient as a Function of Tip Speed Ratio
Figure 15
Nacelle
Being the centerpiece of the wind turbine that connects all of the other parts together, the nacelle
is a crucial part of the wind turbine design. The main body of the nacelle is based around a large
rectangular vessel in the center, this was necessary to house our braking system, rpm sensor,
generator, and other electrical components. It was made to be as small as possible while maintain
space for all of our components. This design had to be made entirely from scratch, since this was
the first year Wildcat Wind Power used mechanical braking, and an RPM sensor, both residing
inside the nacelle.
To make the design more streamlined, while having enough space for all of our components, loft
profiles were added at the front and back of the rectangular vessel. This was done to delete unused
space and make the design more aerodynamic overall. The back of the nacelle is hollowed out
behind the generator mounting holes, to accommodate the tail adapter. Once the generator is
installed, the tail can be inserted into the hollow portion and attached with a screw on either side
of the rear loft profile. Figure 16 shows the nacelle.

15
Loft Profile at the Rear of the Nacelle.
Figure 16
The front of the nacelle also features a loft profile, and a cutout for the hub to maintain smooth
lines all around the nacelle and make it more streamlined. In addition to this, there is a cutout to
house a single bearing held in place by an interference fit. The shaft is passed through the bearing
and attached to the generator using a shaft coupler. The machined shaft also features M10 threads
in the section that extend out of the front of the nacelle for easy installation of the hub/blades
assembly, and the nose cone. Figure 17 shows the front of the nacelle.
Loft profile at front of nacelle and bearing hole.
Figure 17
With additional equipment being housed within the nacelle, the layout had to be optimized to
minimize the time it takes to assemble or modify or troubleshoot within the nacelle. The wiring
for the RPM sensor, and breaking servo are routed through a screw terminal board located in an
accessible location. From these terminals, removable wires are threaded through the tower and to
the circuit. The configuration maximizes the electrical or mechanical team’s ability to quickly
make changes within the nacelle without compromising the other assemblies. Figure 18 shows
the bottom of the nacelle.

16
Mounting points for RPM sensor, braking servo, and extra circuit.
Figure 18
Hub
While simultaneously researching and prototyping passive and active pitch systems for our turbine,
we primarily used a fixed pitch system in our turbine for testing. This allowed us to easily switch
the blades out and constantly try new designs and pitch angle to find the best performance for our
turbine. Using the fixed pitch system with our twisted blades, we observed low cut-in speeds, and
sufficient power production, giving a confidence that the fixed pitch hub would suffice.
The hub is made up of two halves; the screw side and the nut side. The screw side has a cut-out
for the head of the screw to be recessed and the nut side has cut-outs the same size as the nuts to
hold them in place and keep them recessed. Both side have holes that go all the way through for
the screw shank. These screws serve two purposes; to hold the two halves of the hub together, and
to keep the blades at the same pitch. The screws pass through holes in the root of the blades to
ensure the pitch of them does not change. In addition to this, the blade roots have flanged ends that
fit into slots in the hub, this takes some of the stress off the holes the screw passes through. Figure
19 shows the fixed pitch hub.
Nut side of the fixed pitch hub Screw side of the fixed pitch hub.
Figure 19
17
The team experimented with using five blades instead of three with fixed and passive pitch as well.
In the end, the five blade concepts only performed slightly better, and not enough to justify the
extra manufacturing time and materials. The team decided to use three blades, because of the
simplicity and ease of testing multiple blade profiles, and pitch angles.
A nut that fits into one side of the hub is ultimately what translates rotation of the hub to rotation
of the shaft. The nose-cone is then screwed on from the outside, also using a nut with an
interference fit. During testing, the team noticed on several occasions that this nut could come
loose from the hub and result in a loss of produced power. To solve this problem, the team replaced
the basic nut in the nose cone with a nylon locking nut of the same size. This provided a very tight
fit around the threads and prevented any of the rotational parts from coming loose.
Baseplate, Tower and Bearing Holder
The base plate and tower designs were very tightly constrained by CWC rules, leading to few
design decisions to be made by our team. The base plate, tower, and bearing holder are all made
out of aluminum to reduce weight. To attach the nacelle to the tower, a rectangular piece of
aluminum was machined to be the exact same size as the base of the nacelle. A bearing was pressed
into the aluminum piece, to provide easy installation to the rest of the tower and allow seamless
yaw of the turbine. The bearing inner diameter is the same size as our tower allowing the bearing
to easily slide around the top of the tower. To attach the nacelle to the bearing holder, both the
nacelle and bearing holder have two bolt holes in the same location, so they can be simply bolted
together. It also features a cutout for a large bearing that will provide seamless yaw ability of our
turbine. The bearing inner diameter is the same size as our tower allowing the bearing to easily
slide around the top of the tower.
Our team used finite element analysis to determine that the tower and base structure would be
strong enough to withstand the maximum 20 m/s wind speed. The force on an area based on wind
speed was calculated from:
F = ½ * ⍴ * As * 2
where F is the force on the nacelle, ⍴ is the density of air, As is the swept area of the blades, and
is the wind speed. This equation was used to determine the force applied to the tower by the area
being swept by the blades, and the frontal area of the tower itself. This force applied to the entire
up-wind side of the tower is be:
F = ½ * 1.225 kg/m3* /4*(0.02m)2*(20m/s)2
or
F = 4.9 N.

18
Additionally, for the area being swept by the blades, applied to the top face of the tower, where
the nacelle would be attached is
F = ½ * 1.225 kg/m3* /4*(0.220m)2*(20m/s)2
or
F = 9.32 N.
As a result of these forces combined, the maximum stress was located at the bottom of the tower,
where it connects to the base. This maximum stress is still not large enough to break our material
or connection. It also yields a factor of safety of 31.5, which is more than enough. Figures 20
and 21 show the tower and the finite element analysis, respectively
Tower and bearing holder assembly. Tower FEA analysis
Figure 20 Figure 21

19
Appendix A. Circuit Diagram

20
Appendix B: Mechanical Drawing

21
References:
Servo Picture: https://www.savoxusa.com/collections/low-profile/products/savsb2263mg-be-
black-edition-low-profile
Ebert, P.R., Wood, D.H. (1995). On the dynamics of tail fins and wind vanes. Journal of Wind
Engineering and Industrial Aerodynamics, 56(2-3), 137-158.