mechanical properties and dislocation structure evolution
TRANSCRIPT

Mechanical Properties and Dislocation Structure Evolutionin Ti6Al7Nb Alloy Processed by High Pressure Torsion
MILOS JANECEK, JOSEF STRASKY, JAKUB CIZEK, PETR HARCUBA,KRISTINA VACLAVOVA, VERONIKA V. POLYAKOVA, and IRINA P. SEMENOVA
Ultrafine-grained biocompatible Ti-6Al-7Nb alloy was produced by high pressure torsion(HPT). Lattice defects—vacancies and dislocations—investigated by positron annihilationspectroscopy, observations by scanning electron microscopy, and microhardness evaluation arelinked to the strain imposed by different numbers of HPT revolutions and to the distance fromthe specimen center. Positron annihilation spectroscopy showed significant increase of dislo-cation density and concentration of vacancy clusters after ½ of the HPT revolution. Microh-ardness increases by 20 pct with increasing strain, but it is heterogenous due to duplexmicrostructure. The heterogeneity of the microhardness increases with increasing strain, sug-gesting that a heavily deformed and fragmented a+ b lamellar microstructure is more hardenedthan primary alpha grains. The defect structure is homogenous after ½ HPT revolution, whilethe microhardness becomes homogenous after 3 HPT revolutions only.
DOI: 10.1007/s11661-013-1763-2� The Minerals, Metals & Materials Society and ASM International 2013
I. INTRODUCTION
FOR several decades, titanium alloys have beenthe most used material for load-bearing orthopedicimplants.[1] Their unique combination of propertiesincludes extreme corrosion resistance, relatively highstrength, sufficient biocompatibility, and moderate elas-tic modulus.[2] Commercially pure titanium is used insome dental and orthopedic applications mainly due toits excellent biocompatibility. However, limited strength(up to 500 MPa) disallows using commercially puretitanium as a material for orthopedic endoprostheses,which constitute a majority of the market of metallicimplants. The most commonly used one is still one of theoldest Ti alloys—Ti-6Al-4V—that belongs to thealpha+beta alloys. Despite the generally good proper-ties of this alloy, there are several limitations. A specialconcern relates to the presence of vanadium which isconsidered to be a toxic element. A similar alpha+betaTi alloy Ti-6Al-7Nb has been developed to avoid theadverse effect of vanadium.[3,4] Ti-6Al-7Nb alloy hassimilar mechanical properties and undergoes a similarphase transformation as the common Ti-6Al-4V alloy.
The mechanical and other essential properties deter-mining the application of titanium alloys may beimproved by refining the grain size to the submicrometer
or even nanometer level. A variety of special techniquesare used for the production of bulk ultrafine-grained(UFG) materials, e.g., equal channel angular pressing(ECAP),[5] high pressure torsion (HPT),[6,7] accumula-tive roll bonding (ARB),[8] twist extrusion,[9] or multi-directional forging.[10] Among these techniques, whichintroduce severe plastic deformation (SPD) in thematerial, HPT provides an opportunity for achievingexceptional grain refinement often to the nanometerlevel in many FCC and HCP metals and alloys.[11] Dueto the fundamentally non-homogenous deformation byHPT, important properties evolve with the number ofHPT revolutions and with the distance from thespecimen center. HPT therefore allows getting funda-mental knowledge of the evolution of the structurerefinement and the nature of physical strengthening.The aim of this study is therefore twofold:
(a) to fabricate the ultrafine-grained structure in theTi-6Al-7Nb alloy by HPT and
(b) to characterize its microstructure features, the lat-tice defect evolution, and mechanical properties
In addition to high resolution scanning microscopyand microhardness measurements, positron annihilationspectroscopy (PAS) was used to evaluate the spatialdistribution of lattice defects. Our previous investiga-tions proved the feasibility of PAS to determine thelattice defect structure in UFG materials.[12–15]
II. MATERIAL AND EXPERIMENTALMETHODS
Hot-rolled rods of the Ti-6Al-7Nb ELI (IMI 367)alloy for medical application, 20 mm in diameter,manufactured by TIMET were used for the investigation.
MILOS JANECEK, Professor, JOSEF STRASKY, Ph.D. Student,PETRHARCUBA, Research Fellow, andKRISTINAVACLAVOVA,Undergraduate Student, are with the Department of Physics ofMaterials, Charles University, Ke Karlovu 5, 12116 Prague 2, CzechRepublic. Contact e-mail: [email protected] JAKUB CIZEK,Professor, is with the Department of LowTemperature Physics, CharlesUniversity, Prague, Czech Republic. VERONIKA V. POLYAKOVA,Ph.D. Student, and IRINA P. SEMENOVA, Professor, are with theUfa State Aviation Technical University, Ufa, Russia.
Manuscript submitted March 1, 2013.
METALLURGICAL AND MATERIALS TRANSACTIONS A

The chemical composition of the alloy was the following:Ti—basic; Al—6.17 pct; Nb—7.05 pct; Fe—0.14 pct;O—0.17 pct; C—0.01 pct; N—0.03 pct; and Ti—balance.The beta-transus temperature according to the materialcertificate was 1278 K (1005 �C).
Samples in the initial condition were subjected tothermal treatment (TT), including incomplete quenchingfrom 1258 K (985 �C) (20 K below the beta-transustemperature) to room temperature followed by anneal-ing at 973 K (700 �C) for 4 h. The microstructure of theas-received and TT conditions was observed using alight microscope Olympus GX51.
For the HPT process, samples 20 mm in diameter and2 mm thick were cut from the thermally processed rodsby the electrospark method. The sample surface waspolished before deformation. During the HPT, thesample was placed between the anvils with a groove of0.8 mm and pressed under an imposed pressure of6 GPa. The lower anvil was rotated, and the sample wasdeformed by shear under the surface friction. The use ofthe groove excludes sliding of the sample during torsion.Torsion was performed with the rotation speed of0.5 rpm at room temperature, and a series of specimensafter 1/4, 1/2, 1, 3, 5, and 15 rotations were processed.
The high resolution scanning electron microscope FEIQuanta 200 FEG operated at 20 kV was employed fordetail investigation of UFG microstructure of thespecimens after HPT (10 kV was used to enhance theimage contrast in some cases). Back-scattered electron,Z-contrast, and channeling contrast were used forrevealing the different microstructural features in theUFG specimens.
An automatic microhardness tester Qness Q10a wasused for the evaluation of microhardness variationsthroughout the surface of specimens after HPT. Morethan 1000 indents were applied in a square grid withhigher density near the specimen center. As a result,more than 100 indents within each ring of 1 mm widthwere applied.
Lattice defect density variations in individual speci-mens after HPT were determined by PAS. A Na2CO3
positron source with an activity of 1.2 MBq deposited onan approx. 2-lm-thick Mylar foil was used for positronannihilation studies. The source contribution represent-ing a contribution of positrons annihilated in the22Na2CO3 spot and the covering mylar foil consisted oftwo weak components with lifetimes of 0.368 and 1.5 nsand relative intensities of 8 pct and 1 pct, respectively.Positron lifetime (LT) measurements were carried outusing a high resolution digital spectrometer.[16] Thedetector part of the digital LT spectrometer consists oftwo Hamamatsu H3378 photomultipliers coupled withBaF2 scintillators. Detector pulses are sampled by twoultrafast Acqiris DC211 8 bit digitizers at a samplingfrequency of 4 GHz. The digitized pulses are acquired bya PC and analyzed off-line by software using a newalgorithm for integral constant fraction timing.[17] Thetime resolution of the digital LT spectrometer was 145 ps[full width at half maximum (FWHM) of the resolutionfunction for 22Na positron source]. At least 107 annihi-lation events were accumulated in each LT spectrum.Decomposition of LT spectra into exponential compo-
nents was performed by a maximum likelihood codedescribed in Reference 18.
III. RESULTS
A. Light Microscopy
The coarse-grained Ti-6Al-7Nb alloy was received ashot-rolled rods having a duplex structure with grains ofthe primary a-phase (light area) of an average size of 5.3lm and a volume fraction of 66 pct distributed in thea+ b matrix (dark area), see Figure 1.One of the authors, Polyakova, has shown recently[19]
that in order to create the homogeneous UFG structureby the ECAP method, it is effective to enhance thefraction of the thin-plate b-transformed structure, thefragmentation of which occurs easier in the process ofSPD. It is also necessary to preserve the fraction of theprimary a phase (usually about 20 pct)[20] in themicrostructure in order to provide sufficient ductility.[21]
In this paper, such a microstructure was obtained by theTT described in the previous section. The structure afterTT is characterized by homogeneous distribution of theglobular primary a grains in the a+ b lamellar micro-structure—see Figure 2. The volume fraction and theaverage size of the a phase were 18 pct and 5.3 lm,respectively. The packages of a-phase plates with theaverage cross size of 330 nm formed in the position ofthe former martensite occupy about 80 pct of thestructure.
B. SEM Observations
The microstructure of the as-pressed specimen (i.e.,the specimen compressed between the anvils by apressure of 6 GPa, but without any rotation) and thespecimen prepared by HPT (5 revolutions) was observedby SEM using back-scattered electrons.
1. As-pressed (N = 0) materialFigure 3 shows the detailed micrograph of the as-
pressed material. The contrast of the picture is given bya chemical composition—so-called Z-contrast. Darker
Fig. 1—Light microscopy image of as-rolled Ti-6Al-7Nb crosssection.
METALLURGICAL AND MATERIALS TRANSACTIONS A

equiaxed grains are primary alpha grains.[20] Withinthose grains, two chemically different regions can bedistinguished. The interior parts of the grains containmore aluminum and less niobium (see Table I) andtherefore appear darker. Diffusion of alpha-stabilizingaluminum and beta-stabilizing niobium must haveoccurred during thermal processing. The white partsare beta phase particles that are either between primaryalpha grains or elongated between alpha lamellae. Theresulting microstructure is known as bimodal or duplex.It must be also noted that alpha grains are known to besofter than lamellar areas.[21,22]
Figure 4 is an overview SEM image. Two types ofcontrast are present: the above-discussed Z-contrast andalso the channeling contrast (grains with different orienta-tions may have different contrasts due to different absorp-tion of back-scattered electrons). Thewhite arrows point tothe two adjacent alpha grains with different shades, whichare caused by their different orientations only. Moreinterestingly, channeling contrast allows the observation
of different families of parallel lamellae formed in theoriginal beta grain during cooling from the beta region[23]
(illustrated by black arrows in two different grains).The chemical composition was determined by energy
dispersive x-ray scattering (EDX). The results arepresented in Table I. Note that the results from theEDX may be used only for mutual comparison ofdifferent measurements by this method. However, theycannot be quantitatively compared to the results ofother methods. Firstly, the average chemical composi-tion was evaluated by x-ray signal acquisition over asufficiently large area so that the composition is aver-aged over all microstructural features. The chemicalcomposition slightly differs from the nominal composi-tion of the Ti-6Al-7Nb alloy, proving the qualitativecharacter of these results only. Secondly, the chemicalcomposition was locally measured near the edge and inthe interior of alpha grains and in beta particles. Thepresented results are average values from three differentpoints, but those data should be taken as qualitativeonly, especially for the beta phase where the betaparticle size is comparable to the interaction volume ofthe electron beam.
2. Material after HPT (N = 5)Figure 5 shows the microstructure of the center of the
specimen after 5 revolutions. Alpha grains are welldistinguishable and their shape is mostly round—similar
Fig. 2—Light microscopy image of Ti-6Al-7Nb after TT.
Fig. 3—As-pressed sample (N = 0), detail SEM image (back-scat-tered electrons, Z-contrast).
Table I. Chemical Composition of Different Microstructural
Features, Measured by EDX
WeightPercent Average Alpha—Edge Alpha—Int. Beta
Ti 83.0 83.2 85.1 75.7Al 8.6 8.5 10.0 6.4Nb 8.5 8.3 4.9 16.4Fe 0.0 0.0 0.0 1.4
Fig. 4—As-pressed sample (N = 0), an overview SEM image.Arrows point to the areas with different channeling contrast.
METALLURGICAL AND MATERIALS TRANSACTIONS A
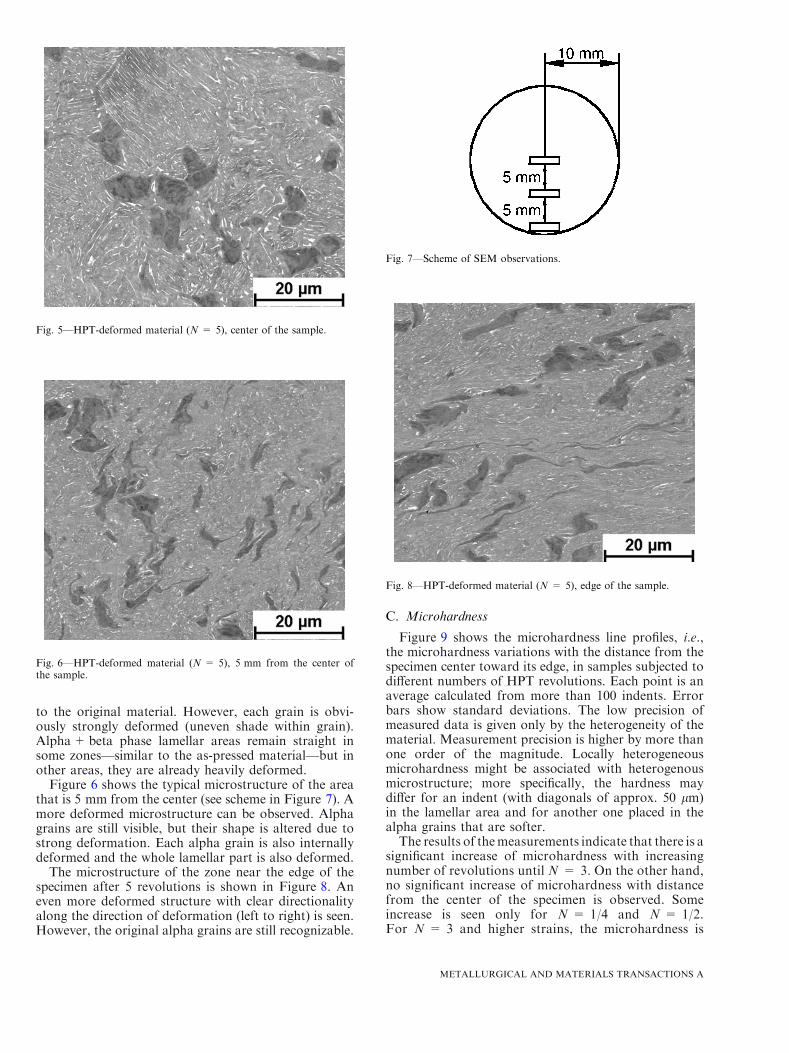
to the original material. However, each grain is obvi-ously strongly deformed (uneven shade within grain).Alpha+beta phase lamellar areas remain straight insome zones—similar to the as-pressed material—but inother areas, they are already heavily deformed.
Figure 6 shows the typical microstructure of the areathat is 5 mm from the center (see scheme in Figure 7). Amore deformed microstructure can be observed. Alphagrains are still visible, but their shape is altered due tostrong deformation. Each alpha grain is also internallydeformed and the whole lamellar part is also deformed.
The microstructure of the zone near the edge of thespecimen after 5 revolutions is shown in Figure 8. Aneven more deformed structure with clear directionalityalong the direction of deformation (left to right) is seen.However, the original alpha grains are still recognizable.
C. Microhardness
Figure 9 shows the microhardness line profiles, i.e.,the microhardness variations with the distance from thespecimen center toward its edge, in samples subjected todifferent numbers of HPT revolutions. Each point is anaverage calculated from more than 100 indents. Errorbars show standard deviations. The low precision ofmeasured data is given only by the heterogeneity of thematerial. Measurement precision is higher by more thanone order of the magnitude. Locally heterogeneousmicrohardness might be associated with heterogenousmicrostructure; more specifically, the hardness maydiffer for an indent (with diagonals of approx. 50 lm)in the lamellar area and for another one placed in thealpha grains that are softer.The results of themeasurements indicate that there is a
significant increase of microhardness with increasingnumber of revolutions until N = 3. On the other hand,no significant increase of microhardness with distancefrom the center of the specimen is observed. Someincrease is seen only for N = 1/4 and N = 1/2.For N = 3 and higher strains, the microhardness is
Fig. 5—HPT-deformed material (N = 5), center of the sample.
Fig. 6—HPT-deformed material (N = 5), 5 mm from the center ofthe sample.
Fig. 7—Scheme of SEM observations.
Fig. 8—HPT-deformed material (N = 5), edge of the sample.
METALLURGICAL AND MATERIALS TRANSACTIONS A

homogenous over the whole specimen, which is afavorable result for any potential application, e.g., inmicroforming technology such as MEMS,[23] microge-ars,[24] microcups,[25] heat exchangers,[26] etc. Finally, anincrease in microhardness at the edge of the as-pressed(N = 0) specimen is due to material outflow fromunderneath the pressing anvils, which effectively causesplastic deformation accompanied with microhardnessincrease. A similar effect was also observed in othermaterials.[27]
D. Evolution of Lattice Defects with Strain Due to HPT(Positron Annihilation Spectroscopy)
Figure 10 shows the dependence of the mean positronlifetime on the radial distance r from the center of thesample subjected to various numbers N of HPT revo-lutions. In the sample, which was only pressed withoutany HPT straining (N = 0), the mean lifetime at theperiphery (r ‡ 6) is remarkably higher than in the centerof the sample, which might be caused by materialflowing out of the area of pressing anvils.
HPT straining causes a significant increase of themean lifetime due to defects introduced by SPD. In thesample subjected to N = ¼ HPT revolution, the meanlifetime is increased in the center and becomes approx-imately constant across the whole sample. Further HPTstraining (N = ½) leads to an additional increase of themean lifetime, which finally saturates at the value of�190 ps. All samples subjected to more HPT revolu-tions (N>½) exhibit very similar mean lifetimes. Thespatial dependence of the mean lifetime across thesample disk is approximately uniform in all samplessubjected to HPT straining (N ‡ ¼), which proves theformation of a relatively homogeneous structure ofdefects across the whole sample.
More information can be obtained from the decom-position of positron lifetime spectra into individualcomponents. Figure 11 shows the dependence of thelifetimes of components resolved in positron lifetimespectra on the radial distance r from the center of thesample for materials subjected to various numbers N ofHPT rotations. The spatial dependence of relativeintensities of these components is plotted in Figure 12.
One can see in Figure 11 that there are threecomponents in the positron lifetime spectra of thesamples studied:
(a) A short lived component with lifetime s1 < 100 psand relative intensity I1 represents a contributionof free positrons annihilated in the delocalizedstate, i.e., not trapped at defects. This componentwas found in samples subjected to N = 0 and 1/4HPT revolution only. In samples subjected to moreHPT revolutions (N ‡ ½), the density of defectsbecomes so high that virtually all positrons aretrapped at defects and the free positron componentdisappeared (saturated positron trapping).[28]
(b) A component with lifetime s2 � 180 ps and rela-tive intensity I2. This component which dominatesin the positron lifetime spectra of all samples stud-ied can be attributed to positrons trapped at dislo-cations.
(c) A long-lived component with lifetime s3 � 300 psand relative intensity I3 comes from positronstrapped at larger point defects with open volumecorresponding to several vacancies. These defectswere likely formed by the agglomeration of defor-mation-induced vacancies. In order to estimate thesize of these vacancy clusters, we performed ab ini-tio theoretic calculations of positron parameters forvacancy clusters of various sizes in Ti. Figure 13shows the calculated dependence of positron life-time on the size of vacancy clusters consisting ofdifferent numbers of vacancies. Obviously, positronlifetime strongly increases with increasing size ofvacancy clusters and gradually saturates for largeclusters. From the comparison of calculated depen-dence with experimental lifetimes in Figure 11, onecan conclude that the average size of vacancy clus-ters in HPT-deformed samples corresponds to 4vacancies.
The as-received material comprises only two compo-nents: free positrons with the lifetime s1 = 84 ± 3 ps andthe relative intensity I1 = 17.6 ± 0.7 pct, and positronstrapped at dislocations with the lifetime s2 = 170 ± 1 psand the relative intensity I2 = 82.4 ± 0.7 pct. No
Fig. 9—Dependence of the microhardness on number of HPT turnsand the distance from the center of the specimen. Fig. 10—The mean positron lifetime as a function of the radial dis-
tance r from the center of the samples subjected to various numberN of HPT revolutions.
METALLURGICAL AND MATERIALS TRANSACTIONS A

vacancy clusters were detected in the as-receivedmaterial.
From the detailed inspection of Figure 12, it becomesclear that in the sample which was only pressed(N = 0), the intensity I1 of the free positron componentdecreases with increasing distance from the center of thesample, while the intensity I3 of positrons trapped atvacancy clusters increases. This proves that the concen-tration of vacancy clusters at the periphery of the sample(N = 0) is higher than in the center, most probably dueto higher deformation at the periphery where deformedmaterial can flow out of the area of pressing anvils. HPTstraining introduces dislocations, which are reflected byan increase of the intensity I2. One can see in Figure 12that I2 increases for the sample subjected to ¼ HPTrevolution, and a further increase of I2 occurs also in thesample strained to ½ HPT revolution. In the lattersample, the density of defects becomes so high thatvirtually all positrons are trapped and the free positroncomponent cannot be resolved in the spectrum anymore.With increasing torsional strain (N>½), I2 saturatesand remains approximately constant.
Moreover, one can see in Figure 12 that samplessubjected to HPT straining (N ‡ ¼) exhibit approxi-mately uniform spatial dependence of the intensities I1,I2, and I3 across the whole sample disk. This proves thatan almost homogeneous structure of defects across thewhole sample has already been achieved after ¼ HPTrevolution.
Since the samples subjected to HPT straining (N ‡ ¼)do not exhibit any systematic dependence of positronparameters across the sample except of statisticalscattering, the average lifetimes and relative intensitieswere calculated by averaging of all data measured ateach sample. These averaged lifetimes and correspond-ing relative intensities are plotted in Figure 14 as afunction of the number of HPT revolutions. Frominspection of the figure, it becomes clear that the densityof dislocations strongly increases in the beginning ofHPT straining (N< 1) and it is accompanied by adisappearance of the free positron component. During
further deformation (N ‡ 1), the dislocation componentremains approximately unchanged. The average size ofvacancy clusters slightly decreases during HPT strain-ing; see the upper panel in Figure 14.In the samples N = 0 and N = ¼ where the free
positron component is present in the positron lifetimespectra, one can determine the dislocation density qD
by application of the three-state simple trapping model(3-STM)[29]
qD ¼1
mD
I2I1
1
sB� 1
s2þ I3
1
s2� 1
s3
� �� �; ½1�
where sB = 144 ps is the bulk positron lifetime in Ti[30]
and mD is the specific positron trapping rate fordislocations, which is know to fall into the range 10�5
to 10�4 m2 s�1 for most metals.[31] For the estimation ofthe dislocation density, we used the average valuemD � 0.5 9 10�5 m2 s�1. The dislocation density in theas-received sample is qD = 1 9 1014 m�2. The disloca-tion density in samples N = 0 and N = ¼ estimatedusing the average value mD � 0.5 9 10�5 m2 s�1 isplotted in Figure 15 as a function of the radial distancefrom the center. The dislocation density in both samplesslightly increases from the center of the sample towardthe edge. The mean dislocation density in the samplesubjected to ¼ HPT revolution is 4 times higher than inthe as-received material.The concentration of the vacancy clusters cvc in
samples N = 0 and ¼ can be estimated within 3-STMfrom the expression
cvc ¼1
nvmv
I3I1
1
sB� 1
s3þ I2
1
s3� 1
s2
� �� �; ½2�
where nv = 4 is the average number of vacancies percluster and mv � 1014 s�1 is the specific positron trap-ping rate for a vacancy.[31] The concentration of vacancyclusters estimated from Eq. [2] for samples N = 0 and¼ is plotted in Figure 16 as a function of the distancefrom the center. Obviously, the sample which was onlypressed exhibits remarkably higher cvc at the periphery
Fig. 11—Dependence of lifetimes of individual positron components on the radial distance r from the center of the sample for materials sub-jected to various numbers N of HPT rotations.
METALLURGICAL AND MATERIALS TRANSACTIONS A

compared to the center. On the other hand, the samplesubjected to ¼ HPT revolution exhibits a relativelyuniform spatial distribution of vacancy clusters. Theconcentration of vacancy clusters in the sample N = ¼is comparable with that at the periphery of the samplewhich was only pressed, see Figure 16. An increase of cvcin the center of the sample N = ¼ is obviously due toagglomeration of vacancies created by SPD during HPTstraining.
In samples subjected to a higher degree of HPTstraining (N ‡ ½), the concentration of defects cannotbe determined because of saturated positron trappingwhich leads to disappearance of the free positroncomponent. Taking into account that the free positron
component cannot be resolved when I1 < 5 pct andusing the ratio of intensities I2 and I3, one can estimatethat straining to N = ½ leads to an increase of
Fig. 13—Calculated positron lifetimes for vacancy clusters in Ti con-sisting of various numbers of vacancies.
Fig. 14—Positron lifetimes (a) and corresponding relative intensities(b) averaged over whole sample and plotted as the number of HPTrevolutions.
Fig. 12—Relative intensities I1, I2, and I3 for the free positron com-ponent (a), the contribution of positrons trapped at dislocations (b)and vacancy clusters (c) for samples subjected to various numbers Nof HPT revolutions plotted as a function of the radial distance rfrom the center of the sample.
METALLURGICAL AND MATERIALS TRANSACTIONS A

dislocation density to at least 1015 m�2 and simulta-neously to an increase of cvc to at least 15 ppm. Notethat dislocation density might increase during furtherHPT processing (N>½), but it cannot be detected dueto saturated positron trapping. However, if so, then theconcentration of vacancy clusters increases in a similarmanner and the ratio of concentrations of these twokinds of defects remains unchanged.
IV. DISCUSSION
A. Effect of Thermal Treatment
Two-step TT results in a typical duplex microstructureconsisting of round primary alpha grains and lamellara+ b structure. Chemical analysis proved that theinteriors of the primary alpha grains are aluminumenriched and niobium depleted, whereas the rim of thosegrains has the average composition. We assume that theinterior of the primary alpha grains having the volumefraction of approximately 10 pct are original alpha grainsof the as-received (as-rolled) material that remain in thematerial during annealing at 1258 K (985 �C). Thesealpha grains started to grow during annealing at 973 K(700 �C), but the temperature is not sufficiently high tocause the diffusional change in the composition of theprimary alpha grains in favor of a-stabilizing elements. As
a result, the interiors of the primary alpha grains havedifferent chemical compositions than their rims.Contrarily, beta particles are aluminum depleted and
strongly niobium enriched. Beta particles also includedetectable iron content. Iron is the typical impurity in Tialloys and even in a low content (<1 wt pct), it helps tostabilize the beta phase.[32]
B. Relation Between Defect Structure, Microstructure,and Microhardness
SEM observations confirm that after HPT deforma-tion, primary alpha grains and a+ b lamellaes arepresent in the microstructure. However, microhardnessmeasurements and PAS cannot distinguish betweenthose microstructural features. The approximate sizeof an indent is 50 lm and therefore it is too large todistinguish between these two regions. On the otherhand, each indentation does not represent the measure-ment of a truly average material. The results ofmicrohardness are therefore heterogeneous. Interest-ingly, the heterogeneity (represented as standard devi-ation from the mean value) increases with increasingstrain. This suggests that the difference between hard-ness of the alpha grains and a+ b lamellar structureincreases with increasing strain. Most probably, a+ blamellar structure is significantly hardened. The finalanswer to this assumption may be provided by moredetailed microhardness or nanohardness measurements.For the as-pressed sample (N = 0), the outflow of the
material between the anvils is captured by significantincrease in vacancy clusters in the periphery region, butno increase in dislocation density occurs. Microhardnessincreases significantly, proving the important effect ofvacancy hardening.[33]
The defect structure is already homogenous fromN = 1/2 HPT revolution, while the microhardness ishomogenous from N = 3 HPT revolutions only. On theother hand, the microstructure is not entirely homoge-nous even after N = 5 HPT revolutions. The evolutionof primary alpha grains as observed by SEM is ratherindependent of the evolution of point and line defects asevaluated by PAS. Several mechanisms like vacancyhardening, dislocation density, and microstructurerefinement are responsible for the significant hardnessincrease which is not directly related to a singlecharacteristic quantity.
V. CONCLUSIONS
The following conclusions can be drawn from thepresented investigations of the ultrafine-grained Ti-6Al-7Nb biocompatible alloy prepared by HPT up to 15revolutions:
1. Thermal treatment before HPT resulted in duplexmicrostructure with chemically heterogeneous pri-mary alpha grains having 18 pct volume fraction.Primary alpha grains provide sufficient ductility forSPD, whereas the major a+ b lamellar microstruc-ture becomes more easily fragmented and hardened.
Fig. 15—Dislocation density qD in the sample, which was only pres-sed (N = 0) and the sample subjected to ¼ HPT revolution(N = ¼), plotted as a function of the radial distance r from thecenter.
Fig. 16—The concentration cvc of vacancy clusters in the samplewhich was only pressed (N = 0) and the sample subjected to ¼HPT revolution (N = ¼), plotted as a function of the radial dis-tance r from the center.
METALLURGICAL AND MATERIALS TRANSACTIONS A

2. SEM observations revealed heavily deformed pri-mary alpha grains surrounded by significantly frag-mented a+ b microstructure after 5 HPTrevolutions.
3. Microhardness significantly increases (from 330 to400 HV 0.5) with increasing strain, but it is heterog-enous due to heterogenous microstructure. Hetero-geneity of microhardness increases with increasingstrain, suggesting that the a+ b lamellar micro-structure is more hardened than primary alphagrains.
4. Positron annihilation spectroscopy showed signifi-cant increase of dislocation density (approx.1015 m�2) and of the concentration of vacancy clus-ters (15 ppm) after ½ of the HPT revolution.
5. The defect structure is already homogenous after ½HPT revolution, while the microhardness becomeshomogenous after three HPT revolutions.
ACKNOWLEDGMENTS
This work was financially supported by the CzechMinistry of Education and Youth under the grantLH12217. Partial financial support by the Czech Sci-ence Foundation under the project P107/12/1025 isalso acknowledged. One of the authors J.C. acknowl-edges financial support from the Czech Science Foun-dation (project P108/12/G043).
REFERENCES1. M. Geetha, A.K. Singh, R. Asokamani, and A.K. Gogia:
Prog. Mater. Sci., 2009, vol. 54, pp. 397–425.2. C. Leyens and M. Peters: Titanium and Titanium Alloys,
Wiley-VCH Verlag, 2003, pp. 423–51.3. K.S. Katti: Colloids Surf. B, 2004, vol. 39, pp. 133–42.4. M. Niinomi: J. Mech. Behav. Biomed. Mater., 2008, vol. 1, pp.
30–42.5. R.Z. Valiev and T.G. Langdon: Prog. Mater. Sci., 2006, vol. 51,
pp. 881–981.6. A.P. Zhilyaev and T.G. Langdon: Prog. Mater. Sci., 2008, vol. 53,
pp. 893–979.7. H.S. Kim: J. Mater. Proc. Technol., 2001, vol. 113, pp. 622–26.
8. Y. Saito, H. Utsunomiya, N. Tsuji, and T. Sakai: Acta Mater.,1999, vol. 47, pp. 579–83.
9. V.N. Varyutkhin, Y. Beygelzimer, S. Synkov, and D. Orlov:Mater. Sci. Forum, 2006, vols. 503–504, pp. 335–38.
10. X. Yang, Y. Okabe, H. Miura, and T. Sakai: J. Mater. Sci., 2012,vol. 47, pp. 2823–30.
11. Z. Horita, D.J. Smith, M. Furukawa, M. Nemoto, R.Z. Valiev,and T.G. Langdon: J. Mater. Res., 1996, vol. 11, pp. 1880–90.
12. R. Kuzel, Z. Matej, V. Cherkaska, J. Pesicka, J. Cızek, I.Prochazka, and R.K. Islamgaliev: J. Alloys Compd., 2004,vol. 378, pp. 242–47.
13. M. Janecek, J. Cızek, M. Dopita, R. Kral, and O. Srba: Mater.Sci. Forum, 2008, vols. 584–586, pp. 400–45.
14. Z. Matej, R. Kuzel, M. Dopita, M. Janecek, J. Cızek, and T.Brunatova: Int. J. Mater. Res., 2009, vol. 100, pp. 880–83.
15. R. Kuzel, M. Janecek, Z. Matej, J. Cızek, M. Dopita, and O. Srba:Metall. Mater. Trans. A, 2010, vol. 41A, pp. 1174–90.
16. F. Becvar, J. Cızek, I. Prochazka, and J. Janotova: Nucl. Instrum.Methods A, 2005, vol. 539, pp. 372–85.
17. F. Becvar: Nucl. Instrum. Methods B, 2007, vol. 261, pp. 871–74.18. I. Prochazka, I. Novotny, and F. Becvar: Mater. Sci. Forum, 1997,
vols. 255–257, pp. 772–74.19. V.V. Polyakova and I.P. Semenova: Modern Problems of Science
and Education, 2012, vol. 6, in Russian.20. J. Mueller, H.J. Rack, and L. Wagner: Ti-2007, Science and
Technology, M. Niinomi, S. Akiyama, M. Hagiwara, M. Ikeda,and K. Maryama, eds., JIMIC 5, 2007, pp. 383–87.
21. R. Boyer, G. Welsh, and E. Collings: Material Properties Hand-book—Titanium Alloys, ASM International, Materials Park, OH,1994.
22. N. Poondla, T.S. Srivatsan, A. Patnaik, and M. Petraroli: J AlloysCompd., 2009, vol. 486, pp. 162–67.
23. Y. Estrin, M. Janecek, G.I. Raab, R.Z. Valiev, and A. Zi: Metall.Mater. Trans. A, 2007, vol. 38A, pp. 1906–09.
24. W.J. Kim and Y.K. Sa: Scripta Mater., 2006, vol. 54, pp. 1391–95.25. X. Ma, R. Lapovok, C. Gu, A. Molotnikov, Y. Estrin, E.V.
Pereloma, C.H.J. Davies, and P.D. Hodgson: J. Mater. Sci., 2009,vol. 44, pp. 3807–12.
26. X.G. Qiao, N. Gao, Z. Moktadir, M. Kraft, and M.J. Starink:J. Micromech. Microeng., 2010, vol. 20, p. 045029.
27. J. Vratna, M. Janecek, J. Cızek, D.J. Lee, E.Y. Yoon, and H.S.Kim: J. Mater. Sci., 2013, DOI:10.1007/s10853-013-7151-x.
28. J. Cızek,M. Janecek, O. Srba, R.Kuzel, Z. Barnovska, I. Prochazka,and S. Dobatkin: Acta Mater., 2011, vol. 59, pp. 2322–29.
29. R. West: Positrons in Solids, Topics in Current Physics, P.Hautojarvi, ed., Springer, Berlin, 1979, pp. 89–115.
30. J.M. Campillo Robles, E. Ogando, and F. Plazaola: J. Phys.Condens. Matter, 2007, vol. 19, p. 176222.
31. P. Hautojarvi and C. Corbel: Proceedings of the InternationalSchool of Physics ‘‘Enrico Fermi’’, Course CXXV, A. Dupasquierand A.P. Mills, eds., IOS Press, Varena, 1995, pp. 491–506.
32. M. Mhaede, L. Wagner, and K. Ibrahim: Int. J. Mater. Res., 2013.doi:10.3139/146.110920.
33. M. Zehetbauer: Key Eng. Mater., 1995, vols. 97–98, pp. 287–306.
METALLURGICAL AND MATERIALS TRANSACTIONS A