mechanical properties of cranial bone*
TRANSCRIPT
J. Biomehnzics, Vol. 3.p. 495-5 I I. Pergamon Press. 1970. Printed in Great Britain
MECHANICAL PROPERTIES OF CRANIAL BONE*
JAMES H. McELHANEY, JOHN L. F0GLE.t JOHN W. MELVIN, RUSSELL R. HAYNES,? VERNE L. ROBERTS and NABIH M. ALEMt
Highway Safety Research Institute, The University of Michigan, Ann Arbor, Mich. 48105. U.S.A.
Abstract-Samples of human and Macaca mularta cranial bone have been tested quasistatically in tension, compression, simple shear, and torsion. The results of these experiments have been analyzed, taking into account observed anisotrophies and varying structures. Statistical correla- tions of properties have been made with density and a model proposed that summarizes these results. The cranial bones appear to be transversely isotropic and they are generally much stronger and stiffer in the transverse or tangent to the skull direction in comparison to the radial direction. The structure of the dip& region was found to be highly variable and this strongly influenced many of the mechanical responses. The model, however. explains much of the ob- served variation.
INTRODUCTION
WITH the advent of high speed air and land transportation, engineers have become in- creasingly aware of the mechanical frangibility of the human body. Thus, we have seen the evolution of various isolating and load dis- tributing devices ranging from seat belts and padded sun visors to ejection seats, crash helmets and acceleration couches. While there is much information available regarding the response of inanimate material to vibration and impact, there is an equal dearth of know- ledge pertaining to the mechanical properties of biological materials. Therefore, the design of much support equipment is often based on intuition because of this lack of information. Knowledge of this type is valuable in the treat- ment of injuries since it serves to identify the mechanism of trauma. A rational therapy for head injury, for example, cannot be developed until a quantitative description of the mech- anical properties of the tissues of the head is obtained.
cause of death and disability in this country (Subcommittee on Head Injury, 1969), with an estimate that head injuries occur in 71 per cent of persons injured in motorcycle acci- dents and in 70 per cent of persons injured in accidental falls in the home. It is further estimated that in 1967 there were 112,000 fatalities and 400,000 permanent impairments due to accidental causes. While data is not available as to what proportion of these were head injuries, there is little doubt that the percentage is discouragingly high.
The National Safety Council has shown that accidents are the fourth leading cause of death surpassed only by heart disease, cancer and stroke. Head injury ranks as a major
The literature on the mechanical properties of the skull is quite modest. Evans and Lissner (1957) have measured the tensile and com- pressive strength of embalmed human parietal bone but they have not measured strains during the test and therefore could not report the modulus of elasticity. Dempster ( 1967) has made a detailed study of the cortical grain structure of the human skull using the split line method. He observed a random orienta- tion of grain structure for the inner and outer table of the brain case, supporting our observa- tion of isotropy in the tangential direction for skull bone. Wood (1969) recently finished a detailed study of the tensile properties of
*Received 3 1 March 1970. tBiomechanics Laboratory, West Virginia University, Morgantown, W.V. 26505, U.S.A.
495
496 J. H. McELHANEY er al.
miniature specimens cut from the compact bone of the inner and outer tables while Melvin et al. (1969) has presented a preliminary report on the mechanical behavior of the di- ploe layer in compression.
The aim of the research described in this paper is to specify the mechanical properties of the skull relevant to the biomechanics of head injury. This work is part of a program of head injury research investigating the mech- anical properties of all the tissues of the head. The ultimate goal of this program is to deter- mine the characteristics of these materials in sufficient detail so that appropriate physical and mathematical models of the head may be constructed. These models will allow the systematic study of various head injury mech- anisms.
The skull is a complex structure made up of several bones each with its own unique in- ternal and external geometry. Mechanical properties may be classified in three types: geometrical or spatial properties; material properties; and structural properties. The measurement of all types of mechanical pro- perties will be discussed in this paper. Each category presents its own peculiar measure- ment problems and it is important to separate these measurements as to type. In particular, material properties should be separated from structural properties. For instance, load deflection curves may be easily measured on a variety of structures and are in general as much property of the structure as of the material of which the structure is composed. It is only under certain highly restrictive condi- tions that such curves may be converted to stress-strain curves or material properties that are independent of the structural geometry. The stress and strain distributions must be known. It is possible to measure material properties in tension or compression tests by assuming and insuring that the stress and strain are uniformly distributed. This can only be completely true if the material under test is homogeneous. A beam or simple shear test requires a knowledge of the materials’ stress-
strain relations for interpretation and there- fore yields only composite structural-material properties that cannot be uncoupled without additional information about the material (Gurdjian and Lissner, 1947). In the case of the small samples of skull bone it is convenient to consider the specimen homogeneous be- cause the internal architecture cannot be determined in sufficient detail to allow a geom- etrical or structural analysis. Thus, the aver- age stress and strain may be computed from the load, deformation, and the gross dimen- sions of the specimen. But the average value may be far from the maximum value because of the non-homogeneous microstructure (Evans and Bang, 1967). It is beyond the scope of this paper to deal with the influence of various levels of organization of bone on the stress distribution. Therefore, average values of stress and strain are reported throughout. However, the model presented here provides some insight into these problems and hopefully will allow the use of these average values in a more general way.
SPECIMEN PREPARATION AND LOCATION
The human skull bone used in this research was obtained from three sources: embalmed cadavers, craniotomies and autopsy. The primary source was embalmed cadavers from which 17 entire calvariums have been ob- tained with ages ranging from 56 to 73 yr at death. Fresh material from craniotomies and autopsy was also tested (40 donors) to verify the results of the tests on embalmed material. Previous work (McElhaney et al., 1964) indicates that the mechanical properties of embalmed bone are not significantly different from immediate postmortem properties.
A fine grid reference system was used to identify the location of test specimens from the human and monkey skull. The system used a 1 cm grid referenced from the coronal, sagittal and lambdoidal sutures and origin- ating from the bregma and lambda points. The system is based entirely on the landmarks on the top of the skull and has been used in an

Fig. I Grid reference system
MECHANICAL PROPERTIES OF CRANIAL BONE 497
attempt to correlate the mechanical properties with position (Fig. 1).
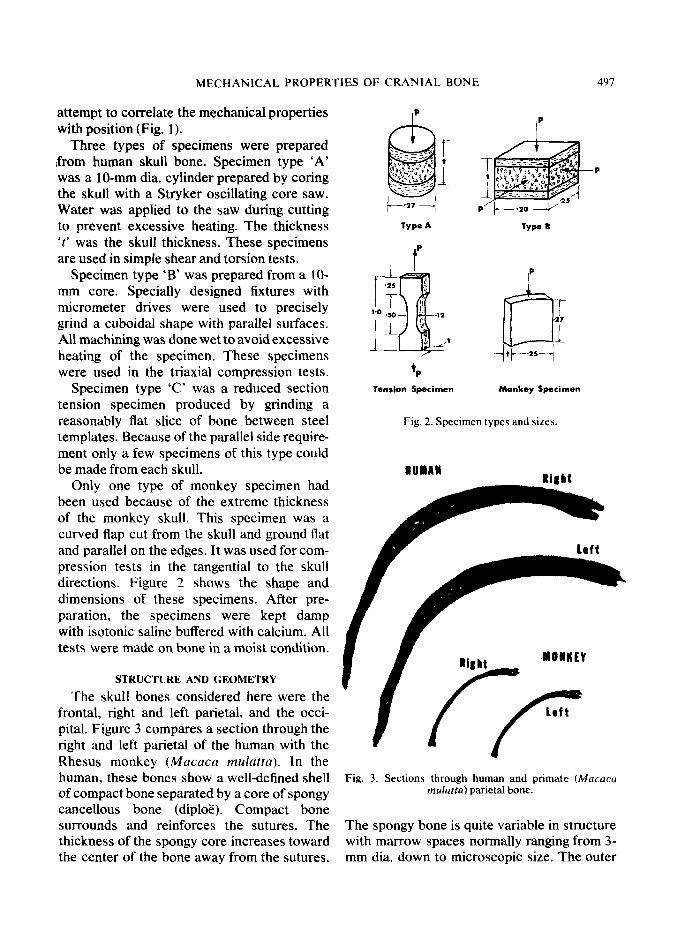
Three types of specimens were prepared ,from human skull bone. Specimen type ‘A’ was a lo-mm dia. cylinder prepared by coring the skull with a Stryker oscillating core saw. Water was applied to the saw during cutting to prevent excessive heating. The thickness ‘r’ was the skull thickness. These specimens are used in simple shear and torsion tests.
Specimen type ‘B’ was prepared from a lo- mm core. Specially designed fixtures with micrometer drives were used to precisely grind a cuboidal shape with parallel surfaces. All machining was done wet to avoid excessive heating of the specimen. These specimens were used in the triaxial compression tests.
Specimen type ‘C’ was a reduced section tension specimen produced by grinding a reasonably flat slice of bone between steel templates. Because of the parallel side require- ment only a few specimens of this type could be made from each skull.
Only one type of monkey specimen had been used because of the extreme thickness of the monkey skull. This specimen was a curved flap cut from the skull and ground flat and parallel on the edges. It was used for com- pression tests in the tangential to the skull directions. Figure 2 shows the shape and dimensions of these specimens. After pre- paration, the specimens were kept damp with isotonic saline buffered with calcium. All tests were made on bone in a moist condition.
STRUCTURE AND GEOMETRY
The skull bones considered here were the frontal, right and left parietal, and the occi- pital. Figure 3 compares a section through the right and left parietal of the human with the Rhesus monkey (Macaca mulutfa). In the human, these bones show a well-defined shell of compact bone separated by a core of spongy cancellous bone (diploe). Compact bone surrounds and reinforces the sutures. The thickness of the spongy core increases toward the center of the bone away from the sutures.
Tension Specimen Monkey Specimen
Fig. 2. Specimen types and sizes.
RiRLt
, 7;
left
Fig. 3. Sections through human and primate (Mocacu md~tta)parietal bone.
The spongy bone is quite variable in structure with marrow spaces normally ranging from 3- mm dia. down to microscopic size. The outer
498 J. H. McELHANEY et al.
table of compact bone is quite smooth. The inner surface presents depressions corre- sponding to the cerebral convolutions, and numerous furrows for the ramifications of various blood vessels. The structure of these bones in the Rhesus monkey is quite different from the human for there is much less diplo and where it occurs it is generally one to two pores thick.
Due to the sandwich construction of the skull bone, the test samples previously des- cribed have a variable structural geometry. These specimens contain the full cross section except they are ground flat on the top and bottom corresponding to the inside and out- side of the skull. This results in a specimen with an inner and outer table of compact bone and a core of cancellous bone. The mechanical properties of compact bone are much more uniform and predictable than cancellous bone. The marrow spaces and trabecular arrange- ment of the diploe are highly variable, this giving rise to a wide range of mechanical responses. In order to ascribe meaningful material properties to this cancellous bone, one must have a correlation with the internal geometry. We are currently performing analy- sis of a variety of models to develop this correlation but with limited success. The limitation is the amount of geometrical detail that is practical to build into the model.
%XPERIMJWTAL PROCEDURES
Density The density of the specimens was deter-
mined by measuring the external dimensions of the specimen to determine the volume and by dividing this into the dry weight. After the mechanical properties tests are completed, the specimens were dried by baking at 105” until no further weight loss is observed. This den- sity was therefore the weight of dry bone per unit volume and provides a convenient method of estimating the porosity.
Compression Compression tests were performed on the
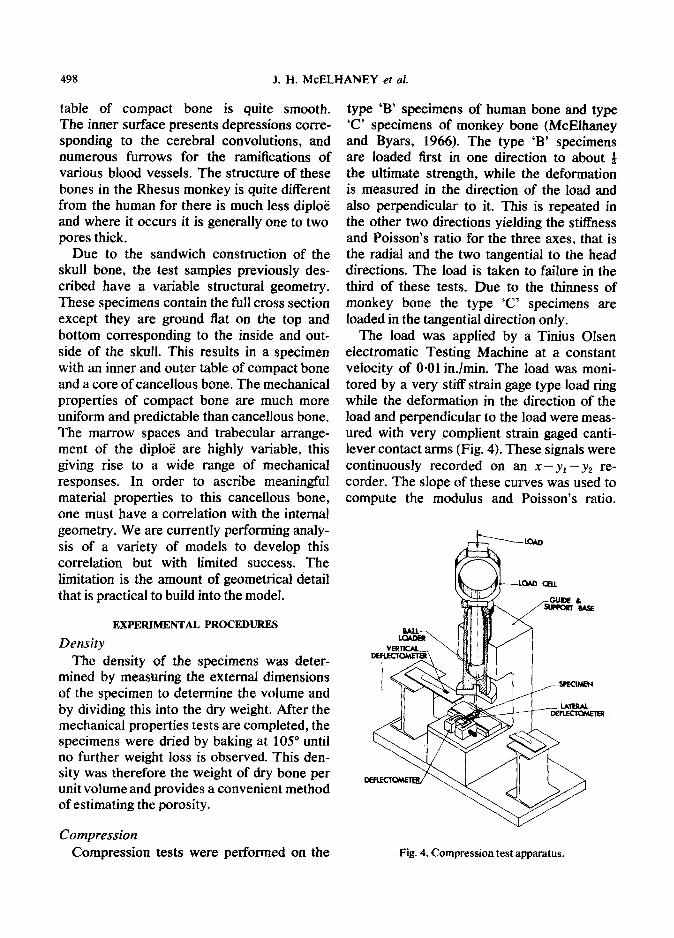
type ‘B’ specimens of human bone and type ‘C’ specimens of monkey bone (McElhaney and Byars, 1966). The type ‘B’ specimens are loaded first in one direction to about 4 the ultimate strength, while the deformation is measured in the direction of the load and also perpendicular to it. This is repeated in the other two directions yielding the stiffness and Poisson’s ratio for the three axes, that is the radial and the two tangential to the head directions. The load is taken to failure in the third of these tests. Due to the thinness of monkey bone the type ‘C’ specimens are loaded in the tangential direction only.
The load was applied by a Tinius Olsen electromatic Testing Machine at a constant velocity of O-01 in./min. The load was moni- tored by a very stiff strain gage type load ring while the deformation in the direction of the load and perpendicular to the load were meas- ured with very complient strain gaged canti- lever contact arms (Fig. 4). These signals were continuously recorded on an x-y, - yz re- corder. The slope of these curves was used to compute the modulus and Poisson’s ratio.
Fig. 4. Compression test apparatus.
MECHANICAL PROPERTIES OF CRANIAL BONE 499
The ultimate strength was the stress corre- sponding to the maximum load the specimen could withstand, generally characterized by a slope reversal. The ultimate strain was taken as the magnitude of the strain at the maximum load. The energy absorption capac- ity was determined as the work done on the material per unit volume in loading to the maximum load, and was proportional to the area under the load-deflection diagram.
Tension Tension tests to failure were performed on
miniature reduced section specimens. In some cases the total cross-section was tested, while in other cases the inner or outer table of com- pact bone was isolated and tested (see Wood 1969), for a complete description of this test). The load was applied by the above mentioned testing machine through specially designed grips supported on spherical bearings to minimize eccentricity. The load was moni- tored by a strain gage type load ring and the deformation was measured by a specially designed clip gage with at-in. gage length or by strain gages cemented to the bone surface. The load deformation data was recorded on an x-y plotter and appropriate properties determined as in the compression test.
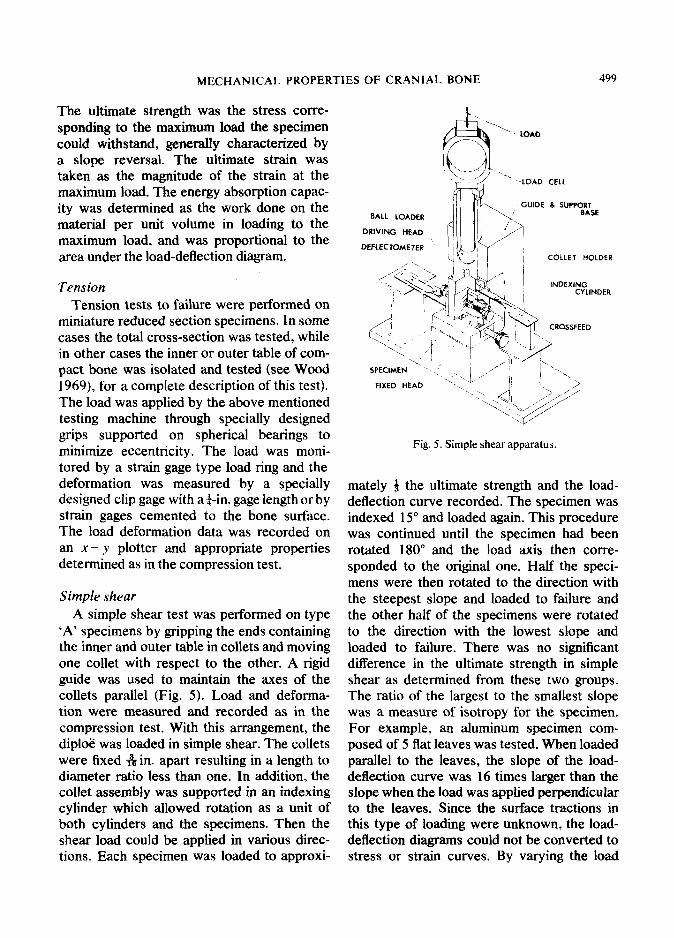
Simple shear
A simple shear test was performed on type ‘A’ specimens by gripping the ends containing the inner and outer table in collets and moving one collet with respect to the other. A rigid guide was used to maintain the axes of the collets parallel (Fig. 5). Load and deforma- tion were measured and recorded as in the compression test. With this arrangement, the diploe was loaded in simple shear. The collets were fixed &in. apart resulting in a length to diameter ratio less than one. In addition, the collet assembly was supported in an indexing cylinder which allowed rotation as a unit of both cylinders and the specimens. Then the shear load could be applied in various direc- tions. Each specimen was loaded to approxi-
BALL LOADER
DRIVING HEAD
DEFLECTOMETER
‘\ ‘/ --. ,_ --‘> -LOAD CELL
GUIDE 8 SUPPORT BASE
COLLET IiOLDER
FIXED HEAD ‘\- __
Fig. 5. Simple shear apparatus.
mately 3 the ultimate strength and the load- deflection curve recorded. The specimen was indexed 15” and loaded again. This procedure was continued until the specimen had been rotated 180” and the load axis then corre- sponded to the original one. Half the speci- mens were then rotated to the direction with the steepest slope and loaded to failure and the other half of the specimens were rotated to the direction with the lowest slope and loaded to failure. There was no significant difference in the ultimate strength in simple shear as determined from these two groups. The ratio of the largest to the smallest slope was a measure of isotropy for the specimen. For example, an aluminum specimen com- posed of 5 flat leaves was tested. When loaded parallel to the leaves, the slope of the load- deflection curve was 16 times larger than the slope when the load was applied perpendicular to the leaves. Since the surface tractions in this type of loading were unknown, the load- deflection diagrams could not be converted to stress or strain curves. By varying the load
500 J. H. McELHANEY et al.
directions in the manner described above, a relative index of isotropy may be obtained. This index is the ratio of the largest slope to the smallest slope as obtained for a particular specimen.
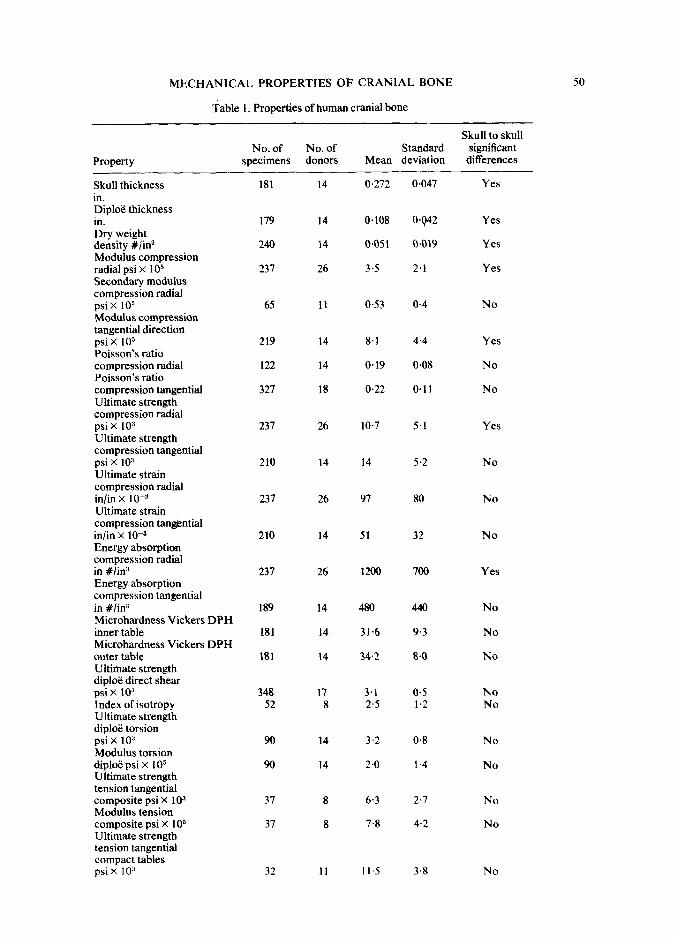
A summary of the results of these tests is presented in Tables 1 and 2. The high values of the standard deviations are due to the naturally occurring variations of the diploe thickness and density. For human skull bone, no significant difference was found for the modulus and ultimate strength due to loading in various tangential directions. Histological studies of tangent sections of the inner and outer tables and the diploe, revealed random patterns without discernable geometrical or- ganization. The index of isotropy, which is a quite sensitive measure of isotropy, was low and the maximum and minimum values of the modulus upon which it was based occurred in random directions. Thus, it was concluded that skull bone is reasonably isotropic in direc- tions tangent to the skull surface.
Torsion Collets similar to those described above
were used to grip and twist type ‘A’ speci- mens. Specially designed torque and angle of twist transducers continuously monitored these quantities and an on-line x-y plotter drew the torque-angle of twist curve. This curve was normalized to the shear stress- strain curve using the classical linear elastic homogeneous assumptions. The specimen was gripped in collets at both ends and torque applied about the cylinder axis. The inner and outer tables were constrained in collets and since they were much stiffer and stronger than the diploe this was essentially a test of the diplot with negligible influence from the com- pact bone of the tables.
In this test, as well as the other tests pre- viously described, the assumption of classical elastic stress distributions was expedient but certainly not justified in the small. The short specimen lengths and obvious structural irregularities resulted in unknown stress varia- tions. However, the assumed stress distri- butions were average values consistent with the statics of the loading situation. The mater- ial properties reported here are therefore reasonably representative of the bulk proper- ties of skull bone.
Hardness
A microhardness test has been developed that allows the hardness of small regions (0.005 in. dia.) to be measured (Zeniya et al., 1964). This test was performed on Tukon Microhardness Tester using a diamond pyra- mid indenter. The diameter of penetration under a 100/g load was converted to Vickers Hardness numbers. Four tests on the inner table surface and four tests on the outer table surface were made on each specimen.
RESULTS
There was no significant difference (90 per cent confidence level) between the micro- hardness tests for the inner and outer skull surfaces. In addition, there was no significant difference (90 per cent confidence level) between the microhardness tests for the human and monkey inner and outer tables. Since microhardness is a relative measure of combined strength-modulus properties, it may be concluded that there is little difference in these properties for the inner and outer sur- faces of the skull. This conclusion agrees with the results of the tension tests on bone speci- mens from the inner or outer tables loaded in the tangent to the skull direction. No signi- ficant difference was observed for the tensile properties of bone from the inner and outer tables.
The fourth column of Tables 1 and 2 indicates the results of a student’s t test comparing the mean value of the property for one skull with the mean value of all the tests. This was done in an attempt to determine whether the varia- tion of the property within a single skull over- shadowed the skull to skull variation. The re- sults indicate that those properties related to diploe structure vary significantly skull to skull while those properties related more to material behavior do not.
MECHANICAL PROPERTIES OF CRANIAL BONE
Table 1. Properties of human cranial bone
Property No. of No. of
specimens donors
Skull to skull Standard significant
Mean deviation differences
Skull thickness in. Diplot thickness in. Dry weight density #/in3 Modulus compression radial psi X 10’ Secondary modulus compression radial psi X 10” Modulus compression tangential direction psi X lo5 Poisson’s ratio compression radial Poisson’s ratio compression tangential Ultimate strength compression radial psi X 10:’ Ultimate strength compression tangential psi X lo” Ultimate strain compression radial in/in X lo+ Ultimate strain compression tangential in/in X 10e3 Energy absorption compression radii in #/in3 Energy absorption compression tangential in #/in” Microhardness Vickers DPH inner table Microhardness Vickers DPH outer table Ultimate strength diploe direct shear psi X IO:% Index of isotropy Ultimate strength diplot torsion psi X lo” Modulus torsion diploe psi X 1 OS Ultimate strength tension tangential composite psi X 1 O3 Modulus tension composite psi X 10% Ultimate strength tension tangential compact tables psiX IO:’
181 14 0.272 0.047 Yes
179 14 0.108 oq42 Yes
240 14 0.051 0.019 Yes
237 26 3.5 2.1 Yes
65 11 0.53 0.4 No
219 14 8.1 4.4 Yes
122 14 0.19 0.08 No
327 18 0.22 o-11 No
237 26 10.7 5.1 Yes
210 14 14 5.2 No
237 26 97 80 No
210 14 51 32 No
237 26 1200 700 Yes
189 14 480 440 No
181 14 31.6 9.3 No
181 14 34.2 8.0 No
348 52
90
90
37
37
32
17 3.1 0.5 No 8 2.5 1.2 No
14 3.2 0.8 No
14 2.0 1,4 No
8 6.3 2.7 No
8 7.8 4.2 No
11 11.5 3.8 No
50
502 J. H. McELHANEY et al.
Table 1. (cont.)
Property
Skull to skull No. of No. of Standard significant
specimens donors Mean deviation differences
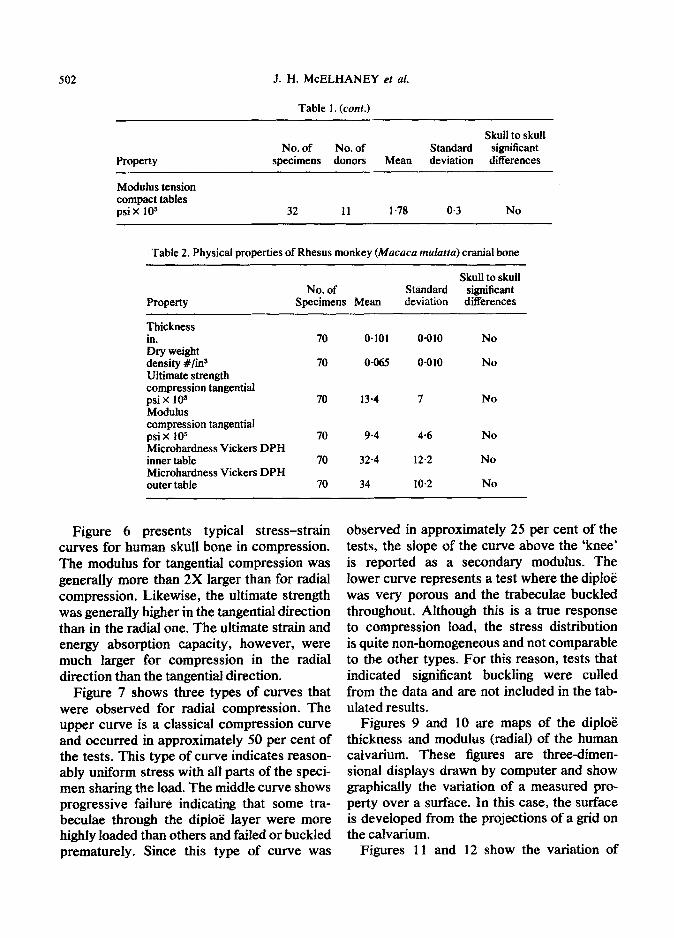
Mcdulus tension compact tables psi X IO5 32 11 1.78 0.3 No
Table 2. Physical properties of Rhesus monkey (Macaca mufatta) cranial bone
Property No. of
Specimens Mean
Skull to skull Standard significant deviation differences
Thickness in. Dry weight density #/ins Ultimate strength compression tangential psi X 1oJ Modulus compression tangential psi X lo5 Microhardness Vickers DPH inner table Microhardness Vickers DPH outer tabIe
70 0.101 o-010 No
70 0.065 0.010 No
70 13.4 7 No
70 9-4 4-6 No
70 32.4 12.2 No
70 34 10.2 No
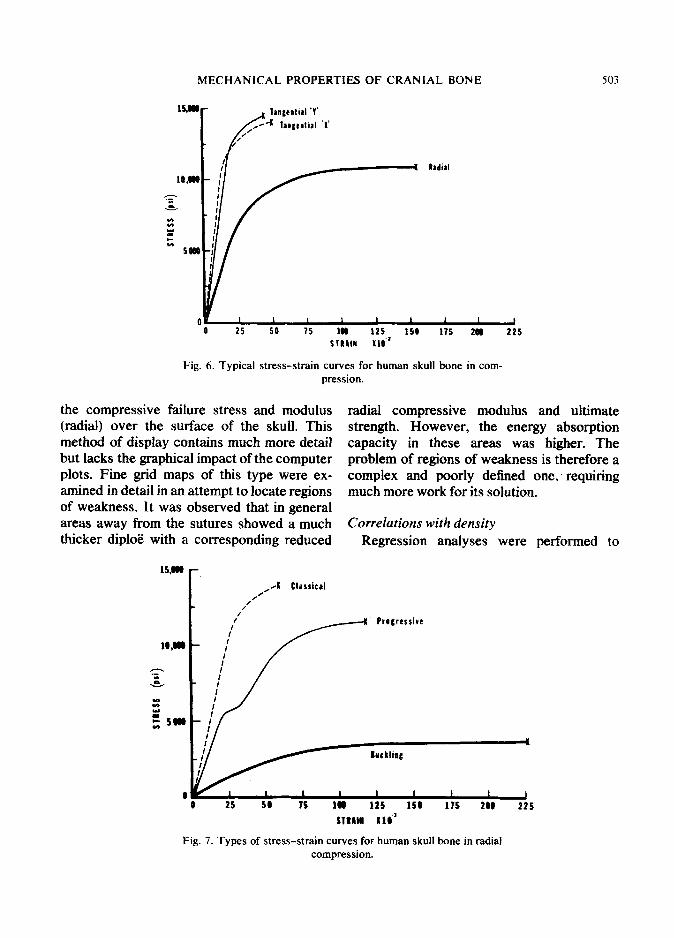
Figure 6 presents typical stress-strain curves for human skull bone in compression. The modulus for tangential compression was generally more than 2X larger than for radial compression. Likewise, the ultimate strength was generally higher in the tangential direction than in the radial one. The ultimate strain and energy absorption capacity, however, were much larger for compression in the radial direction than the tangential direction.
Figure 7 shows three types of curves that were observed for radial compression. The upper curve is a classical compression curve and occurred in approximately 50 per cent of the tests. This type of curve indicates reason- ably uniform stress with all parts of the speci- men sharing the load. The middle curve shows progressive failure indicating that some tra- beculae through the diploe layer were more highly loaded than others and failed or buckled prematurely. Since this type of curve was
observed in approximately 25 per cent of the tests, the slope of the curve above the ‘knee’ is reported as a secondary modulus. The lower curve represents a test where the diploe was very porous and the trabeculae buckled throughout. Although this is a true response to compression load, the stress distribution is quite non-homogeneous and not comparable to the other types. For this reason, tests that indicated significant buckling were culled from the data and are not included in the tab- ulated results.
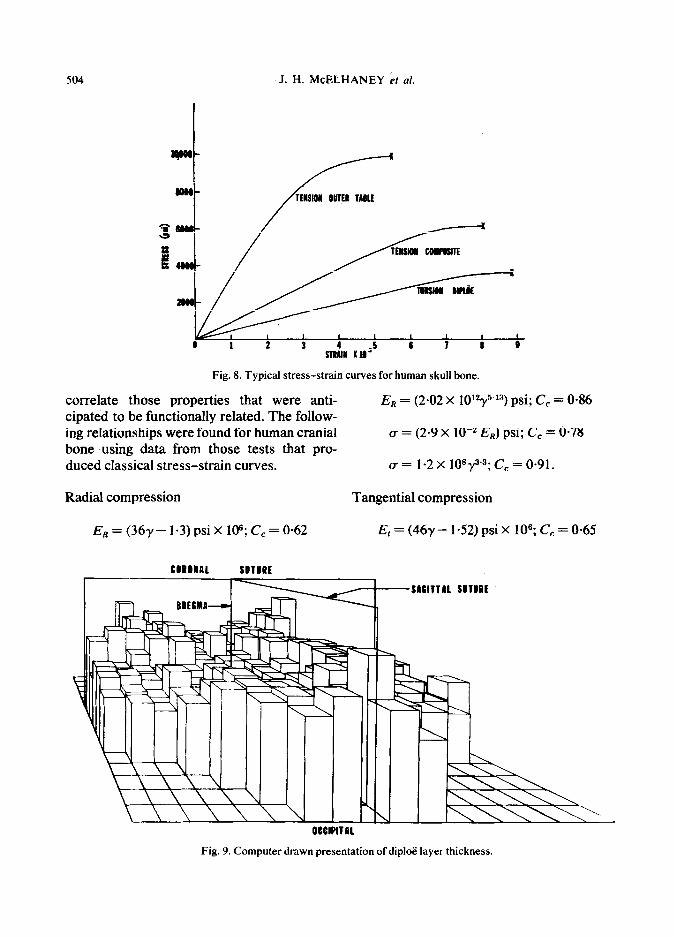
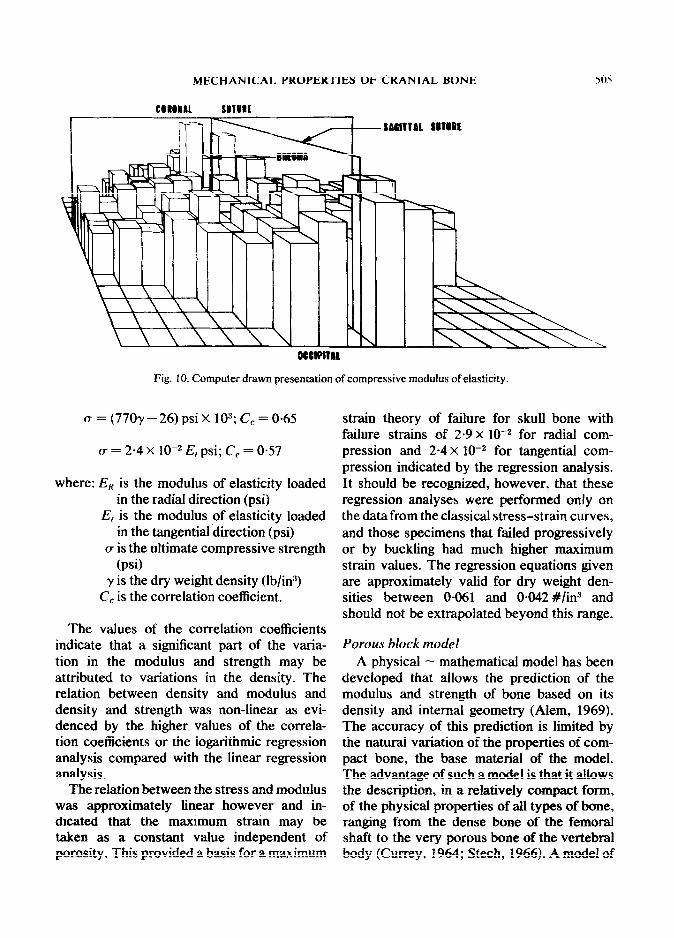
Figures 9 and 10 are maps of the diploE thickness and modulus (radial) of the human calvarium. These figures are three-dimen- sional displays drawn by computer and show graphically the variation of a measured pro- perty over a surface. In this case, the surface is developed from the projections of a grid on the calvarium.
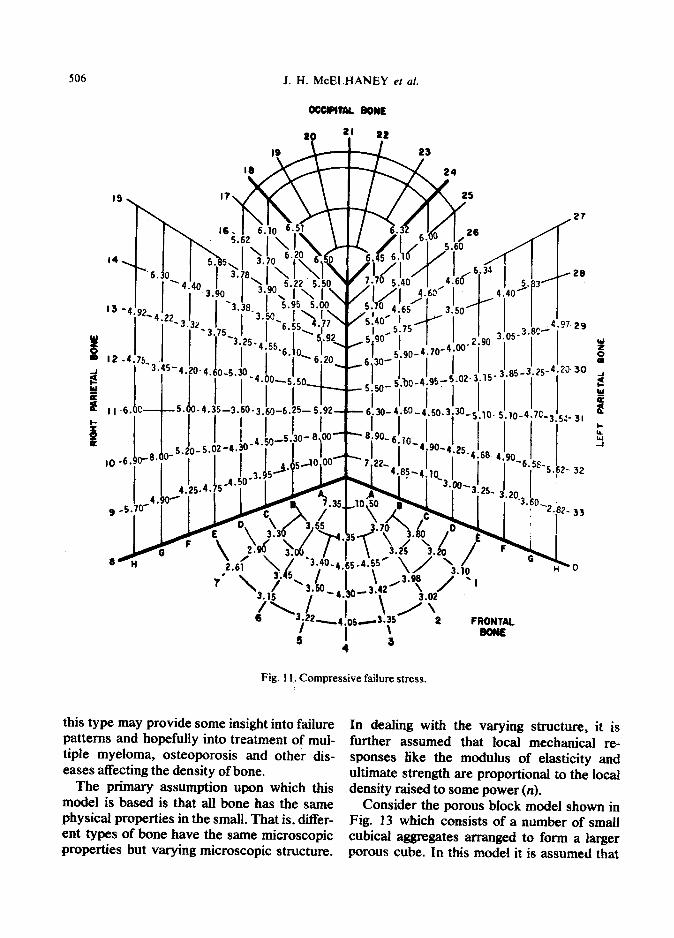
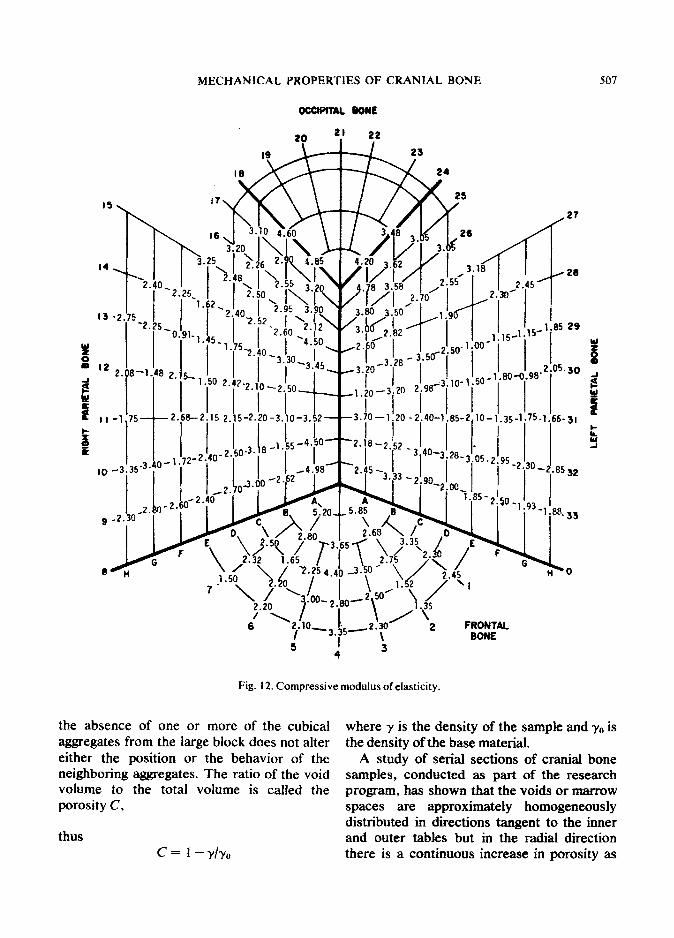
Figures 11 and 12 show the variation of
MECHANICAL PROPERTIES OF CRANIAL BONE 503
Fig. 6. Typical stress-strain curves for human skull bone in com- pression.
the compressive failure stress and modulus (radial) over the surface of the skull. This method of display contains much more detail but lacks the graphical impact of the computer plots. Fine grid maps of this type were ex- amined in detail in an attempt to locate regions of weakness. It was observed that in general areas away from the sutures showed a much thicker diploe with a corresponding reduced
radial compressive modulus and ultimate strength. However, the energy absorption capacity in these areas was higher. The problem of regions of weakness is therefore a complex and poorly defined one, requiring much more work for its solution.
Correlations with density Regression analyses were performed to
c /’
At Classical
I’ ,’
Progressive
0 25 50 75 10 125 175 2@0 225
Fig. 7. Types of stress-strain curves for human skull bone in radial compression.
504 J. H. McELHANEY er al.
TEllSlOll OUTER MLE
I
ii
1 I 8 1 2 3 sdl” UC5 6 1 8 8
Fig. 8. Typical stress-strain curves for human skull bone.
correlate those properties that were anti- ER = (2.02 X 10¹²y5.13) psi; C, = O-86 cipated to be functionally related. The follow- ing relationships were found for human cranial cr = (2.9 x IO+ ER) psi; C, = O-78 bone using data from those tests that pro- duced classical stress-strain curves. u = 1.2 x 10⁸y3.3; c, = 0.91.
Radial compression Tangential compression
ER = (36y- 1.3) psi X 106; C, = 0.62 Et = (46~ - l-52) psi X 106; C, = O-65
CDPWIAL SWMRE
SaCI~IIIL tumt
Fig. 9. Computer drawn presentation of diploe layer thickness.
MECHANICAL PROPERTIES OF CRANIAL BONE 505
SAC#lfAl SITRPC
Fig. IO. Computer drawn presentation of compressive modulus of elasticity.
u = (7707 - 26) psi X 103; C, = O-65
CT = 2.4 X 10e2 Et psi; C, = 0.57
where: ER is the modulus of elasticity loaded in the radial direction (psi)
Et is the modulus of.elasticity loaded in the tangential direction (psi)
u is the ultimate compressive strength (psi)
y is the dry weight density (lb/in3) C, is the correlation coefficient.
The values of the correlation coefficients indicate that a significant part of the varia- tion in the modulus and strength may be attributed to variations in the density. The relation between density and modulus and density and strength was non-linear as evi- denced by the higher values of the correla- tion coefficients or the logarithmic regression analysis compared with the linear regression analysis.
The relation between the stress and modulus was approximately linear however and in- dicated that the maximum strain may be taken as a constant value independent of porosity. This provided a basis for a maximum
strain theory of failure for skull bone with failure strains of 2.9 X lo+? for radial com- pression and 2.4 X 10e2 for tangential com- pression indicated by the regression analysis. It should be recognized, however, that these regression analyses were performed only on the data from the classical stress-strain curves, and those specimens that failed progressively or by buckling had much higher maximum strain values. The regression equations given are approximately valid for dry weight den- sities between O-061 and O-042 #/in” and should not be extrapolated beyond this range.
Porous block model A physical - mathematical model has been
developed that allows the prediction of the modulus and strength of bone based on its density and internal geometry (Alem, 1969). The accuracy of this prediction is limited by the natural variation of the properties of com- pact bone, the base material of the model. The advantage of such a model is that it allows the description, in a relatively compact form, of the physical properties of all types of bone, ranging from the dense bone of the femoral shaft to the very porous bone of the vertebral body (Currey, 1964; Stech, 1966). A model of
506 J. H. McELHANEY et al.
ts
14.
13
%
Q 12,
a tl ii ,,. !z ii
to -
9-
0.
1 ‘4.5
I -4.7
I 6. [
I 6. C
I 5.7(
1 n
24
Fig. 11. Compressive failure stress.
this type may provide some insight into failure patterns and hopefully into treatment of mul- tiple myeloma, osteoporosis and other dis- eases affecting the density of bone.
The primary assumption upon which this model is based is that all bone has the same physical properties in the small. That is, differ- ent types of bone have the same microscopic properties but varying microscopic structure.
In dealing with the varying structure, it is further assumed that local mechanical re- sponses like the modulus of elasticity and ultimate strength are proportional to the local density raised to some power(n).
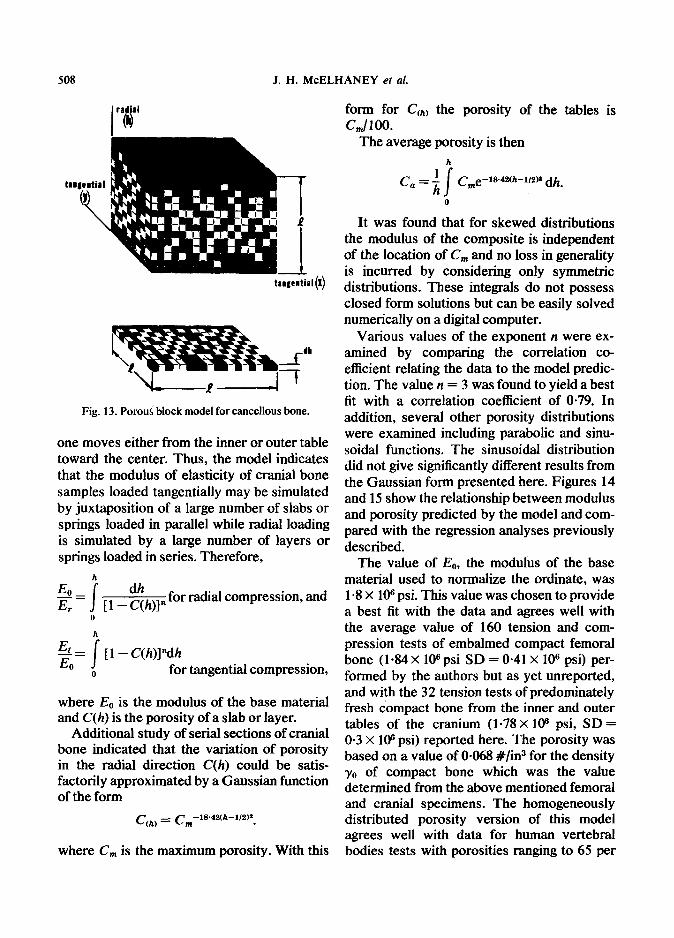
Consider the porous block model shown in Fig. 13 which consists of a number of small cubical aggregates arranged to form a larger porous cube. In this model it is assumed that
MECHANICAL PROPERTIES OF CRANIAL BONE 507
Fig. 12. Compressive modulus of elasticity.
the absence of one or more of the cubical aggregates from the large block does not alter either the position or the behavior of the neighboring aggregates. The ratio of the void volume to the total volume is called the porosity C,
thus C= 1 -rho
where y is the density of the sample and ‘y. is the density of the base material.
A study of serial sections of cranial bone samples, conducted as part of the research program, has shown that the voids or marrow spaces are approximately homogeneously distributed in directions tangent to the inner and outer tables but in the radial direction there is a continuous increase in porosity as
508 J. H. McELHANEY et al.
ra ial
lb
taa
tangcatial(X)
Fig. 13. Poroui block model for cancellous bone.
one moves either from the inner or outer table toward the center. Thus, the model indicates that the modulus of elasticity of cranial bone samples loaded tangentially may be simulated by juxtaposition of a large number of slabs or springs loaded in parallel while radial loading is simulated by a large number of layers or springs loaded in series. Therefore,
h
E 2?= E, I
for radial compression, and 0
h
$= j- [l- C(h)]“dh 0
0 for tangential compression,
where E, is the modulus of the base material and C(h) is the porosity of a slab or layer.
Additional study of serial sections of cranial bone indicated that the variation of porosity in the radial direction C(h) could be satis- factorily approximated by a Gaussian function of the form
C,,, = Cm-1842'h-"2".
where C, is the maximum porosity. With this
form for Cch) the porosity of the tables is c JlOO.
The average porosity is then h
Cme-1842th-li2Pdh
0
It was found that for skewed distributions the modulus of the composite is independent of the location of C, and no loss in generality is incurred by considering only symmetric distributions. These integrals do not possess closed form solutions but can be easily solved numerically on a digital computer.
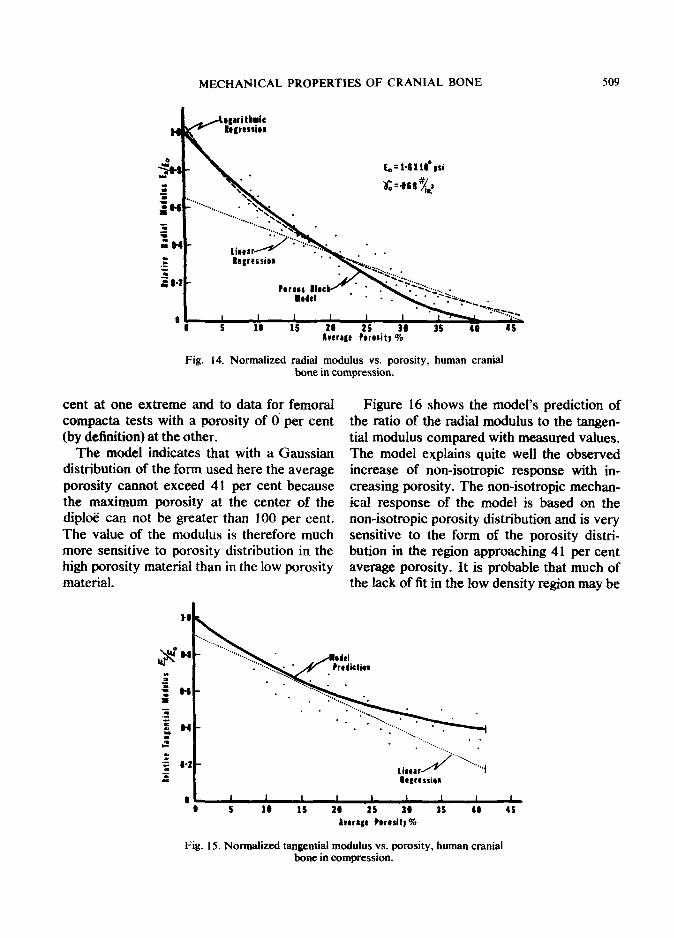
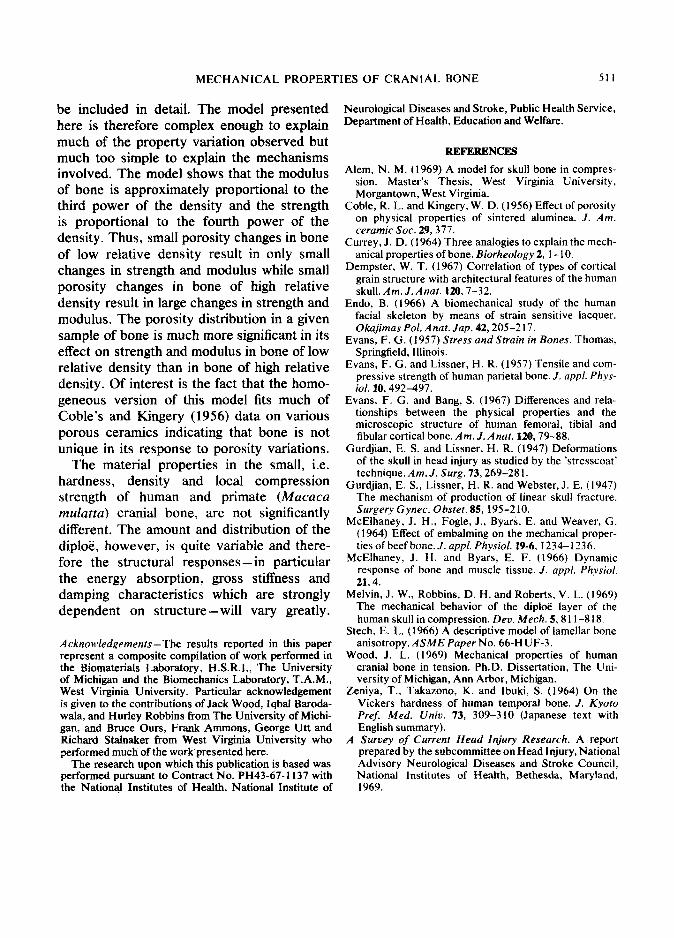
Various values of the exponent n were ex- amined by comparing the correlation co- efficient relating the data to the model predic- tion. The value n = 3 was found to yield a best fit with a correlation coefficient of O-79. In addition, several other porosity distributions were examined including parabolic and sinu- soidal functions. The sinusoidal distribution did not give significantly different results from the Gaussian form presented here. Figures 14 and 15 show the relationship between modulus and porosity predicted by the model and com- pared with the regression analyses previously described.
The value of E,, the modulus of the base material used to normalize the ordinate, was 1.8 X lo6 psi. This value was chosen to provide a best fit with the data and agrees well with the average value of 160 tension and com- pression tests of embalmed compact femoral bone (1.84 X lo6 psi SD = O-41 X 10” psi) per- formed by the authors but as yet unreported, and with the 32 tension tests of predominately fresh compact bone from the inner and outer tables of the cranium (1-78X 106 psi, SD = O-3 x 10⁶ psi) reported here. The porosity was based on a value of 0.068 #/in3 for the density y. of compact bone which was the value determined from the above mentioned femoral and cranial specimens. The homogeneously distributed porosity version of this model agrees well with data for human vertebral bodies tests with porosities ranging to 65 per
MECHANICAL PROPERTIES OF CRANIAL BONE 509
Fig. 14. Normalized radial modulus vs. porosity, human cranial bone in compression.
cent at one extreme and to data for femoral compacta tests with a porosity of 0 per cent (by definition) at the other.
The model indicates that with a Gaussian distribution of the form used here the average porosity cannot exceed 41 per cent because the maximum porosity at the center of the diplok! can not be greater than 100 per cent. The value of the modulus is therefore much more sensitive to porosity distribution in the high porosity material than in the low porosity material.
Figure 16 shows the model’s prediction of the ratio of the radial modulus to the tangen- tial modulus compared with measured values. The model explains quite well the observed increase of non-isotropic response with in- creasing porosity. The non-isotropic mechan- ical response of the model is based on the non-isotropic porosity distribution and is very sensitive to the form of the porosity distri- bution in the region approaching 41 per cent average porosity. It is probable that much of the lack of fit in the low density region may be
Fig. 15. Normalized tangential modulus vs. porosity, human cranial bone in compression.

510 J. H. McELHANEY et al.
Fig. 16. Ratio of radial to tangential moduli vs. porosity.
explained by the difference between the actual porosity distribution in the sample and the assumed Gaussian distribution.
Figure 17 shows the response of the porous block model developed from the strength data. The ultimate strength of the base material was taken as 21,000 psi to obtain a best fit. This corresponds approximately to the long bone data, Evans (1957) and our own base- line experiments on compact femoral bone in compression (19,400 psi, SD = 6800 psi). In this figure the effect of porosity distribution
is shown by comparing the Gaussian model prediction with the homogeneous model pre- diction. The value of the exponent used to obtain these model responses was 4 and the correlation coefficient comparing the model and the data was 0.67. In the low porosity range the Gaussian distribution yielded a satisfactory fit while in the high porosity range the homogeneous model gave better results.
DISCUSSION
Many of the mechanical responses of cranial bone are strongly influenced by the structural arrangement of the dipl& (Endo, 1966, Gurd- jian et al., 1947). Thus in these tests proper- ties such as compressive strength and modulus are structural properties and the large values of the standard deviations observed for these properties are primarily due to variations in the porosity and internal arrangement of the traebeculae. The microhardness tests and the tension test of the inner and outer tables in- dicate that a single material porous block model is justified as a first approximation in describing the relationship between structure and mechanical response. Relating the value of a property to the density raised to some power n and then determining n empirically provides a means of incorporating in the model many of the structural elements that influence the response but are too complex to
1) 15 30 25 30 35 4. 45 lrerrgr Pwrsit! %
Fig. 17. Strength vs. porosity, human cranial bone in compression.
MECHANICAL PROPERTIES OF CRANIAL BONE 511
be included in detail. The model presented Neurological Diseases and Stroke, Public Health Service,
here is therefore complex enough to explain Department of Health, Education and Welfare.
much of the property variation observed but much too simple to explain the mechanisms REFERENCES
involved. The model shows that the modulus Alem, N. M. (1969) A model for skull bone in compres-
of bone is approximately proportional to the sion. Master’s Thesis, West Virginia University, Morgantown, West Virginia.
third power of the density and the strength Coble, R. L. and Kingery, W. D. (1956) Effect of porosity is proportional to the fourth power of the on physical properties of sintered aluminea. J. Am.
density. Thus, small porosity changes in bone ceramic Sot. 29,377. Currey, J. D. (I 964) Three analogies to explain the mech-
of low relative density result in only small anical properties of bone. Biorheology 2. 1- 10. changes in strength and modulus while small Dempster, W. T. (1967) Correlation of types of cortical
porosity changes in bone of high relative grain structure with architectural features of the human skull. Am. J. Anat. lZO, l-32.
density result in large changes in strength and Endo, B. (1966) A biomechanical study of the human modulus. The porosity distribution in a given facial skeleton by means of strain sensitive lacquer.
sample of bone is much more significant in its Okajimas Pol. A nat. Jap. 42,205-2 17. Evans, F. G. (I 957) Stress and Strain in Bones. Thomas,
effect on strength and modulus in bone of low Springfield, Illinois. relative density than in bone of high relative Evans, F. G. and Lissner, H. R. (1957) Tensile and com-
density. Of interest is the fact that the homo- pressive strength of human parietal bone. /. appl. Phys- iol. l&492-497.
geneous version of this model fits much of Evans, F. G. and Bang, S. (1967) Differences and rela- Coble’s and Kingery (1956) data on various tionships between the physical properties and the
porous ceramics indicating that bone is not microscopic structure of human femoral, tibia1 and fibular cortical bone. Am. J. Anat. lu), 79-88.
unique in its response to porosity variations. Gurdjian, E. S. and Lissner, H. R. (1947) Deformations The material properties in the small, i.e. of the skull in head injury as studied by the ‘stresscoat’
hardness, density and local compression technique. Am. J. Surg. 73,269-28 1.
Gurdjian, E. S., Lissner, H. R. and Webster, J. E. (1947) strength of human and primate (Macaca The mechanism of production of linear skull fracture. mufatta) cranial bone, are not significantly Surgery Gynec. Obstet. 85, 195-210.
different. The amount and distribution of the McElhaney, J. H., Fogle, J., Byars, E. and Weaver, G.
(1964) Effect of embalming on the mechanical proper- diploe, however, is quite variable and there- ties of beef bone. 1. appl. Physiot. 19-6, l234- 1236.
fore the structural responses-in particular McElhaney, J. H. and Byars, E. F. (1966) Dynamic
the energy absorption, gross stiffness and response of bone and muscle tissue. J. appl. Physiol. 21.4.
damping characteristics which are strongly Melvin, J. W., Robbins, D. H. and Roberts, V. L. (1969) dependent on structure-will vary greatly. The mechanical behavior of the diplof layer of the
human skull in compression. Dee. Mech. 5,s 1 l-8 18. Stech, E. L. (1966) A descriptive model of lamellar bone
Acknon~ledgements-The results reported in this paper anisotronv. ASME Pager No. 66-HUF-3. represent a composite compilation of work performed in Wood, J. ’ L. (1969) Mechanical properties of human the Biomaterials Laboratory, H.S.R.I., The University cranial bone in tension. Ph.D. Dissertation, The Uni- of Michigan and the Biomechanics Laboratory, T.A.M., versity of Michigan, Ann Arbor, Michigan. West Virginia University. Particular acknowledgement Zeniya, T., Takazono, K. and Ibuki, S. (1964) On the is given to the contributions of Jack Wood, Iqbal Baroda- Vickers hardness of human temporal bone. J. Kyoto wala, and Hurley Robbins from The University of Michi- Pref. Med. Univ. 73, 309-310 (Japanese text with gan, and Bruce~Ours, Frank Ammons, George Utt and English summary). Richard Stahraker from West Virginia Universitv who performed much of the work presented here. _
A Survey of Current Head injury Research. A report prepared by the subcommittee on Head Injury, National
The research upon which this publication is based was Advisory Neurological Diseases and Stroke Council, performed pursuant to Contract No. PH43-67-1137 with National Institutes of Health, Bethesda, Maryland, the National Institutes of Health, National Institute of 1969.