mechanics of the taper integrated screwed-in (tis
TRANSCRIPT

1
MECHANICS OF THE TAPER INTEGRATED SCREWED-IN (TIS)
ABUTMENTS USED DENTAL IMPLANTS
by
Dinçer Bozkaya, Sinan Müftü1, Ph.D.
Graduate Student Associate Professor
Northeastern UniversityDepartment of Mechanical Engineering
Boston MA 02115
October 2003
1Corresponding author: Northeastern University Department of Mechanical Engineering, 334 SN
Boston, MA 02115 Tel: 617-373-4743, Fax: 617-373-2921 Email: [email protected]
2
ABSTRACT
The tapered implant-abutment interface is becoming more popular due to the
mechanical reliability of retention it provides. Consequently, understanding the
mechanical properties of the tapered interface with or without a screw at the bottom has
been the subject of a considerable amount of studies involving experiments and finite
element (FE) analysis. This paper focuses on the tapered implant-abutment interface with
a screw integrated at the bottom of the abutment. The tightening and loosening torques
are the main factors in determining the reliability and the stability of the attachment.
Analytical formulas are developed to predict tightening and loosening torque values by
combining the equations related to the tapered interface with screw mechanics equations.
This enables the identification of the effects of the parameters such as friction, geometric
properties of the screw, the taper angle, and the elastic properties of the materials on the
mechanics of the system. In particular, a relation between the tightening torque and the
screw pretension is identified. It was shown that the loosening torque is smaller than the
tightening torque for typical values of the parameters. Most of the tightening load is
carried by the tapered section of the abutment, and in certain combinations of the
parameters the pretension in the screw may become zero. The analytical method
developed here was applied to a 4.8 mm ITI implant-abutment system. The calculations
performed to determine the loosening torque as a percentage of tightening torque resulted
in the range 85-137%, depending on the values of taper angle and the friction coefficient.
Keywords: Dental implants; Taper lock; Morse taper; Conical interference fit; Tapered
interference fit; Connection mechanism; Loosening torque, Tightening torque

3
INTRODUCTION
The reliability and the stability of an implant-abutment connection mechanism is
an essential prerequisite for long-term success of dental implants.1 High rate of screw
complications such as screw loosening has been encountered with the screw-type
implant-abutment connection mechanism.2,3 Inadequate preload, the misfit of the mating
components and rotational characteristics of the screws were considered to be the reasons
leading to screw loosening or fracture.3 Tapered implant-abutment attachment with or
without screw presents an alternative method to the screw type attachment system. In this
paper, the term taper integrated screwed-in (TIS) abutment is used to indicate an
abutment which uses simultaneously a screw and a tapered fit, whereas an abutment
which uses only the tapered interference fit as the connection means is called a tapered
interference fit (TIF) abutment. Four commercial implant systems are shown in Fig 1.
The design by Nobel Biocare (Nobel Biocare AB, Göteborg, Sweden) uses a screw, the
designs by Ankylos (Degussa Dental, Hanau-Wolfgang, Germany) and ITI (Institut
Straumann AG, Waldenburg, Switzerland) use TIS type abutments; and the design by
Bicon (Bicon Inc., Boston, MA, USA) uses the TIF type abutment.
The main advantage of the TIS abutment is reducing screw-loosening incidents,
attributed to the increased interfacial strength between implant and abutment. A high
incidence of screw loosening, up to 40%, was found for systems using screw-only
implant-abutment connection, whereas the failure rate for tapered interface implants was
lower, as much as 3.6% to 5.3%.4 A retrospective study with 80 implants showed that
using the TIS connection provides a very low incidence of failure.5 The lack of
retrievability could be considered as the disadvantage of the system.6 Clinical studies
4
showing the success of the TIS type implant-abutment interface encouraged the
researchers and implant companies to focus on understanding and evaluating the
mechanical properties of the tapered interface.
An experimental study by Norton7 investigated the variation of the loosening
torque as a percentage of tightening torque with respect to different parameters such as
tightening torque (40-500 N.mm), taper angle (8o and 11o), interfacial surface area (15.3
and 27.9 mm2), existence of saliva contamination and time delay to loosening (10 and 60
minutes). Strong correlation was found between loosening torque as the percentage of
tightening torque. The taper angle, saliva contamination and time delay to loosening did
not have a significant effect on the loosening torque, whereas the interfacial surface area
seemed to have a profound effect on the efficiency of the connection. The efficiency is
defined as the ratio of the loosening torque to the tightening torque. At clinically relevant
torque levels (300-400 N.mm), the loosening torque was 84%-91% of the tightening
torque. This finding was in contrast to the experimental work done by Sutter et al.8, who
showed the loosening torque to be 10-15% higher than the tightening torque. It was also
shown that dynamic loading resulted in 50% reduction of the loosening torque; however,
no decrease occurred in cone-screw connection after 1 million cycles.8 The 8o taper angle
with 2 mm diameter screw at the bottom was selected to be the optimum design that
provides a secure assembly between implant and abutment. Squier et al.6 investigated the
effects of anodization and reduction of surface area on the tightening and loosening
torque. A 31% reduction of surface area did not cause a significant change in the
loosening torque however the surface coating caused a 20% decrease in the loosening

5
torque. In their study, for 350 N.mm tightening torque, the loosening torque was in the
range of 79-106% of the tightening torque.
The strength of the tapered interface in a TIS abutment was assessed by
experimental and finite element methods. The tapered interface was found to be favorable
in terms of resistance to bending forces.9 The stresses induced by off-axis loads were
compared for tapered and butt-joint connection. It was concluded that the tapered
interface distributed the stresses more evenly when compared to the butt joint
connection.4 In an in-vitro comparative study of two commercially available implant
systems, the conical implant-abutment connection, added to the system, increased the
resistance of the implants subjected to considerable amount of forces and bending
moments.9 Also, the conical interface allowed a larger maximum tightening torque. The
maximum tightening torque was 4000 N.mm for the TIS abutment, which was
considerably greater than the 1250 N.mm of the screw-only connection.8
Bacterial leakage through implant-abutment interface is another significant factor
affecting the long-term stability of the implant.11 Although the tapered interface is
considered to be acting as a seal against bacterial leakage and colonization, it cannot
completely prevent leakage due to the gap caused by the misfit between the components.
The rate of bacterial leakage diminishes as the degree of misfit decreases and the
tightening torque of the screw increases. 10,11
The mechanics of the purely TIF type implants was first explained by
O’Callaghan et al.13 and then by Bozkaya and Müftü.14,15 Approximate analytical
solutions for the contact pressure, the pull-out force and loosening torque acting in a
tapered interference were developed by modeling the tapered interference as a series of

6
cylindrical interferences with variable radii. These formulas were verified by non-linear
finite element analyses for different design parameters.14
In this paper, approximate closed-form formulas are developed for estimating the
tightening and loosening torque magnitudes for the TIS type abutment connections. The
closed form equations for the tapered interference fit14 are combined with screw
mechanics equations to determine the loosening and tightening torque as a function of
various design parameters. The efficiency of the system, defined as the ratio of the
loosening torque to the tightening torque, is investigated.
MATERIALS AND METHODS
A taper integrated screwed-in (TIS) abutment is placed into the implant by
applying a tightening torque TT. The tightening process causes interference in the tapered
part and also advances the screw where the threads of the abutment and implant engage
with a positive force. This results in a tensile load in the screw known as the preload.
The geometric parameters that affect the mechanics of the connection are defined
in Figure 2 where the implant is depicted as a cylinder. The balance of forces and torques
acting on this system during tightening are evaluated using the free body diagrams given
in Figure 3 and Figure 4. During tightening, the screw preload rTF will be related to the
resultant normal force N, acting on the tapered section due to the interference fit. Thus by
using, the well known, power screw relations16 and the tapered interference fit equations
given by Bozkaya and Müftü14 it is possible to develop closed form relations for the
tightening and loosening of TIS type abutments.

7
The resultant normal force N due to interference fit in the tapered section of the
abutment, shown in Figure 3a, is given as14,
( ) ( )2 222
2
sin23 sin 3 sin
6c
ab c ab c
E z LN b r L r L
bπ θ
θ θ∆ = − − + (1)
where Lc is the contact length, b2 is the outer radius of the implant, rab is the bottom
radius of the abutment, θ is the taper angle as shown in Figure 2, ∆z is the axial
displacement of the abutment during tightening, and, E is the elastic modulus of implant
and abutment, assumed to be made of the same material.
The Screw Preload
When a TIS type abutment is screwed into the implant, a tensile preload,
develops in the screw and a resisting force rTF along the main axis of the abutment
develops in the tapered part. This resisting force and the screw preload are equal in
magnitude. The resisting force rTF has contributions due to friction force µN and the
normal force N, and it can be found from the free body diagram in Figure 3a. Note that
the friction force develops along a helical path, as shown Figure 3d, whose helix angle is
equal to the lead angle λ (= tan ma l dπ ) of the screw.
Once the tightening torque is released, the frictional component of the preload
diminishes, and the screw preload during patient use, rF , is determined from the free
body diagram given in Figure 3b. During loosening, the friction force acts in the opposite
direction as compared to the tightening. The screw preload during loosening can be
determined from the Figure 3c.

8
Tightening Torque
The total tightening torque TT required to screw-in the TIS abutment should
overcome the resistive torque values sTT and c
TT due to friction in the screw threads and
the conical (tapered) interface, respectively (Figure 4),
s cT T TT T T= + . (2)
The resistive torque sTT in the screw threads can be calculated by the power screw
formula16 for raising a load rTF ,
sec2 sec
rs T m k m
Tm
F d l dT
d lπµ α
π α +
= − (3)
where dm is the mean diameter of the screw, kµ is the kinetic friction coefficient, α is the
thread angle and l is the lead of the screw. Note that vertical resisting load rTF is used in
this equation, as it is equal to the screw preload as mentioned above. The vertical
component of the resisting force rTF in the tapered section, during tightening is
determined from Figure 4a as,
sin sin cosrT kF N Nθ µ λ θ= + (4)
where the kinetic friction coefficient µk is used, as screw tightening is a dynamic process.
In order to find an expression for the resistive torque cTT in the conical section of
the abutment, the friction forces on the tapered section are considered. The horizontal
component of the friction force, cosNµ λ , in the conical interface, shown in Figure 3d,
resists the tightening torque. The torque required to overcome this friction force is found
as follows14,

9
( ) ( )( )( ){ }
cos 210
2 2 2 22 22
2
2 cos
sin2 cossin 2 3 sin 4 sin 4
8( ) ( )
cLcT k c
k cc ab c ab c ab ab
T b z P z dz
E zLL b r L r L r b r
b
θπµ λ
πµ θ λθ θ θ
=
∆ = − − + + −
∫
(5)
where Pc is the contact pressure whose magnitude varies in the z-direction as described
by Bozkaya and Müftü14. An equation for the total tightening torque TT is obtained by
combining equations (1)-(5),
( ){ }2 2 2 22 22
2
sec2 sec
sin2 cossin 2 3 sin 4 sin 4
8
rm T k m
Tm k
k cc ab c ab c ab ab
d F d lT
d l
E zLL b r L r L r b r
b
πµ απ µ α
πµ θ λθ θ θ
+= + −
∆ − − + + − ( ) ( )
(6)where the axial component of resistive force (preload) during tightening r
TF is given by
equation (4).
Loosening Torque
An expression for the total loosening torque LT , which equals the sum of the
resistive torque values in the screw threads sLT and in the cone c
LT due to friction, can be
found by a similar approach. The total loosening torque is,
s cL L LT T T= + . (7)
The resistive torque sLT in the screw threads is calculated from the power screw
formulas. The free body diagram given in Figure 3c shows that the preload at the onset of
loosening rLF is expressed as,
sin sin cosrL sF N Nθ µ λ θ= − (8)
10
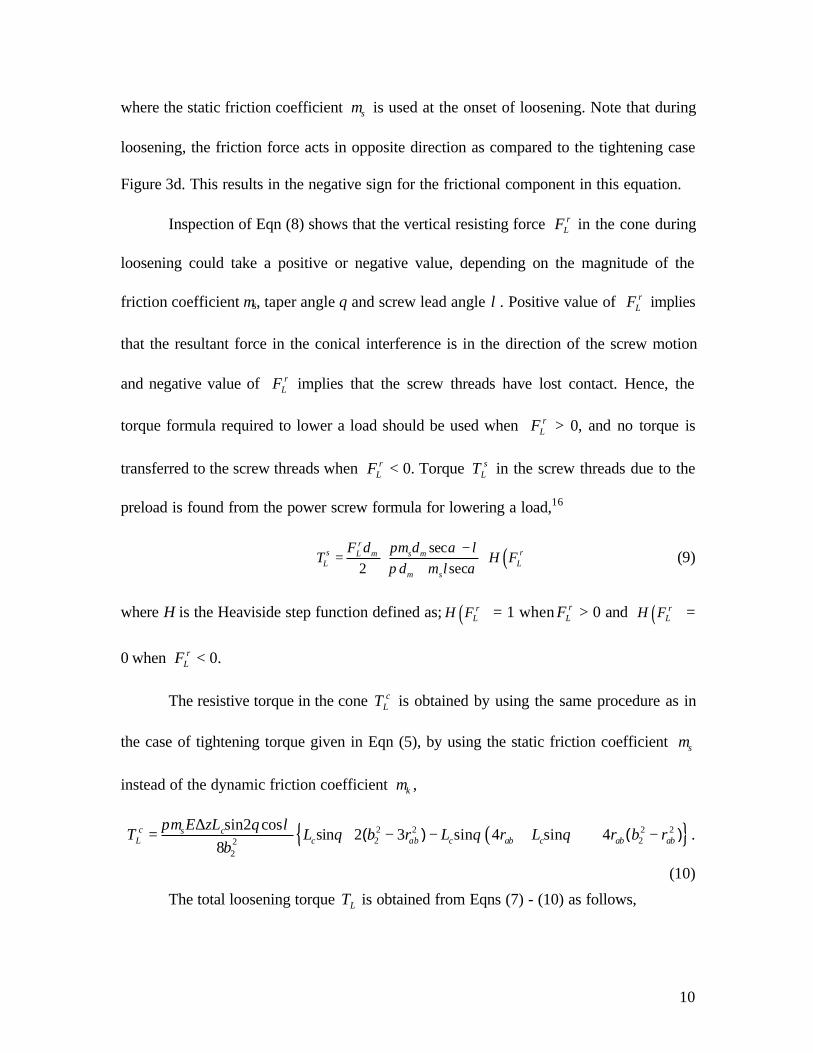
where the static friction coefficient sµ is used at the onset of loosening. Note that during
loosening, the friction force acts in opposite direction as compared to the tightening case
Figure 3d. This results in the negative sign for the frictional component in this equation.
Inspection of Eqn (8) shows that the vertical resisting force rLF in the cone during
loosening could take a positive or negative value, depending on the magnitude of the
friction coefficient µs, taper angle θ and screw lead angle λ. Positive value of rLF implies
that the resultant force in the conical interference is in the direction of the screw motion
and negative value of rLF implies that the screw threads have lost contact. Hence, the
torque formula required to lower a load should be used when rLF > 0, and no torque is
transferred to the screw threads when rLF < 0. Torque s
LT in the screw threads due to the
preload is found from the power screw formula for lowering a load,16
( )sec2 sec
rs rL m s m
L Lm s
F d d lT H F
d lπµ απ µ α
−= +
(9)
where H is the Heaviside step function defined as; ( )rLH F = 1 when r
LF > 0 and ( )rLH F =
0 when rLF < 0.
The resistive torque in the cone cLT is obtained by using the same procedure as in
the case of tightening torque given in Eqn (5), by using the static friction coefficient sµ
instead of the dynamic friction coefficient kµ ,
( ){ }2 2 2 22 22
2
sin2 cossin 2 3 sin 4 sin 4
8( ) ( )c s c
L c ab c ab c ab abE zL
T L b r L r L r b rb
πµ θ λθ θ θ
∆ = − − + + − .
(10)
The total loosening torque LT is obtained from Eqns (7) - (10) as follows,

11
( )
( ){ }2 2 2 22 22
2
sec2 sec
sin2 cossin 2 3 sin 4 sin 4
8
rrm L s m
L Lm s
s cc ab c ab c ab ab
d F d lT H F
d l
E zLL b r L r L r b r
b
πµ απ µ α
πµ θ λθ θ θ
−= + +
∆ − − + + − ( ) ( )
(11)
where the axial component of resistive force during loosening rLF is given by equation
(8). The efficiency of TIS connection is defined as the ratio of the tightening torque to the
loosening torque,
Ts
L
TT
η = . (12)
RESULTS
The parameters, given in Table 1, chosen for the case study are similar to a 4.8
mm diameter ITI implant. The properties of the screw in this implant are as follows;
mean screw diameter dm = 0.875 mm; screw pitch l = 0.44 mm; screw lead angle ? =
9.11o; and, the screw thread angle, α = 30o.
The Efficiency of the Attachment
The efficiency of the system, as defined by Eqn. (12) is plotted as a function of
the static µs and kinetic µk friction coefficients and the taper angle θ in Figure 5.
Predictions presented in Figure 5a show that the efficiency of the system has a stronger
dependence on the kinetic friction coefficient than the static friction coefficient. For
example, when static and kinetic friction coefficients are equal, and vary in the 0.1 - 0.9
range, the efficiency varies between 0.87 - 0.92; however, when kinetic friction
coefficient is 70% of the static friction coefficient, the efficiency varies between 1.22 -
1.32. According to equation (6) the kinetic friction coefficient only affects the tightening
12
torque. Therefore, high efficiency is obtained if the kinetic friction coefficient during
tightening is smaller than the static friction coefficient. Maximum efficiency is obtained
when µ is between 0.3 and 0.4. Figure 5a also shows the results of the experimental
studies by Norton7, Squier et al.6 and Sutter et al.8 The comparison shows that the results
predicted by equation (12) and the experiments agree favorably.
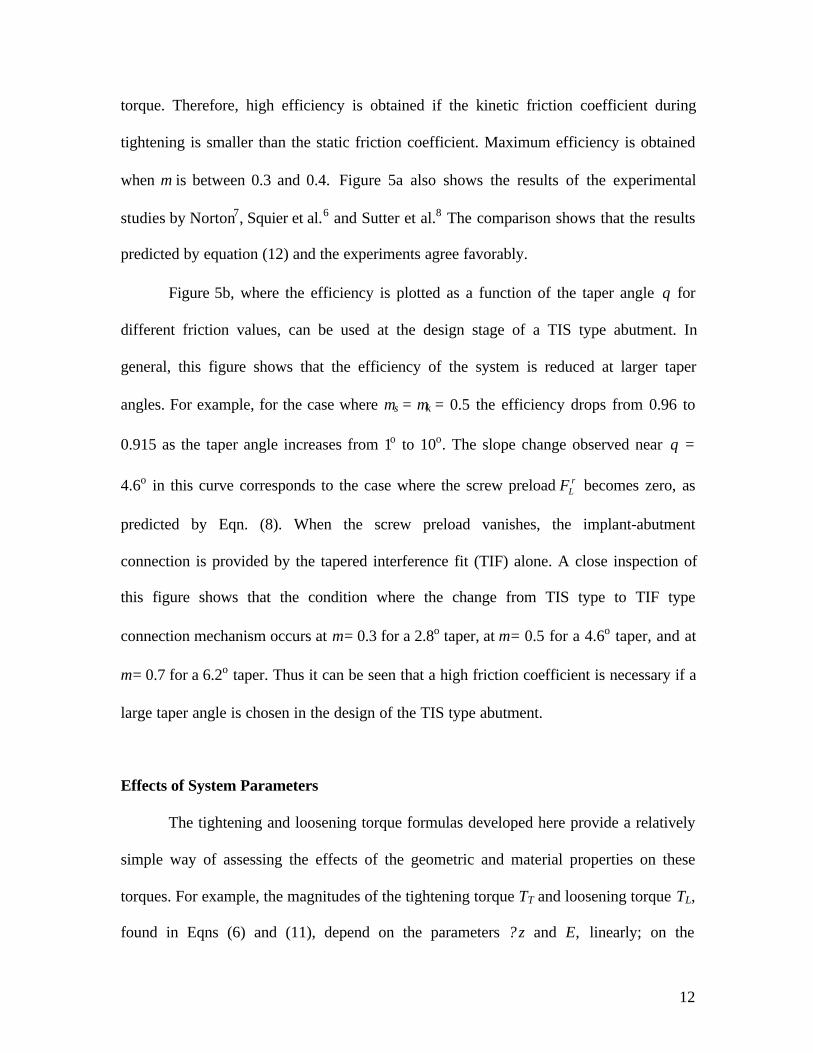
Figure 5b, where the efficiency is plotted as a function of the taper angle θ for
different friction values, can be used at the design stage of a TIS type abutment. In
general, this figure shows that the efficiency of the system is reduced at larger taper
angles. For example, for the case where µs = µk = 0.5 the efficiency drops from 0.96 to
0.915 as the taper angle increases from 1o to 10o. The slope change observed near θ =
4.6o in this curve corresponds to the case where the screw preload rLF becomes zero, as
predicted by Eqn. (8). When the screw preload vanishes, the implant-abutment
connection is provided by the tapered interference fit (TIF) alone. A close inspection of
this figure shows that the condition where the change from TIS type to TIF type
connection mechanism occurs at µ = 0.3 for a 2.8o taper, at µ = 0.5 for a 4.6o taper, and at
µ = 0.7 for a 6.2o taper. Thus it can be seen that a high friction coefficient is necessary if a
large taper angle is chosen in the design of the TIS type abutment.
Effects of System Parameters
The tightening and loosening torque formulas developed here provide a relatively
simple way of assessing the effects of the geometric and material properties on these
torques. For example, the magnitudes of the tightening torque TT and loosening torque TL,
found in Eqns (6) and (11), depend on the parameters ?z and E, linearly; on the

13
parameters b2, rab parabolically; on the parameter Lc in a cubic manner; on the parameters
? and λ trigonometrically; and on the parameters µk, µs in a non-linear manner. The details
of these functional dependences are given next in Figure 6.
Figure 6a shows the effect of different taper angles on the tightening torque TT
and the loosening torque TL for µk = µs = 0.3, 0.5 and 0.7. This figure indicates that the
tightening torque is always greater than the loosening torque when the kinetic and static
friction coefficients are identical. The difference between the tightening and loosening
torque values increases for larger taper angles and at higher friction coefficient values.
Note that the tightening torque values reported in this figure are conservative values, as
the kinetic friction coefficient is taken to be the same as the static friction coefficient.
However, the figure can be used as a guide in the design of the new TIS type abutments.
More detail on the TT values can be easily obtained by using Eqn. (11) for the case when
kinetic friction coefficient is different than the static one.
Figure 6b shows the variation of tightening and loosening torque values with the
contact length of the tapered section of the abutment for three different friction
coefficient values. The tightening torque TT and loosening torque TL depend on Lc
linearly, as depicted in this figure. However, the effect of friction coefficient for a given
torque value is strong. For example, if a clinically relevant tightening torque value of TT
= 400 N.mm is considered, the contact required contact length changes from Lc = 0.35
mm for µs = 0.7 to Lc = 0.85 mm for µs = 0.3.
Figure 6c shows the variation of the tightening and loosening torque values with
the outer radius b2 of the implant. This figure shows that for larger radius implants a
higher torque value is required to tighten the implant. The loosening torque follows the

14
same trend, however its value is predicted to be lower than the tightening torque when the
kinetic and static friction coefficients are equal. Bozkaya and Müftü14 have shown that, in
the tapered section, the contact pressure between the implant and the abutment increases
with increasing implant radius. Thus larger normal and frictional forces develop in the
interface, resulting in increased torque values.
Figure 6d shows the variation of the tightening and loosening torque values as a
function of coefficient of friction, for the case where µs = µk. The torque values required
to tighten and loosen the abutment increase with increasing friction coefficient. The
dependence is nearly linear in the range of friction coefficients (i.e., 0.1 - 0.9) used in this
figure.
A relation between the tightening torque and the loosening torque can be obtained
from equations (6) and (11), by noting that ∆z is common in both relations. This shows
that loosening torque is linearly proportional to the tightening torque as shown in Figure
6e. This finding is in agreement with the experimental data by Norton7 showing a linear
relation between tightening and loosening torque. The slope of the curves, which is equal
to the efficiency, is slightly different which may stem from the difference in kinetic and
static friction values.
Screw Preload vs. Torque
The screw preload as a function of relevant torque values can be obtained from
equations (6) and (11). Various preload conditions have been described in Figure 7; the
preload rTF during tightening, the preload during r
LF loosening, and the preload rF when
no torque or biting forces are applied on the system are plotted as a function of torque for
15
µ = 0.3 and 0.5, in Figure 7. This figure shows that, in general, the screw preload is
linearly proportional to the applied torque. For a given torque value, the highest preload
occurs during tightening; after the release of the tightening torque, the screw is subjected
to preload Fr. This is the "seated" preload of the screw. The preload becomes even lower
during loosening.
Friction has an interesting effect on the preload; for a given torque value, the
preload Fr reduces as the friction coefficient is increased. For example at 350 N.mm the
preload moves from 100 N to 60 N, as the friction coefficient is increased from 0.3 to 0.5.
Note that Merz et al.4 predicted 53 N of preload, by modeling a 12 mm long, 8o taper,
TIS type ITI implant with non-linear finite element analysis.4 The preload value of 60 N,
predicted by the analytical method introduced here, is remarkably close to their value
considering the assumptions made in this paper.
Distribution of Torque
The tapered surface of the TIS type abutment provides a great deal of frictional
resistance as compared to the frictional resistance on the screw threads. This is evidenced
by the plots given in Figure 8, where the percentage of the total tightening torque carried
by the tapered section as a function of friction coefficient µ and taper angle θ are shown.
In Figure 8a, it is seen that, the cone carries 87-92% of the total tightening torque
during tightening, when the static friction coefficient µs is changed between 0.1 and 0.9.
The kinetic friction µk coefficient has a relatively small effect on this percentage. The
effect of the taper angle θ on the taper totalT T ratio during tightening is shown in Figure
8b. This figure shows that in a TIS type abutment with a smaller taper angle more of the

16
total torque is carried by the tapered section, in contrast to larger taper angle. The range
of taper totalT T ratio is between 88 - 96% depending on the value of static friction
coefficient µs.
During loosening, the friction force in the screw threads act in a direction to
reduce the screw preload as evidenced by equation (8). Thus by varying the static friction
coefficient µs or the taper angle θ it is possible to relieve the preload. When this happens
all of the torque in the TIS type abutment is carried by the tapered section, and the
taper totalT T becomes one. The conditions which cause this are identified in Figure 8a and
b. In particular, Figure 8a shows that friction coefficient values less than 0.15 would
cause the loss of preload during loosening for an 8o taper. The effect of taper angle θ on
the loss of preload depends on the value of the static friction coefficient µs as shown in
Figure 8b; increasing friction coefficient values allow use of larger taper angles before
screw preload is lost during loosening. Also low static coefficient of friction in the screw
threads µs may cause the screw torque to be negative, contributing to the loosening of the
attachment. This happens when the static friction coefficient µs is smaller than 0.15
causing the taper totalT T to be larger than one.
DISCUSSION
The general range of efficiency, predicted to be 0.85-1.37, for the range of
parameters considered in this paper, match closely the experimental results.6-8 The only
condition that causes the efficiency to be greater than 1.0 is encountered when the kinetic
coefficient of friction is taken 10% smaller than the static coefficient of friction. The
efficiency becames as low as 0.85 for very low values of the coefficient of friction, such

17
as 0.1. The efficiency also depends on the taper angle; an increase in taper angle from 1o
to 10o results in a decrease in the efficiency, from 0.97 to 0.9, depending on the value of
the friction coefficient.
Other causes for further losses known as ‘embedment relaxation’ which cause 2-
10% reduction in the preload have been reported.2 Issues related to manufacturing
tolerance, surface roughness, and creep of surface asperities that are not captured by the
analytical method presented here.
The behavior of the TIS type of abutment attachment method is governed by the
tapered section of the abutment, as a large fraction of the loosening and tightening torque
values are used to overcome the friction in the tapered section. The analytical method
demonstrated that over 86% of the tightening torque, and over 98% of the loosening
torque are balanced by the frictional forces in the tapered section.
This study clearly shows that friction coefficient strongly affects tightening and
loosening torque values; when friction coefficient is high the tightening torque value
required to secure the abutment may become too high, to be clinically safe; on the other
hand low friction coefficient does not seem to have an obvious adverse effect.
Nevertheless, it is typically difficult to determine the friction coefficient exactly.
Therefore, a margin should be built into the design of the TIS type abutments.
ACKNOWLEDGMENT
The authors would like to thank Mr. Fred Weekley (United Titanium Inc., Wooster, OH,
USA) for his valuable discussion related to this paper and acknowledge the support of
Bicon Implants (Bicon Inc., Boston, MA, USA).
18
REFERENCES
1. Scacchi M., Merz BR, Schär A.R., 2000. The development of the ITI Dental Implant
System. Clin Oral Imp Res 11(Suppl.), 22-32.
2. Geng J., Tan K., Liu G., 2001. Application of finite element analysis in implant
dentistry: A review of the literature. J Prosthet Dent 85, 585-598.
3. Schwarz, M.S. 2000. Mechanical complications of dental implants. Clin Oral Impl
Res 2000; 11(Suppl.), 156-158.
4. Merz B.R., Hunenbart S., Belser U.C., 2000. Mechanics of the implant-abutment
connection: An 8-degree taper compared to a butt joint connection. Int J Oral
Maxillofac Implants, 15, 519-526.
5. Mangano C., Bartolucci E.G., 2001. Single tooth replacement by morse taper
connection implants: A retrospective study of 80 implants. Int J Oral Maxillofac
Implants, 16, 675-680.
6. Squier R.S., Psoter W.J., Taylor T.D., 2002. Removal torques of conical, tapered
implant abutments: The effects of anodization and reduction of surface area. Int J
Oral Maxillofac Implants, 17, 24-27.
7. Norton M.R., 1999. Assessment of cold welding of the internal conical interface of
two commercially available implant systems. J Prosthet Dent, 81, 159-166.
8. Sutter F., Weber H.P., Sorensen J., Belser U., 1993. The new restorative concept of
the ITI Dental Implant System: Design and engineering. Int J Periodont Rest Dent,
13, 409-431.

19
9. Norton M.R., 2000. In vitro evaluation of the strength of the conical implant-to-
abutment joint in two commercially available implant systems. J Prosthet Dent, 83,
567-571.
10. Guimarães P.M., Nishioka R.S., Bottino M.A., 2001. Analysis of implant/abutment
marginal fitting. Pós-Grad Rev Fac Odontal São José dos Campos, 4, 12-19.
11. Jansen V.K., Richter E.J., 1997. Microbial leakage and marginal fit of the implant-
abutment interface. Int J Oral Maxillofac Implants, 12, 527-540.
12. Breeding L.C., Dixon D.L., Nelson E.W., Tietge J.D., 1993. Torque required to
loosen single- tooth implant abutment screws before and after simulated function.
International Journal of Prosthodontics, 6, 435-439.
13. O'Callaghan J., Goddard T., Birichi R., Jagodnik J., Westbrook S., 2002. Abutment
hammering tool for dental implants. American Society of Mechanical Engineers,
IMECE-2002 Proceedings Vol. 2, Nov. 11-16, 2002, Paper No. DE- 25112.
14. Bozkaya D., Müftü S., 2003. Mechanics of the tapered interference fit in dental
implants. J Biomech, 36:11, 1649-1658.
15. Bozkaya D., Müftü S., 2003. Efficiency considerations for the purely tapered
interference fit (TIF) abutments used in dental implants. Journal of Biomechanical
Engineering, submitted for review, 2003.
16. Shigley J.E. and Mischke C.R., 1989. Mechanical Engineering Design, 5th edition,
McGraw Hill, Boston.
20
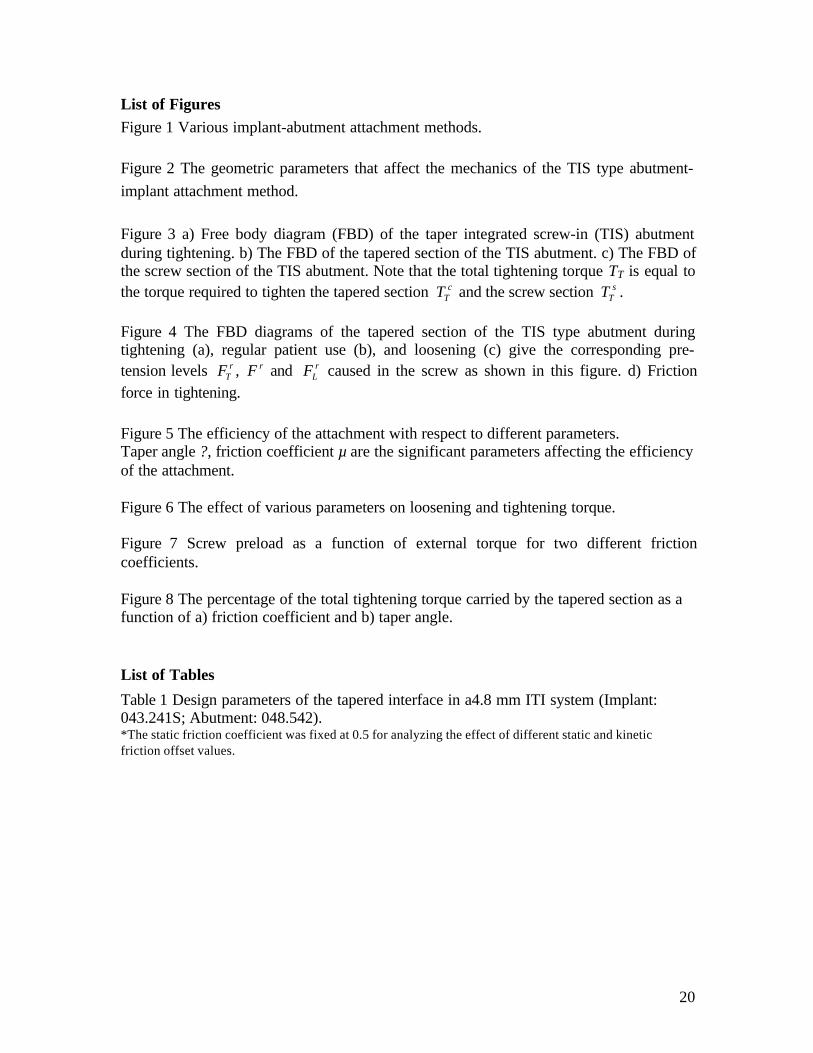
List of FiguresFigure 1 Various implant-abutment attachment methods.
Figure 2 The geometric parameters that affect the mechanics of the TIS type abutment-implant attachment method.
Figure 3 a) Free body diagram (FBD) of the taper integrated screw-in (TIS) abutmentduring tightening. b) The FBD of the tapered section of the TIS abutment. c) The FBD ofthe screw section of the TIS abutment. Note that the total tightening torque TT is equal tothe torque required to tighten the tapered section c
TT and the screw section sTT .
Figure 4 The FBD diagrams of the tapered section of the TIS type abutment duringtightening (a), regular patient use (b), and loosening (c) give the corresponding pre-tension levels r
TF , rF and rLF caused in the screw as shown in this figure. d) Friction
force in tightening.
Figure 5 The efficiency of the attachment with respect to different parameters.Taper angle ?, friction coefficient µ are the significant parameters affecting the efficiencyof the attachment.
Figure 6 The effect of various parameters on loosening and tightening torque.
Figure 7 Screw preload as a function of external torque for two different frictioncoefficients.
Figure 8 The percentage of the total tightening torque carried by the tapered section as afunction of a) friction coefficient and b) taper angle.
List of Tables
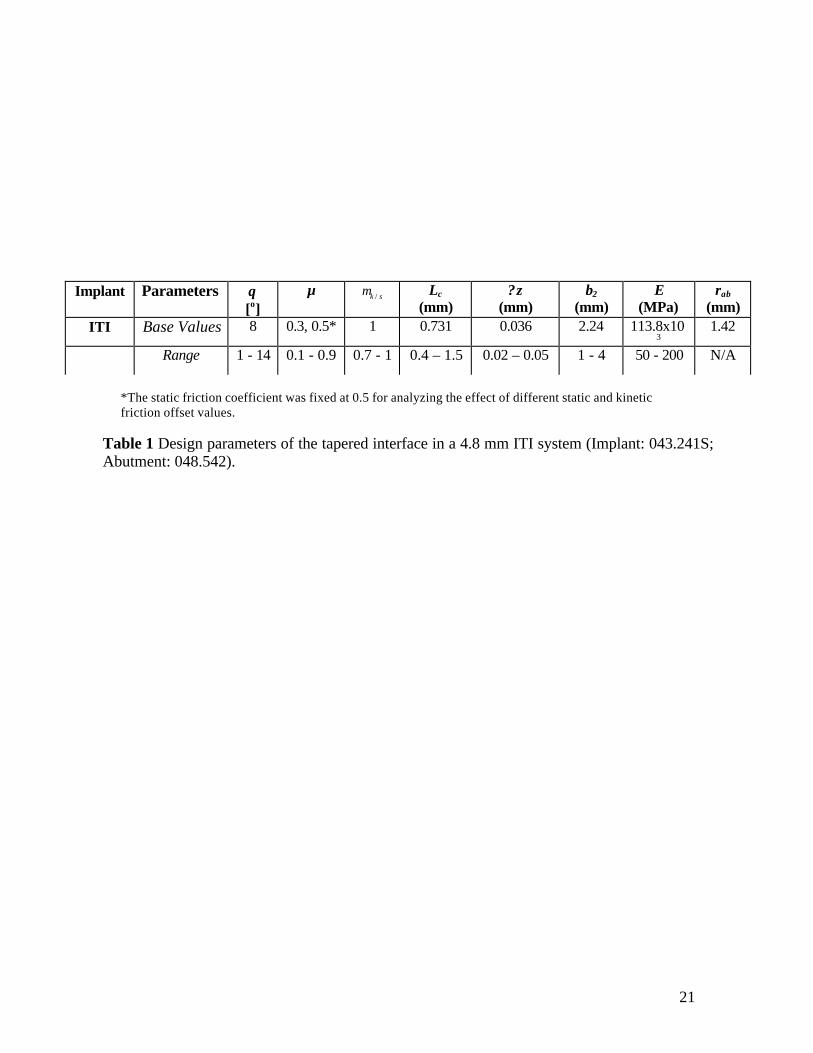
Table 1 Design parameters of the tapered interface in a4.8 mm ITI system (Implant:043.241S; Abutment: 048.542).*The static friction coefficient was fixed at 0.5 for analyzing the effect of different static and kineticfriction offset values.
21
*The static friction coefficient was fixed at 0.5 for analyzing the effect of different static and kineticfriction offset values.
Implant Parameters θ[o]
µ /k sµ Lc
(mm)?z
(mm)b2
(mm)E
(MPa)rab
(mm)ITI Base Values 8 0.3, 0.5* 1 0.731 0.036 2.24 113.8x10
31.42
Range 1 - 14 0.1 - 0.9 0.7 - 1 0.4 – 1.5 0.02 – 0.05 1 - 4 50 - 200 N/A
Table 1 Design parameters of the tapered interface in a 4.8 mm ITI system (Implant: 043.241S;Abutment: 048.542).

22
Ankylos ITI Bicon Nobel Biocare
Figure 1 Various implant-abutment attachment methods

23
θz
b2
rab
Lcδ
rabutment
implant
b1(z)
s
dm
Figure 2

24
θ
cLT
N
rLF
N
rF
θ
cTT
N
µNsinλ
rTF
a) FBD in tightening b) FBD during use
c) FBD in loosening
Figure 3 The FBD diagrams of the tapered section of the TIS type abutment during tightening (a),regular patient use (b), and loosening (c) give the corresponding pre-tension levels r
TF , rF and rLF
caused in the screw as shown in this figure. d) Friction force in tightening.
NµNµNsinλ
λ
θr
µNcosλ
TT
λ
θ
d) Friction force in tightening
µNsinλ

25
λ
rTF
Fn
µFn P
sTT
rTF
θ
TT
dm
θ
cTT
N
µ Nsinλ
rTF
a) b) c)
Figure 4 a) Free body diagram (FBD) of the taper integrated screw-in (TIS) abutment during tightening. b) TheFBD of the tapered section of the TIS abutment. c) The FBD of the screw section of the TIS abutment. Note thatthe total tightening torque TT is equal to the torque required to tighten the tapered section c
TT and the screwsection s
TT .
N
µ Nsinλ

26
Figure 5 The efficiency of the attachment with respect to different parameters.Taper angle ?, friction coefficient µ are the significant parameters affecting the efficiencyof the attachment.
b)Taper Angle, θ
Eff
icie
ncy
,η s
1 2 3 4 5 6 7 8 9 100.85
0.875
0.9
0.925
0.95
0.975
1
µs=µk=0.7
µs=µk=0.5
µs=µk=0.3
Static Coefficient of Friction, µs
Efficiency,η s
0.1 0.2 0.3 0.4 0.5 0.6 0.7 0.8 0.90.85
0.9
0.95
1
1.05
1.1
1.15
1.2
1.25
1.3
1.35
1.4
µk=0.7µs
µk=0.9µs
µk=µs
Norton7
Squier 6
Sutter8
a)
Efficiency, ηs

27
Outer Implant Radius, b2 (mm)
To
rqu
e(N
.mm
)
2 3 40
200
400
600
800
1000
1200
1400
TL
TT
µ = 0.3
µ = 0.5
µ = 0.7
Coefficient of Friction, µ
To
rqu
e(N
.mm
)
0.1 0.2 0.3 0.4 0.5 0.6 0.7 0.8 0.90
100
200
300
400
500
600
700
800
900
1000
1100
TL
Tt
a) b)
c) d)
e)
Figure 6
Taper Angle, θ
To
rqu
e(N
.mm
)
1 2 3 4 5 6 7 8 9 10300
400
500
600
700
800
900
TL
TT
µ = 0.3
µ = 0.5
µ = 0.7
Contact Length, Lc (mm)
To
rqu
e(N
.mm
)
0 0.25 0.5 0.75 1 1.25 1.50
200
400
600
800
1000
1200
1400
1600
1800
TL
TT
µ = 0.3
µ = 0.5
µ = 0.7
Tightening Torque, Tt(N.mm)
Loo
sen
ing
Tor
que,
T L(N
.mm
)
0 100 200 300 400 5000
100
200
300
400
500This workITI Implant 8o taper, (Experimental) Norton8

28
Figure 7 Screw preload as a function of external torque for two different frictioncoefficients.
Torque (N.mm)
Pre
load
(N)
100 200 300 400 5000
20
40
60
80
100
120
140
160
180
200
µk = µs = 0.3
µk = µs = 0.5
Tightening Preload, FTr
Preload, Fr
Loosening Preload, FLr
FEA Solution for µ = 0.5 by Merz et al.8
Taper Angle, θ
Tta
pe
r/T
tota
l
1 2 3 4 5 6 7 8 9 100.84
0.86
0.88
0.9
0.92
0.94
0.96
0.98
1
1.02
µs=0.3
µs=0.5
µs=0.7
Tightening Torque
Loosening Torque
a) b)
Figure 8 The percentage of the total tightening torque carried by the taperedsection as a function of a) friction coefficient and b) taper angle.
Static Coefficient of Friction, µs
Tta
per
/Tto
tal
0.1 0.2 0.3 0.4 0.5 0.6 0.7 0.8 0.90.84
0.86
0.88
0.9
0.92
0.94
0.96
0.98
1
1.02
µk = µs
µk = 0.9µs
µk = 0.7µs
Tightening Torque
Loosening Torque