mechanism and structure sensitivity of electrocatalytic ... · therefore, the structure sensitivity...
TRANSCRIPT
Mechanism and structure sensitivity of electrocatalyticreactions of inorganic nitrogen compounds on platinumCitation for published version (APA):Rosca, V. (2006). Mechanism and structure sensitivity of electrocatalytic reactions of inorganic nitrogencompounds on platinum Eindhoven: Technische Universiteit Eindhoven DOI: 10.6100/IR601480
DOI:10.6100/IR601480
Document status and date:Published: 01/01/2006
Document Version:Publisher’s PDF, also known as Version of Record (includes final page, issue and volume numbers)
Please check the document version of this publication:
• A submitted manuscript is the author's version of the article upon submission and before peer-review. Therecan be important differences between the submitted version and the official published version of record. Peopleinterested in the research are advised to contact the author for the final version of the publication, or visit theDOI to the publisher's website.• The final author version and the galley proof are versions of the publication after peer review.• The final published version features the final layout of the paper including the volume, issue and pagenumbers.Link to publication
General rightsCopyright and moral rights for the publications made accessible in the public portal are retained by the authors and/or other copyright ownersand it is a condition of accessing publications that users recognise and abide by the legal requirements associated with these rights.
• Users may download and print one copy of any publication from the public portal for the purpose of private study or research. • You may not further distribute the material or use it for any profit-making activity or commercial gain • You may freely distribute the URL identifying the publication in the public portal.
Take down policyIf you believe that this document breaches copyright please contact us:
providing details. We will immediately remove access to the work pending the investigation of your claim.
Download date: 02. Feb. 2019
Mechanism and Structure Sensitivity of Electrocatalytic Reactions of Inorganic
Nitrogen Compounds on Platinum
PROEFSCHRIFT
ter verkrijging van de graad van doctor aan de Technische Universiteit Eindhoven, op gezag van de Rector Magnificus,
prof.dr.ir. C.J. van Duijn, voor een commissie aangewezen door het College voor Promoties in het openbaar te verdedigen op
woensdag 15 februari 2006 om 16 uur
door
Victor Rosca
geboren te Chisinau, Moldavië

Dit proefschrift is goedgekeurd door de promotoren prof.dr. M.T.M. Koper en prof.dr. R.A. van Santen Copromotor: Dr. G.L. Beltramo The work described in this thesis has been carried out at Schuit Institute of Catalysis, Laboratory of Inorganic Chemistry and Catalysis, Eindhoven University of Technology. Financial support was provided by the Netherlands Foundation for Scientific Research (NWO). CIP-DATA LIBRARY TECHNISCHE UNIVERSITEIT EINDHOVEN Rosca, V. Mechanism and structure sensitivity of electrocatalytic reactions of inorganic nitrogen compounds on platinum / by Victor Rosca. – Eindhoven : Technische Universiteit Eindhoven, 2006. Proefschrift. – ISBN 90-386-3027-1. – ISBN 978-90-386-3027-4 NUR 913 Trefwoorden: elektrochemie / heterogene katalyse / eenkristal platina oppervlakken / adsorptie / elektrokatalytische reductie ; stikstofmonoxide / hydroxylamine / elektrokatalytische oxidatie ; ammoniak / reactiekinetiek / infraroodspectroscopie Subject headings: electrochemistry / heterogeneous catalysis / single-crystal platinum surfaces / adsorption / electrocatalytic reduction ; nitric oxide / hydroxylamine / electrocatalytic oxidation ; ammonia / reaction kinetics / infrared spectroscopy Printed at the Universiteitsdrukkerij, Eindhoven University of Technology.

To Katia and Alex

Table of Contents
Chapter 1. Introduction 1
Chapter 2. Electrocatalytic reduction of NO adlayers on Pt(110) and Pt(111) in acidic media: evidence for adsorption site – specific reduction
17
Chapter 3. Rate laws for reductive stripping of NO adlayers at single-crystal platinum electrodes as deduced from transient experiments
37
Chapter 4. Mechanism of electrocatalytic reduction of nitric oxide on Pt(100) surface
55
Chapter 5. Electrocatalytic reactions of hydroxylamine at low-index single crystal platinum surfaces in acidic media
73
Chapter 6. Electrocatalytic oxidation of ammonia on Pt(111) and Pt(100) surfaces
99
Summary 123
Samenvatting 125
Rezumat 127
Резюме 129
List of Publications 132
Acknowledgements 133
Curriculum Vitæ 134

1
Introduction
The electrocatalytic reactions of nitrogen compounds on transition metals is a classic topic in electrochemical research, determined by the technological importance as well as by the complexity of the redox chemistry of nitrogen compounds. The present thesis concerns the adsorption and electrocatalytic reactions of selected inorganic nitrogen compounds, namely, nitric oxide, hydroxylamine, and ammonia, on platinum electrocatalyst. Although understanding the reactivity of the above compounds is of considerable practical interest (see sections 1.1 to 1.3.), the main motivation for the research described herein is a fundamental understanding of the mechanism and structure sensitivity of the electrocatalytic processes involved.
Electrocatalysis can be defined as catalysis of electrode reactions (Trasatti 1995).1 If the catalytic effect is determined by the action of the electrode material, then one is dealing with a heterogeneous electrocatalyst. The most important and extensively studied electrocatalysts are metals (electronic conductor), as well as their oxides or alloys, in contact with an electrolyte solution (ionic conductor).2-9 Although any electrode surface, at which an electrode reaction occurs and involves adsorbed intermediates, can be viewed as a catalyst, the term electrocatalyst is commonly applied to the electrode materials at which the electrochemical reaction rates are considerably higher, as compared to those at other electrode materials. The rate of an electrocatalytic process depends exponentially on the applied potential, provided the rate of the electrode reaction is limited by an electron-transfer step.
A (supported) metal catalyst in contact with an electrolyte solution is essentially an electrochemical system. The polarization of the metal−electrolyte interface, also affected by the composition of the solution and the interaction of the components of the solution with the metal surface, is a factor to be taken into consideration, whatever the exact mechanism of the reaction.10 Moreover, many
1
Chapter 1
liquid-phase catalytic hydrogenation and oxidation reactions involve electron transfer (often combined with proton transfer) to or from the metal.11,12 Therefore, the electrochemical studies are highly relevant, and often more convenient, for understanding catalysis at the metal-electrolyte interface.
Similar to heterogeneous catalysis, bonding is in many respects the decisive factor in electrocatalysis.3,8 Electronic factors – related to the effect of the surface structure on the local electronic properties – and the closely related geometric factors – for instance, manifested in a site preference for a given adsorbate (or, in simple terms, coordination) – should also influence the rate of an electrocatalytic process. Therefore, the structure sensitivity of electrocatalytic reactions has been receiving increasing attention in recent years.3,9 The electrode potential is a parameter that may significantly affect the bonding and, therefore, the reactivity of participants of a reaction, but also modulate the interaction of the electrode surface with other components of the electrolyte, thus affecting the rate of the electrocatalytic process in a complex manner. This thesis provides many examples in this respect.
Fundamental understanding of the mechanism of complex electrocatalytic processes can be achieved through studies on structurally and chemically well-defined (model) systems.9 The use of single crystal electrodes, the development of (in situ) surface-sensitive techniques, and an increase of the theoretical activity resulted in significant advances in the molecular-level understanding of electro-chemical processes.9,13 At the same time, the above advances brought about an increasing overlap with surface science.13 Indeed, electrochemistry and surface science have similar goals and share a number of techniques.9,14
The research described in the present thesis is an illustration to the above observations. The low-index single-crystal surfaces were used to investigate the structure sensitivity of selected reactions, allowing a better resolution of complex electrode processes, as compared to studies on polycrystalline electrodes. Electrochemical techniques can be very insightful, in mechanistic studies in particular, but they are still macroscopic probes. Therefore, a molecular-level probe, namely, in situ infrared spectroscopy,15 was employed to identify the (adsorbed) products or stable intermediates of the electrocatalytic reactions under investigation. On-line electrochemical mass spectrometry16 is a very useful tool for (real-time) detection of volatile products in solution and, therefore, was employed to acquire the information on the product distribution with the applied potential.
Platinum, an important hydrogenation and oxidation (electro)catalyst, is in many respects an ideal model (electro)catalyst. As an important factor in fundamental studies, the electrochemistry of the single-crystal platinum surfaces is fairly well understood.4,9 Furthermore, the voltammetry of the single-crystal platinum surfaces provides straightforward criteria for assessing the order and
2

Introduction
cleanliness of a surface, which are of paramount importance in model electrochemical studies. As a comparison, the voltammetry of palladium and rhodium, two metals with very similar properties, is much less informative in assessing the surface order and the cleanliness of the system, which is a drawback indeed.
The remainder of this chapter contains an introduction into adsorption and reactions of nitric oxide, hydroxylamine, and ammonia on platinum under electrochemical conditions, although a detailed review is beyond the scope. Rather, the most significant literature data are presented, along with indicating the gaps in the current knowledge. The chapter is concluded with an outline of the present thesis.
1.1. Adsorption and reactions of nitric oxide on platinum under electrochemical conditions
In this section a summary of the adsorption and reactions of nitric oxide
(NO) on platinum is given, with an emphasis on the mechanistic aspects of NO reduction in acidic media, as well as on the closely related nitrite reduction.
The adsorption and reactivity of NO on transition metal surfaces in an electrochemical environment are of considerable technological and scientific interest. Nitric oxide is a key intermediate or reagent in a series of environmentally and industrially important processes, such as nitrate and nitrite reduction17,18 or the liquid-phase catalytic hydrogenation of nitric oxide or nitrate to hydroxylamine.19,20 Electrochemical sensing21 of nitric oxide requires a thorough understanding of the electrochemistry of NO. Furthermore, NO reduction and oxidation are relatively simple reactions,22 which are in many respects attractive for investigating the activity and selectivity issues in electrocatalysis and also for comparison of reactions at solid−gas and solid−liquid interfaces.
Nitric oxide adsorbs strongly on transition metal surfaces.23 As for platinum, NO adsorbs molecularly on Pt(111) and Pt(110) surfaces under ultra-high vacuum (UHV) conditions at low to near-room temperatures.24-28 Adsorption of NO on Pt(100) seems to be (at least partially) dissociative even at near-room temperatures.29 Breaking of the N−O bond strongly depends on the surface structure and is often the rate-determining step in NO reduction on platinum in UHV.24 This step is believed to occur prior to hydrogenation and requires free neighboring site(s).24 Nevertheless, several UHV studies of NO reduction on Pt(111) at near-room temperature suggested the formation of HNO intermediate.30,31 The site occupation, coverage, and the structure of the NO adlayer depend on the surface structure. Generally, multifold coordination is preferred at
3

Chapter 1
low to moderate coverage.23 At high coverages linearly-bonded NO may coexist with multifold-coordinated NO, as for NO adsorption on Pt(111),32-34 or a site switch to a lower coordination site may occur, as for NO adsorption on Pt(110).27 On Pt(100), NO occupies a site between the atop and bridge site,35 the “side-on” configuration being a possible stable configuration at low coverage values.36
The electrochemistry of NO on polycrystalline platinum and on other metals has been receiving considerable attention,37-47 also in relation with the work on nitrate and nitrite reduction.37,48-52 In acidic solutions, inorganic nitrogen-oxygen compounds are involved in complex redox equilibria,52,53 which often complicate the analysis. As such, nitrous acid is in equilibrium with NO+ species:
HNO2 + H3O+ NO+ + 2H2O (1.1) This equilibrium is shifted to the right with increasing acidity. Therefore,
NO+ species are present in considerable concentration and are assumed to be the electrochemically active species in nitrite reduction in strongly acidic solutions.49,51,54 In diluted acids, however, nitrite is in electrochemical equilibrium with (adsorbed) NO, as shown in recent studies on single-crystal platinum surfaces:55-57
HNO2 (ads) + H3O+ + e− NOads + 2H2O (1.2) Accordingly, NO adlayers can be formed by exposing the electrode surface
to a diluted acidic solution of nitrite;58 these layers being (electro)chemically stable in a wide potential window. With this in mind, it is quite surprising that adsorbed NO, which is a thermodynamically stable and strongly adsorbed species on transition metals, was largely disregarded as a possible intermediate in the electrochemical reactions of nitrogen compounds on platinum or other transition metals. In more recent studies, nitric oxide was shown to be a stable intermediate in nitrate reduction18 and hydroxylamine oxidation59 on platinum.
It is important to make a clear distinction between continuous NO reduction, (i.e. with NO present in solution) and the reduction of adsorbed NO (without NO in solution). The continuous NO reduction results in the formation of nitrous oxide (and some dinitrogen) at low reductive potentials (typically 0.6-0.3 V vs. RHE), and hydroxylamine and ammonia at potentials corresponding to the hydrogen underpotential deposition (Hupd) region (between ca. 0.4-0 V vs RHE).37,38,40-42,45,46 In contrast, the reductive stripping of NO adlayers does not result in the formation of nitrous oxide, ammonia being shown to be the dominant (if not the only) product, as indicated in recent studies on polycrystalline45,46 as well as on single-crystal platinum58,60,61 electrodes.
4
Introduction
As repeatedly suggested in early studies on polycrystalline platinum,38,40,41,51 the formation of the N−N bond could result from dimerization of NOH (or HNO) adsorbed intermediates followed by a decay of the resulting dimer to N2O. In a recent detailed mechanistic analysis of NO reduction on polycrystalline platinum, de Vooys et al.46 proposed the following mechanism for N2O formation:
NOads + NO + H3O+ + e− → HN2O2 (ads) + H2O (rds) (1.3) HN2O2 (ads) + H3O+ + e− → N2O + 2H2O fast (1.4) The formation of a (protonated) NO dimer as a precursor to N2O formation
is the key feature of this mechanism. The dimer is formed only when NO is present in solution, suggesting that the second NO molecule is weakly adsorbed. The formation of NO dimers on metal surfaces in vacuum or in the gas phase has been recently indicated and discussed.23,62
The electrochemical reduction of NO to hydroxylamine and ammonia is commonly perceived as a stepwise hydrogenation process, involving the formation of NOH (or HNO), HNOH, and H2N intermediates.38,40,43,51,63 De Vooys et al.46 combined on-line differential electrochemical mass spectrometry (DEMS) and the rotating-disk electrode (RDE) technique and proposed the following EC mechanism for NO electroreduction to ammonia on polycrystalline platinum:
NOads + H3O+ + e− HNOads + H2O equilibrium (1.5) HNOads + … → Unknown Intermediate (rds) (1.6) Unknown Intermediate … → NH4
+ fast (1.7) The authors suggested that the rate-determining step is likely to be a
(potential-independent) chemical step. In a recent detailed voltammetric study of the reduction of adsorbed NO on stepped Pt[n(111)×(111)] surfaces, Beltramo and Koper60 proposed an EE mechanism for NOads reduction to ammonia:
NOads + H3O+ + e− HNOads + H2O equilibrium (1.8) HNOads + H3O+ + e− → H2NOads + H2O (rds) (1.9) H2NOads + 4H3O+ + 3e− → NH4
+ + 5H2O fast (1.10) The first two steps of the reaction are assumed to be combined proton-
electron transfers, involving hydronium ions from solution. In agreement with the latter assumption, NOads reduction on Pt(110) (and partly on Pt(111)) occurs at potentials at which the hydrogen coverage is negligible.60 Additionally, the reductive stripping of NO adlayers on polycrystalline platinum shows a pH
5
Chapter 1
dependence, which agrees with the electrochemical mechanism of NOads hydrogenation.46 The HNO and H2NO intermediates are suggested on the basis of their lower energy in vacuum compared to NOH and HNOH species.46,60 Note that in mechanism 1.8-1.10, the breaking of the N−O bond occurs after the rate-determining step.
Recent work on single-crystal electrodes provided important information on the adsorption of nitric oxide, which is the first step in understanding the structure sensitivity of reactions of NO. Most importantly, the NO adsorption on platinum under electrochemical conditions, as well as on other platinum-group metals, is very similar to NO adsorption on platinum in UHV, as deduced from the in situ Fourier transform reflection-absorption infrared spectroscopy (FTIRRAS) studies.58,64 Furthermore, the charge analysis of the reductive stripping of NO adlayers on the low-index platinum surfaces gave the coverage values comparable to those under UHV conditions. Accordingly, the saturation NO coverage on Pt(111), Pt(100), and Pt(110) electrodes is 0.4-0.5 monolayers (ML),58,60 0.5 ML,58,61 and 0.7 to 1 ML,60 respectively. The measured value of the coverage seems to be somewhat affected by the nature of electrolyte. On Pt(110), for instance, the saturation NO coverage is ca. 1 ML in perchloric acid and 0.7 ML in sulfuric acid.60 The above observations suggest that the structure of NO adlayers on platinum surfaces under electrochemical conditions is very similar to that under UHV conditions. This conclusion is further supported and exploited in the mechanistic studies of NOads reduction described in this work (Chapters 2 to 4).
Despite a fairly detailed picture of NO adsorption and reactions on platinum, and to some extent on other metal surfaces, knowledge of a detailed mechanism and of the structure sensitivity of NO reduction is still lacking. It is important to understand the mechanism of breaking the N−O bond, which is crucial for steering the selectivity towards the formation of hydroxylamine. Also, the structure sensitivity of NO reduction is still to be resolved. Beltramo et al.60 noticed that all the stepped Pt[n(111)×(111)] surfaces examined showed comparable activity in NOads reduction, and only the details of the voltammetric profile for the reductive stripping were clearly structure-sensitive. Explaining the nature of the features (peaks) observed in the stripping voltammetry could be an important piece of information in resolving the reaction mechanism. Furthermore, it would be interesting to see whether the similarities in adsorption under UHV and electrochemical conditions result in similar NO reactivity patterns. Specifically, under UHV conditions, breaking of the N−O bond is a structure sensitive process, which requires a neighboring free site.
6

Introduction
1.2. Adsorption and reactions of hydroxylamine on platinum under electrochemical conditions
Knowledge of the reactivity of hydroxylamine under electrochemical
conditions is important from a fundamental point of view – in the context of redox chemistry of inorganic nitrogen compounds – as well as from a technological point of view, mostly in relation to its industrial synthesis. In industry, hydroxylamine (HAM), a key intermediate in the production of ε-caprolactam and a compound with various applications in technology, is obtained by the liquid-phase catalytic hydrogenation of nitric oxide or nitrate at carbon-supported platinum or palladium catalysts.19,20 The relevance of the electrochemical studies on similar systems for understanding the processes practiced in industry is well accepted.19,65
An important aim of the applied electrochemical research is the identification of the factors controlling the selectivity of nitric oxide or nitrate reduction to hydroxylamine. However, the investigation of these factors is hampered by a lack of data on HAM electrochemistry itself. This is particularly true for HAM reduction on platinum electrodes in acidic media, which are the conditions of interest from a practical point of view.
The electrochemical reactions of HAM on platinum appear complex,53 and only few detailed mechanistic studies have been reported so far. In a series of studies, Möller and Heckner66,67 addressed the reduction of HAM on bright Pt, using voltammetry and the rotating disc electrode (RDE) technique. The adsorption of HAM was shown to be the first step in HAM reduction. The electroreduction of HAM on Pt proved difficult to study, as it is strongly masked by the hydrogen adsorption and hydrogen evolution reaction (HER). Möller and Heckner66 interpreted their preliminary results on HAM reduction at a platinum RDE in acidic media (pH<3) by the HAM involvement in the hydrogen adsorption reaction:
NH3OH+
ads + e− → NH2OH + Hads (1.11) In alkaline media, HAM was found to be much more reactive and reduction
to ammonia was postulated, although with no reference to the nature of the adsorbed intermediates. In a later, more detailed, study,67 the authors argued for the possibility of breaking the N−O bond in acidic media as well. The rate-determining step was formulated as follows:
NH3OH+
ads + e− → NH3 (ads) + OHads (1.12) The low reduction activity of hydroxylamine was explained by the blocking
effect of (NH3)ads.
7

Chapter 1
Möller and Heckner extensively studied the electrooxidation of HAM on bright Pt.68-71 Both NH2OH and NH3OH+ were perceived as reactive species, depending on pH. The oxidation of HAM was described in terms of successive dehydrogenation steps, accompanied by chemical side reactions involving the reaction intermediates. In acidic solution, the first two reaction steps were formulated as follows:
NH3OH+
ads → HNOH + e− + 2H+ (1.13) HNOH → NOH + e− + H+ (1.14) Both intermediates (presumably adsorbed) were assumed to form dinitrogen,
either by dimerization of HNOH and further disproportionation of the resulting dimer, or as a result of a reaction between NOH and HAM. Furthermore, by referring to the homogeneous association-dissociation of the HNO/H2N2O2 couple and the decomposition of H2N2O2 to N2O, the authors considered the experimentally observed N2O evolution as a proof for NOH formation. Finally, it was suggested that nitrate is the final product of HAM oxidation in acidic media and neutral media, while nitrite is perceived as a stable intermediate, particularly in alkaline media.
More recently, Karabinas et al.72 presented a detailed study of HAM electrooxidation on polycrystalline Pt in neutral (buffered) and acidic solutions by combining voltammetry and on-line DEMS. In their mechanism, the authors accepted the previously proposed dehydrogenation scenario, resulting in the formation of NOH species. The dimerization of NOH to hyponitrous acid (H2N2O2) and its subsequent decomposition to N2O and water were also supported. At potentials up to 0.7 V vs. RHE (pH 6.5, phosphate buffer) NOH is partially oxidized to NO. Nevertheless, NOH species was considered as precursor in nitrite formation: the authors argued that as soon as Pt-OH species become available at the surface, NOH species are oxidized directly to HNO2. The reaction of HNO2 with HAM was held responsible for the formation of N2O at potentials around 1 V. Above ca. 1.1 V nitrite is oxidized to nitrate. Oxidation via Pt-OH species was perceived as the main reaction pathway in neutral solutions, while in acidic media the reaction can also proceed via formation of NO2.
Piela and Wrona studied HAM oxidation at rotating disk electrodes, namely, platinum, gold, and glassy carbon in acidic media.73 Only Pt showed noticeable activity for HAM oxidation, which was explained by HAM adsorption on platinum and weak interaction of HAM with the other two materials. The reaction was assumed to proceed via NHOH, NOH, and nitrite as intermediates, nitrate being the final oxidation product. The observed kinetic hindrance was explained by an affect
8
Introduction
of the platinum oxide layer. The electrochemical transformations of HAM were shown to be accompanied by various homogeneous chemical reactions. As such, the reaction of nitrite, a product of HAM oxidation, and HAM itself was shown to be an important source of N2O accumulation in solution.
Recently, in this laboratory HAM electrochemistry on polycrystalline platinum in acidic media was studied using voltammetry, on-line DEMS, and in situ FTIRRAS.59 It was shown that the adsorption and reactions of HAM are essentially controlled by other species that interact strongly with the electrode surface (e.g., hydrogen, anions, strongly-adsorbed intermediates). This explains quite moderate current densities, both in oxidation and reduction, observed between ca. 0 and 1 V vs. RHE. Hydroxylamine is slowly reduced to ammonia in the Hupd region, somewhat inhibited at high hydrogen coverages. The HAM electrooxidation is strongly influenced by the absorption of its products, as well as by their transformations in solution. In disagreement with previous studies, the adsorbed nitric oxide was shown to be the key intermediate of HAM oxidation, as deduced from both voltammetry and in situ infrared measurements. On the basis of a Tafel slope analysis, the following EE (electrochemical−electrochemical) mechanism was proposed for HAM oxidation to NOads:
H3NOH+ H3NOH+
ads (1.15) H3NOH+
ads H2NOads + 2H+ + e− (1.16) H2NOads → HNOads + H+ + e− (rds) (1.17) HNOads → NOads + H+ + e− (1.18) Nitric oxide forms an adlayer that is (electro)chemically stable in a wide
potential window, thus acting as a poison in HAM oxidation. At potentials corresponding to the oxidation of the platinum surface (above ca. 0.75 V), NOads is oxidized to (adsorbed) nitrite. Finally, N2O formation between ca. 0.4 and 1 V was shown to have multiple sources. The most important source of N2O is likely a reaction between nitrite and HAM.
Previous studies indicated HAM adsorption as the primary step of HAM transformations.59,67,72,73 At the same time, HAM reactions are strongly masked by adsorption and reaction of species like hydrogen, nitric oxide, sulfate, which adsorb strongly on platinum and, thus, block the sites for HAM adsorption and transformations.59 At single-crystal platinum surfaces, the interfering processes are much better defined, which may allow their separation and, therefore, a better chance to "unmask" the reactivity of HAM on platinum. Therefore, the investigation of HAM reactions on single-crystal surfaces is a logical step.
9
Chapter 1
1.3. Adsorption and reactions of ammonia on platinum under electrochemical conditions
The electrochemical oxidation of ammonia on transition metals has been
receiving considerable attention, particularly in connection with the possibility of using ammonia in the electrochemical fuel cells.74-77 Furthermore, an adequate knowledge of ammonia electrochemistry is important for application in environmental (electro)catalysis78,79 and in the electrochemical detection of ammonia.80,81 From a scientific point of view, ammonia electrooxidation on platinum, as well as on other metal surfaces, is an attractive model electrocatalytic system. Achieving a molecular level understanding of the electrocatalytic reactions of ammonia obviously requires studies of chemically and structurally well-defined systems, i.e. single-crystal surfaces.
Ammonia interacts weakly with platinum surfaces in UHV, showing predominantly molecular adsorption at near-room temperatures, largely regardless the surface structure.82-85 Dehydrogenation of ammonia (and further oxidation to NO) requires high temperatures (typically over 500K) and the presence of coadsorbed oxygen.83,85,86 With this in mind, the appreciable activity of platinum in ammonia electrooxidation at room temperature is quite a remarkable phenomenon. This activity may be related to an activating role of the hydroxyl or water, either coadsorbed or in solution. At the same time, the polarization of the metal−electrolyte interface may have a direct activation effect. Assuming that ammonia interacts with the surface through its unpaired electrons, increase of the electrode potential, and the associated lowering of the Fermi level in the metal, brings about increasing deficiency of charge density on nitrogen and, therefore, a polarization of the Pt−N bond and, therefore, an activation of the N−H bond.
In early studies on polycrystalline platinum, ammonia oxidation in alkaline media was commonly viewed as a stepwise electrocatalytic dehydrogenation process, resulting in the formation of NHx adsorbed species (x=1,2) and ultimately the formation of the adsorbed atomic nitrogen:78,87,88
NH3 NH3 (ads) equilibrium (1.19) NH3 (ads) + HO− NH2 (ads) + e− + H2O (1.20) NH2 (ads) + HO− NH(ads) + e− + H2O (rds) (1.21) NH(ads) + HO− N(ads) + e− + H2O (1.22) 2N(ads) N2 slow (1.23) On the basis of the experimentally observed Tafel slope (39 mV decade-1)
and assuming the Langmuir adsorption isotherm for ammonia adsorption, Oswin
10

Introduction
and Solomon suggested that the transformation NH2 (ads) NH(ads) is the rate-determining step at moderately oxidative potentials.87 It was assumed that molecular nitrogen was formed by the recombination of two nitrogen adatoms (reaction 1.23), which was the rate-determining step at high overpotentials.
In a later, more detailed, mechanistic study, Gerischer and Mauerer89 suggested that, similar to the role of oxygen (or hydroxyl) in ammonia dehydrogenation under UHV conditions, (partially) discharged surface-bonded hydroxyl plays an important role in ammonia dehydrogenation under electrochemical conditions. The dimerization of NHx (x=1,2) fragments and the subsequent dehydrogenation of the resulting dimer was proposed as the most plausible scenario for the formation of molecular nitrogen, whereas atomic nitrogen was assumed to act as a catalyst poison. The authors performed an ex situ analysis indicating the formation of atomic nitrogen. Specifically, a platinized platinum electrode was polarized until its activity for ammonia oxidation dropped to zero. Then the electrode was removed from the electrochemical cell, dried and heated to 400-600°C, and a gas chromatographic analysis of the resulting gas mixture was performed. The gas mixture contained predominantly dinitrogen, the hydrogen content being negligible.
More recent studies provided further details on the ammonia oxidation on polycrystalline platinum, mostly extending the Gerischer-Mauerer mechanism.90-92 Gootzen et al.91 identified an NH adsorbate as a stable intermediate in ammonia oxidation to molecular nitrogen and also suggested atomic nitrogen as the catalyst poison. De Vooys et al.92 examined the reactivity of a series of transition and coinage metals for ammonia oxidation. The authors pointed to the importance of the nature of the products of ammonia anodic adsorption and the overpotentials at which these adsorbates are formed. Thus, an electrode surface was active in the formation of dinitrogen, provided the NHx species were formed at sufficiently low overpotentials, whereas atomic nitrogen was indicated as the poison. In a subsequent in situ surface-enhanced Raman spectroscopy (SERS) study, de Vooys et al.93 demonstrated the formation of atomic nitrogen on palladium, which is a poor dinitrogen formation electrocatalyst. This result supports the Gerischer-Mauerer mechanism.
Importantly, in a number of studies (on polycrystalline platinum) the on-line DEMS technique was used,90-92 which assured a better understanding of the product distribution with the applied potential. In a very recent rotating ring-disk electrode (RRDE) study, Endo et al.94 could detect in situ some weakly adsorbed intermediates, both oxidizable and reducible ones. The authors suggested the oxygen-containing species (NOx and NH2OH) as likely candidates.
There are few studies of ammonia oxidation on single-crystal platinum electrodes. Nonetheless, these studies provided important information on the
11

Chapter 1
structure sensitivity of ammonia oxidation. Gao et al.95 reported mass spectrometry measurements of ammonia oxidation on Pt(100) and pointed to a high activity of this surface. These authors also observed the production of molecular nitrogen between ca. 0.6 and 0.9 V. More recently, Vidal-Iglesias et al.96 reported a voltammetric study of ammonia oxidation on Pt(111), Pt(110), and Pt(100). The authors demonstrated a structure sensitivity of ammonia oxidation on platinum: Pt(100) was highly active for ammonia oxidation at potentials as low as 0.5 V, whereas Pt(111) and Pt(110) showed virtually no activity in the potential range up to ca. 0.9 V. In a subsequent paper, Vidal-Iglesias et al.97 concluded that the activity for ammonia oxidation was quite sensitive to the width of the (100) terrace and the orientation of the step. Very recently, the same authors reported results of a DEMS study of ammonia oxidation on Pt(111), Pt(110), and Pt(100) using labeled ammonia (15N).98 The Pt(100) surface showed a very high activity and selectivity (up to ca. 0.7 V vs. RHE) in ammonia oxidation to dinitrogen. At potentials more positive than ca. 0.7 V, nitrous oxide and nitric oxide become dominant products at this surface. For a cyclic voltammogram with the upper potential limit of ca. 1.5 V, a strong deactivation of the surface was observed. Pt(111) and Pt(110) were shown to be much poorer electrocatalysts for ammonia oxidation in general and to dinitrogen in particular.
With all experimental data on ammonia oxidation available, our current understanding of the electrocatalytic oxidation of ammonia is still rather inadequate. To be more specific, there is little insight into the factors controlling the activity and selectivity of platinum for ammonia oxidation to dinitrogen. A lower energy of adsorption of atomic nitrogen on Pt(100), as compared to that on Pt(111) and Pt(110) could explain a high activity of Pt(100). At the same time, it is still to be established whether atomic nitrogen is the precursor in the formation of dinitrogen. Therefore, identification of the intermediates of the reaction is the key issue here. The Gerischer-Mauerer mechanism appears to be a useful starting model for a critical reconsideration of the mechanism of ammonia electrooxidation.
1.4. Scope and outline of the thesis
The main goal of the research described in the present thesis is a molecular-
level understanding of the mechanisms and structure sensitivity of electrocatalytic reactions of nitric oxide, hydroxylamine, and ammonia at platinum electrodes. For that purpose, the adsorption and reactions of the above compounds were investigated on low-index single-crystal platinum electrodes in contact with ultrapure electrolyte solutions. Electrochemical techniques, namely, voltammetry and chronoamperometry, were combined with non-electrochemical molecular-level probes, namely, in situ Fourier transform reflection-absorption infrared
12

Introduction
spectroscopy and on-line electrochemical mass spectrometry. Quantum chemical calculations (ab-initio density functional theory (DFT) calculations) were employed for a better understanding of the experimental results, as a complementary technique.
Mechanistic aspects of electrocatalytic reduction of nitric oxide adlayers on Pt(111), Pt(110), and Pt(100) surfaces in acidic media is the subject of Chapters 2 to 4. Chapter 2 describes a combined voltammetric and in situ infrared spectroscopy analysis of the reductive stripping of NO adlayers on Pt(111) and Pt(110) in acidic media, aimed at explaining the detailed voltammetric profile observed for NOads reduction on the two surfaces. As a result, a relationship between the NO binding site(s) and reactivity (voltammetric peaks) is established.
Chapter 3 reports the results of a chronoamperometric study of the reductive stripping of NO adlayers on Pt(111) and Pt(110), aimed at establishing the rate laws for the reduction of adsorbed NO. The experimental current transients were examined in terms of a kinetic model, which accounts for the effect of coverage and lateral interactions on the kinetics of NOads reduction under electrochemical conditions.
Chapter 4 describes the results of a detailed voltammetric, in situ infrared spectroscopy, and on-line mass spectrometry study of the reductive stripping of NO adlayers on the Pt(100) surface. The aim was to formulate a detailed mechanism of NOads reduction on Pt(100), including the effect of the surface coverage, anion (co)adsorption, and the role of the surface defects. This chapter also completes the comparison of the electrocatalytic reduction of NO adlayers on Pt(111), Pt(110), and Pt(100) surfaces.
Chapter 5 reports on the electrocatalytic reactions of hydroxylamine at Pt(111), Pt(110), and Pt(100) in acidic media, as deduced from voltammetry, on line mass spectrometry, and in situ infrared spectroscopy. The aim was to characterize the reactivity of hydroxylamine and to unravel the mechanisms of hydroxylamine reduction and oxidation on platinum. The mechanistic results are discussed in light of the mechanistic data on NO reduction on the same surfaces.
Chapter 6 describes a combined voltammetric and in situ infrared study of the electrocatalytic oxidation of ammonia on Pt(111) and Pt(100). The results obtained allow a better understanding of the initial stages of ammonia dehydrogenation and shed light on the factors controlling the activity and selectivity of ammonia oxidation to dinitrogen. A tentative mechanism of the dinitrogen production on Pt(100) is proposed and discussed.
13
Chapter 1
References
(1) Trasatti, S. Int. J. Hydrogen Energy 1995, 20, 835. (2) Appleby, A. J. Electrocatalysis. In Compr. Treatise Electrochem., 1983; Vol. 7; pp 173. (3) Electrocatalysis; Lipkowski, J.; Ross, P. N., Eds., 1998, pp 43. (4) Herrero, E.; Feliu, J. M.; Aldaz, A. Electrocatalysis. In Encyclopedia of Electrochemistry, 2003;
Vol 2; pp 443. (5) Wendt, H.; Rausch, S.; Borucinski, T. Adv. Catal. 1994, 40, 87. (6) Markovic, N. M.; Ross, P. N. Surf. Sci. Rep. 2002, 45, 117. (7) Catalysis and Electrocatalysis at Nanoparticle Surfaces; Wieckowski, A.; Savinova, E. R.;
Vayenas, C. G., Eds., 2003. (8) Koper, M. T. M.; Van Santen, R. A.; Neurock, M. Theory and modeling of catalytic and
electrocatalytic reactions. In Catalysis and Electrocatalysis at Nanoparticle Surfaces, 2003; pp 1. (9) Interfacial Electrochemistry. Theory, Experiment, and Applications; Wieckowski, A., Ed.; Marcel
Dekker, Inc.: New-York, 1999. (10) Mallat, T.; Baiker, A. Topics Catal. 1999, 8, 115. (11) Horanyi, G. Catal. Today 1994, 19, 285. (12) Horanyi, G. J. Mol. Catal. A: Chem. 2003, 199, 7. (13) Schmickler, W. Interfacial Electrochemistry; Oxford University Press: New-York, 1996. (14) Electrochemical Interfaces: Modern Techniques for In Situ Surface Characterization; Abruna,
H., Ed.; VCH: New-York, 1991. (15) Iwasita, T.; Nart, F. C. In Advances in Electrochemical Science and Engineering; Gerischer, H.,
Tobias, C. W., Eds.; Verlag Chemie: Weiheim, 1995; Vol. 4; pp 123. (16) Baltruschat, H. J. Am. Soc. Mass Spectrometry 2004, 15, 1693. (17) Horold, S.; Vorlop, K.-D.; Tacke, T.; Sell, M. Catal. Today 1993, 17, 21. (18) Dima, G. E.; de Vooys, A. C. A.; Koper, M. T. M. J. Electroanal. Chem. 2003, 554-555, 15. (19) Tauszik, G. R.; Grocetta, P. Appl. Ctalysis 1985, 17, 1. (20) Ritz, J.; Fuchs, H.; Perryman, H. G. Hydroxylamine. In Ulmann's Encyclopedia of Industrial
Chemistry; 6th ed.; Wiley: Chichester, 2000. (21) Allen, B. W.; Piantadosi, C. A.; Coury, L. A., Jr. Nitric Oxide 2000, 4, 75. (22) de Vooys, A. C. A.; Beltramo, G. L.; van Riet, B.; van Veen, J. A. R.; Koper, M. T. M.
Electrochim. Acta 2004, 49, 1307. (23) Brown, W. A.; King, D. A. J. Phys. Chem. B 2000, 104, 2578. (24) Masel, R. I. Catal. Rev. -Sci. Eng. 1986, 28, 335. (25) Levoguer, C. L.; Nix, R. M. Surf. Sci. 1996, 365, 672. (26) Gorte, R. J.; Gland, J. L. Surf. Sci. 1981, 102, 34. (27) Brown, W. A.; Sharma, R. K.; King, D. A. J. Phys. Chem. 1998, 102, 5303. (28) Agrawal, V. K.; Trenary, M. Surf. Sci. 1991, 259, 116. (29) Rienks, E. D. L.; Bakker, J. W.; Baraldi, A.; Carabiniero, S. A. C.; Lizzit, S.; Weststrate, C. J.;
Nieuwenhuys, B. E. Surf. Sci. 2002, 516, 109. (30) Smirnov, M. Y.; Gorodetskii, V. V.; Cholach, A. R. In Fundamental Aspects of Heterogeneous
Catalysis Studied by Particle Beams; Brongersma, H. H., van Santen, R. A., Eds., 1991; pp 249. (31) Smirnov, M. Y.; Gorodetskii, V. V.; Block, J. H. J. Mol. Catal. A: Chem. 1996, 107, 359. (32) Matsumoto, M.; Fukutani, K.; Okano, T.; Miyake, K.; Shigekawa, H.; Kato, H.; Okuyama, H.;
Kawai, M. Surf. Sci. 2000, 454-456, 101. (33) Matsumoto, M.; Tatsumi, T.; Fukutani, K.; Okano, T. Surf. Sci. 2002, 513, 485. (34) Aizawa, H.; Morikawa, Y.; Tsuneyuki, S.; Fukutani, K.; Ohno, T. Surf. Sci. 2002, 514, 394. (35) Gardner, P.; Tueshaus, M.; Martin, R.; Bradshaw, A. M. Surf. Sci. 1990, 240, 112.
14

Introduction
(36) Ge, Q.; Neurock, M. J. Am. Chem. Soc. 2004, 126, 1551. (37) Dutta, D.; Landolt, D. J. Electrochem. Soc. 1972, 119, 1320. (38) Savodnik, N. N.; Shepelin, V. A.; Zalkind, T. I. Elektrokhimiya 1970, 7, 424. (39) Savodnik, N. N.; Shepelin, V. A.; Zalkind, T. I. Elektrokhimiya 1971, 7, 583. (40) Janssen, L. J. J.; Pieterse, M. M. J.; Barendrecht, E. Electrochim. Acta 1977, 22, 27. (41) Paseka, I.; Vonkova, J. Electrochim. Acta 1980, 25, 1251. (42) Paseka, I.; Hodinar, A. Electrochim. Acta 1982, 27, 1461. (43) Colucci, J. A.; Foral, M. J.; Langer, S. H. Electrochim. Acta 1985, 30, 521. (44) Colucci, J. A.; Foral, M. J.; Langer, S. H. Electrochim. Acta 1985, 30, 1675. (45) Gootzen, J. F. E.; van Hardeveld, R. M.; Visscher, W.; van Santen, R. A.; van Veen, J. A. R.
Recl. Trav. Chim. Pays-Bas 1996, 115, 480. (46) de Vooys, A. C. A.; Koper, M. T. M.; van Santen, R. A.; van Veen, J. A. R. Electrochim. Acta
2001, 46, 923. (47) de Vooys, A. C. A.; Koper, M. T. M.; van Santen, R. A.; van Veen, J. A. R. J. Cat. 2001, 202,
387. (48) Schmid, G.; Lobeck, M. A. Ber. Bunsenges. Phys. Chem. 1969, 73, 189. (49) Hecker, H. N.; Schmidt, G. Electrochim. Acta 1971, 16, 131. (50) Gaade, R. G.; Bruckenstein, S. J. Electroanal. Chem. 1974, 50, 163. (51) Barendrecht, E.; van der Plaas, J. F. Recl. Trav. Chim. Pays-Bas 1977, 96, 133. (52) Snider, B. G.; Johnson, D. C. Anal. Chim. Acta 1979, 105, 9. (53) Plieth, W. J. Encyclopedia of Electrochemistry of the Elements; Bard, A. J., Ed.; Marcel Dekker:
New-York, 1978; Vol. 8. (54) Garsia, C. T.; Calandra, A. J.; Arvia, A. J. Electrochim. Acta 1972, 17, 1281. (55) Ye, S.; Kita, H. J. Electroanal. Chem. 1993, 346, 489. (56) Rodes, A.; Gomez, R.; Orts, J. M.; Feliu, J. M.; Perez, A.; Aldaz, A. J. Electroanal. Chem. 1993,
359, 315. (57) Zang, Z.-H.; Wu, Z.-L.; Yau, S.-L. J. Phys. Chem. B 1999, 103, 9624. (58) Gomez, R.; Rodes, A.; Orts, J. M.; Feliu, J. M.; Perez, J. M. Surf. Sci. 1995, 342, L1104. (59) Rosca, V.; Beltramo, G. L.; Koper, M. T. M. J. Electroanal. Chem. 2004, 566, 53. (60) Beltramo, G. L.; Koper, M. T. M. Langmuir 2003, 19, 8907. (61) Rodes, A.; Climent, V.; Orts, J. M.; Perez, J. M.; Aldaz, A. Electrochim. Acta 1998, 44, 1077. (62) Zaera, F.; Gopinath, C. S. Chem. Phys. Lett. 2000, 332, 209. (63) Benderski, V. A.; Krivenko, A. G.; Ponomarev, E. A. Elektrokhimiya 1990, 26, 318. (64) Weaver, M. J.; Zou, S.; Tang, C. J. Chem. Phys. 1999, 111, 368. (65) van de Moesdijk, C. G. M. The catalytic reduction of nitrite and nitric oxide to hydroxylamine:
kinetics and mechanism. Ph.D. Thesis, Eindhoven University of Technology, 1979. (66) Möller, D.; Heckner, K. H. Z. Chem. 1971, 11, 157. (67) Möller, D.; Heckner, K. H. Z. Phys. Chem. 1974, 255, 33. (68) Möller, D.; Heckner, K. H. Z. Chem. 1971, 11, 32. (69) Möller, D.; Heckner, K. H. Z. Chem. 1971, 11, 356. (70) Möller, D.; Heckner, K. H. Z. Chem. 1970, 10, 477. (71) Möller, D.; Heckner, K. H. Z. Phys. Chem. 1972, 251, 81. (72) Karabinas, P.; Wolter, O.; Heitbaum, J. Ber. Bunsenges. Phys. Chem. 1984, 88, 1191. (73) Piela, B.; Wrona, P. K. J. Electrochem. Soc. 2004, 151, E69. (74) Wynveen, R. A. Fuel Cells 1963, 2, 153. (75) Simons, E. L.; Cairns, E. J.; Surd, D. J. J. Electrochem. Soc. 1969, 116, 556. (76) Strickland, G. J. Hydrogen Energy 1984, 9, 759. (77) Vitse, F.; Cooper, M.; Botte, G. G. J. Power Sources 2005, 142, 18. (78) Marincic, L.; Leitz, F. B. J. Appl. Electrochem. 1978, 8, 333.
15
Chapter 1
(79) Feng, C.; Sugiura, N.; Shimada, S.; Maekawa, T. J. Hazard. Mater. 2003, 103, 65. (80) Pfennig, D.-M.; Deprez, J.; Kitzelmann, D. Ber. Bunsenges. Phys. Chem. 1990, 94, 988. (81) Lopez de Mishima, B. A.; Lescano, D.; Molina Holgado, T.; Mishima, H. T. Electrochim. Acta
1997, 43, 395. (82) Sexton, B. A.; Mitchell, G. E. Surf. Sci. 1980, 99, 523. (83) Mieher, W. D.; Ho, W. Surf. Sci. 1995, 322, 151. (84) Bradley, J. M.; Hopkinson, A.; King, D. A. Surf. Sci. 1997, 371, 255. (85) Gohndrone, J. M.; Olsen, C. W.; Backman, A. L.; Gow, T. R.; Yagasaki, E.; Masel, R. I. J. Vac.
Sci. Technol. 1989, 7, 1986. (86) Bradley, J. M.; Hopkinson, A.; King, D. A. J. Phys. Chem. 1995, 99, 17032. (87) Oswin, H. G.; Salomon, M. Can. J. Chem. 1963, 41, 1686. (88) Despic, A. R.; Drazic, D. M.; Rakin, P. M. Electrochim. Acta 1966, 11, 997. (89) Gerischer, H.; Mauerer, A. J. Electroanal. Chem. 1970, 25, 421. (90) Wasmus, S.; Vasini, E. J.; Krausa, M.; Mishima, H. T.; Vielstich, W. Electrochim. Acta 1994,
39, 23. (91) Gootzen, J. F. E.; Wonders, A.; Visscher, W.; van Santen, R. A.; van Veen, J. A. R. Electrochim.
Acta 1998, 43, 1851. (92) de Vooys, A. C. A.; Koper, M. T. M.; van Santen, R. A.; van Veen, J. A. R. J. Electroanal.
Chem. 2001, 506, 127. (93) de Vooys, A. C. A.; Mrozek, M. F.; Koper, M. T. M.; Van Santen, R. A.; Van Veen, J. A. R.;
Weaver, M. J. Electrochem. Comm. 2001, 3, 293. (94) Endo, K.; Katayama, Y.; Miura, T. Electrochim. Acta 2005, 50, 2181. (95) Gao, Y.; Kita, H.; Hattori, H. Chem. Lett. 1994, 11, 2093. (96) Vidal-Iglesias, F. J.; Garcia-Araez, N.; Montiel, V.; Feliu, J. M.; Aldaz, A. Electrochem. Comm.
2003, 5, 22. (97) Vidal-Iglesias, F. J.; Solla-Gullon, J.; Montiel, V.; Feliu, J. M.; Aldaz, A. J. Phys. Chem. B 2005,
109, 12914. (98) Vidal-Iglesias, F. J. PhD thesis, Universidad de Alicante, 2005.
16

2
Electrocatalytic reduction of NO adlayers on Pt(110) and Pt(111) in acidic media: evidence for adsorption site - specific reduction
Abstract Described herein is a combined in situ Fourier transform infrared reflection-absorption spectroscopy (FTIRRAS) and voltammetric study of the reduction of saturated and subsaturated NO adlayers on Pt(111) and Pt(110) single−crystal surfaces in acidic media. The stripping voltammetry experiments and the associated evolution of infrared spectra indicate that different features (peaks) observed in the voltammetric profile for the electrochemical reduction of NO adlayers on the surfaces considered are related to the reduction of NOads at different adsorption sites and not to different (consecutive) processes. More specifically, reduction of high- and intermediate-coverage NO adlayers on Pt(110) (ca. 0.5−1 monolayers (ML)) is accompanied by site switching from atop to bridge position, in agreement with the ultra-high-vacuum data. On Pt(111), linearly-bonded (atop) NO and face-centered cubic 3-fold-hollow NO species coexist at high coverages (0.25−0.5 ML) and can be reduced consecutively and independently. On Pt(111), Pt(110), and Pt(100) electrodes, linearly-bonded NO species are more reactive than multifold-bonded NO species. Both spectroscopic and voltammetric data indicate that ammonia is the main product of NOads reduction on the surfaces examined.
This chapter is based on article by V. Rosca, G.L. Beltramo, and M.T.M. Koper, published in Langmuir, 21 (2005) 1448.
17
Chapter 2
2.1. Introduction The adsorption and reactions of nitric oxide (NO) on transition metal
surfaces in an electrochemical environment are of considerable technological and scientific interest. NO is a key intermediate or reagent in a series of environmentally and industrially important processes, such as nitrate (nitrite) reduction and ammonia oxidation1 or the liquid-phase catalytic hydrogenation of nitric oxide (NO) or nitrate to hydroxylamine.2,3 Furthermore, electrochemical sensing and removal of nitric oxide4 requires a thorough understanding of electrochemistry of NO. From a fundamental point of view, NO reduction is a relatively simple electrocatalytic process and could serve as a model system for studying activity and selectivity issues in electrocatalysis. Finally, similar to the extensively studied oxidation of carbon monoxide, NO is in many respects a suitable molecule for comparing reactions at the solid−gas and solid−liquid interface, especially when combined with work at single-crystal surfaces.
Recent studies of the electrochemical transformation of NO adlayers (NOads) on low-index single-crystal platinum electrodes5-13 have significantly improved our understanding of the reactivity of nitric oxide, as compared to the knowledge gained from studies on polycrystalline platinum.14 Recently, Beltramo et al.15 reported a systematic voltammetric analysis of reduction and oxidation of NO adlayers on Pt(111), Pt(110) and a series of stepped Pt[n(111)×(111)] electrodes, aimed at establishing both the mechanism and structure sensitivity of reactions of adsorbed NO. The following tentative mechanism was proposed for the reduction of adsorbed NO:15
NOads + H+ + e− HNOads equilibrium (2.1) HNOads + H+ +e− → H2NOads rds (2.2) H2NOads + 4H+ + 3e− → NH4
+ + H2O fast (2.3) Most importantly, the first two reaction steps are assumed to be two
combined proton and electron transfers. It is difficult to elaborate on the nature and the elementary steps of the process (2.3), because they take place after the rate-determining step.
Reduction of NOads appears to be structure insensitive with regard to the kinetics of the process: the NO adlayer may be stripped off in two to three voltammetric features in the potential region between ca. 0.15 and 0.4 V vs RHE (0.5 M sulfuric or perchloric acid) at all surfaces examined. On the other hand, the voltammetric profile proved to be clearly structure sensitive. This structure sensitivity was ascribed to different NO surface configurations and coverages,
18
Electrocatalytic reduction of NO adlayers on Pt(110) and Pt(100) in acidic media: evidence for adsorption site – specific reduction
combined with structure sensitive adsorption of hydrogen and anions, rather than with a structure sensitivity of the NO reduction per se.15
Due to its ability to supply vibrational information and its in situ applicability to electrochemical interfaces, Fourier transform infrared reflection-absorption spectroscopy (FTIRRAS) has become an important tool for investigating electrode processes at a molecular level.16 An important, if not critical, factor enabling FTIRRAS application in (in situ) electrochemical studies was the development of links between related metal−vacuum and metal−solution interfaces. In this sense, in addition to extensive studies on carbon monoxide (CO), adsorption of NO on platinum-group metals has been receiving increasing attention in recent years.13,17-19
Described herein is a combined in situ FTIRRAS and voltammetric study of the reduction of saturated and subsaturated NO adlayers on Pt(111) and Pt(110) single crystal surfaces in acidic media. We aimed particularly at the structure sensitivity of the voltammetric profile in relation to the coverage and the associated evolution of FTIRRAS spectra. Specifically, we shall demonstrate a relationship between the NO binding site(s) and the reduction peak(s) in the voltammetry of the surfaces studied.
2.2. Experimental Section
The H2SO4 and HClO4 working solutions were prepared from their respective
concentrated acids (“Suprapur”, Merck) and ultrapure water (Millipore MilliQ system, 18.2 MΩ cm, 1-2 ppb total organic carbon) or triply distilled deuterium oxide (“Uvasol”, Merck, deuteration degree min. 99.8%).
Two types of single-crystal platinum electrodes were used. Bead-type single-crystal platinum electrodes, prepared by Clavilier’s method,20 were used for most of the electrochemical measurements. For in situ FTIR measurements, commercial platinum disk electrodes of 10 mm diameter were used (oriented within 1°, Surface Preparation Laboratory, Zaandam, The Netherlands). Prior to each experiment, the working electrode was flame-annealed, cooled to room temperature in an Ar:H2 (3:1) atmosphere and transferred to the electrochemical cell under the protection of a droplet of deoxygenated ultrapure water. To avoid the so-called missing row reconstruction, the Pt(110) electrode was cooled in an intensive stream of Ar, following the approach proposed by Markovic et al.21
Electrochemical measurements were performed in a single-compartment three-electrode glass cell, using a computer-controlled potentiostat (AutoLab-PGSTAT20, Eco Chemie, Utrecht, The Netherlands). The cell contained a small movable glass spoon22 that allowed dosing of NO at open circuit potential from a diluted NaNO2 solution under the argon atmosphere, thus allowing deposition of saturated and subsaturated NO adlayers without dissolving NO in the working solution. As for the in situ FTIR experiments, NO
19

Chapter 2
adlayers were generated in a similar way: immersion of the working electrode in a separate solution of NaNO2 was followed by a thorough washing of the electrode with pure deuterated water and subsequent transfer of the electrode to the cell. The cell and the other glassware were cleaned by boiling in a 1:1 mixture of concentrated nitric and sulfuric acid, followed by repeated boiling with ultrapure water. A coiled platinum wire served as counter electrode. In HClO4 solutions, the reference electrode was an internal reversible hydrogen electrode (RHE). In H2SO4 solutions a saturated mercury-mercury sulfate (Hg/Hg2SO4/K2SO4) electrode, connected via a Luggin capillary, was used as a reference. However, all potentials are quoted versus the RHE. Prior to each experiment, all solutions were deoxygenated by purging with pure (N50) argon.
The in situ FTIRRAS measurements were performed under external reflection conditions. All the spectra reported were recorded under potential control. The Fourier transform infrared spectrometer was a Brüker IFS113V, equipped with a narrow-band MCT detector. The design of the spectroelectrochemical cell closely resembles that described elsewhere.23 The cell featured a prismatic CaF2 transmission window beveled at 60°. Five hundred interferograms were collected at each potential. The spectral resolution was 8 cm-1. The reflectance spectra were calculated as (R−R0)/R0, where R and R0 are the reflectance at the sample and the reference potential respectively. Consequently, the ∆R/R ratio gives negative bands for species that are formed and positive bands for species that are consumed at the sample potential, as compared to the reference potential.
The surface order and cleanliness of the electrodes were checked before each experiment by recording the blank cyclic voltammograms and their comparison to standard voltammetric profiles.24-26 Specifically, the voltammetric profile for the Pt(110) electrode (Figure 2.1) agrees well with those reported by other groups,21,27,28 allowing us to conclude that our electrode preparation procedure results in a well-ordered Pt(110)-(1×1) surface (for a detailed discussion, see reference 26).
2.3. Results and Data Analysis
2.3.1. Pt(110)
We shall begin with presenting the voltammetric data for the reductive
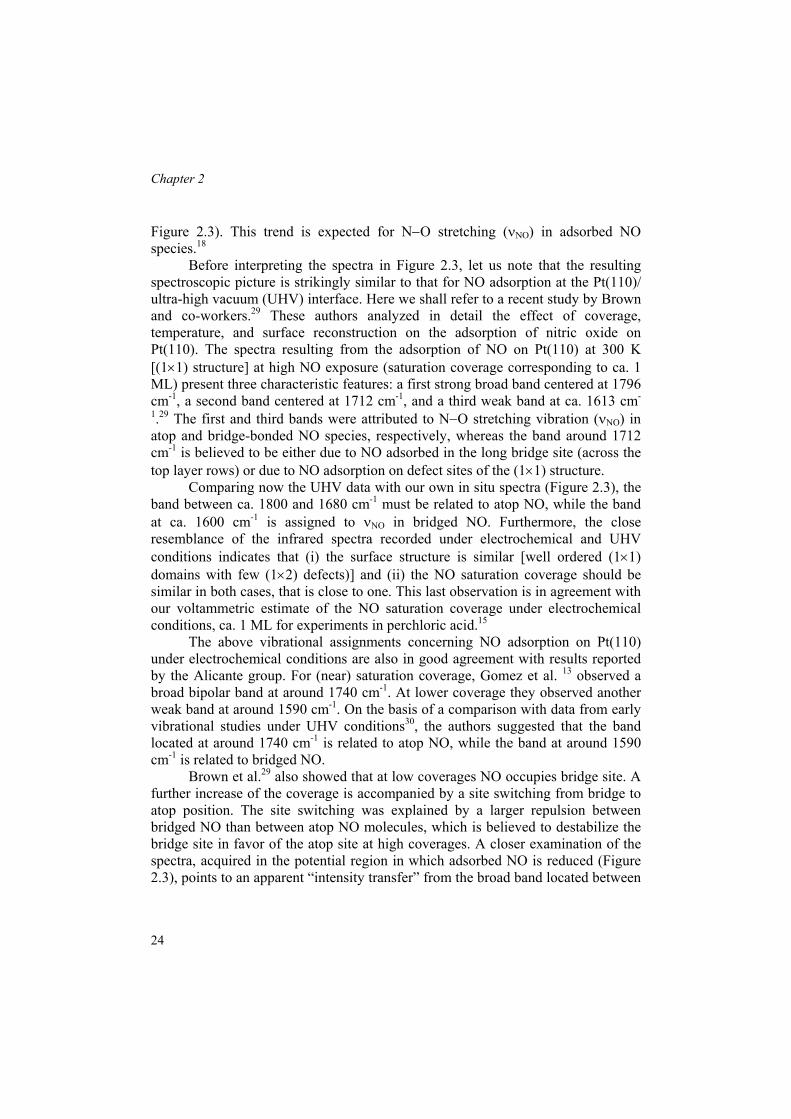
stripping of NO adlayers on Pt(110). Figure 2.1 shows the stripping voltammetry of saturated and subsaturated NO adlayers on Pt(110) at low scan rates. Note that the subsaturated NO adlayers were deposited by immersion in NaNO2 solution for different periods of time (see the Experimental Section for details). The voltammetric profile for the reduction of a saturated NO adlayer in sulfuric acid exhibits three characteristic peaks: E1
110 at ca. 0.33 V, E2110 at ca. 0.23 V, and E3
110 at ca. 0.11 V. The third reduction peak (E3
110) is assumed to correspond mainly to the hydrogen underpotential deposition (Hupd). Accordingly, the charge associated with this peak is similar to the charge for the Hupd/(bi)sulfate adsorption and desorption on clean Pt(110). Next, the position and charge of this peak are only
20
Electrocatalytic reduction of NO adlayers on Pt(110) and Pt(100) in acidic media: evidence for adsorption site – specific reduction
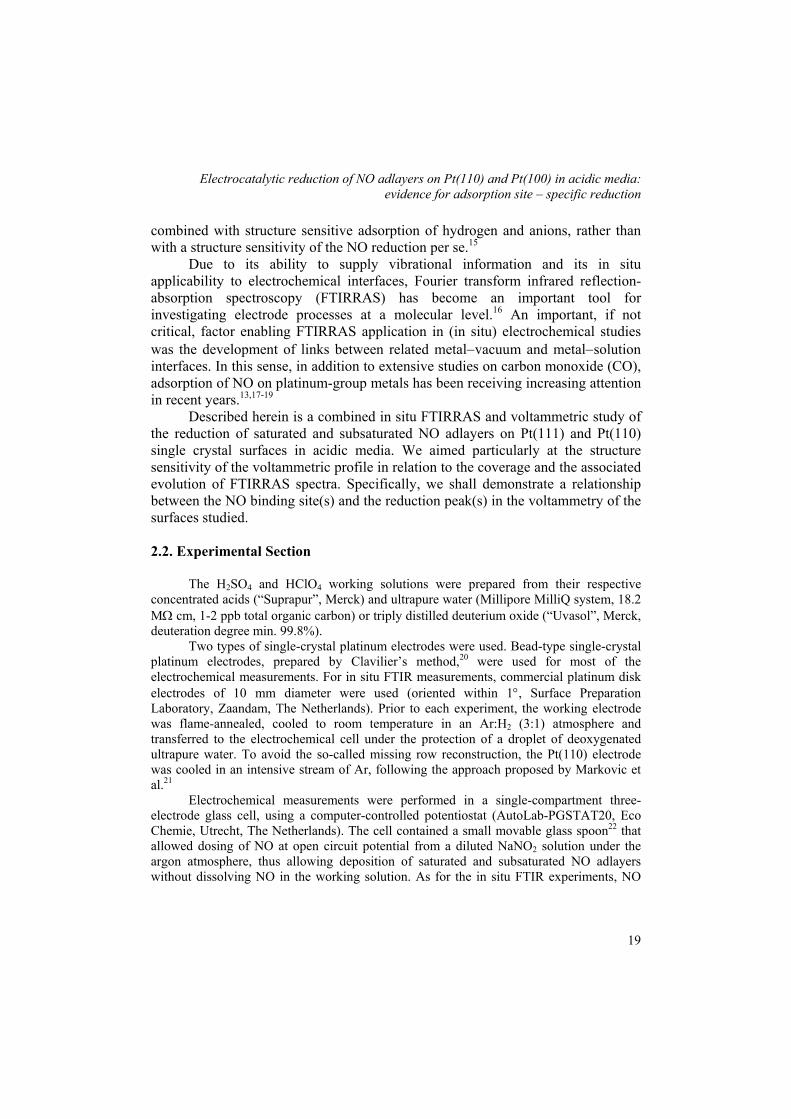
slightly affected by the initial coverage of NO. The shift of the position of peak E3
110, as compared to that for a clean surface, and the apparent irreversibility (Tafel slope of 32 mV decade-1) is most probably related to some residual NO left on the surface. The inset of Figure 2.1 shows the stripping voltammetry for the reduction of a saturated NO adlayers in perchloric acid (solid line). In perchloric acid the main reduction peak involves more charge than in sulfuric acid, whereas peaks E1
110 and E2110 significantly overlap. Note that in perchloric acid both reduction
peaks are positioned slightly more positively than those in sulfuric acid, thus indicating an effect of the (bi)sulfate coadsorption for experiments in sulfuric acid. As argued elsewhere,15 it would be reasonable to assume that in perchloric acid practically all adsorbed NO is stripped off at ca. 0.2 V, whereas in sulfuric acid a small amount of NO may be still present at this potential.
0.0 0.2 0.4 0.6-15
-10
-5
0
5
10
15
0.34 ML 0.47 ML 0.50 ML 0.64 ML 0.70 ML
E3110
E2110
E1110
j /
µA c
m-2
E / V vs RHE
0.0 0.2 0.4
-20
-10
0
HClO4 blank
Figure 2.1. Cyclic voltammograms for the reduction of NO adlayers having different initial coverage (as indicated by the numbers in the legend) on Pt(110) in 0.5 M H2SO4 at 2 mV s-1. The bold solid line is the voltammogram for the reduction of a saturated NO adlayer; the solid line is the Pt(110) blank voltammetry. The inset shows the voltammetry for the reduction of a saturated NO adlayer (the solid line) on Pt(110) and the blank voltammetric profile (the dotted line) in 0.5 M HClO4 at 2 mV s-1.
Figure 2.1 also shows that peak E3
110 does not exhibit a significant change in charge with the initial NO coverage, which is in agreement with assigning this feature to the Hupd/(bi)sulfate adsorption and desorption. Nevertheless, the peak position shifts slightly negatively with increasing NO coverage. The charge corresponding to the first two reduction peaks increases with increasing NO coverage, while their positions remain the same. Importantly, the reduction peak E2
110 is “saturated” at intermediate NO coverage, while the charge under the main
21

Chapter 2
peak (E1110) increases until the maximum NO coverage [ca. 0.7−1 monolayers
(ML)]15 is reached. This observation suggests that the two reduction features are rather due to NO reduction at different adsorption sites than due to different (consecutive) processes.
0.0 0.2 0.4 0.6-15
-10
-5
0
5
10
15
0.27 V 0.16 V 0.05 V
E3110
E2110
E1110
j /
µA c
m-2
E / V vs RHE
Figure 2.2. Cyclic voltammograms showing the independent removal of the voltammetric features characteristic to NO reduction on Pt(110) (see text for details). Experimental conditions: 0.5 M H2SO4; 2 mV s-1. Numbers in the legend indicate the lower potential limit of the corresponding CVs. The bold solid line is voltammogram for the reduction of a saturated NO adlayer; the solid line is the Pt(110) blank voltammetry.
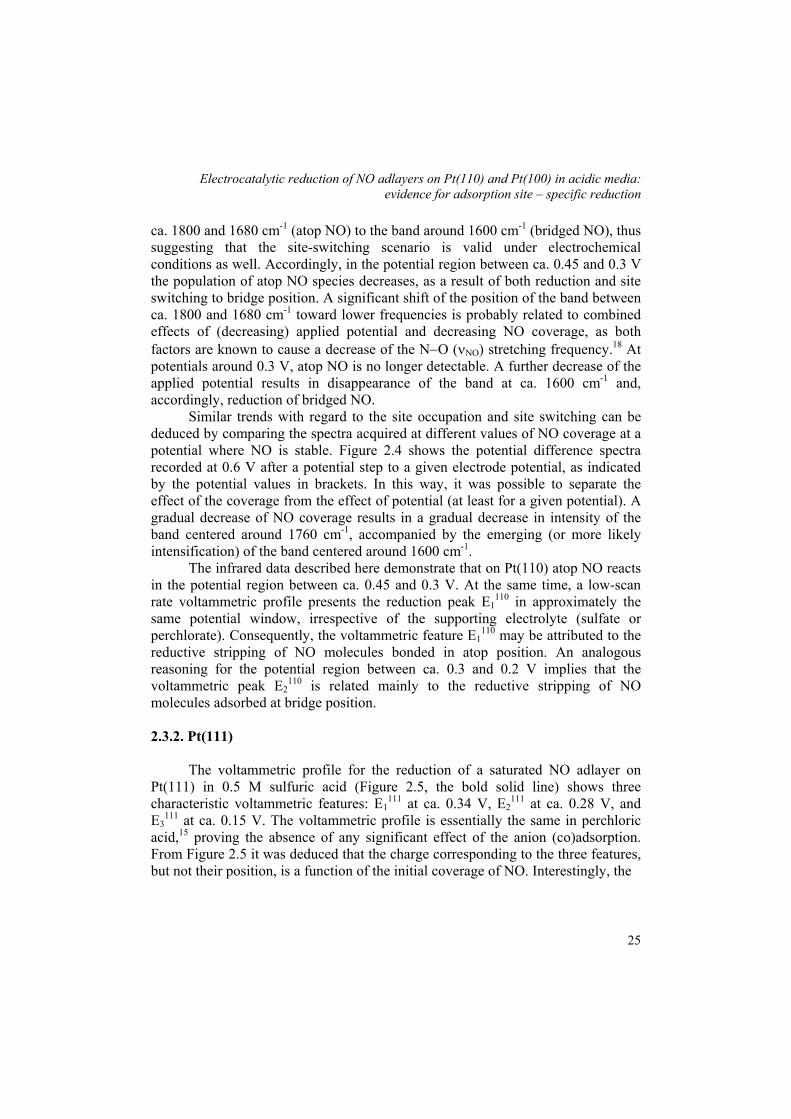
If the voltammetric peaks E1
110 and E2110 were due to reduction of NO
molecules at different adsorption sites, it would be interesting to see if those features could be removed independently. The experimental results shown in Figure 2.2 demonstrate that this is indeed the case. Three voltammetric runs were performed, starting with 0.5 V, and recorded one after another, with decreasing the lower potential limit (as indicated by the numbers in the figure). Note that the voltammetric features cannot be reduced completely independently, because they partially overlap. Significantly, the position and charge of voltammetric peak E3
110 is not affected by this experiment as compared to the profile for an uninterrupted stripping of a saturated NO adlayer (Figure 2.2, the bold solid line). This result is in good agreement with the above interpretation of this feature. Finally, the same experiment in perchloric acid gives the same result: the voltammetric peaks E1
110 and E2
110 can be reduced consecutively and independently, and therefore can be attributed to the reduction of adsorbed NO at different adsorption sites.
22

Electrocatalytic reduction of NO adlayers on Pt(110) and Pt(100) in acidic media: evidence for adsorption site – specific reduction
1600 1800 2000
1761
1582
17701712
1600
E / V
0.60
0.55
0.50
0.40
0.35
0.30
0.70
0.0025 a.u.
(R - R
0) / R
0
Wavenumber / cm-1
1600 1800 2000
1600 cm-1
0.60 (0.25)1594 cm-1
E / V
0.60 (0.10)
0.60 (0.20)
0.60 (0.30)
0.60 (0.40)
0.60 (0.50)
0.0025 a.u.
(R - R 0
) / R
0
Wavenumber / cm-1
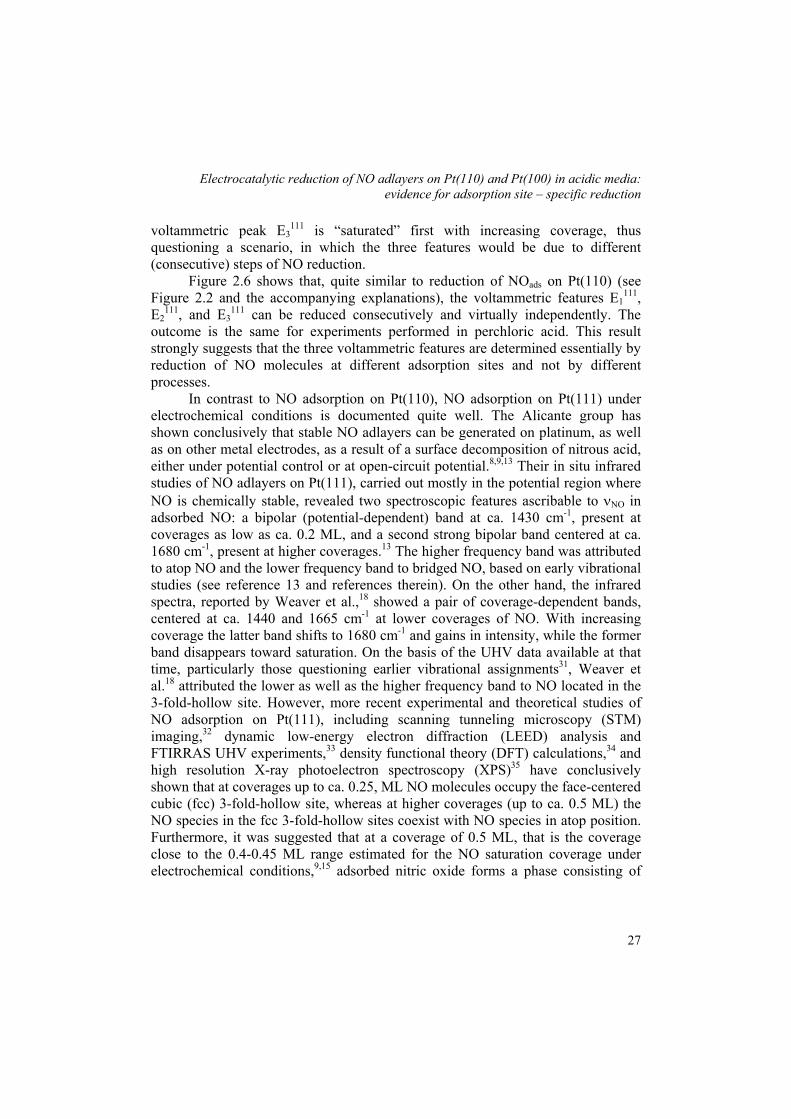
Figure 2.3. (left panel) The potential-difference infrared spectra acquired at a Pt(110) electrode covered with a preadsorbed NO adlayer. Numbers indicate the applied electrode potential on the RHE scale. Experimental conditions: 0.1 M HClO4 (in D2O), reference potential 0.1 V, p-polarized light. Figure 2.4. (right panel) The potential-difference infrared spectra acquired at a Pt(110) electrode covered with NO adlayers at different coverage, as obtained by partial reductive stripping. All spectra were recorded at 0.60 V. Numbers in parentheses indicate the potential to which the potential was stepped prior to recording the spectrum at 0.60 V (see text for details). Experimental conditions: 0.1 M HClO4 (in D2O), reference potential 0.1 V, p-polarized light.
Turning now to the spectroscopic data on NO reduction on Pt(110), Figure
2.3 shows a series of spectra for a (initially) saturated NO adlayer on Pt(110) electrode. To obtain unipolar (better-defined) bands, the reference potential was chosen at 0.1 V, i.e. the potential where NO is stripped off completely, as deduced from the CV data (see above). In the potential region in which chemisorbed NO is stable (between ca. 0.7 and 0.45 V), the spectra show two characteristic absorption bands: a broad band between ca. 1800 and 1680 cm-1 with the maximum contribution around 1770 cm-1 and a weaker band at around 1600 cm-1. The two bands are not present in spectra acquired by using s-polarized light under the same experimental conditions, thus indicating that the two bands originate from adsorbed species, namely, adsorbed NO. At the same time, the two spectroscopic features mentioned show a weak, though significant, dependence of the applied potential. Accordingly, in the potential region of NO stability the maximum of both bands slightly shifts toward lower wavenumbers with decreasing applied potential (see
23
Chapter 2
Figure 2.3). This trend is expected for N−O stretching (νNO) in adsorbed NO species.18
Before interpreting the spectra in Figure 2.3, let us note that the resulting spectroscopic picture is strikingly similar to that for NO adsorption at the Pt(110)/ ultra-high vacuum (UHV) interface. Here we shall refer to a recent study by Brown and co-workers.29 These authors analyzed in detail the effect of coverage, temperature, and surface reconstruction on the adsorption of nitric oxide on Pt(110). The spectra resulting from the adsorption of NO on Pt(110) at 300 K [(1×1) structure] at high NO exposure (saturation coverage corresponding to ca. 1 ML) present three characteristic features: a first strong broad band centered at 1796 cm-1, a second band centered at 1712 cm-1, and a third weak band at ca. 1613 cm-
1.29 The first and third bands were attributed to N−O stretching vibration (νNO) in atop and bridge-bonded NO species, respectively, whereas the band around 1712 cm-1 is believed to be either due to NO adsorbed in the long bridge site (across the top layer rows) or due to NO adsorption on defect sites of the (1×1) structure.
Comparing now the UHV data with our own in situ spectra (Figure 2.3), the band between ca. 1800 and 1680 cm-1 must be related to atop NO, while the band at ca. 1600 cm-1 is assigned to νNO in bridged NO. Furthermore, the close resemblance of the infrared spectra recorded under electrochemical and UHV conditions indicates that (i) the surface structure is similar [well ordered (1×1) domains with few (1×2) defects)] and (ii) the NO saturation coverage should be similar in both cases, that is close to one. This last observation is in agreement with our voltammetric estimate of the NO saturation coverage under electrochemical conditions, ca. 1 ML for experiments in perchloric acid.15
The above vibrational assignments concerning NO adsorption on Pt(110) under electrochemical conditions are also in good agreement with results reported by the Alicante group. For (near) saturation coverage, Gomez et al. 13 observed a broad bipolar band at around 1740 cm-1. At lower coverage they observed another weak band at around 1590 cm-1. On the basis of a comparison with data from early vibrational studies under UHV conditions30, the authors suggested that the band located at around 1740 cm-1 is related to atop NO, while the band at around 1590 cm-1 is related to bridged NO.
Brown et al.29 also showed that at low coverages NO occupies bridge site. A further increase of the coverage is accompanied by a site switching from bridge to atop position. The site switching was explained by a larger repulsion between bridged NO than between atop NO molecules, which is believed to destabilize the bridge site in favor of the atop site at high coverages. A closer examination of the spectra, acquired in the potential region in which adsorbed NO is reduced (Figure 2.3), points to an apparent “intensity transfer” from the broad band located between
24
Electrocatalytic reduction of NO adlayers on Pt(110) and Pt(100) in acidic media: evidence for adsorption site – specific reduction
ca. 1800 and 1680 cm-1 (atop NO) to the band around 1600 cm-1 (bridged NO), thus suggesting that the site-switching scenario is valid under electrochemical conditions as well. Accordingly, in the potential region between ca. 0.45 and 0.3 V the population of atop NO species decreases, as a result of both reduction and site switching to bridge position. A significant shift of the position of the band between ca. 1800 and 1680 cm-1 toward lower frequencies is probably related to combined effects of (decreasing) applied potential and decreasing NO coverage, as both factors are known to cause a decrease of the N−O (νNO) stretching frequency.18 At potentials around 0.3 V, atop NO is no longer detectable. A further decrease of the applied potential results in disappearance of the band at ca. 1600 cm-1 and, accordingly, reduction of bridged NO.
Similar trends with regard to the site occupation and site switching can be deduced by comparing the spectra acquired at different values of NO coverage at a potential where NO is stable. Figure 2.4 shows the potential difference spectra recorded at 0.6 V after a potential step to a given electrode potential, as indicated by the potential values in brackets. In this way, it was possible to separate the effect of the coverage from the effect of potential (at least for a given potential). A gradual decrease of NO coverage results in a gradual decrease in intensity of the band centered around 1760 cm-1, accompanied by the emerging (or more likely intensification) of the band centered around 1600 cm-1.
The infrared data described here demonstrate that on Pt(110) atop NO reacts in the potential region between ca. 0.45 and 0.3 V. At the same time, a low-scan rate voltammetric profile presents the reduction peak E1
110 in approximately the same potential window, irrespective of the supporting electrolyte (sulfate or perchlorate). Consequently, the voltammetric feature E1
110 may be attributed to the reductive stripping of NO molecules bonded in atop position. An analogous reasoning for the potential region between ca. 0.3 and 0.2 V implies that the voltammetric peak E2
110 is related mainly to the reductive stripping of NO molecules adsorbed at bridge position.
2.3.2. Pt(111)
The voltammetric profile for the reduction of a saturated NO adlayer on
Pt(111) in 0.5 M sulfuric acid (Figure 2.5, the bold solid line) shows three characteristic voltammetric features: E1
111 at ca. 0.34 V, E2111 at ca. 0.28 V, and
E3111 at ca. 0.15 V. The voltammetric profile is essentially the same in perchloric
acid,15 proving the absence of any significant effect of the anion (co)adsorption. From Figure 2.5 it was deduced that the charge corresponding to the three features, but not their position, is a function of the initial coverage of NO. Interestingly, the
25

Chapter 2
0.0 0.2 0.4 0.6
-8
-4
0
4
0.30 ML 0.36 ML 0.40 ML 0.43 ML
E3111
E2111
E1111j
/ µA
cm
-2
E / V vs RHE
Figure 2.5. Cyclic voltammograms for the reduction of NO adlayers at different initial coverage (as indicated by the numbers in the legend) on Pt(111) in 0.5 M H2SO4 at 2 mV s-1. The bold solid line is the voltammogram for the reduction of a saturated NO adlayer; the solid line is the Pt(111) blank voltammetry.
0.0 0.2 0.4 0.6
-10
-5
0
5
0.33 V 0.22 V 0.65 V
E3111
E2111
E1111
j /
µA c
m-2
E / V vs RHE
Figure 2.6. Cyclic voltammograms showing the independent removal of the voltammetric features characteristic to NO reduction on Pt(111) (see text for details). Experimental conditions: 0.5 M H2SO4; 2 mV s-1. Numbers in the legend indicate the lower potential limit of the corresponding CVs. The bold solid line is the voltammogram for the reduction of a saturated NO adlayer; the solid (thin) line is the Pt(111) blank voltammetry.
26
Electrocatalytic reduction of NO adlayers on Pt(110) and Pt(100) in acidic media: evidence for adsorption site – specific reduction
voltammetric peak E3111 is “saturated” first with increasing coverage, thus
questioning a scenario, in which the three features would be due to different (consecutive) steps of NO reduction.
Figure 2.6 shows that, quite similar to reduction of NOads on Pt(110) (see Figure 2.2 and the accompanying explanations), the voltammetric features E1
111, E2
111, and E3111 can be reduced consecutively and virtually independently. The
outcome is the same for experiments performed in perchloric acid. This result strongly suggests that the three voltammetric features are determined essentially by reduction of NO molecules at different adsorption sites and not by different processes.
In contrast to NO adsorption on Pt(110), NO adsorption on Pt(111) under electrochemical conditions is documented quite well. The Alicante group has shown conclusively that stable NO adlayers can be generated on platinum, as well as on other metal electrodes, as a result of a surface decomposition of nitrous acid, either under potential control or at open-circuit potential.8,9,13 Their in situ infrared studies of NO adlayers on Pt(111), carried out mostly in the potential region where NO is chemically stable, revealed two spectroscopic features ascribable to νNO in adsorbed NO: a bipolar (potential-dependent) band at ca. 1430 cm-1, present at coverages as low as ca. 0.2 ML, and a second strong bipolar band centered at ca. 1680 cm-1, present at higher coverages.13 The higher frequency band was attributed to atop NO and the lower frequency band to bridged NO, based on early vibrational studies (see reference 13 and references therein). On the other hand, the infrared spectra, reported by Weaver et al.,18 showed a pair of coverage-dependent bands, centered at ca. 1440 and 1665 cm-1 at lower coverages of NO. With increasing coverage the latter band shifts to 1680 cm-1 and gains in intensity, while the former band disappears toward saturation. On the basis of the UHV data available at that time, particularly those questioning earlier vibrational assignments31, Weaver et al.18 attributed the lower as well as the higher frequency band to NO located in the 3-fold-hollow site. However, more recent experimental and theoretical studies of NO adsorption on Pt(111), including scanning tunneling microscopy (STM) imaging,32 dynamic low-energy electron diffraction (LEED) analysis and FTIRRAS UHV experiments,33 density functional theory (DFT) calculations,34 and high resolution X-ray photoelectron spectroscopy (XPS)35 have conclusively shown that at coverages up to ca. 0.25, ML NO molecules occupy the face-centered cubic (fcc) 3-fold-hollow site, whereas at higher coverages (up to ca. 0.5 ML) the NO species in the fcc 3-fold-hollow sites coexist with NO species in atop position. Furthermore, it was suggested that at a coverage of 0.5 ML, that is the coverage close to the 0.4-0.45 ML range estimated for the NO saturation coverage under electrochemical conditions,9,15 adsorbed nitric oxide forms a phase consisting of
27

Chapter 2
one atop and one 3-fold-hollow site NO per (2×2) Pt(111) unit cell. The recent vibrational assignments33,34 point to atop NO being responsible for the high frequency band (ca. 1715 cm-1), whereas the low frequency band (ca. 1490 cm-1) is attributed to NOads in the fcc 3-fold-hollow site. The maximum coverage reported under UHV conditions (0.75 ML) is unlikely to be achieved under electrochemical conditions.
1400 1600 1800 2000
1645 cm-1
1671 cm-1
1680 cm-1
1584 cm-1
E / V
0.60
0.55
0.50
0.45
0.40
0.35
0.30
0.15
0.005 a.u.
(R - R
0) / R
0
Wavenumber / cm-1
1600 1700 1800 1900
0.60 (0.30)
0.60 (0.35)
0.60 (0.40)
0.60 (0.50)
E / V
0.60 (0.60)
0.004 a.u.
(R - R 0
) / R
0
Wavenumber / cm-1
Figure 2.7. (left panel) The potential-difference infrared spectra acquired at a Pt(111) electrode covered with a preadsorbed NO adlayer. Numbers indicate the applied electrode potential on the RHE scale. Experimental conditions: 0.1 M HClO4 (in D2O), reference potential 0.1 V, p-polarized light. Figure 2.8. (right panel) The potential-difference infrared spectra acquired at a Pt(111) electrode covered with NO adlayers at different coverages, as obtained by partial reductive stripping. All spectra were recorded at 0.60 V. Numbers in parentheses indicate the potential to which the potential was stepped prior to recording the spectrum at 0.60 V. Experimental conditions: 0.1 M HClO4 (in D2O), reference potential 0.1 V, p-polarized light.
Turning now to our own experimental infrared data, Figure 2.7 shows a set
of the potential-difference spectra for a (initially) saturated NO adlayer on Pt(111) electrode. In light of the above discussion, the potential dependent band centered at ca. 1680 cm-1 was attributed to νNO in the atop NO species. Under the conditions of the experiment shown in Figure 2.7, it is very difficult to detect and follow the evolution of the low frequency band corresponding to 3-fold-hollow NO, as this band is strongly masked by a broad feature between ca. 1400 and 1500 cm-1. This band is determined by a solution species, most probably a product of the reduction
28
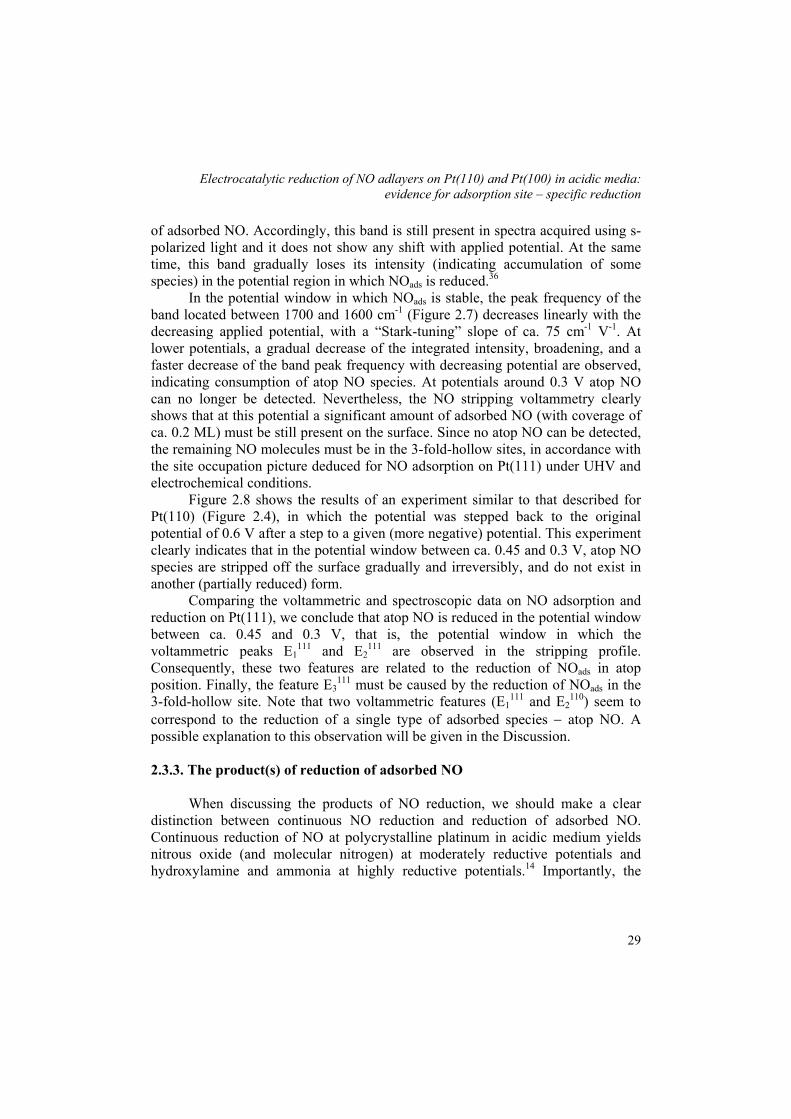
Electrocatalytic reduction of NO adlayers on Pt(110) and Pt(100) in acidic media: evidence for adsorption site – specific reduction
of adsorbed NO. Accordingly, this band is still present in spectra acquired using s-polarized light and it does not show any shift with applied potential. At the same time, this band gradually loses its intensity (indicating accumulation of some species) in the potential region in which NOads is reduced.36
In the potential window in which NOads is stable, the peak frequency of the band located between 1700 and 1600 cm-1 (Figure 2.7) decreases linearly with the decreasing applied potential, with a “Stark-tuning” slope of ca. 75 cm-1 V-1. At lower potentials, a gradual decrease of the integrated intensity, broadening, and a faster decrease of the band peak frequency with decreasing potential are observed, indicating consumption of atop NO species. At potentials around 0.3 V atop NO can no longer be detected. Nevertheless, the NO stripping voltammetry clearly shows that at this potential a significant amount of adsorbed NO (with coverage of ca. 0.2 ML) must be still present on the surface. Since no atop NO can be detected, the remaining NO molecules must be in the 3-fold-hollow sites, in accordance with the site occupation picture deduced for NO adsorption on Pt(111) under UHV and electrochemical conditions.
Figure 2.8 shows the results of an experiment similar to that described for Pt(110) (Figure 2.4), in which the potential was stepped back to the original potential of 0.6 V after a step to a given (more negative) potential. This experiment clearly indicates that in the potential window between ca. 0.45 and 0.3 V, atop NO species are stripped off the surface gradually and irreversibly, and do not exist in another (partially reduced) form.
Comparing the voltammetric and spectroscopic data on NO adsorption and reduction on Pt(111), we conclude that atop NO is reduced in the potential window between ca. 0.45 and 0.3 V, that is, the potential window in which the voltammetric peaks E1
111 and E2111 are observed in the stripping profile.
Consequently, these two features are related to the reduction of NOads in atop position. Finally, the feature E3
111 must be caused by the reduction of NOads in the 3-fold-hollow site. Note that two voltammetric features (E1
111 and E2110) seem to
correspond to the reduction of a single type of adsorbed species − atop NO. A possible explanation to this observation will be given in the Discussion.
2.3.3. The product(s) of reduction of adsorbed NO
When discussing the products of NO reduction, we should make a clear
distinction between continuous NO reduction and reduction of adsorbed NO. Continuous reduction of NO at polycrystalline platinum in acidic medium yields nitrous oxide (and molecular nitrogen) at moderately reductive potentials and hydroxylamine and ammonia at highly reductive potentials.14 Importantly, the
29

Chapter 2
presence of NO in solution is crucial for the production of nitrous oxide (and molecular nitrogen).37
In absence of any NO in solution, formation of both ammonia and hydroxylamine is possible. However recent studies on the reduction of NO adlayers on polycrystalline and single-crystal platinum electrodes point to ammonia as the main product.9,13-15,38,39 A comparative analysis of NO adsorption on low-index single crystal platinum surfaces indicates a remarkable concordance in the vibrational frequencies of saturated NO adlayers in electrochemical and UHV environments.18 Therefore, it would be reasonable to expect the adlayer structure and coverages to be similar on the corresponding surfaces in two cases, at least at room temperature (see also FTIR results on NO adsorption on Pt(110) in this study). Accordingly, an accurate analysis of the voltammetric charge gives coverages reasonably close to those under UHV conditions, provided that ammonia is assumed to be the product of the reductive stripping of NOads.9,13,15,39 Finally, if any appreciable amount of hydroxylamine would be produced upon reduction of NO adlayers, unrealistically high saturation coverages would be implied (see ref 15 for a detailed discussion).
Parts A and B of Figure 2.9 show potential difference spectra for (initially) saturated NO adlayers on Pt(111) and Pt(110) surfaces, respectively, acquired with s-polarized light and in water. The broad absorption band around 1460 cm-1 is determined by a species in solution and is clearly related to reduction of adsorbed NO. Thus, the intensity of this band is constant in the potential region in which NO adsorbate is stable and loses in intensity (formation of a product) in the potential region in which NOads is reduced on the corresponding surfaces. Both ammonia and hydroxylamine can contribute to this spectral region.40 However voltammetric results shown in Figures 2.1, 2.2, 2.5, and 2.6 clearly indicate the stripping of NO adlayer and virtually complete recovery of the corresponding blank CVs, thus excluding formation of a significant amount of electrochemically active species, which is hydroxylamine. Therefore, the absorption band centered around 1460 cm-1 can be attributed to –(NH3) (δs) mode in NH4
+.41 These results strongly suggest that ammonia is the main product of NO reduction on Pt(111) and Pt(110), presumably irrespective of the coverage.
2.3.4. Discussion
The experimental data and considerations given in the previous section point
to a prominent role of the NO adsorption mode in defining the voltammetric response corresponding to the reductive stripping of nitric oxide adlayers. Accordingly, the voltammetric features observed for NOads reduction on Pt(111)
30

Electrocatalytic reduction of NO adlayers on Pt(110) and Pt(100) in acidic media: evidence for adsorption site – specific reduction
and Pt(110) (and presumably those on stepped Pt[n(111)×(111)] surfaces as well) are determined essentially by reduction of species occupying different adsorption sites and not by different (consecutive) processes (reaction steps). The linearly-bonded (atop) NO molecules seem to be more reactive than multifold-coordinated NO molecules, whatever the surface orientation. The potential windows in which linearly-bonded NO, on one hand, and multifold-coordinated NO molecules, on the other hand, react on different surfaces are very much the same: compare the positions of features E1
110, E1111 and E2
111 (atop NO) and E2110 and E3
111 (multifold-coordinated NO), Figures 2.1 and 2.5.
1400 1600 1800
A~ 1460 cm-1
E / V
0.60
0.15
0.50
0.40
0.70
0.30
0.005 a.u.
(R - R
0) / R
0
Wavenumber / cm-1
1400 1600 1800
B~ 1460 cm-1
E / V
0.60
0.20
0.50
0.40
0.70
0.30
0.15
0.01 a.u.
(R - R
0) / R
0
Wavenumber / cm-1
Figure 2.9. The potential-difference infrared spectra acquired at a Pt(111) (A) and Pt(110) (B) electrode covered with a preadsorbed NO adlayer in the 1350-1900 wavenumber region. Numbers indicate the applied electrode potential on the RHE scale. Experimental conditions: 0.1 M HClO4 (in H2O), reference potential 0.1 V, s-polarized light.
It is important to emphasize that these observations alone do not allow
deducing the actual reaction site. The actual reaction site may be an ensemble of sites. For example, an elementary reaction step may require additional adsorption site(s), e.g. for the breaking of the N−O bond (see Chapter 3 for details).
The voltammetric features E1111 and E2
111 (Figures 2.5 and 2.6) were both ascribed to the reductive stripping of atop NO species, on the basis of the associated evolution of the FTIR spectra (section 2.3.2). Apparently, these two spectroscopically indiscernible (atop) species show some differences in their reactivity. This response may be tentatively ascribed to different local environment
31

Chapter 2
of the atop NO species within well-ordered domains of the NO adlayer (0.5 ML, 2 NO molecules per (2×2) unit cell)32-34 and the atop NO species within somewhat disordered domains. Indeed, even under UHV conditions, the well-ordered phase corresponding to NO coverage of 0.5 ML requires special conditions (annealing of NO saturated surface at 225 K).33 Therefore, a highly ordered NO phase corresponding to 0.5 ML is unlikely to be achieved under electrochemical conditions, in which even more interfering factors may intervene.
Interestingly, a comparison of NO reduction on Pt(111), Pt(110) and Pt[n(111)×(111)] stepped surfaces shows that NO adlayers are reduced in the same potential region between ca. 0.4 and 0.15 V, with little effect of coverage or anion adsorption. This observation, taken together with the fact that NO reduction on Pt(100) takes place in the same potential region (reduction features between ca. 0.3 and 0.2 V),13 with little effect of coverage and anion coadsorption,42 suggests that differences in the surface structure of platinum electrocatalyst do not result in clear-cut differences in rate (overpotential) of NOads reduction. In other words, there is little structure sensitivity with regard to the (overall) kinetics of the process.
The reduction of atop and bridged NO (features E1110, E2
110, E1111 and E2
111) proceed in the absence of any adsorbed hydrogen or at a very low coverage of coadsorbed hydrogen, thus confirming the electrochemical hydrogenation mechanism, that is, through combined electron−proton transfer (as expressed in eqs 2.1 and 2.2)). The experimental Tafel slopes for the voltammetric features E1
110, E2
110, E1111 and E2
111 (Pt(110), Pt(111), and Pt[n(111)×(111)] surfaces) are all close to 40 mV decade-1, thus indicating the second electron transfer to be the rate-determining step (see the reaction scheme 2.1-2.3).15 On the other hand, the reduction of NO species adsorbed at the 3-fold-hollow site of (111) terraces (E3
111) is characterized by the Tafel slope of 120 mV decade-1 and occurs in the presence of a considerable amount of coadsorbed H, thus raising the question of its role in the process. Indeed, it is not obvious that the reaction scheme (2.1-2.3) is valid in this case as well. It is noteworthy that the reductive stripping of NO adlayers on Pt(100) occurs in a potential region corresponding to high coverage of adsorbed H as well.13 Therefore, in the presence of adsorbed hydrogen, the reduction of adsorbed NO may, in principle, follow another mechanism that could involve catalytic (Langmuir−Hinshelwood-type) hydrogenation steps. Another factor contributing to the complexity of the issue of structure sensitivity of the electrochemical reduction of NOads is the mechanism of the N−O bond breaking. At the metal−vacuum interface, the N−O bond breaking is a structure-sensitive reaction step that requires an ensemble of adsorption sites.43 This may be the case
32
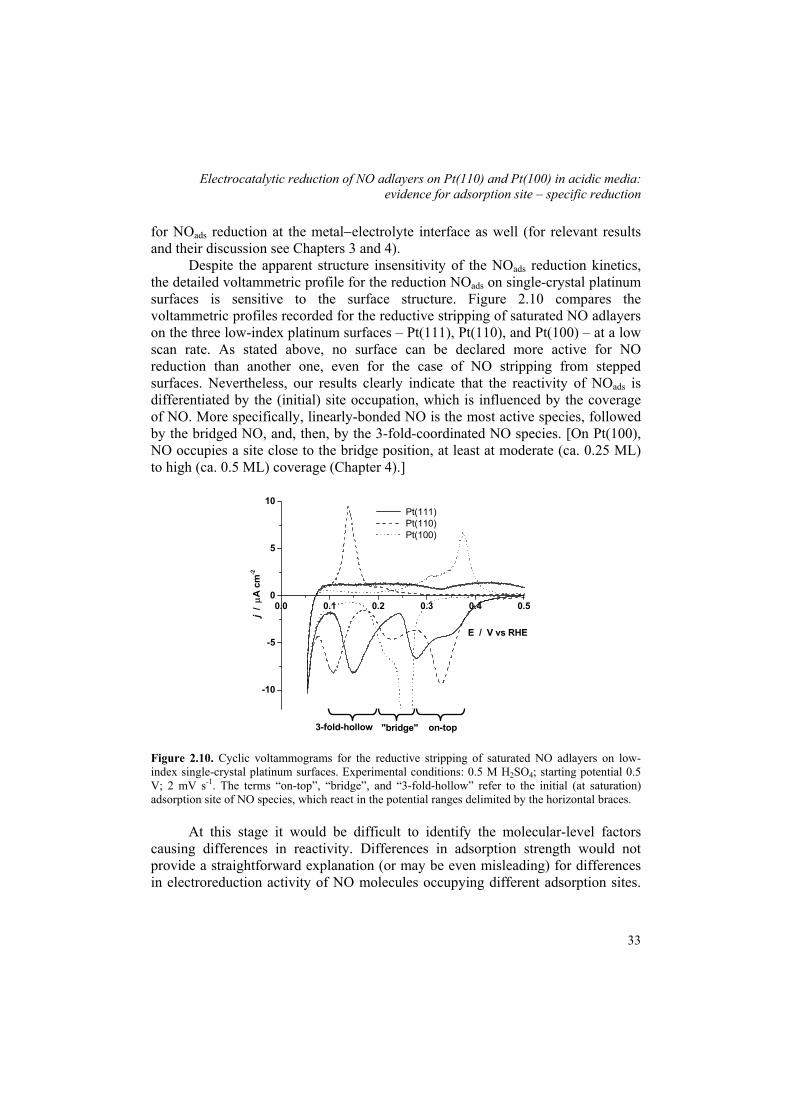
Electrocatalytic reduction of NO adlayers on Pt(110) and Pt(100) in acidic media: evidence for adsorption site – specific reduction
for NOads reduction at the metal−electrolyte interface as well (for relevant results and their discussion see Chapters 3 and 4).
Despite the apparent structure insensitivity of the NOads reduction kinetics, the detailed voltammetric profile for the reduction NOads on single-crystal platinum surfaces is sensitive to the surface structure. Figure 2.10 compares the voltammetric profiles recorded for the reductive stripping of saturated NO adlayers on the three low-index platinum surfaces – Pt(111), Pt(110), and Pt(100) – at a low scan rate. As stated above, no surface can be declared more active for NO reduction than another one, even for the case of NO stripping from stepped surfaces. Nevertheless, our results clearly indicate that the reactivity of NOads is differentiated by the (initial) site occupation, which is influenced by the coverage of NO. More specifically, linearly-bonded NO is the most active species, followed by the bridged NO, and, then, by the 3-fold-coordinated NO species. [On Pt(100), NO occupies a site close to the bridge position, at least at moderate (ca. 0.25 ML) to high (ca. 0.5 ML) coverage (Chapter 4).]
0.0 0.1 0.2 0.3 0.4 0.5
-10
-5
0
5
10
3-fold-hollow "bridge" on-top
Pt(111) Pt(110) Pt(100)
j /
µA c
m-2
E / V vs RHE
Figure 2.10. Cyclic voltammograms for the reductive stripping of saturated NO adlayers on low-index single-crystal platinum surfaces. Experimental conditions: 0.5 M H2SO4; starting potential 0.5 V; 2 mV s-1. The terms “on-top”, “bridge”, and “3-fold-hollow” refer to the initial (at saturation) adsorption site of NO species, which react in the potential ranges delimited by the horizontal braces.
At this stage it would be difficult to identify the molecular-level factors
causing differences in reactivity. Differences in adsorption strength would not provide a straightforward explanation (or may be even misleading) for differences in electroreduction activity of NO molecules occupying different adsorption sites.
33

Chapter 2
An important observation to be taken into consideration here is that the first two steps of the process are likely to be electrochemical steps (proton/electron transfers),15 certainly for the reduction of atop NO species on the planes examined. This could mean that the adsorbate ability to take part in an acid-base equilibrium (accompanying the electron transfer) and the stability of the resulting intermediates may determine the reactivity NOads species at different adsorption sites.
The structure sensitivity of the electrocatalytic reduction of NOads on platinum may be compared to the structure sensitivity of the extensively studied electrooxidation of carbon monoxide. Despite differences in the nature and mechanism of these processes, their structure sensitivity allows us to draw a number of interesting parallels. CO oxidation is a mechanistically structure-insensitive process. The Langmuir−Hinshelwood-type reaction between COads and OHads is commonly perceived as the rate-determining step, which is then followed by a decay of the resulting intermediate to CO2. In contrast to NO reduction, CO oxidation is a strongly structure-sensitive process with regard to the kinetics of the process. On Pt[n(111)×(111)] stepped surfaces, for instance, at moderately oxidative potentials, CO oxidation takes place preferentially at steps, which is related to the availability of OHads species, which are formed readily on steps.24-26,44 Due to its high mobility on (111) terraces, CO diffuses toward and reacts exclusively at steps (or defects in general). Under certain circumstances, the voltammetric profile of COads oxidative stripping may also exhibit several features. However, these features are not related to the oxidation of CO at specific adsorption sites.45 In contrast to CO oxidation, reduction of NOads proceeds at (or near) the site the molecule is initially confined to, the site occupation being determined by the surface orientation and the coverage. The step sites and terrace sites are kinetically comparable. Furthermore, the site-differentiated activity in the case of NO reduction on platinum originates from the reactivity differences of linearly- and multifold-coordinated NO species (and presumably the reactivity of the reduction intermediates as well), ultimately resulting in an adsorption site - specific reaction and, consequently, an adsorption site - specific voltammetric profile.
2.5. Conclusions The surface structure of the platinum electrocatalyst exerts a complex effect
on the electrochemical reduction of nitric oxide adlayers. The process is structure sensitive in terms of coverage-dependent site occupation. On Pt(111) and Pt(110) surfaces, linearly-bonded NO species are more reactive than multifold-bonded NO
34
Electrocatalytic reduction of NO adlayers on Pt(110) and Pt(100) in acidic media: evidence for adsorption site – specific reduction
species. On the basis of voltammetric and spectroscopic evidence, it was shown that different features observed in the voltammetric profile for the reductive stripping of NO adlayers on the two surfaces are related to the reduction of NO molecules at different adsorption sites and not to different (consecutive) processes. Furthermore, as deduced from spectroscopic and electrochemical data, ammonia is the main product of the reduction of adsorbed NO on Pt(111) and Pt(110). The site occupation by NO on Pt(110) under electrochemical conditions shows a remarkable accordance with the site occupation by NO under UHV conditions. Accordingly, electrochemical reduction of the high-coverage NO adlayers (between ca. 0.5 and 1 ML) on Pt(110) is accompanied by a site switching from atop to bridge position, the bridged NO species being somewhat less reactive than atop NO species. For the electrochemical reduction of NO adlayers on Pt(111), atop NO species and the fcc 3-fold-hollow NO species coexist at high coverages (between ca. 0.25 and 0.5 ML) and may be reduced consecutively and independently.
References
(1) Horold, S.; Vorlop, K.-D.; Tacke, T.; Sell, M. Cat. Today 1993, 17, 21. (2) Ritz, J.; Fuchs, H.; Perryman, H. G. Hydroxylamine. In Ulmann's Encyclopedia of Industrial
Chemistry, 6th ed.; Wiley: Chichester, 2000. (3) van de Moesdijk, C. G. M. The catalytic reduction of nitrite and nitric oxide to hydroxylamine:
kinetics and mechanism. Ph.D. Thesis, Eindhoven University of Technology, 1979. (4) Allen, B. W.; Piantadosi, C. A.; Coury, L. A., Jr. Nitric Oxide 2000, 4, 75. (5) Ye, S.; Hattori, H.; Kita, H. Ber. Bunsen-Ges. Phys. Chem. 1992, 73, 1884. (6) Ye, S.; Kita, H. J. Electroanal. Chem. 1993, 346, 489. (7) Rodes, A.; Gomez, R.; Orts, J. M.; Feliu, J. M.; Perez, A.; Aldaz, A. J. Electroanal. Chem. 1993,
359, 315. (8) Rodes, A.; Gomez, R.; Orts, J. M.; Feliu, J. M.; Perez, A.; Aldaz, A. Langmuir 1995, 11, 3549. (9) Rodes, A.; Gomez, R.; Perez, A.; Feliu, J. M.; Aldaz, A. Electrochim. Acta 1996, 41, 729. (10) Momoi, K.; Song, M. B.; Ito, M. J. Electroanal. Chem. 1999, 473, 43. (11) Zang, Z.-H.; Wu, Z.-L.; Yau, S.-L. J. Phys. Chem. B 1999, 103, 9624. (12) Casero, E.; Alonso, C.; Martin-Gago, J. A.; Bogatti, F.; Felici, R.; Renner, R.; Lee, T.;
Zegenhagen, J. Surf. Sci. 2002, 507-510. (13) Gomez, R.; Rodes, A.; Orts, J. M.; Feliu, J. M.; Perez, J. M. Surf. Sci. 1995, 342, L1104. (14) de Vooys, A. C. A.; Beltramo, G. L.; van Riet, B.; van Veen, J. A. R.; Koper, M. T. M.
Electrochim. Acta 2004, 49, 1307. (15) Beltramo, G. L.; Koper, M. T. M. Langmuir 2003, 19, 8907. (16) Iwasita, T.; Nart, F. C. Prog. Surf. Sci. 1997, 55, 271. (17) Villegas, I.; Gomez, R.; Weaver, M. J. J. Phys. Chem. 1995, 99, 14832. (18) Weaver, M. J.; Zou, S.; Tang, C. J. Chem. Phys. 1999, 111, 368. (19) Zou, S.; Gomez, R.; Weaver, M. J. J. Electroanal. Chem. 1999, 474, 155. (20) Clavilier, J.; Armand, D.; Sun, S. G.; Petit, M. J. Electroanal. Chem. 1986, 205, 267. (21) Markovic, N. M.; Grgur, B. N.; Lucas, C. A.; Ross, P. N. Surf. Sci. 1997, 384, L805.
35

Chapter 2
(22) Feliu, J. M.; Orts, J. M.; Fernandez-Vega, A.; Aldaz, A.; Clavilier, J. J. Electroanal. Chem. 1990, 296, 191.
(23) Iwasita, T.; Nart, F. C.; Vielstich, W. Ber. Bunsen-Ges. Phys. Chem. 1990, 94, 1030. (24) Lebedeva, N. P.; Koper, M. T. M.; Herrero, E.; Feliu, J. M.; van Santen, R. A. J. Electroanal.
Chem. 2000, 487, 37. (25) Lebedeva, N. P.; Rodes, A.; Feliu, J. M.; Koper, M. T. M.; van Santen, R. A. J. Phys. Chem. B
2002, 106, 9863. (26) Lebedeva, N. P.; Koper, M. T. M.; Feliu, J. M.; van Santen, R. A. J. Phys. Chem. B 2002, 106,
12938. (27) Gomez, R.; Clavilier, J. J. Electroanal. Chem. 1993, 354, 189. (28) Kibler, L.A.; Cuesta, A.; Kleinert, M.; Kolb, D.M. J. Electroanal. Chem. 2000, 484, 73. (29) Brown, W. A.; Sharma, R. K.; King, D. A. J. Phys. Chem. 1998, 102, 5303. (30) Gorte, R. J.; Gland, J. L. Surf. Sci. 1981, 102, 34. (31) Brown, W. A.; King, D. A. J. Phys. Chem. B 2000, 104, 2578. (32) Matsumoto, M.; Fukutani, K.; Okano, T.; Miyake, K.; Shigekawa, H.; Kato, H.; Okuyama, H.;
Kawai, M. Surf. Sci. 2000, 454-456, 101. (33) Matsumoto, M.; Tatsumi, T.; Fukutani, K.; Okano, T. Surf. Sci. 2002, 513, 485. (34) Aizawa, H.; Morikawa, Y.; Tsuneyuki, S.; Fukutani, K.; Ohno, T. Surf. Sci. 2002, 514, 394. (35) Zhu, J. F.; Kinne, M.; Fuhrmann, T.; Denecke, R.; Steinruck, H.-P. Surf. Sci. 2003, 529, 384. (36) Note that our in situ FTIR experiments were performed in D2O, although in presence of a
considerable concentration of protons (0.1 M HClO4 or H2SO4). The proton content was low enough to examine the 1500-1700 cm-1 frequency region, though apparently high enough to result in the formation of solution species, which may contribute in the frequency region between 1400 and 1500 cm-1. We identify these species as ammonium cations, containing H and D atoms in different ratios. Accordingly, theoretical calculations similar to those described elsewhere (see reference 40 for details) show that the species DNH3
+, D2NH2+, and D3NH+ contribute around 1489 cm-1 (−NH3 (δs)
mode), 1405 cm-1 (−NH2D (δs) mode), and 1457 cm-1 (−NHD scissoring mode), respectively. (37) de Vooys, A. C. A.; Koper, M. T. M.; van Santen, R. A.; van Veen, J. A. R. Electrochim. Acta
2001, 46, 923. (38) Gootzen, J. F. E.; van Hardeveld, R. M.; Visscher, W.; van Santen, R. A.; van Veen, J. A. R.
Recl. Trav. Chim. Pays-Bas 1996, 115, 480. (39) Rodes, A.; Climent, V.; Orts, J. M.; Perez, J. M.; Aldaz, A. Electrochim. Acta 1998, 44, 1077. (40) Rosca, V.; Beltramo, G. L.; Koper, M. T. M. J. Phys. Chem. B 2004, 108, 8294. (41) Silverstein, R. M.; Bassler, G. C.; Morrill, T. C. Spectrometric Identification of Organic
Compounds; John Wiley & Sons, Inc.: New York, 1991. (42) Rosca, V.; Koper, M. T. M., J. Phys. Chem. B 2005, 109, 16750. (43) Masel, R. I. Catal. Rev.-Sci. Eng. 1986, 28, 335. (44) Lebedeva, N. P.; Koper, M. T. M.; Feliu, J. M.; van Santen, R. A. J. Electroanal. Chem. 2002,
524-525, 242. (45) Markovic, N.M.; Grgur, B.N.; Lucas, C.A.; Ross, P.N. J. Phys. Chem. B 1999, 103, 487.
36

3
Rate laws for reductive stripping of NO adlayers at single-crystal platinum electrodes as deduced from transient experiments
Abstract The electrochemical reduction of nitric oxide (NO) adlayers on Pt(111) and Pt(110) surfaces has been investigated using the potential step method. The observed current transients were interpreted in terms of a kinetic model for the first- and the second-order reactions in the mean-field approximation with strong lateral interactions. Under electrochemical conditions and in the limit of saturated NO coverage, considerable repulsive interactions exist between the reacting species, having a significant effect on the chronoamperometric response of the systems examined. Accordingly, the current transients for NO reduction on Pt(111) show a hyperbolic (t−1) decay, which indicates (i) first order kinetics and (ii) strong lateral interactions. For NO reduction on Pt(111) surfaces, the experimentally assessed lateral interactions between two neighboring NO species varies between ca. 0.03 and 0.05 eV. The current transients for the reductive stripping of saturated NO adlayers on the Pt(110) surface (with atop NO as the reactive species) show a potential dependent maximum, occurring at high coverages, which indicates (i) second-order kinetics and (ii) considerable lateral interactions. The second order kinetics observed in the limit of high NO coverage was attributed to the necessity of having a neighboring free site required for breaking the N–O bond. For the reduction of (nearly) saturated NO adlayers on Pt(111) surface, the apparent first-order kinetics may be tentatively explained by the availability of the neighboring free site at all coverages of NO, as suggested by the much lower saturation coverage on Pt(111) (ca. 0.5 monolayers (ML)) compared to the saturation coverage on Pt(110) (ca. 1 ML).
This chapter is based on article by V. Rosca and M.T.M. Koper, published in Surface Science, 584 (2005) 258.
37

Chapter 3
3.1. Introduction Recent advances1 in fundamental understanding of adsorption and reactions
of NO on platinum under electrochemical conditions came largely from studies on single crystal surfaces, performed under well-defined chemical conditions.2-14 Recently, Beltramo et al.12 reported the results of a systematic voltammetric analysis of electrochemical reduction of NO adlayers on Pt(111), Pt(110) and a series of stepped Pt[n(111)×(111)] electrodes, aimed specifically at establishing the mechanism and structure sensitivity of the process. As a result, the following tentative mechanism of the reaction was proposed:
NOads + H+ + e− HNOads equilibrium (3.1) HNOads + H+ + e− → H2NOads rds (3.2) H2NOads + 4H+ + 3 e− → NH4
+ + H2O fast (3.3) In previous chapter,15 it was shown that the multiple features (peaks)
observed in the voltammetric profile for the reductive stripping of NO adlayers are due to reduction of NO molecules at different adsorption sites and not due to different (consecutive) processes. This is an example of an adsorption site – specific reaction. Ammonia was repeatedly suggested or shown to be the main product of the reduction of adsorbed NO on platinum,6-8,12,15,16 although it is not clear whether the reaction pathway is the same for different surfaces.15
The mechanism expressed in reaction scheme (3.1-3.3) points to certain differences between the reduction of NO under electrochemical conditions and in ultra-high vacuum (UHV). First of all, in our electrochemical studies, we never obtained any evidence for the influence of N−O bond breaking on the overall rate, even though it must occur, because NH4
+ is the main product in acidic media. For NO reduction on platinum under UHV conditions, N−O bond breaking is an important and often rate-determining step.17,18 It has been suggested that NO dissociation depends on the surface structure and the number of free sites surrounding the NO adsorption site, which are required for NO molecule to lie flat and induce the N−O bond breaking. Secondly, in UHV, lateral interactions between adsorbed NO molecules have been found to be very important, especially at high coverages,19-21 whereas, under electrochemical conditions, no evidence for lateral interaction has been provided so far.
The influence of N−O bond breaking and lateral interactions should in principle be reflected in the rate laws for the electrochemical reduction of NOads. Stripping voltammetry, frequently used in previous studies of NOads reduction, is not the most suitable technique for deducing rate laws, in particular reaction orders.
38
Rate laws for reductive stripping of NO adlayers at single-crystal platinum electrodes as deduced from transient experiments
This chapter describes the results of a study, in which the potential-step technique, or chronoamperometry, is used to investigate the rate laws for NOads reduction on Pt(111) and Pt(110) electrodes in acidic media. The experimental data are examined in terms of a recently proposed model22 and an extension thereof, which accounts for the effect of coverage and lateral interactions on the kinetics of NOads reduction under electrochemical conditions.
3.2. Experimental Section
The H2SO4 and HClO4 working solutions were prepared from their respective
concentrated acids (“Suprapur”, Merck) and ultrapure water (Millipore MilliQ system, 18.2 MΩ cm, less than 3 ppb total organic carbon).
Bead-type single-crystal platinum electrodes, prepared by Clavilier’s method,23 were used. Prior to each experiment, the working electrode was flame-annealed, cooled to room temperature in a (2:1) Ar:H2 gas mixture and transferred to the electrochemical cell under the protection of a droplet of deoxygenated ultrapure water. Importantly, the surface order and cleanliness of the electrodes were checked by recording the so-called blank cyclic voltammograms and their comparison to standard voltammetric profiles24-26 (and references therein).
Electrochemical measurements were performed in a single-compartment three-electrode glass cell, using a computer-controlled potentiostat (AutoLab-PGSTAT20, Eco Chemie, Utrecht, The Netherlands). The cell contained a small movable glass spoon27 that allowed dosing of NO at open circuit potential from a diluted NaNO2 (ca. 0.1 mM) solution. The cell and the other glassware were cleaned by boiling in a 1:1 mixture of concentrated nitric and sulfuric acid, followed by repeated boiling with ultra-pure water. A coiled platinum wire served as counter electrode. In HClO4 solutions, the reference electrode was an internal reversible hydrogen electrode (RHE). In H2SO4 solutions a Hg/Hg2SO4/K2SO4 (sat) electrode, connected via a Luggin capillary, was used as reference. However, all potentials are quoted versus the RHE. Before each experiment, all solutions were deoxygenated by purging with pure (N50) argon.
3.3. Kinetic model for reduction of NOads
3.3.1 First order kinetics with lateral interactions
This section introduces a simple kinetic model for NOads reduction, the
predictions of which will be compared to the experimental transients presented in section 3.4.
We consider the NOads reduction to ammonia as an irreversible process: NOads + 5e− + 6H+→ NH4
+ + H2O (3.4)
39

Chapter 3
Assuming first order kinetics and incorporating lateral interactions between the adsorbed species, in the so-called mean-field approximation (MFA, commonly referred to as the Frumkin approximation in the electrochemistry literature28), the corresponding rate equation is
dθ / dt = − k(E)θ exp (zεθ / RT) = − k(E) θ exp (γθ ) (3.5)
where k(E) is the potential (E) dependent heterogeneous rate constant, θ the fractional NO surface coverage referred to the maximum coverage, z the surface coordination number of an adsorption site (for instance, z = 6 for a (111) surface and 4 for a (100) surface), ε is the repulsive interaction, R and T have their usual meaning, and γ = zε/RT. The current flowing is given by
j = − nF Γm k(E) θ exp (γθ ) (3.6)
where Γm is the maximum number of surface species per cm2. In the case of chronoamperometry (a jump to a potential Estep), the
differential equation can be solved analytically. The exact solution to equation 3.5, with E = Estep and θ (t = 0) = θ 0, is given by
Ei (−γθ) = Ei (−γθ 0) − kt (3.7) where
Ei (x) = ∫∞−
x t
te
dt (3.8)
is the integral exponent function, and k = k (Estep). For strongly repulsive lateral interaction (γ → ∞), one may assume that in
equation 3.5 the exponential term changes much faster with changes in θ than the kθ term, at least for not too low coverages (θ > 0.01 – 0.1). Therefore, we can rewrite equation 3.5 as follows:
dθ / dt = − exp (γθ ) (3.9) _k
where ≈ ⟨kθ⟩ ≈ ½ k. Now the differential equation can be solved explicitly: _k
exp (−γθ ) = γ t + exp (−γθ_k o) (3.10)
For the current density, this gives:
40
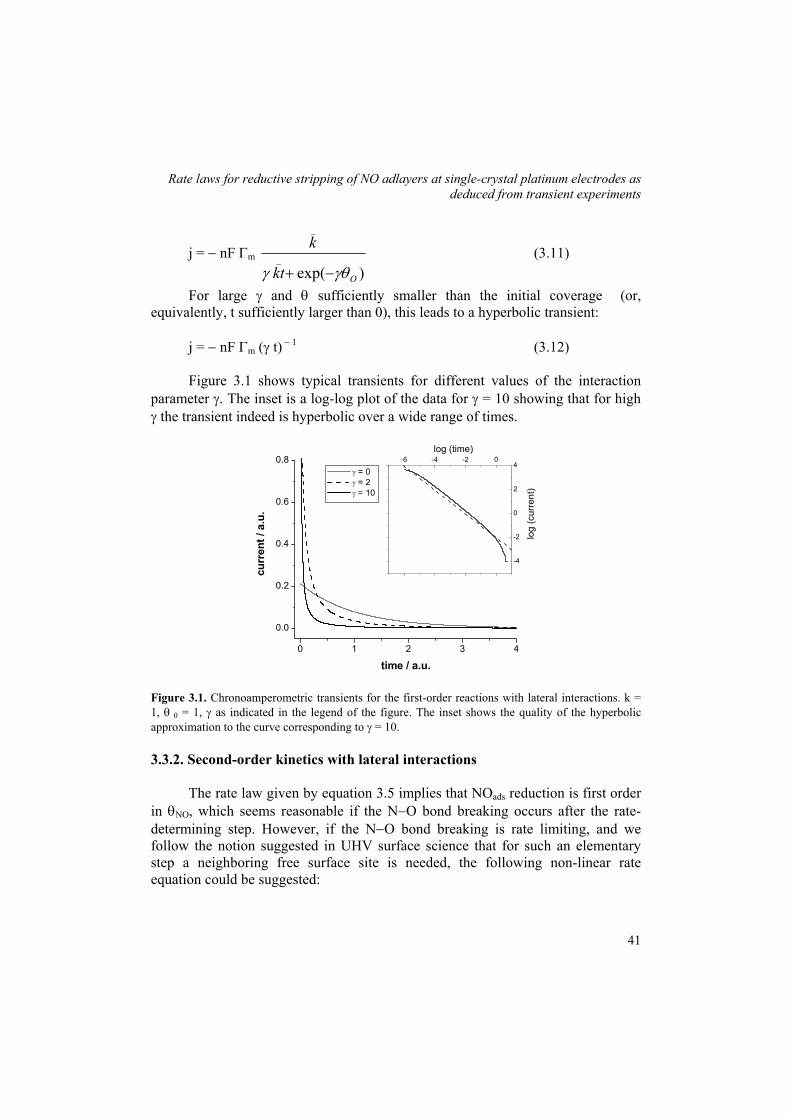
Rate laws for reductive stripping of NO adlayers at single-crystal platinum electrodes as deduced from transient experiments
0 1 2 3 4
0.0
0.2
0.4
0.6
0.8
curr
ent /
a.u
.
time / a.u.
γ = 0 γ = 2 γ = 10
-6 -4 -2 0
-4
-2
0
2
4
log
(cur
rent
)
log (time)
j = − nF Γm )exp(
_
_
Okt
k
γθγ −+ (3.11)
For large γ and θ sufficiently smaller than the initial coverage (or, equivalently, t sufficiently larger than 0), this leads to a hyperbolic transient:
j = − nF Γm (γ t) − 1 (3.12) Figure 3.1 shows typical transients for different values of the interaction
parameter γ. The inset is a log-log plot of the data for γ = 10 showing that for high γ the transient indeed is hyperbolic over a wide range of times.
Figure 3.1. Chronoamperometric transients for the first-order reactions with lateral interactions. k = 1, θ 0 = 1, γ as indicated in the legend of the figure. The inset shows the quality of the hyperbolic approximation to the curve corresponding to γ = 10.
3.3.2. Second-order kinetics with lateral interactions
The rate law given by equation 3.5 implies that NOads reduction is first order
in θNO, which seems reasonable if the N−O bond breaking occurs after the rate-determining step. However, if the N−O bond breaking is rate limiting, and we follow the notion suggested in UHV surface science that for such an elementary step a neighboring free surface site is needed, the following non-linear rate equation could be suggested:
41

Chapter 3
dθ / dt = − k(E)θ (1 − θ) (3.13)
where (1−θ) gives the average number of free sites on the surface. Equation 3.13 has a known analytical solution,29 and is widely used to model COads oxidation, where the (1 − θ) term reflects the coverage of OHads on the surface. This rate law predicts a chronoamperometric maximum at tmax= 1/k ln (θ 0/(1−θ 0)) at θNO=0.5. Invoking now the role of lateral interactions, we can write
dθ / dt = − k(E)θ (1 − θ) exp (γθ ) (3.14)
0.0 0.2 0.4 0.6 0.8 1.0
0.0
0.2
0.4
0.6
0.8
1.0
1.2
γ = 2γ = 5 γ = 0
j / j m
ax
time / a.u.
Figure 3.2. Chronoamperometric transients for the second-order reactions with lateral interactions. k = 1, θ 0 = 0.999, γ as indicated in the legend of the figure.
We have not attempted to solve this differential equation, but it is not
difficult to see that it still predicts a chronoamperometric maximum, the corresponding coverage of which (θmax) now depends on the parameter γ.
θmax = γ
γγ2
42 2++− (3.15)
= 0.5 for γ = 0
= 221
≈ 0.704 for γ = 2
≈ 0.838 for γ = 5
42

Rate laws for reductive stripping of NO adlayers at single-crystal platinum electrodes as deduced from transient experiments
Examples of the corresponding transients (obtained numerically) are given in
Figure 3.2. From the fact that equation 3.14 can be rescaled (t′= k(E) t) dθ / dt′ = − θ (1 − θ) exp (γθ ) (3.16)
which will have a solution for t′max, which depends only on γ, it follows that
tmax = )()(
1 γfEk
(3.17)
and therefore a plot of log(tmax) vs. E should give the Tafel slope, irrespective of γ (assuming that γ does not depend on E).
3.3.3. Validity of mean-field approximation as applied to reduction of NOads on platinum
In the above equations, we have employed the mean-field approximation,
implying that the adsorbed NO species are all equally reactive, and that the effect of lateral interactions can be treated on an averaged level. The latter assumption breaks down when interactions are strong. However, as shown in a previous paper,22 chronoamperometric hyperbolic decay (equation 3.12) is still predicted. Also, in contrast to recent discussions on the electrochemical oxidation of carbon monoxide, the surface mobility of NOads does not play a role: NO is assumed to react with a solution species (H+), and not with another adsorbed species. The assumption that all NOads are equally reactive is in principle incorrect, as we have recently shown that NO adsorbed at different sites have a different reactivity.15 We believe this may explain some deviations from hyperbolic decay, as will be discussed in subsection 3.4.1. A complete modeling of these effects would require a Monte−Carlo-based simulation approach.
3.4. Results and Data Analysis
3.4.1. Electrochemical reduction of nitric oxide adlayers on Pt(111)
Figure 3.3 shows the voltammetric profile for the reductive stripping of a
saturated NO adlayer on Pt(111) surface in perchloric acid (bold solid line). The voltammetric profile presents three reduction features (peaks), E1
111, E2111 and E3
111, the first two features being strongly overlapped. The voltammetric profile remains essentially the same for similar experiments in sulfuric acid, thus indicating little
43

Chapter 3
effect of the anion (co)adsorption.12 The stripping voltammetry experiments and the associated evolution of infrared spectra indicate that the voltammetric features observed are related to the reduction of NOads at different adsorption sites, and not to different (consecutive) processes (as demonstrated in chapter 2).15 More specifically, features E1
111 and E2111 were assigned to reduction of terminal (atop)
NO species, whereas feature E3111 was shown to be due to reduction of the
multifold-coordinated (face-centered cubic (fcc) 3-fold-hollow site) NO species. Furthermore, features E1
111 and E2111 can be removed selectively, leaving feature
E3111 intact. The saturation coverage of NO adlayers on Pt(111) under
electrochemical conditions varies between ca. 0.4 and 0.5 ML.7,12
0.0 0.1 0.2 0.3 0.4 0.5
-10
-8
-6
-4
-2
0
E3111
E2111
E1111
j /
µA c
m-2
E / V vs. RHE
Figure 3.3. The reductive stripping of a saturated NO adlayer on Pt(111) (the bold solid line) and the blank voltammetry of Pt(111) electrode (thin solid line) in 0.5 M HClO4 at 2 mV s-1. The dashed line represents the voltammetric reduction of a subsaturated NO adlayer (0.26 ML), resulting from the potential step experiment in Figure 3.4. The dotted line represents the voltammetric reduction of a subsaturated NO adlayer (0.28 ML), resulting from the potential step experiment in Figure 3.5.
Figure 3.4 shows the result of a potential step experiment on Pt(111) in
perchloric acid. Note that for the given step potential (Estep=0.25 V), only one type of species is reactive, i.e. atop NO species. Accordingly, the voltammetric profile recorded after the potential step experiment (which lasted ca. 15 seconds) indicates that feature E1
111 is completely removed, feature E2111 is strongly reduced, whereas,
feature E3111 is essentially unchanged (Figure 3.3, dashed line). The log (j) – log (t)
plot presents a well-defined linearity over a wide range of times (Figure 3.4B). Moreover, the slope of the least-square regression line is reasonably close to 1, that is the value predicted by the model, which suggests strong lateral interactions and
44

Rate laws for reductive stripping of NO adlayers at single-crystal platinum electrodes as deduced from transient experiments
the associated hyperbolic (t −1) transient (see the subsection 3.3.1 and Figure 3.1). The intercept of the line at log(t)=0 was used to calculate γ from equation 3.12 and, then, ε from the expression γ = zε/RT. The resulting value for γ was found to be approximately 8, which corresponds to a value of 0.034 eV for ε. Note that γ =8 would indeed predict hyperbolic decay (see Figure 3.1), demonstrating the internal consistency of the modeling.
0 5 10 15
0.00
-0.25
-0.50
-1.5 0.0 1.5-6
-5
-4
-3A
j /
mA
cm
- 2
t / s
B
Slope = -0.89Nr. pts. = 1657r 2= -0.9999
log
( j /
A c
m- 2
)
log (t / s)
Figure 3.4. Potential step experiment for electrochemical reduction of a saturated NO adlayer on Pt(111) electrode. (A) the j – t transient; (B) the corresponding log–log plot. Experimental conditions: Ein = 0.5 V, Estep= 0.25 V, 0.5 M HClO4.
As shown in Figure 3.5, a potential step to 0.1 V also results in a hyperbolic
current decay, albeit in a narrower time range. Note that at such a low potential both linearly- and multifold-coordinated NO species may react. Therefore, deviations from the response predicted by the model (subsection 3.3.1) are expected. Nevertheless, hyperbolic current decay is still observed, and the slope of the log (j) – log (t) curve in the region of the hyperbolic dependence is close to the theoretical value of one. The voltammetric profile recorded after the potential step to 0.1 V (for ca. 15 seconds) shows a partial consumption of feature E3
111 and a virtually complete consumption of feature E2
111, whereas feature E1111 is still
present (Figure 3.3, dotted line). The γ value, calculated from the intercept of the linear regression line in Figure 3.5B, is approximately 9.5, which corresponds to a value of 0.051 eV for the lateral interactions, which is still reasonable.
We did not notice any clear-cut effect of the hydrogen (co)adsorption on the current response. The reductive stripping of a NO adlayer on Pt(111) is
45

Chapter 3
accompanied by filling of available surface sites with adsorbed hydrogen. However, the hydrogen underpotential deposition is a fast reversible process, which will not limit the system response.
0.05 0.10 0.15
0
-20
-40
-60
-1.5 -1.0 -0.5 0.0
-4
-2
A
j /
mA
cm
- 2
t / s
B
Slope = - 0.97Nr. pts. = 808r 2= - 0.9731
log
( j /
A c
m- 2
)
log (t / s)
Figure 3.5. Potential step experiment for electrochemical reduction of a saturated NO adlayer on Pt(111) electrode. (A) the j – t transient; (B) the corresponding log–log plot. Experimental conditions: Ein = 0.5 V, Estep= 0.1 V, 0.5 M HClO4.
Interestingly, partial stripping of the (initially) saturated NO adlayers by the
potential steps to 0.25 and 0.1 V (Figures 3.4 and 3.5) results in formation of subsaturated NO adlayers having comparable coverage (ca. 0.26 ML versus ca. 0.28 ML, respectively) but, at the same time, a different adlayer structure, as deduced from the voltammetric stripping experiments (Figure 3.3, the dashed and dotted lines, respectively). The dashed line in Figure 3.3, recorded after the potential step to 0.25 V (Figure 3.4), points to an ordered NO adlayer consisting mostly of NO molecules in the fcc 3-fold-hollow site (0.25 ML, p(2×2)-NO adlayer structure 30-33). The dotted line in Figure 3.3, recorded after the potential step to 0.1 V (Figure 3.5), points to a somewhat disordered NO adlayer, which probably consists of a mixture of p(2×2)-NO and p(2×2)-2NO disordered domains. Arguments in favor of these structural assignments were given in the previous chapter.15 The above results indicate that the current responses in Figures 3.4 and 3.5 correspond to the reduction of NO coverage from ca. 0.5 ML to ca. 0.25 ML, i.e. the limits of high to moderate NO coverage.
The potential step to 0.1 V, performed after the atop NO species (features E1
111 and E2111) were selectively removed by voltammetric stripping, does not
46

Rate laws for reductive stripping of NO adlayers at single-crystal platinum electrodes as deduced from transient experiments
exhibit an hyperbolic current decay, probably due to the reduced effect of lateral interactions at coverages lower than ca. 0.25 ML.
3.4.2. Electrochemical reduction of nitric oxide adlayers on Pt(110)
Figure 3.6 shows the voltammetric reduction of saturated (bold solid line)
and subsaturated (dashed line) NO adlayers on Pt(110) in perchloric acid at a low potential sweep rate. The voltammetric profile for the stripping of a saturated NO adlayer in perchloric acid shows two peaks, E1
110 and E2110, which overlap strongly.
The reductive stripping of a subsaturated NO adlayer (0.38 ML) is also shown in Figure 3.6 to indicate the position of the feature E2
110. Note that the two features are better separated and better defined in sulfuric acid.12 As shown elsewhere,12,15 the complete stripping of NO adlayer is achieved at potentials of ca. 0.25 V in perchloric acid and at ca. 0.15 V in sulfuric acid.
0.0 0.1 0.2 0.3 0.4 0.5
-20
-15
-10
-5
0
E2110
E1110
j /
µA c
m-2
E / V vs. RHE
Figure 3.6. The reductive stripping of a saturated NO adlayer on Pt(110) (bold solid line) and the bare Pt(110) electrode (solid line) in 0.5 M HClO4 at 2 mV s-1. The dashed line represents the electrochemical reduction of a subsaturated (0.38 ML) NO adlayer on Pt(110), resulting after partial stripping of a saturated NO adlayer (dash-dotted line).
In Chapter 2, it was demonstrated that the voltammetric features E1
110 and E2
110 are not related to different (consecutive) processes.15 On the basis of the stripping voltammetry experiments and the associated evolution of infrared spectra, these features were shown to be related to electrochemical reduction of NO species at atop site (E1
110) and NO species at bridge sites (E2110), although the actual
47
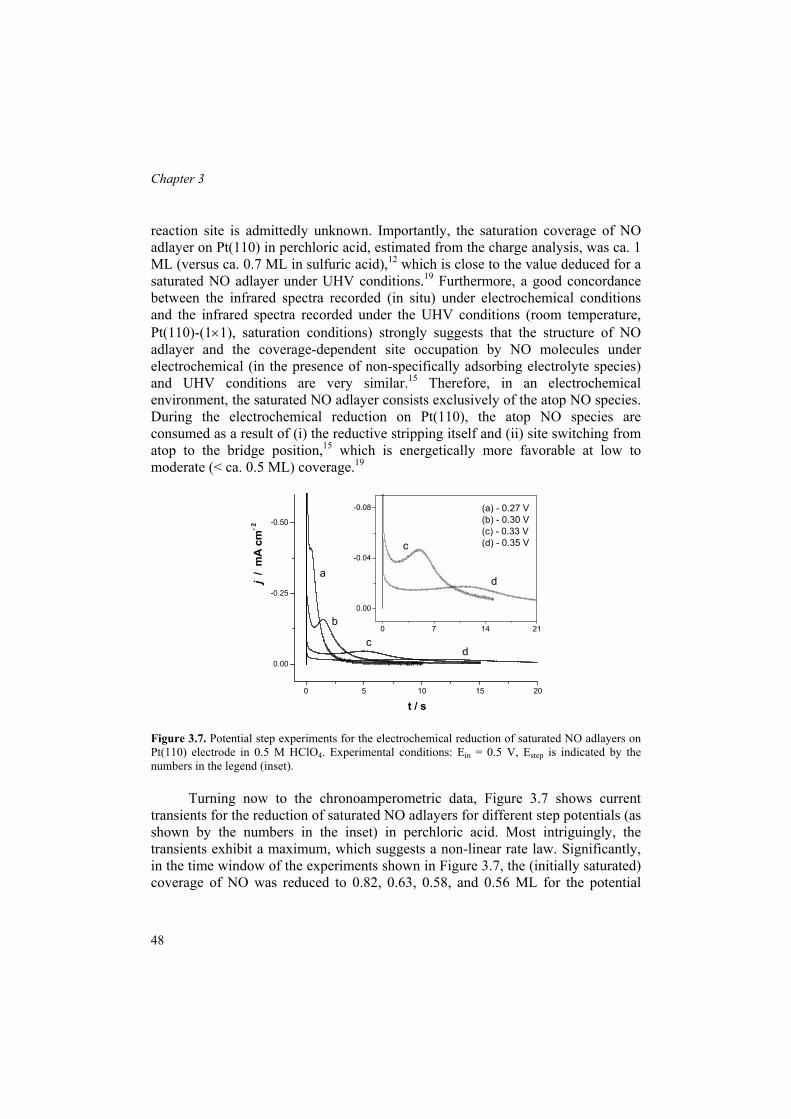
Chapter 3
reaction site is admittedly unknown. Importantly, the saturation coverage of NO adlayer on Pt(110) in perchloric acid, estimated from the charge analysis, was ca. 1 ML (versus ca. 0.7 ML in sulfuric acid),12 which is close to the value deduced for a saturated NO adlayer under UHV conditions.19 Furthermore, a good concordance between the infrared spectra recorded (in situ) under electrochemical conditions and the infrared spectra recorded under the UHV conditions (room temperature, Pt(110)-(1×1), saturation conditions) strongly suggests that the structure of NO adlayer and the coverage-dependent site occupation by NO molecules under electrochemical (in the presence of non-specifically adsorbing electrolyte species) and UHV conditions are very similar.15 Therefore, in an electrochemical environment, the saturated NO adlayer consists exclusively of the atop NO species. During the electrochemical reduction on Pt(110), the atop NO species are consumed as a result of (i) the reductive stripping itself and (ii) site switching from atop to the bridge position,15 which is energetically more favorable at low to moderate (< ca. 0.5 ML) coverage.19
0 5 10 15 20
0.00
-0.25
-0.50
0 7 14 21
0.00
-0.04
-0.08
dc
b
a
(a) - 0.27 V(b) - 0.30 V(c) - 0.33 V(d) - 0.35 V
j /
mA
cm
- 2
t / s
d
c
Figure 3.7. Potential step experiments for the electrochemical reduction of saturated NO adlayers on Pt(110) electrode in 0.5 M HClO4. Experimental conditions: Ein = 0.5 V, Estep is indicated by the numbers in the legend (inset).
Turning now to the chronoamperometric data, Figure 3.7 shows current
transients for the reduction of saturated NO adlayers for different step potentials (as shown by the numbers in the inset) in perchloric acid. Most intriguingly, the transients exhibit a maximum, which suggests a non-linear rate law. Significantly, in the time window of the experiments shown in Figure 3.7, the (initially saturated) coverage of NO was reduced to 0.82, 0.63, 0.58, and 0.56 ML for the potential
48

Rate laws for reductive stripping of NO adlayers at single-crystal platinum electrodes as deduced from transient experiments
steps from 0.5 V to 0.35 V, 0.33 V, 0.30 V, and 0.27 V, respectively. This result indicates that the maximum occurs at high (> 0.5 ML) NO coverages, although admittedly the total amount of NO consumed depends on the applied potential as well. Moreover, as shown in Figure 3.8, the maximum appears exclusively for the reduction of a (nearly) saturated adlayer, in which the only species present are NO molecules in atop position.
0 2 4
0.0
-0.5
-1.0
0.96 ML 0.75 ML 0.58 ML 0.21 ML
j /
mA
cm
- 2
t / s
0.25 0.30 0.35
-0.6
0.0
0.6
1.2Slope 18.9 mV decade-1
Nr. pts.= 4; r2= 0.9998
log
(t max
/ s
)
Estep / V vs. RHE
Figure 3.8. (left) Potential step experiments for the electrochemical reduction of a saturated and subsaturated NO adlayers on Pt(110) electrode in 0.5 M HClO4. Numbers in the legend indicate the coverage of NO adlayers (ML). Experimental conditions: Ein = 0.5 V, Estep= 0.27 V.
Figure 3.9. (right) The Tafel slope analysis based on the data presented in Figure 3.7. The inset shows the results of the linear regression analysis of the experimental data. Experimental conditions: as in Figure 3.7.
The maximum in the current transients for electrochemical reduction of the
saturated NO adlayers on Pt(110) can be understood in terms of the model presented in the subsection 3.3.2. Accordingly, the occurrence of the chronoamperometric maximum at times corresponding to a high NO coverage (higher than 0.5 ML) can be attributed to (i) the second order kinetics of the process and (ii) the effect of considerable lateral (repulsive) interactions (equations 3.14 and 3.15). Indeed, if the lateral interactions would be negligible (equation 3.13) and the reaction would still follow the second-order kinetics, the chronoamperometric maximum would occur at half coverage, which is clearly not the case.
49

Chapter 3
In subsection 3.3.2, it was shown that for the case of second-order kinetics with lateral interactions, a plot of log (tmax) vs. E should give the Tafel slope, irrespective of γ. Figure 3.9 presents such a plot. The slope, estimated from the least-square linear regression analysis, is ca. 19 mV decade-1.
3.5. Discussion
We shall begin with discussing the data for NOads reduction on Pt(110) in
perchloric acid. This electrochemical system offers a unique opportunity to look into the mechanism of NOads reduction. First, the reductive stripping of a NO adlayer is accomplished at potentials at which (i) the hydrogen adsorption is negligible and (ii) the (co)adsorption of other components of the electrolyte (perchlorate, water) should not play an important role. Second, the NO adlayer forms a densely packed layer with coverage of ca. 1 ML, thus leaving virtually no free sites in the first atomic layers. Therefore, the transient response of the system must be governed by NO reduction itself. The remarkably low value of the Tafel slope for reduction of a saturated NO adlayer on Pt(110) (19 mV dec-1) indicates that the first three electron (presumably, electron/proton) transfers are at (quasi)equilibrium:
NOads + H+ + e− HNOads (3.18) HNOads + H+ + e− H2NOads (3.19) H2NOads + H+ + e− H2NOHads (3.20) The HNO and H2NO intermediates are suggested on the basis of the data and
arguments reported elsewhere.12,34 The value of 19 mV decade-1 is reasonably close to both 20 mV decade-1, which would imply that the fourth step is a chemical and the rate-determining step, and 17 mV decade-1, which would imply that the fourth step is an electrochemical and the rate-determining step. Note that for first- and second-order surface-confined reactions, lateral interactions do not affect the Tafel slope, obtained from either voltammetric22 or chronoamperometric analysis (subsection 3.3.2). Regardless the nature of the forth step (chemical vs. electrochemical), it would be logical to assume that in this step the N–O bond is broken.
The observed second-order kinetics of NOads reduction on Pt(110) in the limit of high coverage can be explained by the necessity of having a neighboring free site available for breaking the N–O bond. Such a site must have a very low concentration on a well-ordered Pt(110)-(1×1) surface at the (near) saturation coverage of NO (ca. 1 ML), as all the platinum atoms of the topmost layer are
50
Rate laws for reductive stripping of NO adlayers at single-crystal platinum electrodes as deduced from transient experiments
occupied by NO molecules in atop position. Therefore, the reaction would likely be initiated at defect sites. A gradual decrease of the NO coverage would result in gradual increase of the number of free sites and, hence, acceleration of the process, leading to the appearance of a chronoamperometric maximum.
Assuming the chemical rate-determining breaking of N–O bond, the reaction may take the following pathway:
H2NOHads + * → H2Nads + OHads slow (3.21) OHads + H+ + e− → H2O fast (3.22) H2Nads + e− + 2H+ → NH4
+ fast (3.23) The OHads would be unstable in the potential region corresponding to NO
reduction on Pt(110) and should be reduced rapidly. Furthermore, taking into consideration that electrochemical reduction of NO adlayers on Pt(110) is accomplished in the potential region corresponding to a negligible amount of adsorbed hydrogen, reduction of the H2Nads should be an electrochemical step involving protons from solution (reaction 3.23).
Remarkably, the Tafel slope analysis based on the voltammetry measurements gives ca. 40 mV decade-1 for features E1
110 and E2110 both in
perchloric and sulfuric acid solutions.12 This outcome indicates that the second, electrochemical (combined electron/proton transfer), reaction step is the rate-determining step. At the same time, it is important to recall that the voltammetric peaks occur at half coverage or even lower coverages,22 whereas, for the system examined, the chronoamperometric maximum occurs at coverages significantly higher than 0.5 ML. Therefore, the two techniques “interrogate” the system under different conditions (coverage), thus providing complementary, and not contradictory, as it may seem, information. Indeed, the switch from second-order kinetics (and a low Tafel slope) for reduction of (nearly) saturated NO adlayer to first-order kinetics (and a higher Tafel slope) for reduction of subsaturated NO adlayers, consistently suggests (i) a change of the rate-determining step with NO coverage and (ii) necessity of a free neighboring site, required likely for breaking the N−O bond. More specifically, at near saturation coverage, N−O bond breaking is rate-determining step on Pt(110), leading to a very low Tafel slope (lower than 20 mV decade-1); at coverages allowing sufficient free sites, the N−O bond breaking is fast and the second electron transfer is rate determining, leading to a Tafel slope of 40 mV decade-1. Finally, note that the existence of two features observed in the voltammetric profile for NOads reduction on Pt(110) (E1
110 and E2
110) is due to differences in reactivity of NO species at different adsorption sites
51

Chapter 3
(see Chapter 2 for details), and not due to existence of different reaction sites, which would, in principle, undermine the above reasoning.
Turning now to the Pt(111) surface, the reduction of a saturated NO adlayer by stepping to 0.1 V (both atop and 3-fold NO species react, Figure 3.5) or to 0.25 V (only atop NO species react, Fig. 3.4) results in an apparent hyperbolic current decay in a wide range of times. Therefore, based on the kinetic models presented in section 3.3, it would be reasonable to invoke (i) important lateral interactions between the reacting species and (ii) (apparent) first-order kinetics in order to explain the hyperbolic current transients observed. At the same time, since ammonia is the main product of the reduction of NO adlayers, the reaction may, in principle, require an ensemble of surface sites, e.g. for breaking the N−O bond. Furthermore, although the initial steps of NOads reduction on Pt(111) surface are likely to be combined electron/proton transfers,12 the possibility for the catalytic hydrogenation (Langmuir−Hinshelwood-type) steps occurring at later stages of the reaction cannot be ruled out. These considerations lead us to the following interpretation: because the saturation NO coverage on Pt(111) is significantly lower than on Pt(110) (0.4-0.5 ML on Pt(111) vs. 0.7-1 ML on Pt(110)),7,12 the eventually required neighboring free site(s) is available at all coverages of NO on (111) terraces, ultimately leading to apparent first-order kinetics.
3.6. Summary and Conclusions
The potential step method was used to investigate the mechanism of the
electrochemical reduction of NO adlayers on Pt(111) and Pt(110) surfaces. The experimental current transients were interpreted in terms of a kinetic model in the mean-field approximation with strong lateral interactions.
It was shown that under electrochemical conditions in the limit of high saturation of NO, strong repulsive interactions exist between the reacting species. These interactions have a clear effect on the chronoamperometric response of the systems examined. Accordingly, the current transients for NO reduction on Pt(111) show a hyperbolic (t−1) decay, which indicates (i) first-order kinetics and (ii) strong lateral interactions. For NOads reduction on Pt(111) surface, the experimentally assessed lateral interaction varies between ca. 0.03 and 0.05 eV.
The apparent reaction order for the reduction of NO adlayers depends on the availability of a neighboring free site and, therefore, NO coverage. More specifically, the current transients for the reductive stripping of saturated NO adlayers on Pt(110) surface (with atop NO as the reactive species) show a potential dependent maximum, occurring at high coverages, which indicates (i) the second-order kinetics and (ii) significant lateral interactions. The second-order kinetics,
52

Rate laws for reductive stripping of NO adlayers at single-crystal platinum electrodes as deduced from transient experiments
observed in the limit of high NO coverage, was attributed to the necessity of a neighboring free site required for breaking the N–O bond. For the reduction of the saturated NO adlayers on Pt(111) surface (with atop NO or/and threefold NO as the reactive species), the apparent first-order kinetics may be tentatively explained by the availability of the required reaction site (sites) at all coverages: the saturation coverage on Pt(111), ca. 0.5 ML, is much lower than that on Pt(110), ca. 1 ML.
References
(1) de Vooys, A. C. A.; Beltramo, G. L.; van Riet, B.; van Veen, J. A. R.; Koper, M. T. M.
Electrochim. Acta 2004, 49, 1307. (2) Ye, S.; Hattori, H.; Kita, H. Ber. Bunsen-Ges. Phys. Chem. 1992, 73, 1884. (3) Ye, S.; Kita, H. J. Electroanal. Chem. 1993, 346, 489. (4) Rodes, A.; Gomez, R.; Orts, J. M.; Feliu, J. M.; Perez, A.; Aldaz, A. J. Electroanal. Chem. 1993,
359, 315. (5) Rodes, A.; Gomez, R.; Orts, J. M.; Feliu, J. M.; Perez, A.; Aldaz, A. Langmuir 1995, 11, 3549. (6) Gomez, R.; Rodes, A.; Orts, J. M.; Feliu, J. M.; Perez, J. M. Surf. Sci. 1995, 342, L1104. (7) Rodes, A.; Gomez, R.; Perez, A.; Feliu, J. M.; Aldaz, A. Electrochim. Acta 1996, 41, 729. (8) Rodes, A.; Climent, V.; Orts, J. M.; Perez, J. M.; Aldaz, A. Electrochim. Acta 1998, 44, 1077. (9) Momoi, K.; Song, M. B.; Ito, M. J. Electroanal. Chem. 1999, 473, 43. (10) Zang, Z.-H.; Wu, Z.-L.; Yau, S.-L. J. Phys. Chem. B 1999, 103, 9624. (11) Casero, E.; Alonso, C.; Martin-Gago, J. A.; Bogatti, F.; Felici, R.; Renner, R.; Lee, T.;
Zegenhagen, J. Surf. Sci. 2002, 507-510. (12) Beltramo, G. L.; Koper, M. T. M. Langmuir 2003, 19, 8907. (13) Villegas, I.; Gomez, R.; Weaver, M. J. J. Phys. Chem. 1995, 99, 14832. (14) Weaver, M. J.; Zou, S.; Tang, C. J. Chem. Phys. 1999, 111, 368. (15) Rosca, V.; Beltramo, G. L.; Koper, M. T. M. Langmuir 2005, 21, 1448. (16) Gootzen, J. F. E.; van Hardeveld, R. M.; Visscher, W.; van Santen, R. A.; van Veen, J. A. R.
Recl. Trav. Chim. Pays-Bas 1996, 115, 480. (17) Masel, R. I. Catal. Rev. -Sci. Eng. 1986, 28, 335. (18) Egelhoff, W. R. In The Chemical Physics and Heterogeneous Catalysis; Woodruff, D. P., Ed.;
Elsevier: New-York, 1982; Vol. 4. (19) Brown, W. A.; Sharma, R. K.; King, D. A. J. Phys. Chem. 1998, 102, 5303. (20) Hermse, C. G. M.; Frechard, F.; van Bavel, A. P.; Lukkien, J. J.; Niemantsverdriet, J. W.; van
Santen, R. A.; Jansen, A. P. J. J. Chem. Phys. 2003, 118, 7081. (21) van Bavel, A. P.; Hermse, C. G. M.; Hopstaken, M. J. P.; Jansen, A. P. J.; Lukkien, J. J.; Hilbers,
P. A. J.; Niemantsverdriet, J. W. Phys. Chem. Chem. Phys. 2004, 6, 1830. (22) Koper, M. T. M. Z. Phys. Chem. 2003, 217, 547. (23) Clavilier, J.; Armand, D.; Sun, S. G.; Petit, M. J. Electroanal. Chem. 1986, 205, 267. (24) Lebedeva, N. P.; Koper, M. T. M.; Herrero, E.; Feliu, J. M.; van Santen, R. A. J. Electroanal.
Chem. 2000, 487, 37. (25) Lebedeva, N. P.; Rodes, A.; Feliu, J. M.; Koper, M. T. M.; van Santen, R. A. J. Phys. Chem. B
2002, 106, 9863. (26) Lebedeva, N. P.; Koper, M. T. M.; Feliu, J. M.; van Santen, R. A. J. Phys. Chem. B 2002, 106,
12938. (27) Feliu, J. M.; Orts, J. M.; Fernandez-Vega, A.; Aldaz, A.; Clavilier, J. J. Electroanal. Chem. 1990,
296, 191.
53
Chapter 3
(28) Frumkin, A. N. Z. Phys. 1926, 35, 792. (29) Bergelin, M.; Herrero, E.; Feliu, J. M.; Wasberg, M. J. Electroanal. Chem. 1999, 467, 74. (30) Matsumoto, M.; Fukutani, K.; Okano, T.; Miyake, K.; Shigekawa, H.; Kato, H.; Okuyama, H.;
Kawai, M. Surf. Sci. 2000, 454-456, 101. (31) Matsumoto, M.; Tatsumi, T.; Fukutani, K.; Okano, T. Surf. Sci. 2002, 513, 485. (32) Aizawa, H.; Morikawa, Y.; Tsuneyuki, S.; Fukutani, K.; Ohno, T. Surf. Sci. 2002, 514, 394. (33) Zhu, J. F.; Kinne, M.; Fuhrmann, T.; Denecke, R.; Steinruck, H.-P. Surf. Sci. 2003, 529, 384. (34) Rosca, V.; Beltramo, G. L.; Koper, M. T. M. J. Phys. Chem. B 2004, 108, 8294.
54
4
Mechanism of electrocatalytic reduction of nitric oxide on Pt(100) surface Abstract The mechanism of electrocatalytic reduction of nitric oxide on Pt(100)-(1×1) in acidic media has been studied using voltammetry and in situ infrared spectroscopy and considering the effect of surface defects, NO coverage, and the nature of the supporting electrolyte (sulfate vs perchlorate). The adsorption of nitric oxide on Pt(100) results in the formation of an adlayer with a structure similar to that formed under ultra-high vacuum (UHV) conditions. Ammonia was shown to be the product of NOads reduction on Pt(100). The saturation coverage of NO adsorbate on Pt(100) was found to be around 0.5 monolayers (ML), in agreement with previous UHV and electrochemical studies. Two features observed in the voltammetric profile for the electrocatalytic reduction of saturated and subsaturated NO adlayers were tentatively ascribed to reactions of NO species having different reactivity. The Tafel slope analysis of these voltammetric features gives values of ca. 60 mV decade-1. This value was interpreted in terms of an EC mechanism, in which the first electron/proton transfer is at equilibrium, resulting in the formation of HNOads intermediate, whereas the second reaction step is a chemical and the rate-determining step. This chemical step is assumed to involve the N−O bond breaking in the HNOads intermediate, which most probably requires a free neighboring site. From a comparison of NOads reduction on Pt(100), Pt(111), and Pt(110) it follows that (i) the reaction mechanism is structure sensitive and (ii) Pt(100) is the most active surface for breaking the N−O bond, which is in agreement with the trend observed under UHV conditions.
This chapter is based on article by V. Rosca and M.T.M. Koper, published in Journal of Physical Chemistry B, 109 (2005) 16750.
55

Chapter 4
4.1. Introduction Adsorption and reactions of nitric oxide on transition metal surfaces in an
electrochemical environment are of considerable practical importance, mainly in connection with the industrial synthesis of hydroxylamine as well as with environmentally important removal of nitrate, nitrite, and nitric oxide itself. Nitric oxide adsorbs strongly on transition metals and is a key intermediate in many electrochemical transformations of inorganic nitrogen-containing compounds.1 From a fundamental point of view, reactions of NO on single-crystal transition metal surfaces, particularly NO reduction, are attractive for carrying out model studies in heterogeneous electrocatalysis as well as for comparing reactions at the metal−gas and metal−liquid interface.
Adsorption and electrochemical transformations of NO on single-crystal platinum surfaces, as well as on other transition metal surfaces, have been intensively studied in recent years.2-18 These studies resulted in a significant insight into the structure and reactivity of NO adlayers, as compared to earlier studies on polycrystalline platinum.19
In a recent detailed voltammetric study on Pt(111), Pt(110) and a series of stepped Pt[n(111)×(111)] electrodes, it was shown that the reductive stripping of NO adlayers shows little structure sensitivity, mainly manifested in differences in the voltammetric profile for NOads stripping. The conclusion regarding the apparent structure insensitivity of the reductive stripping of NO adlayers was also supported by the 40 mV decade-1 Tafel slopes obtained on different surfaces, which was interpreted in terms of the following EE mechanism16 :
NOads + H+ + e− HNOads equilibrium (4.1) HNOads + H+ + e− → H2NOads rds (4.2) H2NOads + 4H+ + 3 e− → NH4
+ + H2O fast (4.3) Most importantly, the first two steps of the reaction are assumed to be
combined proton-electron transfers, involving hydronium ions from solution. In agreement with the latter assumption, NOads reduction on Pt(110) (and partly on Pt(111)) occurs at potentials at which the hydrogen coverage is negligible. Additionally, the reductive stripping of NO adlayers on polycrystalline platinum shows a pH dependence that complies with the electrochemical mechanism of NOads hydrogenation.20 Note that in mechanism (4.1-4.3), N−O bond breaking occurs after the rate-determining step.
The features observed in the voltammetric profile for NOads reduction were shown to relate to the different reactivity of NOads species with different surface
56
Mechanism of electrocatalytic reduction of nitric oxide on Pt(100) surface
coordination (i.e., atop, bridge, 3-fold-hollow), and not to different (consecutive) steps of an overall process.17 For more details, see Chapter 2.
Chronoamperometric analysis of NOads reduction on Pt(111) (at all coverages) and Pt(110) (at subsaturation coverages) pointed to important lateral (repulsive) interactions between reacting NO species and the apparent first-order kinetics of the overall process.18 From chronoamperometric reduction of a (nearly) saturated NO adlayer on Pt(110) in perchloric acid (NO coverage of ca. 1 monolayer (ML)), however, we deduced second-order kinetics and a very low Tafel slope of ca. 19 mV decade-1 (implying that the first three electron/proton transfers are at equilibrium). The second-order kinetics was interpreted in terms of the necessity of a free neighboring site for breaking the N−O bond, which is only scarcely available at high initial coverage. For more details, see Chapter 3.
The above results make a detailed examination of the mechanism of NO reduction on Pt(100) particularly interesting. In ultra-high vacuum (UHV), NO has been reported to adsorb in only one position: a site between bridge and atop sites.21,22 Furthermore, Pt(100) surface is known to be exceptionally active for breaking the N−O bond under UHV conditions,23 in contrast to Pt(111) and Pt(110). One would expect these factors to be reflected in the kinetics of NOads reduction on Pt(100) in an electrochemical environment as well.
The adsorption and electrochemical reactions of NO on Pt(100) have been recently addressed in a number studies.2,4,5,7,8,24 The NO adsorption on Pt(100) under electrochemical conditions was shown to be quite similar to NO adsorption under UHV conditions, as deduced from in situ infrared measurements.10 Most noticeable from a mechanistic point of view is the study by Rodes et al.,8 who investigated NO adsorption and reactivity in acidic, neutral, and alkaline media. The authors suggested ammonia as the main product of NOads reduction on Pt(100). However, a detailed mechanism for the electrocatalytic reduction of NOads on Pt(100) was not proposed. The electrooxidation of NOads was shown to give various products, depending on pH. From a charge analysis applied to the reductive voltammetry of saturated NO adlayers in acidic media, the saturation coverage of nitric oxide was estimated to be ca. 0.5 ML.
This chapter describes the results of a combined voltammetric and in situ infrared study of the electrocatalytic reduction of NOads on the Pt(100)-(1×1) surface. The aim was formulating a mechanism for NOads reduction at this surface, including the effect of anion (co)adsorption, surface defects and coverage. This chapter also provides a comparison of the electrocatalytic reduction of NOads on Pt(100) with that on the other two low-index surfaces – Pt(111) and Pt(110).
57
Chapter 4
4.2. Experimental Section The H2SO4 and HClO4 working solutions were prepared from their respective
concentrated acids (“Suprapur”, Merck) and ultrapure water (Millipore MilliQ system, 18.2 MΩ cm, less than 3 ppb total organic carbon) or doubly distilled deuterium oxide (“Uvasol”, Merck, deuteration degree min. 99.9%).
Two types of single-crystal platinum electrodes were used. Bead-type single-crystal platinum electrodes, prepared by Clavilier’s method25, were used for most of the electrochemical measurements. For in-situ infrared measurements, commercial platinum disk electrodes of 10 mm diameter were used (oriented within 1°, Surface Preparation Laboratory, Zaandam, The Netherlands). Before each experiment, the working electrode was flame-annealed, cooled to room temperature in an Ar:H2 (3:1) gas mixture and transferred to the electrochemical cell under the protection of a droplet of deoxygenated ultrapure water.
Electrochemical measurements were performed in a single-compartment three-electrode glass cell, using a computer-controlled potentiostat (AutoLab-PGSTAT20, Eco Chemie, Utrecht, The Netherlands). The cell contained a small movable glass spoon26, which contained a diluted NaNO2 (ca. 0.1 mM in 0.1 M perchloric or sulfuric acid) solution. Immersion of the working electrode in the nitrite-containing solution results in formation of a subsaturated or a saturated (depending on the immersion time) NO adlayer.2 This procedure allows NO dosing under an inert (argon) atmosphere at open circuit potential and, thus, avoids the use of gaseous NO. In the case of in situ infrared experiments, NO adlayers were generated in a similar way: immersion of the working electrode in a separate solution of nitrite was followed by washing of the electrode with doubly distilled deuterium oxide and subsequent transfer of the electrode to the spectroelectrochemical cell. The cell and the other glassware were cleaned by boiling in a 1:1 mixture of concentrated nitric and sulfuric acid, followed by repeated boiling with ultrapure water. A coiled platinum wire served as counter electrode. In HClO4 solutions, the reference electrode was an internal reversible hydrogen electrode (RHE). In H2SO4 solutions a saturated mercury-mercury sulfate (Hg|Hg2SO4|K2SO4 (sat)) electrode, connected via a Luggin capillary, was used as a reference. However, all potentials are quoted versus the RHE. Before each experiment, all solutions were deoxygenated by purging with pure (N50) argon.
The in situ Fourier transform infrared reflection-absorption spectroscopy (FTIRRAS) measurements were performed under external reflection conditions. The Fourier-transform infrared spectrometer was a Brüker IFS113V, equipped with a narrow-band MCT detector. The design of the spectroelectrochemical cell closely resembles that described elsewhere.27 The cell featured a prismatic CaF2 transmission window beveled at 60°. Five hundred interferograms were collected at each potential. The spectral resolution was 8 cm-1. The reflectance spectra were calculated as (R - R0)/R0, where R and R0 are the reflectance at the sample and the reference potential respectively. Therefore, the (R - R0)/R0 ratio gives negative bands for species that are formed and positive bands for species that are consumed at the sample potential, as compared to the reference potential.
58

Mechanism of electrocatalytic reduction of nitric oxide on Pt(100) surface
The surface order and cleanliness of the working electrodes were checked before each experiment by recording the so-called blank cyclic voltammograms and their comparison to the standard voltammetric profile for the Pt(100)-(1×1) surface reported elsewhere.28-30
4.3. Electrocatalytic reduction of adsorbed nitric oxide
4.3.1. Stripping voltammetry of saturated NO adlayers
Figure 4.1 illustrates the electrochemical reactions of a saturated NO adlayer
on Pt(100) surface in sulfuric acid. The saturated NO adlayer is electrochemically stable in a wide potential region between ca. 0.3 and 0.9 V. In this range of potentials the voltammetric profile shows very low (charging) current densities. At the same time, the hydrogen and the (bi)sulfate adsorption/desorption states in the 0.3-0.45 V region (dotted line) are essentially blocked. The voltammetric profile for the reductive stripping of a saturated NO adlayer (bold solid line) contains two characteristic features: a sharp peak ER3
100at ca. 0.26 V and a shoulder ER4100 at
more negative potentials. In perchloric acid (Figure 4.2), the voltammetric profile for the reductive stripping of a saturated NO adlayer is virtually identical to that in sulfuric acid, thus indicating no effect of anion (co)adsorption.
The saturated NO adlayers can be oxidized reversibly (solid line, peaks EO2
100 and ER2100) both in sulfuric and in perchloric acid, provided the upper
potential limit is not higher than 1.1 V and the potential scan rate is not lower than 5 mV s-1. Although chemically reversible, the electrochemical oxidation of a saturated NO adlayer seems to be a complex process: the in situ infrared data by Rodes et al.8 suggest that in acidic media the oxidized NO adlayer consists of a mixture of adsorbed nitrito and nitro species, while in alkaline media dissolved nitrite appears to be the main product.
4.3.2. Products of reduction of adsorbed NO
Continuous reduction of NO at polycrystalline platinum in acidic solutions
yields nitrous oxide (and molecular nitrogen) at moderately reductive potentials, whereas at highly reductive potentials hydroxylamine and ammonia are the products.19 Importantly, the presence of NO in solution is necessary for the formation of nitrous oxide (and molecular nitrogen) and, therefore, is crucial for N−N condensation.20 As for the products of NOads reduction on Pt(100), formation of nitrous oxide may be ruled out, as the in situ infrared data on the reduction of NOads shows no sign of the formation of nitrous oxide (the N−O and N−N stretching modes at ca. 1285 cm-1 and ca. 2230 cm-1, respectively), which is in
59

Chapter 4
agreement with the above mechanism. Furthermore, the on-line mass spectrometry data presented in Chapter 5 show no formation of any gaseous products for the reductive stripping of a saturated NO adlayer (Figure 5.12). Rodes et al.8 provided spectroscopic data, which strongly suggested ammonia as the main product of NOads reduction, although not sufficient for ruling out the formation of some hydroxylamine. These authors did not observe N2O formation in their FTIR experiments. Furthermore, the reductive stripping of a saturated or subsaturated NO adlayer at a sufficiently low scan rate (10 mV s-1 or lower) results in a complete recovery of the blank voltammogram, as deduced from the subsequent positive going scan (see, for example, Figure 4.3). This excludes formation of considerable amounts of an electrochemically active product, that is, hydroxylamine. Pulling these arguments together, ammonia is indeed the main product of the reductive stripping of NO adlayers on Pt(100), similarly to NOads reduction on Pt(111) and Pt(110).17
0.0 0.2 0.4 0.6 0.8 1.0-80
-60
-40
-20
0
20
40
ER4100
ER3100
ER2100
EO2100
blank NOads oxidation NOads reduction
j /
µA c
m-2
E / V vs RHE0.0 0.2 0.4 0.6 0.8 1.0
-90
-60
-30
0
30
ER4100
ER3100
ER2100
EO2100
blank NOads oxidation NOads reduction
j /
µA c
m-2
E / V vs RHE
Figure 4.1. (left) Voltammetry of nitric oxide adlayers on Pt(100) in 0.5 M H2SO4. Bold solid line – reductive stripping of a saturated NO adlayer (at 2 mV s-1). Solid line – reversible oxidation of a saturated NO adlayer (at 10 mV s-1). Dotted line – Pt(100)-(1×1) blank voltammetry at 10 mV s-1.
Figure 4.2. (right) Voltammetry of nitric oxide adlayers on Pt(100) in 0.5 M HClO4. Bold solid line – reductive stripping of a saturated NO adlayer (at 2 mV s-1). Solid line – reversible oxidation of a saturated NO adlayer (at 10 mV s-1). Dotted line – Pt(100)-(1×1) blank voltammetry at 10 mV s-1.
4.3.3. NO coverage and its effect on voltammetric response
The coverage of the saturated NO adlayer, estimated from a charge analysis
proposed elsewhere4 and assuming ammonia as the main product, lies between ca. 0.5 and 0.52 ML both in sulfuric and in perchloric acid. The experimental
60

Mechanism of electrocatalytic reduction of nitric oxide on Pt(100) surface
reduction charge for the stripping of saturated NO adlayers gives values between 710 and 740 µC cm-2 (before correction for hydrogen adsorption) for integration between 0.5 and 0.1 V. These values of the reduction charge and the corresponding coverage values agree well with estimations by other authors.4,7,8 The value of ca. 0.5 ML for the saturation coverage of NO under electrochemical conditions would coincide with the value for NO saturation coverage on Pt(100)-(1×1) surface under UHV conditions, as reported by different groups.21,22,31 In more recent UHV studies, lower values for the NO saturation coverage were reported, particularly in connection with the possibility of NO dissociation even at room temperature.32-34 The issue of NO dissociation under UHV and electrochemical conditions and the related issue of the saturation coverage and the structure of NO adlayer are addressed in some detail in the Discussion.
0.0 0.1 0.2 0.3 0.4 0.5
-160
-120
-80
-40
0
40
0.51
0.45
0.34
0.11
j /
µA c
m-2
E / V vs RHE0.1 0.2 0.3 0.4 0.5
-160
-120
-80
-40
0
40
j /
µA c
m-2
E / V vs RHE
Figure 4.3. (left) The effect of NO coverage on the voltammetric profile for the reductive stripping of NO adlayers. Experimental conditions: 0.5 M H2SO4; starting potential 0.5 V; potential scan rate 5 mV s-1. Numbers indicate the corresponding NO coverage. The dotted line represents the blank voltammetry of the Pt(100) surface.
Figure 4.4. (right) Partial stripping of a saturated NO adlayer (bold solid line) and the voltammetric profile recorded in the subsequent potential cycle (solid line). The dotted line represents the voltammetric profile for a complete stripping of a saturated NO adlayer. Experimental conditions: 0.5 M H2SO4; starting potential 0.5 V; potential scan rate 5 mV s-1.
Figure 4.3 shows the effect of the initial NOads coverage on the voltammetric
profile for the reductive stripping of nitric oxide adlayers in sulfuric acid. In perchloric acid, the effect of the initial NO coverage is quite similar (data not shown). Decrease of the initial coverage brings about a slight positive shift and attenuation of the main peak position (ER3
100), while feature ER4100 seems to remain
unchanged at moderate to high coverages. Note that at subsaturation coverage, the
61

Chapter 4
reduction of NO adsorbate seems to start slightly (ca. 50 mV) more positively. The voltammetric profile corresponding to the reductive stripping of ca. 0.1 ML of NOads exhibits only one broad feature in the potential region between ca. 0.3 and 0.15 V.
The voltammetric profile corresponding to the reductive stripping of a saturated NO adlayer can be represented reasonably well as a combination of two overlapping Voigtian peaks. The ratio of the area (charge) under the sharp peak ER3
100 and that under the broad feature ER4100 (QR3/QR4) changes from ca. 2:1 at
saturation to ca. 1:1 at ca. 0.34 ML, thus indicating an apparent attenuation of feature ER3
100 and not of feature ER4100 with decreasing coverage in the 0.5-0.3 ML
range. The above data suggest that the reduction features ER3
100 and ER4100 can be
tentatively ascribed to the reduction of NO adsorbates having different reactivity, rather than to consecutive steps of the same reaction. We shall return to this issue again when discussing the results of the Tafel slope analysis of the two reduction features.
Figure 4.4 shows results corresponding to partial stripping of a saturated NO adlayer. In this experiment, the first, negative-going, run was reversed at ca. 0.26 V (the bold solid line). The subsequent positive-going scan shows a reduction peak at potentials ca. 50 mV more positive than it should have appeared if the potential run was not reversed (compare the bold solid line and the dotted line). First, this result seem to be in good agreement with the autocatalytic nature of NO reduction on Pt(100) known from the UHV studies.35 Second, the strong hysteresis observed also indicates that the NO reaction on platinum is chemically irreversible at the initial stages of the reaction. Note that such a hysteresis was not observed for partial stripping of NO adlayers on Pt(111) and Pt(110).17
4.3.4. Effect of surface defects
To elucidate the effect of the surface defects, we have examined the
reductive stripping of the saturated NO adlayers at Pt(100) electrode with different degrees of the surface order. The order of the electrode surface can be assessed from the blank voltammetry. The cyclic voltammogram corresponding to a well-ordered Pt(100)-(1×1) surface in contact with sulfuric acid is shown in Figure 4.1 (the dotted line), as deduced from combined voltammetric and LEED30 or STM36 studies. More specifically, the magnitude of the peak at ca. 0.38 V is a measure of the long-range order of the surface.30,37 In our experiments, the height of this peak was typically 200 µA cm-2 or higher for the cyclic voltammetry measurements at 50 mV s-1. The surface defects appear for an electrode cooled in air or even in
62

Mechanism of electrocatalytic reduction of nitric oxide on Pt(100) surface
presence of traces of oxygen (see Figure 4.5. for an example),38 or can be generated by the potentiodynamic cycling28 (see also Figure 4.6 and its caption for details). The development of defects is reflected in a substantial current increase in the 0.05-0.25 V range, which seems to indicate increasing contribution from (111) sites, and a decrease of the adsorption state around 0.38 V. The sharp peaks at ca. 0.28 V (Figure 4.6) should relate mainly to (100)×(111) step defects.30,37
Figure 4.5. (left) The effect of repeated consecutive deposition and reductive stripping of the saturated NO adlayers on the blank voltammetry of Pt(100). Curve 1 corresponds to the initial blank voltammetry. Curves 2 and 3 correspond to the Pt(100) blank voltammogram recorded after the 1st and 3rd cycle of deposition and reductive stripping (at 2 mV s-1) of saturated NO adlayers. Experimental conditions: 0.5 M H2SO4; potential scan rate 50 mV s-1. The inset shows the voltammetry of the 1st (bold solid line) and the 3rd (solid line) NO adlayer stripping at 2 mV s-1.
0.0 0.1 0.2 0.3 0.4 0.5-200
-100
0
100
200
300
123
321
0.2 0.3
4 µA
j /
µA c
m-2
E / V vs RHE0.0 0.1 0.2 0.3 0.4 0.5 0.6
-200
-100
0
100
200
increasingdefects
j /
µA c
m-2
E / V vs RHE
Figure 4.6. (right) Blank cyclic voltammetry of Pt(100)-(1×1) surface (bold solid line) as compared to disordered Pt(100) surfaces. Dotted and solid lines correspond to the cyclic voltammograms resulted from an initially well-ordered surface after 15 and 50 potential cycles, respectively, between 0.06 and 0.9 V at 20 mV s-1.
Turning now to the effect of the surface defects on the reduction of NOads,
the presence of a small number of the defect sites, which give rise to the pair of peaks at ca. 0.28 V (Figure 4.5), is reflected in the appearance of a pre-shoulder to the main peak of the NOads stripping (see the inset of Figure 4.5). Figure 4.6 shows the blank CVs for a well-ordered Pt(100)-(1×1) (bold solid line) as compared to Pt(100) surfaces with a different level of the surface disorder. Figure 4.7 illustrates the stripping voltammetry of saturated NO adlayers from those surfaces. Most noticeably, the sharp peak ER3
100 shifts toward positive potentials and loses its intensity with shoulders evolving at negative and positive potentials. The surface
63

Chapter 4
defect sites appear to be more active sites for NO reduction, as compared to the sites on the (100) terrace, although the effect is quite moderate.
0.1 0.2 0.3 0.4 0.5
-60
-30
0
ER3100
ER4100
increasingdefects
j
/ µA
cm
-2
E / V vs RHE
Figure 4.7. Stripping voltammetry for the electrochemical reduction of saturated nitric oxide adlayers on Pt(100) with different degree of the surface disorder. Experimental conditions: 0.5 M H2SO4; starting potential 0.5 V; potential scan rate 2 mV s-1. The corresponding initial blank voltammetric profiles are presented in Figure 6.
Remarkably, consecutive deposition and stripping of the saturated NO
adlayer result in a gradual decrease of the current contribution around 0.28 V and simultaneous increase of the intensity of the peaks at ca. 0.38 V in the blank voltammetry, which are characteristic for the adsorption/desorption processes on (100) terraces (Figure 4.5). Moreover, NO adsorption and reductive stripping bring about a considerable ordering, although not a complete recovery, of even strongly disordered Pt(100) surfaces, such as the surfaces voltammograms of which are shown in Figure 4.6. This result indicates that NO adsorption and/or NO reductive stripping can effectively extend the (100)-(1×1) domains at the expense of certain surface defects, apparently (100)×(111) step sites. This apparent smoothening of the surface can be tentatively assigned to the quasi-hexagonal reconstruction of small (1×1) domains (islands) (although, unlikely the extended (100) terraces) on the surface and the subsequent lifting of the reconstructed domains by NO adsorption, resulted in formation of more extended (1×1) domains.
4.3.5. Tafel slope analysis
Figure 4.8 shows the results of the Tafel slope analysis of the reduction
features ER3100 and ER4
100 in perchloric (A) and sulfuric acid (B), respectively. As shown elsewhere,39,40 the peak position (Ep) versus logarithm of the scan rate (v)
64

Mechanism of electrocatalytic reduction of nitric oxide on Pt(100) surface
graph allows determination of the Tafel slope for surface-confined processes, both for first- and for second-order kinetics. The peak position of the feature ER4
100 was obtained from deconvolution of the voltammetric profile corresponding to the reductive stripping of a saturated NO adlayer into two Voigtians. In the scan rate region between approximately 1 and 20 mV s-1, the Ep – log(v) dependences for the reduction peaks ER3
100 and ER4100 show good linearity for experiments in both
sulfuric and perchloric acid, with Tafel slopes close to 60 mV decade-1. At higher scan rates, the two features overlap even stronger and there is a clear deviation from the initial linearity of the Ep – log(v) dependence. Interestingly, for experiments in perchloric acid we could observe an apparent recovery of the linearity and the slope at higher scan rates (50-100 mV s-1), although only one reduction peak is observed. As an important observation, the reduction features ER3
100 and ER4100 show similar Tafel slopes, which would rather favor the
assumption that these features are related to the reduction of adsorbed NO species having somewhat different reactivity and not to consecutive steps of an overall process.
-3.0 -2.5 -2.0 -1.5 -1.00.05
0.10
0.15
0.20
0.25
0.30(A)
HClO4
ER4100
ER3100 63 mV decade-1
61 mV decade-1
59 mV decade-1
E p /
V vs
RH
E
log (υ / V s-1)-3.5 -3.0 -2.5 -2.0 -1.5 -1.0
0.05
0.10
0.15
0.20
0.25
0.30
(B)
ER4100
ER3100
H2SO4
67 mV decade-1
61 mV decade-1
log (υ / V s-1)
Figure 4.8. Tafel slope analysis of the voltammetric features ER3 and ER4 in perchloric (A) and sulfuric (B) acid. Experimental conditions: 0.5 M HClO4 or 0.5 M H2SO4; saturated NO adlayer; starting potential 0.5 V. The numbers indicate the slope of the corresponding least-square linear regression lines.
4.3.6. In situ FTIR measurements
Figure 4.9 contains the potential difference spectra for the reductive
stripping of a saturated NO adlayer on Pt(100). The experiment was started with a saturated NO adlayer at 0.5 V, a potential at which NOads is (electro)chemically stable. Significantly, the potential-dependent band centered between ca. 1620 and
65
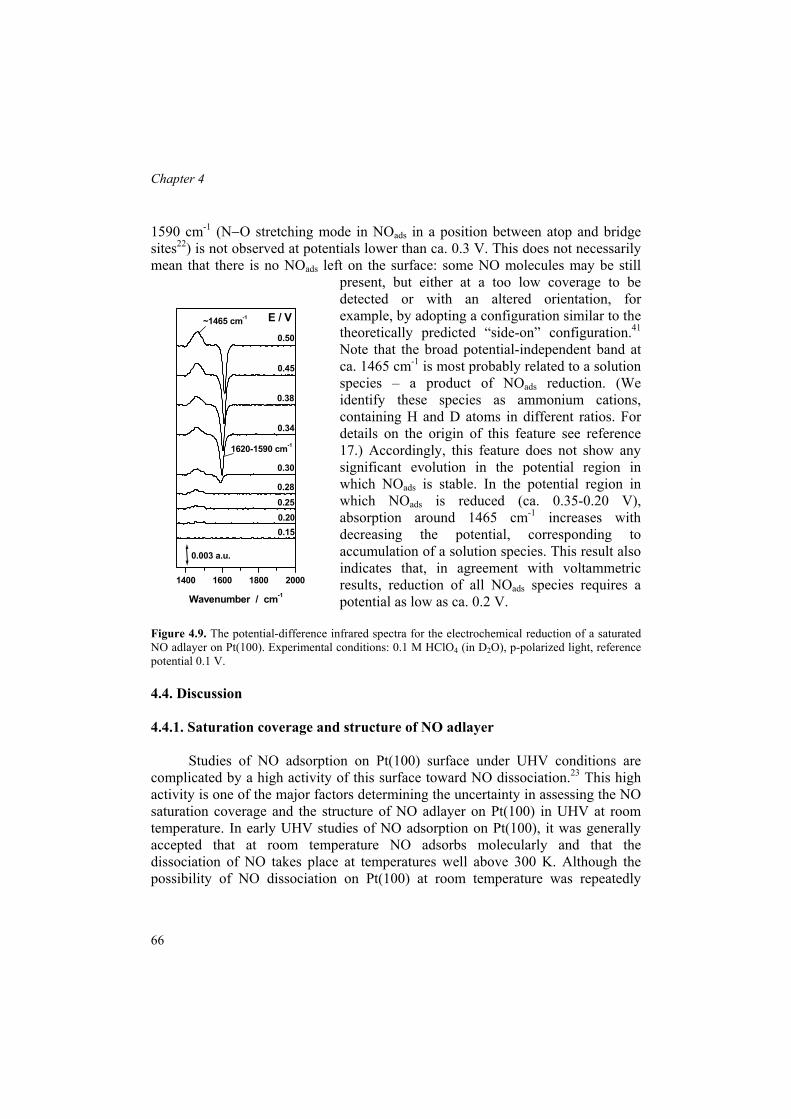
Chapter 4
66
1400 1600 1800 2000
~1465 cm-1
1620-1590 cm-1
0.150.200.250.28
E / V
0.45
0.34
0.38
0.30
0.50
0.003 a.u.
Wavenumber / cm-1
1590 cm-1 (N−O stretching mode in NOads in a position between atop and bridge sites22) is not observed at potentials lower than ca. 0.3 V. This does not necessarily mean that there is no NOads left on the surface: some NO molecules may be still
present, but either at a too low coverage to be detected or with an altered orientation, for example, by adopting a configuration similar to the theoretically predicted “side-on” configuration.41 Note that the broad potential-independent band at ca. 1465 cm-1 is most probably related to a solution species – a product of NOads reduction. (We identify these species as ammonium cations, containing H and D atoms in different ratios. For details on the origin of this feature see reference 17.) Accordingly, this feature does not show any significant evolution in the potential region in which NOads is stable. In the potential region in which NOads is reduced (ca. 0.35-0.20 V), absorption around 1465 cm-1 increases with decreasing the potential, corresponding to accumulation of a solution species. This result also indicates that, in agreement with voltammetric results, reduction of all NOads species requires a potential as low as ca. 0.2 V.
Figure 4.9. The potential-difference infrared spectra for the electrochemical reduction of a saturated NO adlayer on Pt(100). Experimental conditions: 0.1 M HClO4 (in D2O), p-polarized light, reference potential 0.1 V.
4.4. Discussion
4.4.1. Saturation coverage and structure of NO adlayer
Studies of NO adsorption on Pt(100) surface under UHV conditions are
complicated by a high activity of this surface toward NO dissociation.23 This high activity is one of the major factors determining the uncertainty in assessing the NO saturation coverage and the structure of NO adlayer on Pt(100) in UHV at room temperature. In early UHV studies of NO adsorption on Pt(100), it was generally accepted that at room temperature NO adsorbs molecularly and that the dissociation of NO takes place at temperatures well above 300 K. Although the possibility of NO dissociation on Pt(100) at room temperature was repeatedly

Mechanism of electrocatalytic reduction of nitric oxide on Pt(100) surface
suggested,32-34 this process seems to be quite sluggish (on the order of tens of minutes42).
The saturation coverage of 0.5 ML and a c(2×4) overlayer structure (Figure 4.10A) seem to account well for the LEED,43 vibrational,21,22 and the adsorption calorimetric31 data for NO adsorption on Pt(100) at room temperature. A somewhat lower coverage (ca. 0.4 ML) for the saturation NO adlayer at room temperature was reported by Zemlyanov et al.44,45 in their combined EELS and TPD studies of NO adsorption and reduction on Pt(100); the authors did not address the structure of the adlayer. More recently, in an STM study, Song et al.33 proposed a simple c(2×4) overlayer structure corresponding to a coverage of 0.25 ML for the saturation NO adlayer on Pt(100) at 300 K (Figure 4.10B). Rienks et al.34 showed in their synchrotron XPS study that in the temperature range between 250 and 325 K both molecular and dissociative adsorption of NO takes place.
Figure 4.10. Structural models for saturated NO adlayer on Pt(100)-(1×1). Panel A shows a c(2×4) overlayer structure with 0.5 ML coverage, proposed by Yeo et al. (ref. 31) as a development of earlier models (refs. 43 and 22). Panel B shows a simple c(2×4) overlayer structure with 0.25 ML coverage, as proposed by Song et al. (ref. 33).
Turning to the coverage estimation under electrochemical conditions, the
charge analysis of the stripping voltammetry of the saturated NO adlayer gives a coverage of ca. 0.5 ML, assuming ammonia as the only product of NOads reduction. This value would be consistent with the formation of a c(2×4) overlayer structure (or whatever the structure of the saturated adlayer is) under electrochemical conditions as well, as proposed in earlier in situ electrochemical studies.7,8 The resemblance of the infrared spectra recorded for NO adsorbed on Pt(100) under electrochemical and UHV conditions at room temperature10,17 supports the assumption of the structural similarity. As an indication of the stability of the molecularly adsorbed NO species, the voltammograms for Pt(100) covered with a saturated NO adlayer show very low and stable (charging) current in a wide potential region between ca. 0.9 and 0.3 V. The “direct” dissociation of NO molecules would result in the formation of adsorbed oxygen-containing species,
67

Chapter 4
which would not be stable in the above potential region and would show significant faradaic currents. All together, our experimental data as well as the considerations given above confirm that in an electrochemical environment (acidic media) the NO species are adsorbed molecularly on Pt(100) and the NO saturation coverage is ca. 0.5 ML.
4.4.2. Mechanism of reduction of NOads on Pt(100)
The Tafel slope analysis of the reduction features ER3
100 and ER4100 (Figure
4.8), corresponding to the reductive stripping of a saturated NO adlayer, gives a good linearity of the Ep−log(v) dependence. The slopes for both features are close to the theoretical value of 60 mV decade-1, irrespective of the anion (sulfate vs perchlorate). This result indicates that both features correspond to an electrochemical process, in which the first electron (likely accompanied by a proton transfer) is fast (at equilibrium), while the second step is a chemical and rate-determining step. Because the reduction of NOads on Pt(100) seems to become chemically irreversible at an early stage of the process (Figure 4.4 and the corresponding discussions) and the breaking of the N−O bond is expected to be facile on Pt(100), we propose the following mechanism for NOads reduction:
NOads + e− + H+ HNOads equilibrium (4.4) HNOads + * HNads + Oads slow (4.5) HNads + 2 e− + 3H+ NH4
+ + * fast (4.6) Oads + 2e− + 2H+ H2O + * fast (4.7)
The overall reaction would then be: NOads + 5e− + 6H+ + * NH4
+ + H2O + 2* (4.8) Most importantly, we assume here that, similarly to NO reduction in UHV,
breaking of the N−O bond (in HNOads) requires an adjacent free site (designated as *). The reason HNO and not NOH is suggested as the first intermediate is that gas phase HNO is about 100 kJ mol-1 more stable than gas phase NOH,20 although their stability at the surface is admittedly unknown. Interestingly, Zemlyanov et al.,46 in their combined TPR and HREELS studies, have pointed to the formation of HNads and H2Nads species during NOads reduction on Pt(100)-(1×1) at 300 K. Smirnov et al.47 claimed the existence of chemisorbed HNO during the coadsorption of NO and H on Pt(111) from HREELS experiments. Reactions 4.6 and 4.7 are complex processes, which likely involve fast electron/proton transfers. On the other hand,
68
Mechanism of electrocatalytic reduction of nitric oxide on Pt(100) surface
these reactions may still involve catalytic hydrogenation steps, as the electrochemical reduction of NO adlayers occurs at potentials corresponding to significant hydrogen coverage.
4.4.3. Comparison of the mechanism of NOads reduction on Pt(100), Pt(111), and Pt(110)
The voltammetric features observed in the voltammetric profile for NOads
reduction on Pt(111) and Pt(110) are determined by reaction of NOads species having different coordination, as discerned from in situ infrared measurements.17 Similar analysis is less conclusive for NOads reduction on Pt(100). Note that (HR)EELS studies21,46 as well as FTIR22 studies under UHV conditions (room temperature) indicate a single N−O stretching frequency of NOads on Pt(100)-(1×1) surface (1600-1640 cm-1 region), thus pointing to a single NO adsorption site on (100) terraces at saturation. This adsorption site is usually identified as a position between atop and bridge site, as shown in Figure 4.10A. In an electrochemical environment, adsorbed NO is also characterized by a single N−O stretching band in the 1590-1620 cm-1 range of frequencies, which, however, is not observed at potentials lower than ca. 0.3 V (Figure 4.9). Therefore, the two features observed in voltammetric profile for reduction of a saturated NO adlayer cannot not be straightforwardly ascribed to the reaction of NO species having different coordination, which is in contrast to NOads reduction on Pt(111) and Pt(110).
At the same time, it is important to realize that at saturation coverage a simultaneous reaction of all NO molecules on Pt(100) under UHV conditions or in an electrochemical environmental is very unlikely. This aspect is related to the necessity of a free site for breaking the N−O bond under UHV conditions and assumedly in an electrochemical environment. Therefore, we should consider the possibility of formation of a quasi-stable surface configurations formed by subsaturated NO adlayer and coadsorbed hydrogen. Existence of such a configuration would imply a different reaction environment and possibly different adsorption geometry for NO adsorbate and, thus, could give rise to a second reduction feature.
Comparing the mechanisms of the electrocatalytic reduction of NOads on Pt(111), Pt(110),16,18 and Pt(100) (present work), the process appears to be mechanistically structure sensitive, although the main product is the same at all three surfaces – ammonia. More specifically, on Pt(110) and Pt(111), breaking of the N−O bond is preceded by two to three combined electron-proton transfers at equilibrium (Tafel slope of 40 mV decade-1 or even lower16,17), while on Pt(100) the N−O bond breaking seems to occur after the first electron-proton transfer (Tafel
69
Chapter 4
slope of 60 mV decade-1). The more facile breaking of the N−O bond on Pt(100), as compared to the other two surfaces, is in remarkable concordance with a similar trend observed in UHV: Pt(100) is the only low-index surface at which the dissociative adsorption of NO occurs. At the same time, electrochemical hydrogenation followed by the N−O bond breaking seems to provide an energetically more favorable route for NOads reduction on Pt(100), as compared to a direct breaking of the N−O bond. Furthermore, the reaction scheme 4.4-4.7 excludes formation of hydroxylamine during NOads reduction on Pt(100).
Finally, as shown in the Results and Data Analysis section, the surface defects appear to be more active sites for NO reduction, as compared to the sites on the (100) terrace, although the effect is moderate. Lack of a considerable effect of the step density on the electrocatalyst activity was also observed for NOads reduction on Pt(111), Pt(110), and a series of Pt-[n(111)×(111)] stepped surfaces. This result is, in fact, expected, because the activity of platinum surfaces toward NOads reduction seems to be related to the coordination (linear versus multifold bonding) of NO adsorbate, and not to specific reaction sites, for example, low-coordination metal atoms.
4.5. Summary and Conclusions
We have used voltammetry and in situ infrared spectroscopy to study the
mechanism of the electrocatalytic reduction of adsorbed nitric oxide on Pt(100)-(1×1). We have examined the effect of surface defects, NO coverage and the nature of the supporting electrolyte (sulfate vs perchlorate).
The voltammetric profile for the electrochemical reduction of a saturated NO adlayer exhibits two features, which were tentatively ascribed to reactions of NO species having different reactivity. Ammonia was shown to be the main product of NOads reduction on Pt(100), most probably irrespective of the coverage. The surface defects, in particular (100)×(111) steps, render the Pt(100) surface a higher activity toward NOads reduction, although the effect is moderate. The reactivity of the saturated NO adlayer on Pt(100) does not seem to be affected by the nature of the anion. There is also a small effect of the coverage of NOads: the reduction of subsaturated NO adlayers starts at more positive potentials (ca. 50 mV).
The Tafel slope analysis of the features appearing in the voltammetric profile for the reductive stripping of a saturated NO adlayer gives values of ca. 60 mV decade-1, irrespective of the nature of anion. This value of the Tafel slope was interpreted in terms of an EC mechanism, in which the first electron-proton transfer is at equilibrium, whereas the second reaction step is a chemical and the rate-
70

Mechanism of electrocatalytic reduction of nitric oxide on Pt(100) surface
determining step. This chemical step is assumed to involve the N−O bond breaking in HNOads intermediate and is postulated to require a free neighboring site.
When comparing NOads reduction on Pt(100) to NOads reduction on Pt(110) and Pt(111), breaking of the N−O bond on Pt(100) appears to occur at an earlier stage of the reaction. This result leads to the following observations. First, the mechanism of NOads reduction on platinum depends on the surface structure, although the main reaction product is still the same – ammonia. Second, despite comparable overall activities of the three surfaces toward NOads reduction, Pt(100) is still the most active in breaking the N−O bond, which is in interesting agreement with the similar trend observed under UHV conditions.
As a final remark, the mechanism proposed for the electrocatalytic reduction of NO adsorbate on Pt(100) seems to provide a framework for explaining the electrocatalytic transformations of hydroxylamine at the same surface.48 For more details, see Chapter 5.
References
(1) Plieth, W. J. Encyclopedia of Electrochemistry of the Elements; Bard, A. J., Ed.; Marcel Dekker:
New-York, 1978; pp 422. (2) Rodes, A.; Gomez, R.; Orts, J. M.; Feliu, J. M.; Perez, A.; Aldaz, A. J. Electroanal. Chem. 1993,
359, 315. (3) Ye, S.; Kita, H. J. Electroanal. Chem. 1993, 346, 489. (4) Gomez, R.; Rodes, A.; Orts, J. M.; Feliu, J. M.; Perez, J. M. Surf. Sci. 1995, 342, L1104. (5) Rodes, A.; Gomez, R.; Orts, J. M.; Feliu, J. M.; Perez, A.; Aldaz, A. Langmuir 1995, 11, 3549. (6) Villegas, I.; Gomez, R.; Weaver, M. J. J. Phys. Chem. 1995, 99, 14832. (7) Rodes, A.; Gomez, R.; Perez, A.; Feliu, J. M.; Aldaz, A. Electrochim. Acta 1996, 41, 729. (8) Rodes, A.; Climent, V.; Orts, J. M.; Perez, J. M.; Aldaz, A. Electrochim. Acta 1998, 44, 1077. (9) Momoi, K.; Song, M. B.; Ito, M. J. Electroanal. Chem. 1999, 473, 43. (10) Weaver, M. J.; Zou, S.; Tang, C. J. Chem. Phys. 1999, 111, 368. (11) Weaver, M. J. Surf. Sci. 1999, 437, 215. (12) Zang, Z.-H.; Wu, Z.-L.; Yau, S.-L. J. Phys. Chem. B 1999, 103, 9624. (13) Zou, S.; Gomez, R.; Weaver, M. J. J. Electroanal. Chem. 1999, 474, 155. (14) Casero, E.; Alonso, C.; Martin-Gago, J. A.; Bogatti, F.; Felici, R.; Renner, R.; Lee, T.;
Zegenhagen, J. Surf. Sci. 2002, 507-510. (15) Alvarez, B.; Rodes, A.; Perez, J. M.; Feliu, J. M.; Rodriguez, J. L.; Pastor, E. Langmuir 2000, 16,
4695. (16) Beltramo, G. L.; Koper, M. T. M. Langmuir 2003, 19, 8907. (17) Rosca, V.; Beltramo, G. L.; Koper, M. T. M. Langmuir 2005, 21, 1448. (18) Rosca, V.; Koper, M. T. M. Surf. Sci. 2005, 584, 258. (19) de Vooys, A. C. A.; Beltramo, G. L.; van Riet, B.; van Veen, J. A. R.; Koper, M. T. M.
Electrochim. Acta 2004, 49, 1307. (20) de Vooys, A. C. A.; Koper, M. T. M.; van Santen, R. A.; van Veen, J. A. R. Electrochim. Acta
2001, 46, 923. (21) Pirug, G.; Bonzel, H. P.; Hopster, H.; Ibach, H. J. Chem. Phys. 1979, 71, 593. (22) Gardner, P.; Tueshaus, M.; Martin, R.; Bradshaw, A. M. Surf. Sci. 1990, 240, 112.
71
Chapter 4
(23) Masel, R. I. Catal. Rev. -Sci. Eng. 1986, 28, 335. (24) Tang, C.; Zou, S.; Weaver, M. J. Surf. Sci. 1998, 412-413, 344. (25) Clavilier, J.; Armand, D.; Sun, S. G.; Petit, M. J. Electroanal. Chem. 1986, 205, 267. (26) Feliu, J. M.; Orts, J. M.; Fernandez-Vega, A.; Aldaz, A.; Clavilier, J. J. Electroanal. Chem. 1990,
296, 191. (27) Iwasita, T.; Nart, F. C.; Vielstich, W. Ber. Bunsen-Ges. Phys. Chem. 1990, 94, 1030. (28) Clavilier, J.; Feliu, J. M.; Fernandez-Vega, A.; Aldaz, A. J. Electroanal. Chem. 1989, 269, 175. (29) Rodes, A.; Clavilier, J.; Orts, J. M.; Feliu, J. M.; Aldaz, A. J. Electroanal. Chem. 1992, 338, 317. (30) Al-Akl, A.; Attard, G. A.; Price, R.; Timothy, B. J. Electroanal. Chem. 1999, 467, 60. (31) Yeo, Y. Y.; Vattuone, L.; King, D. A. J. Chem. Phys. 1996, 104, 3810. (32) Sugai, S.; Takeuchi, K.; Ban, T.; Miki, H.; Kawasaki, K. Surf. Sci. 1993, 282, 67. (33) Song, M.-B.; Momoi, K.; Ito, M. Jpn. J. Appl. Phys. 1997, 36, L1528. (34) Rienks, E. D. L.; Bakker, J. W.; Baraldi, A.; Carabiniero, S. A. C.; Lizzit, S.; Weststrate, C. J.;
Nieuwenhuys, B. E. Surf. Sci. 2002, 516, 109. (35) Lesley, M. W.; Schmidt, L. D. Surf. Sci. 1985, 155, 215. (36) Kibler, L. A.; Cuesta, A.; Kleinert, M.; Kolb, D. M. J. Electroanal. Chem. 2000, 484, 73. (37) Al-Akl, A.; Attard, G. A.; Price, R.; Timothy, B. Phys. Chem. Chem. Phys. 2001, 3, 3261. (38) Clavilier, J.; El Achi, K.; Petit, M.; Rodes, A.; Zamakhchari, M. A. J. Electroanal. Chem. 1990,
295, 333. (39) Christiansen, P. A.; Hamnett, A. Techniques and Mechanisms in Electrochemistry; Blackie
Academic and Proffessional: Glasgow, 1994. (40) Koper, M. T. M.; Jansen, A. P. J.; Santen van, R. A.; Lukkien, J. J.; Hilbers, P. A. J. J. Chem.
Phys. 1998, 109, 6051. (41) Ge, Q.; Neurock, M. J. Am. Chem. Soc. 2004, 126, 1551. (42) Fink, T.; Dath, J. P.; Bassett, M. R.; Imbihl, R.; Ertl, G. Surf. Sci. 1991, 245, 96. (43) Bonzel, H. P.; Broden, G.; Pirug, G. J. Catal. 1978, 53, 96. (44) Zemlyanov, D. Y.; Smirnov, M. Y.; Gorodetskii, V. V. React. Kinet. Catal. Lett. 1994, 53, 87. (45) Zemlyanov, D. Y.; Smirnov, M. Y. React. Kinet. Catal. Lett. 1994, 53, 97. (46) Zemlyanov, D. Y.; Smirnov, M. Y.; Gorodetskii, V. V.; Block, J. H. Surf. Sci. 1995, 329, 61. (47) Smirnov, M. Y.; Gorodetskii, V. V.; Block, J. H. J. Mol. Catal. A: Chem. 1996, 107, 359. (48) Rosca, V.; Beltramo, G. L.; Koper, M. T. M. J. Phys. Chem. B 2004, 108, 8294.
72

5
Electrocatalytic reactions of hydroxylamine at low-index single-crystal platinum surfaces in acidic media
Abstract The electrochemistry of hydroxylamine at low-index single-crystal platinum electrodes (Pt(111), Pt(110), and Pt(100)) in acidic media has been studied using voltammetry, in situ infrared spectroscopy, and on-line mass spectrometry. The reactivity of hydroxylamine (HAM) at platinum surfaces is largely controlled by interaction of the other components of the solution or products of the HAM partial oxidation with the electrode surface. Reduction of HAM is a structure sensitive reaction, at least through the structure sensitivity of the hydrogen adsorption on platinum. No formation of gaseous products was detected in the potential region corresponding to the Hupd region at all the surfaces examined. Voltammetric and spectroscopic data point to adsorbed nitric oxide (NOads) as the main stable intermediate of the HAM oxidation. Being electrochemically stable in a wide potential region between ca. 0.5 and 0.8 V, adsorbed NO acts as a poison in further oxidation of HAM. The HAM oxidation to NOads appears to be a structure-insensitive process, though the adsorption of NO seems affected by anion coadsorption. The mechanism of the HAM oxidation to NOads proposed here is consistent with the mechanism of the NOads reduction proposed elsewhere. Voltammetric data for all three low-index surfaces indicates the possibility of the HAM reduction and oxidation to occur simultaneously at moderate potentials. This fact may be tentatively explained by the existence of an intermediate, which appears both in the reduction and oxidation process. Accordingly, the reduction of HAM would be activated by a dehydrogenation step. The H2NOads or HNOads species were indicated as candidates. The formation of N2O at moderately oxidative potentials (below ca. 0.9 V) was observed for HAM oxidation at Pt(111) and Pt(110), but not at Pt(100).
This chapter is based on article by V. Rosca, G.L. Beltramo, and M.T.M. Koper, published in Journal of Physical Chemistry B, 108 (2004) 8294.
73

Chapter 5
5.1. Introduction Electrochemical reactions of hydroxylamine (HAM) are of great
technological importance as well as of significant scientific interest. In industry, HAM is obtained by the liquid-phase catalytic hydrogenation of nitric oxide (NO) or nitrate at carbon-supported platinum or palladium catalysts.1,2 The relevance of the electrochemical studies on similar catalysts, as well as on model systems, for understanding the processes practiced in industry is well accepted.3-6 From a scientific point of view, HAM electrochemistry is important for a fundamental understanding of the redox chemistry of inorganic nitrogen compounds. Furthermore, the electrochemical transformations of hydroxylamine could be attractive for studying fundamental aspects of the complex electrode processes involving multiple electron and proton transfer.
The mechanisms of HAM oxidation and reduction on platinum are complex,7 and only a limited number of detailed mechanistic studies have been reported so far.8-14 The mechanism of HAM oxidation on platinum is commonly viewed in terms of stepwise dehydrogenation and further transformation of the intermediates. The intermediates of the first two electron-proton transfers in HAM oxidation (HNOH and NOH) are considered responsible for N2O formation, either by their interaction on the surface or by their reaction with HAM in solution.11-13 However, explicit evidence for these intermediates remains to be established. Other factors contributing to the complexity of the subject are (i) the adsorption of intermediates, products and components of the electrolyte (anions, for example) on the electrode surface and (ii) the complex homogeneous chemistry of inorganic nitrogen containing compounds.
Recently we have studied in detail the electrochemistry of HAM at polycrystalline platinum in acidic media, combining voltammetry, on-line mass spectrometry, and in situ infrared spectroscopy.13 An important conclusion was that the HAM electrochemical activity is masked by adsorption of other species, such as hydrogen, products of HAM oxidation (NO), anions ((bi)-sulfate) and other species. Under these circumstances, the investigation of the electrochemistry of HAM on platinum single-crystal electrodes is a logical next step, as the adsorption of these species on single-crystal surfaces is much better defined. Studies on low-index single crystals may provide information on the structure sensitivity of the processes under investigation and help in resolving the effect of adsorption phenomena on the HAM reactivity.
This chapter describes the results of a combined voltammetric, in situ infrared spectroscopic, and on-line mass spectrometry study of HAM electrochemistry at low-index single-crystal platinum electrodes in acidic media. Our aim was to characterize the reactivity of HAM on platinum and the effect of
74

Electrocatalytic reactions of hydroxylamine at low-index single-crystal platinum surfaces in acidic media
surface structure on the reactions of HAM. The in situ Fourier transform infrared absorption-reflection spectroscopy (FTIRRAS) and the on-line electrochemical mass spectrometry (OLEMS) were used to detect two important products of HAM oxidation – nitric oxide (NO) and nitrous oxide (N2O), as well as to identify the potential limits within which they are formed. We discuss the mechanistic aspects of HAM oxidation to NO and N2O, as well as HAM reduction to ammonia. The mechanistic results are further discussed in light of the recent findings on the mechanism of the reduction of adsorbed NO (NOads) on polycrystalline platinum15 and on single-crystal platinum surfaces.16-18
5.2. Experimental Section
The H2SO4 and HClO4 working solutions were prepared from their respective
concentrated acids (“Suprapur”, Merck) and ultrapure water (Millipore MilliQ system, 18.2 MΩ cm, 2 ppb total organic carbon). The infrared experiments aimed at detection of nitric oxide were performed in a H2SO4 solution prepared with deuterium oxide (Merck, deuteration degree min. 99.8%). Hydroxylamine solutions were prepared by dissolving hydroxylammonium sulfate (Merck, “Pro Analysi”) in ultrapure water or deuterium oxide. Prior to each experiment, all solutions were deoxygenated by purging with pure (N50) argon.
Bead-type single-crystal platinum electrodes, prepared by Clavilier’s method,19 were used for most of the electrochemical measurements. For the in situ FTIR measurements, commercial platinum disc electrodes of 10 mm in diameter were used (Surface Preparation Laboratory, Zaandam, The Netherlands). Prior to each experiment, the working electrode was flame-annealed, cooled to room temperature in an Ar:H2 (3:1) atmosphere and transferred to the electrochemical cell under the protection of a droplet of deoxygenated ultrapure water.
Electrochemical measurements were performed in a conventional single-compartment three-electrode glass cell, using a computer-controlled potentiostat (AutoLab-PGSTAT20, Eco Chemie, Utrecht, The Netherlands). The cell and the other glassware were cleaned by boiling in a 1:1 mixture of concentrated nitric and sulfuric acid, followed by repeated boiling with ultrapure water. A coiled platinum wire served as counter electrode. In HClO4 solutions, the reference electrode was an internal Reversible Hydrogen Electrode (RHE). In H2SO4 solutions, a saturated mercury-mercury sulfate (Hg/Hg2SO4/K2SO4) electrode, connected via a Luggin capillary, was used as reference. However, all potentials are quoted versus the RHE.
The in situ FTIRRAS measurements were performed under external reflection conditions. The spectrometer used was a Brüker IFS113V, equipped with a narrow-band MCT detector. The spectroelectrochemical cell20 featured a prismatic CaF2 window bevelled at 60o. Five huundred interferograms were collected at each potential. The resolution was 8 cm-1. The reflectance spectra were calculated as (R- R0)/R0, where R and R0 are the reflectance at the sample and the reference potential respectively. Consequently,
75
Chapter 5
the ∆R/R ratio gives negative bands for species that are formed and positive bands for species consumed at the sample potential, as compared to the reference potential.
The on-line electrochemical mass spectrometry (OLEMS) measurements were performed using a Balzers Quadrupole (QMS 200) mass spectrometer. A Leybold turbo molecular pump together with a Leybold trivac D4B pre-pump assured a pressure lower than 5×10⁻⁶ mbar. The connection between the mass spectrometer and the cell was established through a steel capillary connected to a glass tube onto which a polyetheretherketon (PEEK, San Diego Plastics, Inc., National City, CA) holder was attached. The inlet of the PEEK holder (ca. 0.6 mm diameter) contained a porous Teflon membrane (pore size 10 µm, Mupor Limited, Scotland, UK). This tip inlet can be placed at 10-20 µm from the electrode surface using a specially designed positioning system. Owing to a small surface area of the inlet and, therefore, the small amount of volatile products and solvent entering the tip, differential pumping during measurement is not necessary, thus resulting in a better sensitivity. Before each experiment the tip (holder + membrane) and the glass tube, which supports the tip, where cleaned by immersion in concentrated chromic acid for ca. 1 hour, followed by a thorough rinsing with ultrapure water and then boiling in ultrapure water for ca. 20 minutes. The proximity of the tip does not affect the cleanliness of the electrode surface, as deduced from the blank voltammetry. A detailed description of the setup is published elsewhere.21
The system cleanliness was checked by recording the blank cyclic voltammogram (CV) before the experiment. The criteria for assessing the surface order and cleanliness of the electrode surface applied to electrodes used for in situ IR measurements were identical to those practiced in this laboratory for purely electrochemical measurements.22,23
5.3. Results and Data Analysis
5.3.1. Pt (111)
Figure 5.1A shows cyclic voltammograms (CVs) recorded at a Pt(111)
electrode in contact with a HAM-containing sulfuric acid solution. In order to avoid any interference from the products of HAM oxidation, all potential sweep experiments were started in the hydrogen underpotential deposition (Hupd) region at about 0.06 V (unless otherwise stated) and subsequently ran in the positive direction. As can be seen from the figure, HAM shows no noticeable activity in the Hupd region up to ca. 0.2 V. However, above this potential, a prominent reduction peak occurs at ca. 0.3 V (ER4
111), followed by the oxidation peak EO1111 at ca. 0.45
V. The ER4111 and EO1
111 features seem to partially overlap, thus indicating that the corresponding processes are not completely separated on the potential scale. In contrast, the oxidation feature EO1
111 is well separated from the oxidation feature EO2
111 (at ca. 0.95 V) by a wide potential region of low positive current. If the positive-going potential sweep is reversed at 1 V, the only important voltammetric
76

Electrocatalytic reactions of hydroxylamine at low-index single-crystal platinum surfaces in acidic media
features observed in the negative-going sweep are the reduction peaks ER2111 and
ER3111. The situation is qualitatively similar in a perchloric acid solution (Figure
5.1B), except for the higher current densities recorded in the positive-going sweep in the potential region between ca. 0.2 and 1 V for the latter electrolyte. This finding demonstrates the qualitative effect of anion adsorption, in spite of introducing small amounts of sulfate by using hydroxylammonium sulfate as the source of HAM.
0.0 0.5 1.0
-50
-25
0
25
EO2111EO1
111
ER4111
ER3111
ER2111
ER1111
(B)(A)
j /
µA c
m-2
E / V vs RHE0.0 0.5 1.0
-50
-25
0
25
Figure 5.1. Cyclic voltammograms recorded at Pt(111) electrodes in 0.5 M sulfuric (A) and 0.5 M perchloric (B) acid solutions in absence (solid line) and presence (bold solid line) of NH2OH. Exp. conditions: 2.5×10⁻³ M NH2OH; potential sweep rate 5 mV s-1; starting potential 0.06 V.
The positive-going scan of the CV, presented in Figure 5.1A (or B), differs
significantly from the negative-going one, presumably due to the formation, the blocking effect, and the reduction of some product(s) of HAM oxidation. Continuous potential cycling, combined with a gradual increase of the upper potential limit of the CV, allowed us to follow the appearance and evolution of the reduction features ER2
111 and ER3111 in the negative-going scan (see Figure 5.2). If a
sufficiently low potential sweep rate is applied (5 mV s-1 or lower), the positive-going sweep has always the same shape, while the negative-going voltammetric profile changes as a function of the vertex potential. As shown in Figure 5.2A, the reduction features ER2
111 and ER3111, as well as (shoulder-like) feature ER1
111, appear and develop in the negative-going sweep with the increasing upper potential limit of the corresponding CVs. Significantly, if the upper potential limit coincides with or is lower than the peak potential of the feature ER4
111, no signs of the feature
77

Chapter 5
ER3111 can be found in the negative-going scan. Therefore, in the potential region
between ca. 0.2 and 0.3 V only HAM electroreduction should occur.
0.0 0.2 0.4 0.8 1.0
-50
0
(A)
blank 0.20 0.30 0.35 0.40 0.50 1.00
j /
µA c
m-2
E / V vs RHE0.0 0.5 1.0
-20
-10
0
10 (B)
blank NO adlayer 2.5 mM HAM
E / V vs RHE
Figure 5.2. Cyclic voltammograms recorded at Pt(111) electrode in 0.5 M sulfuric (A). Numbers in the legend indicate the upper potential limit (vertex potential) of the corresponding CVs. Experimental conditions: 5×10⁻³ M NH2OH; potential sweep rate 5 mV s-1. Starting potential 0.06 V. In panel (B) the negative-going voltammetric profile recorded in the hydroxylamine-containing solution is compared to the reductive stripping of a saturated NO adlayer (in the absence of NH2OH).
The CV profile observed can be understood in terms of (i) HAM reduction to
ammonia (ER4111), which is the only possible reduction product, and (ii) HAM
oxidation to nitric oxide (EO1111). The assumption of NO formation is based on a
good match between both position and shape of the reduction features ER2111 and
ER3111 with those observed for the reductive stripping of an NO adlayer under the
same experimental conditions,16 though in the absence of HAM (Figure 5.2B). Furthermore, the Tafel slope analysis of the features ER2
111 and ER3111, carried out
in Ep - log(v) coordinates,24,25 gives slopes of 41 mV decade-1 and 142 mV decade-1, respectively. These values are quite similar to those observed for the reductive stripping of saturated NO adlayers, that is 42 mV decade-1 and 126 mV decade-1.16 Due to the presence and stability of the NO adlayer, HAM oxidation is essentially blocked between ca. 0.5 and 0.9 V. However, as will be argued below, in this potential region a slow (continuous) oxidation of HAM still takes place.
From the effect of the potential sweep rate on the peak height, it was deduced that features ER2
111, ER3111, and EO1
111 are all surface-confined processes. Their peak current densities show a linear increase with the potential sweep rate (in log(j) – log (v) coordinates) in a wide window up to 1 V s-1. The values of
78

Electrocatalytic reactions of hydroxylamine at low-index single-crystal platinum surfaces in acidic media
corresponding slopes were close to 1 (within 10% error). The linear regression analysis was applied to 6 to 10 experimental points; the square of the correlation coefficient (r2) was at least 0.999 in all cases. The ER4
111 feature shows the same behavior (5 experimental points, slope 0.89, r2 = 0.997), although in a narrow range of sweep rates (2-20 mV s-1), probably due to a stronger overlap with feature EO1
111 at higher scan rate. An additional argument in favour of a surface reaction is the applicability of the Langmuir adsorption isotherm to the corresponding process (see below).
0.0 0.5 1.0-60
-40
-20
0
20
0.50 2.50 20.00
(B)
(A)
j /
µA c
m-2
E / V vs RHE0.00 0.01 0.02
-300
-200
-100
0
H2SO4 HClO4
103 (C
MH
AM /
j )
/ M
A-1 c
m2
10-3 CMHAM / M
Figure 5.3. Effect of NH2OH concentration on the positive-going voltammetric profile recorded at Pt(111) electrode (A) and the linearized Langmuir adsorption isotherm (B) (see text for details). Experimental conditions: 0.5 M H2SO4; potential sweep rate 5 mV s-1; starting potential 0.06 V.
The effect of the HAM concentration is analyzed on the basis of Figures
5.3A and 5.3B. We studied only moderate HAM concentrations (up to 50 mM), because in this range of concentrations the effect of anion adsorption could be easily followed. Figure 5.3A shows that (i) the reduction process corresponding to the feature ER4
111 is of positive order in HAM concentration and (ii) the oxidation process corresponding to feature EO1
111 is zero order in HAM concentration. Additionally, an increase of HAM concentration results in an increase, although moderate, of the current density in the potential region between ca. 0.6 and 1 V, including the process corresponding to the feature EO2
111. This observation supports the occurrence of the above-mentioned slow (continuous) HAM oxidation in this region in presence of adsorbed NO, whereas feature EO2
111 must be related to the
79

Chapter 5
oxidation of the NO adlayer to adsorbed HNO2 26,27 and possibly a reaction between the nitrite formed and HAM.
As mentioned above, the log(j) – log (v) analysis of the feature ER4111
suggests that the corresponding process of HAM reduction is a surface-confined process. Consequently, the current density (j) at a given potential should be proportional to the surface coverage of HAM (θHAM). Under these circumstances one can apply the Langmuir adsorption isotherm to test the hypothesis of adsorption. Here we followed a simple formalism28 that allows the linear form of the Langmuir adsorption isotherm to be used as a criterion for the adsorption, although the procedure is of little use for estimating the HAM coverage. The final expression used was
(CHAM / j) = 1 / ( k βHAM) + (1 / k) × CHAM (5.1)
where j is the observed current density (A cm-2); CHAM is the concentration of HAM (mol l-1); k is the proportionality constant between the observed current density and the coverage of HAM28 (A cm-2) ; βHAM is the adsorption parameter which also includes the activity coefficient (mol-1 l). Figure 5.3B shows the results of a graphic analysis based on relation 5.1. From the figure it can be seen that a good linearity was observed for experiments in both sulfuric and perchloric acid. The different values of the slopes reflect the effect of the specific adsorption of (bi)sulfate.
So far, we have examined HAM electrochemistry at Pt(111) on the basis of the voltammetric results. These results allowed us to identify adsorbed NO as the intermediate of HAM oxidation. However, voltammetry is of little use for detection of another important product of HAM oxidation, that is, nitrous oxide (N2O), which was, in fact, observed by other authors12 as well as in this laboratory13 in studies with polycrystalline platinum.
Figure 5.4 shows the potential-difference IR spectra collected in experiments with a Pt(111) electrode. Bulk N2O can be recognized by the asymmetric stretch (ν1) band, centered at 2231 cm-1.29 Spectra in Figure 5.4A contains a band at ca. 2230 cm-1, which proves the formation of N2O. As deduced from the change of the integrated area under this band with the applied potential, formation of N2O begins at ca. 0.3 V. The concentration of N2O in the thin layer appears to increase up to ca. 0.5 V and then decreases with a tendency to level at around 0.7 V. The diffusion of N2O out of the thin layer, in combination with a decrease of its formation rate between ca. 0.5 and 0.7 V, could account for the decrease of the integrated area of the corresponding band in this potential region. Note that the potential region of increasing N2O content (0.3-0.7 V) overlaps with the region where the processes
80

Electrocatalytic reactions of hydroxylamine at low-index single-crystal platinum surfaces in acidic media
corresponding to the voltammetric features ER4111 and EO1
111 are observed (see Figure 5.2A).
2100 2200 2300 2400
(A)E / V
0.65 V
0.50 V
0.35 V
0.15 V
~ 2230 cm-1
0.002 a.u.
Wavenumber / cm-1
1600 1700 1800
Wavenumber / cm-1
(B)
1659 cm-1
1675 cm-1
0.75 V
0.55 V
0.45 V
0.35 V
0.15 V
E / V
1691 cm-1
0.005 a.u.
Figure 5.4. The potential-difference infrared spectra collected at Pt(111) electrode at selected values of the applied potential (as indicated). Reference potential 0.1 V. Experimental conditions: 0.1 M H2SO4 + 1.5×10⁻² M NH2OH; in H2O (A) and in D2O (B); p – polarized light.
The assignment of the vibrational modes of adsorbed NO must be carried out
with care, as the N−O stretching mode will be displayed in a wide range of frequencies, depending on the surface orientation, NO coverage, and the applied potential. The potential-dependent negative band displayed in the 1600-1700 cm-1 frequency range (Figure 5.4B) can be assigned to NO adsorbed in atop position (for details, see Chapter 2, section 2.3.2). This assignment is in good agreement with previous studies of NO adsorption on Pt(111) under similar experimental conditions.30,31 Furthermore, the experimental value of the ‘Stark-tuning’ slope (dνNO/dE) of 72(±4) cm-1 V-1 lies in the range between 62 cm-1 V-1 and 85 cm-1 V-1, reported by Weaver et al.31 for the saturated (0.4-0.5 ML) and subsaturated (0.3 ML) NO adlayers, respectively. As deduced from the integrated area under the peak assigned to adsorbed NO, there is a sharp increase of NO coverage at potentials between ca. 0.4 and 0.5 V; then, a well-defined constancy of the value of the integrated area is observed in the potential region between ca. 0.5 and 0.9 V. This is in good agreement with the CV data, which points to the formation of a
81

Chapter 5
(nearly) saturated NO adlayer at above ca. 0.5 V. Finally, in our infrared measurements, we did not observed NO accumulation in solution.
0.0 0.2 0.4 0.6 0.8 1.0
2∗10- 9
m/z 30 (NO)
Ion
curr
ent
/ a.
u.
0.0 0.2 0.4 0.6 0.8 1.0
1∗10- 9
m/z 44 (N2O)
0.0 0.2 0.4 0.6 0.8 1.0-80
-40
0
40EO2
111
EO1111
ER4111
ER3111 ER2
111
j /
µA c
m- 2
E / V vs RHE
Figure 5.5. Results of the on-line electrochemical mass spectrometry measurements for the electrochemical reactions of hydroxylamine at Pt(111) surface. Experimental conditions: 0.5 M HClO4; 20×10-3 M NH2OH ; starting potential 0.06 V; potential scan rate 5 mV s-1. Black line – positive-going scan; gray line – subsequent negative-going scan.
Figure 5.5 shows the so-called mass spectrometric cyclic voltammograms
(MSCV) for selected m/z ratios, measured in perchloric acid. In good accordance with the infrared experiments, the formation of N2O (m/z 44) is observed during the positive-going scan in the potential region between ca. 0.45 and 0.85 V. The formation of N2O, possibly a result of the slow continuous process deduced from voltammetry, can be tentatively explained by a surface reaction, possibly between NOads and HAM or, alternatively, between NOads and products of partial dehydrogenation of HAM. Further increase of the mass signal at more positive potentials and, subsequently, during the negative-going scan coincides with the anodic peak EO2
111, thus indicating a second source of N2O formation. This second source is probably a reaction between nitrite formed and HAM.
The fragmentation-corrected signal for m/z 30 (NO) clearly indicates the production of a significant amount of NO in solution at potentials as low as ca. 0.6
82

Electrocatalytic reactions of hydroxylamine at low-index single-crystal platinum surfaces in acidic media
V with a maximum at ca. 0.85 V. The negative-going scan (reversed at ca. 1V) shows a similar (peak-like) feature, though with a positive shift of ca. 100 mV. The detection of NO in solution may be tentatively assigned to (i) partial desorption of NO adlayer and (ii) (homogeneous) decomposition of nitrite to NO. We did not observe the formation of N2. Interestingly, we did not observe N2O formation in experiments in sulfuric acid. At the same time, we did observe some NO, though in much smaller amount than in perchloric acid.
5.3.2. Pt (110)
As shown in Figure 5.6A, the CV profile recorded at Pt(110) surface in
contact with a HAM-containing sulfuric acid solution is quite different from that recorded at Pt(111) under the same experimental conditions. Most significantly, the reduction peak at ca. 0.3 V observed at Pt(111), is not present. Furthermore, in contrast to Pt(111), the Pt(110) surface is active for HAM reduction even at potentials corresponding to the saturation coverage of hydrogen (Figure 5.6A). On the other hand, similar to Pt(111), a HAM oxidation wave in the potential region between ca. 0.4 and 0.6 V can be readily deduced from the CV data. A gradual increase of the upper potential limit during continuous potential cycling brings about the appearance and development of the voltammetric features ER1
110 and ER2
110 in the subsequent negative-going sweep (Figure 5.6A). The increase of the upper potential limit from 0.4 to 0.6 V results in fully developed ER1
110 and ER2110
peaks. This finding demonstrates the formation and the reductive stripping of adsorbed NO, and shows that the HAM reduction and oxidation processes occur simultaneously at potentials around 0.4 V. The negative-going part of the voltammetric profile recorded in the presence of HAM compares well with the one observed for the reductive stripping of the saturated NO adlayer (Figure 5.6B). However, in the presence of HAM the peak ER1
110 is less pronounced, probably due to a lower NO coverage resulting from HAM oxidation. The Tafel slope analysis of peaks ER1
110 and ER2110 gave values of 39 mV decade-1 and 29 mV decade-1,
respectively. These values may be compared with 44 mV decade-1 and 42 mV decade-1, respectively, obtained for the same features in the case of reductive stripping of NO adlayer.16 The significant difference of the Tafel slope values in the case of the ER2
110 feature is probably related to the presence of HAM. The effect of the HAM concentration was examined from the positive-going
linear sweep voltammograms started in the Hupd region at ca. 0.06 V. As shown in Figures 5.7A and 5.7B, the reduction process(es) involving HAM in the potential region between ca. 0.06 and 0.4 V is (are) of positive order in HAM concentration, while the oxidation process corresponding to the feature EO1
110 is zero order in HAM concentration. Furthermore, as can be deduced from a comparison of the
83
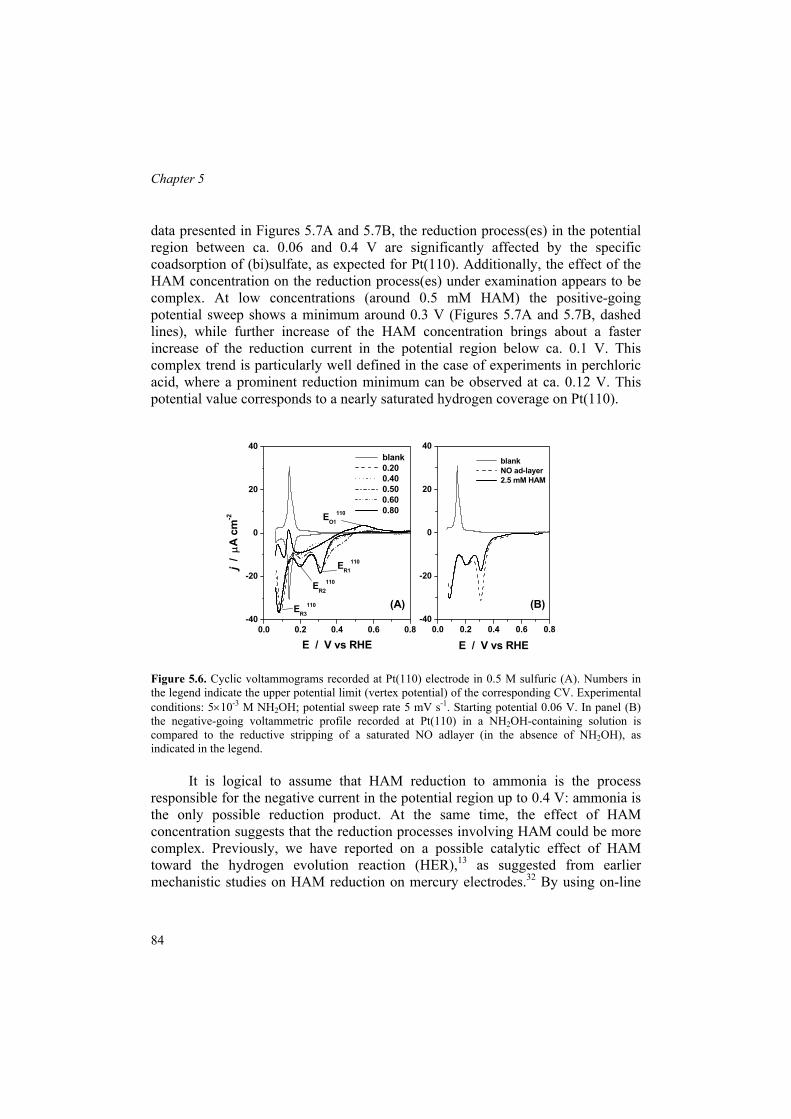
Chapter 5
data presented in Figures 5.7A and 5.7B, the reduction process(es) in the potential region between ca. 0.06 and 0.4 V are significantly affected by the specific coadsorption of (bi)sulfate, as expected for Pt(110). Additionally, the effect of the HAM concentration on the reduction process(es) under examination appears to be complex. At low concentrations (around 0.5 mM HAM) the positive-going potential sweep shows a minimum around 0.3 V (Figures 5.7A and 5.7B, dashed lines), while further increase of the HAM concentration brings about a faster increase of the reduction current in the potential region below ca. 0.1 V. This complex trend is particularly well defined in the case of experiments in perchloric acid, where a prominent reduction minimum can be observed at ca. 0.12 V. This potential value corresponds to a nearly saturated hydrogen coverage on Pt(110).
0.0 0.2 0.4 0.6 0.8-40
-20
0
20
40
EO1110
ER3110
ER2110
ER1110
(A)
blank 0.20 0.40 0.50 0.60 0.80
j /
µA c
m-2
E / V vs RHE0.0 0.2 0.4 0.6 0.8
-40
-20
0
20
40
(B)
blank NO ad-layer 2.5 mM HAM
E / V vs RHE
Figure 5.6. Cyclic voltammograms recorded at Pt(110) electrode in 0.5 M sulfuric (A). Numbers in the legend indicate the upper potential limit (vertex potential) of the corresponding CV. Experimental conditions: 5×10⁻³ M NH2OH; potential sweep rate 5 mV s-1. Starting potential 0.06 V. In panel (B) the negative-going voltammetric profile recorded at Pt(110) in a NH2OH-containing solution is compared to the reductive stripping of a saturated NO adlayer (in the absence of NH2OH), as indicated in the legend.
It is logical to assume that HAM reduction to ammonia is the process
responsible for the negative current in the potential region up to 0.4 V: ammonia is the only possible reduction product. At the same time, the effect of HAM concentration suggests that the reduction processes involving HAM could be more complex. Previously, we have reported on a possible catalytic effect of HAM toward the hydrogen evolution reaction (HER),13 as suggested from earlier mechanistic studies on HAM reduction on mercury electrodes.32 By using on-line
84
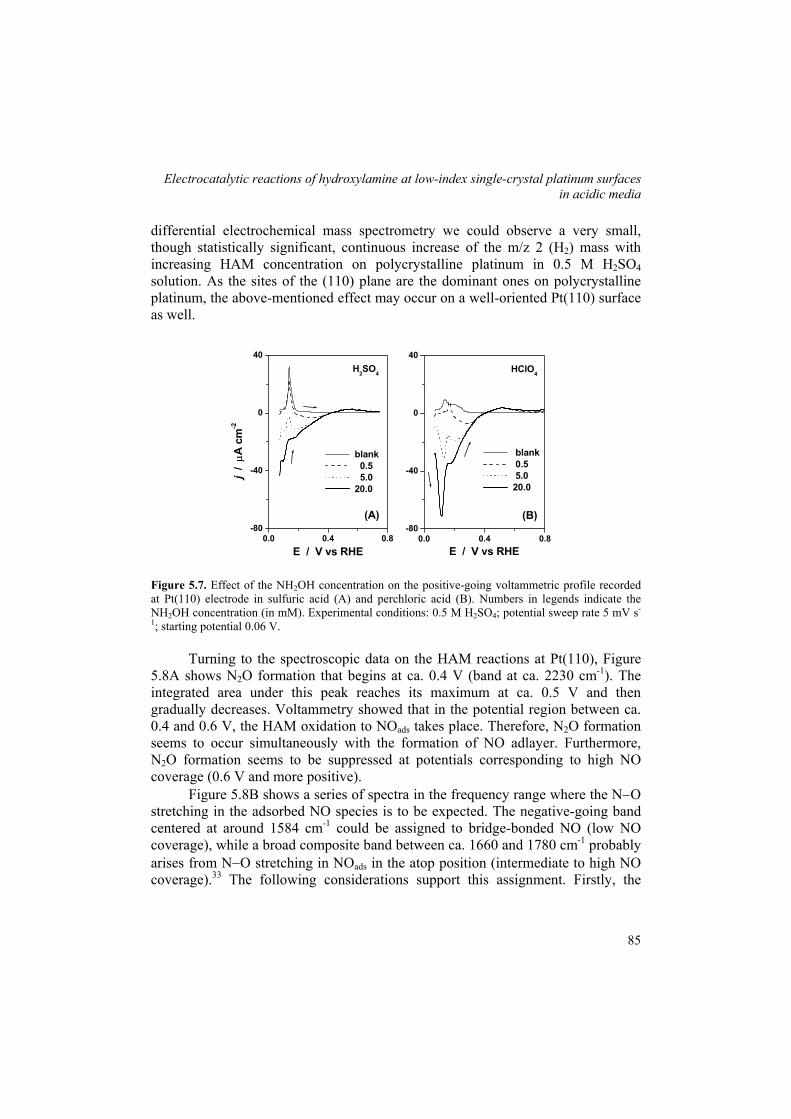
Electrocatalytic reactions of hydroxylamine at low-index single-crystal platinum surfaces in acidic media
differential electrochemical mass spectrometry we could observe a very small, though statistically significant, continuous increase of the m/z 2 (H2) mass with increasing HAM concentration on polycrystalline platinum in 0.5 M H2SO4 solution. As the sites of the (110) plane are the dominant ones on polycrystalline platinum, the above-mentioned effect may occur on a well-oriented Pt(110) surface as well.
0.0 0.4 0.8-80
-40
0
40H2SO4
E / V vs RHE
blank 0.5 5.0 20.0
(B)(A)
j /
µA c
m-2
E / V vs RHE0.0 0.4 0.8
-80
-40
0
40HClO4
blank 0.5 5.0 20.0
Figure 5.7. Effect of the NH2OH concentration on the positive-going voltammetric profile recorded at Pt(110) electrode in sulfuric acid (A) and perchloric acid (B). Numbers in legends indicate the NH2OH concentration (in mM). Experimental conditions: 0.5 M H2SO4; potential sweep rate 5 mV s-
1; starting potential 0.06 V. Turning to the spectroscopic data on the HAM reactions at Pt(110), Figure
5.8A shows N2O formation that begins at ca. 0.4 V (band at ca. 2230 cm-1). The integrated area under this peak reaches its maximum at ca. 0.5 V and then gradually decreases. Voltammetry showed that in the potential region between ca. 0.4 and 0.6 V, the HAM oxidation to NOads takes place. Therefore, N2O formation seems to occur simultaneously with the formation of NO adlayer. Furthermore, N2O formation seems to be suppressed at potentials corresponding to high NO coverage (0.6 V and more positive).
Figure 5.8B shows a series of spectra in the frequency range where the N−O stretching in the adsorbed NO species is to be expected. The negative-going band centered at around 1584 cm-1 could be assigned to bridge-bonded NO (low NO coverage), while a broad composite band between ca. 1660 and 1780 cm-1 probably arises from N−O stretching in NOads in the atop position (intermediate to high NO coverage).33 The following considerations support this assignment. Firstly, the
85

Chapter 5
experiments with s-polarized light showed the absence of any spectroscopic features in the 1600-1800 cm-1 region. Secondly, from the experiments with NO adlayers on Pt(110) we could see a picture similar to that observed for HAM oxidation, i.e. a broad (composite) negative going band in the frequency region between ca. 1650 and 1800 cm-1 and a lower frequency band centered at ca. 1580 cm-1.17 Additionally, this assignment is in agreement with previous results. Gomez et al.30 observed (i) a broad bipolar band at around 1740 cm-1 at near-saturation NO coverage and (ii) a weak bipolar band at ca. 1590 cm-1 at lower NO coverage in 0.1 M perchloric acid. All together, the spectroscopic data presented above provide sufficient evidence for the formation of an NO adlayer at potentials around 0.5 V and its increasing coverage at higher potentials as a result of HAM oxidation.
2150 2200 2250 2300
0.80 V
(A)E / V
0.55 V
0.50 V
0.35 V
0.75 V
~2230 cm-1
0.0025 a.u.
Wavenumber / cm-11600 1700 1800
Wavenumbers / cm-1
(B)
1584 cm-1
0.80 V
0.65 V
0.50 V
0.30 V
0.15 V
E / V
1660-1780 cm-1
0.0025 a.u.
Figure 5.8. The potential-difference infrared spectra collected at Pt(110) electrodes at selected values of the applied potential (as indicated). Reference potential 0.1 V. Experimental conditions: 0.1 M H2SO4 + 1.5×10⁻² M NH2OH; in H2O (A) and in D2O (B); p – polarized light.
5.3.3. Pt (100)
We shall start the presentation of the results for Pt(100) with examining the
effect of HAM concentration. As shown in Figure 5.9A, the positive-going voltammogram recorded for Pt(100) surface in sulfuric acid is quite similar to that for Pt(111). Firstly, Pt(100) does not show a significant activity towards HAM reduction in the potential region corresponding to a high coverage of hydrogen
86

Electrocatalytic reactions of hydroxylamine at low-index single-crystal platinum surfaces in acidic media
(0.06 – 0.25 V). Secondly, a prominent, concentration-dependent, reduction peak (ER1
100) is observed at potentials corresponding to subsaturated coverages of hydrogen. Thirdly, the oxidation feature EO1
100, corresponding to HAM oxidation to adsorbed NO, occurs at ca. 0.5 V and is zero order in HAM concentration. The formation of NOads can be deduced from the effect of HAM concentration on the negative-going sweep of the corresponding CVs (see Figure 5.9B). The height and position of peak ER1
100, which we attribute to the reductive stripping of the NO adlayer, increase with the concentration, pointing to an increasing NO coverage achieved. The NO coverage approaches its saturation value at the highest concentration of the range examined (20×10-3 M HAM), as deduced from the position of the ER3
100 peak. An increase of NO coverage can be achieved by longer polarization at potentials above 0.6 V at low concentrations as well. The reduction feature ER1
100 (see the inset of Figure 5.10) corresponds to HAM reduction to ammonia. Accordingly, we did not observe the formation of any gaseous products in this region by both infrared and mass spectrometry measurements (see below). Finally, quite similar voltammetric profiles and trends were observed for similar experiments in perchloric acid.
0.0 0.4 0.8
-25
0
EO1100
ER1100
blank 0.50 2.50 5.00 10.00 20.00
(B)(A)
j /
µA c
m-2
E / V vs RHE0.0 0.4 0.8
-150
-100
-20
0
20
ER3100
blank 0.50 2.50 5.00 10.00 20.00
Figure 5.9. The positive-going (A) and the negative-going (B) part of the cyclic voltammograms recorded at Pt(100) electrode in 0.5 M sulfuric acid in the presence of hydroxylamine. Numbers in the legends indicate the hydroxylamine concentration. Experimental conditions: potential sweep rate 5 mV s-1; starting potential 0.06 V.
Figure 5.10 shows the voltammetric reduction and oxidation of HAM in
sulfuric acid. More specifically, the figure shows the effect of the upper-potential limit (vertex potential) on the negative-going voltammetric profile. In this
87

Chapter 5
experiment, the potential cycle was started at ca. 0.06 V and was run in the positive-going direction first. Continuous potential cycling, combined with a gradual increase of the upper potential limit of the cyclic voltammogram, allowed us to follow the appearance and evolution of the features in the negative-going scan. If a sufficiently low potential sweep rate is applied (5 mV s-1 or lower), the positive-going sweep shows the same voltammetric profile (as that shown by the bold black line), while the negative-going voltammetric profile changes as a function of the vertex potential.
Figure 5.10. Cyclic voltammograms recorded at Pt(100) electrode in 0.5 M perchloric acid solution. Numbers in the legend indicates the upper potential limit (vertex potential) of the corresponding CV. Exp. conditions: 2.5×10⁻³ M NH2OH; potential sweep rate 5 mV s-1, starting potential 0.06 V.
As an important observation from the above experiment, reversing the
potential at ca. 0.3 V (or more positive) results in the appearance of a reduction feature at ca. 0.22 V, which cannot be associated with HAM reduction, but rather with reduction of a product of the HAM partial dehydrogenation.34 This can be concluded from the much lower currents observed in the 0.1-0.25 V region in the positive-going scan, thus indicating a low “direct” HAM reduction reactivity in this potential region. The position and the height of the reduction feature observed in the negative-going scan at ca. 0.22 V does not depend on the HAM concentration34 or on the vertex potential (for potentials higher than ca. 0.3 V). Significantly, the
0.2 0.4 0.6-90
-60
-30
0
0.2 0.3 0.4
EO1100
ER3100
ER4100
NOads 0.245 0.260 0.280 0.300 0.380 0.500 0.560 0.580 0.600 0.700
j /
µA c
m-2
E / V vs RHE
ER1100
88
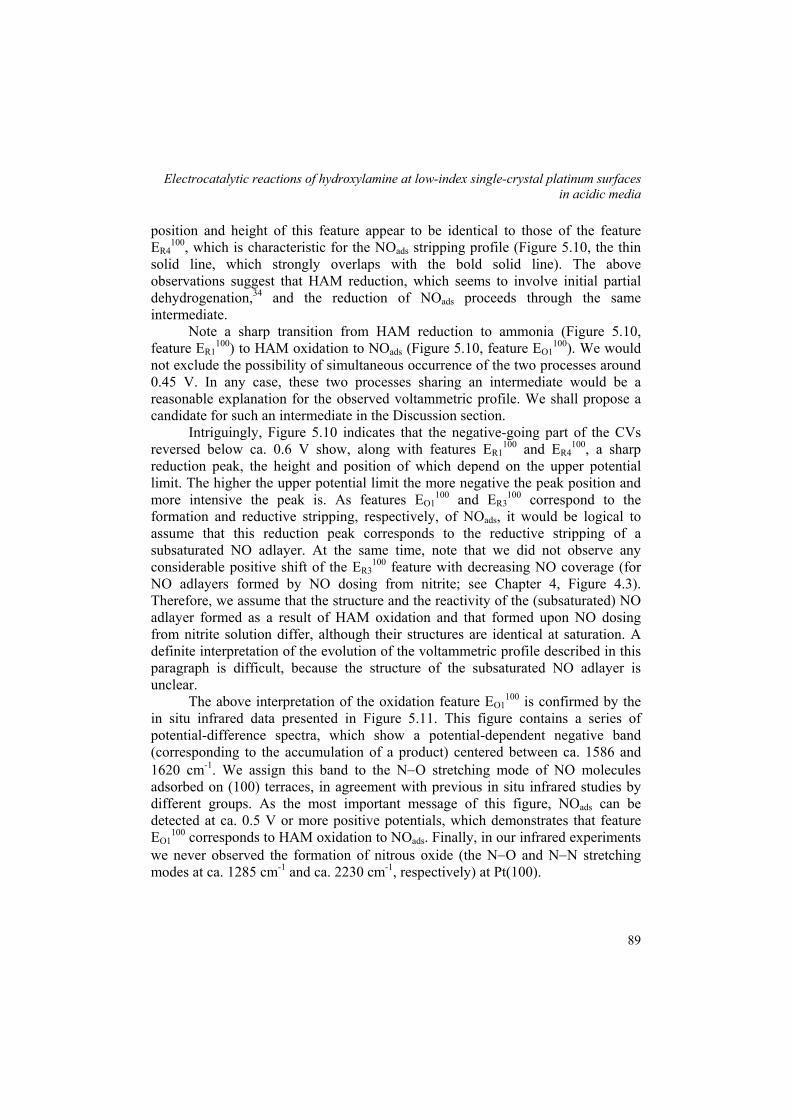
Electrocatalytic reactions of hydroxylamine at low-index single-crystal platinum surfaces in acidic media
position and height of this feature appear to be identical to those of the feature ER4
100, which is characteristic for the NOads stripping profile (Figure 5.10, the thin solid line, which strongly overlaps with the bold solid line). The above observations suggest that HAM reduction, which seems to involve initial partial dehydrogenation,34 and the reduction of NOads proceeds through the same intermediate.
Note a sharp transition from HAM reduction to ammonia (Figure 5.10, feature ER1
100) to HAM oxidation to NOads (Figure 5.10, feature EO1100). We would
not exclude the possibility of simultaneous occurrence of the two processes around 0.45 V. In any case, these two processes sharing an intermediate would be a reasonable explanation for the observed voltammetric profile. We shall propose a candidate for such an intermediate in the Discussion section.
Intriguingly, Figure 5.10 indicates that the negative-going part of the CVs reversed below ca. 0.6 V show, along with features ER1
100 and ER4100, a sharp
reduction peak, the height and position of which depend on the upper potential limit. The higher the upper potential limit the more negative the peak position and more intensive the peak is. As features EO1
100 and ER3100 correspond to the
formation and reductive stripping, respectively, of NOads, it would be logical to assume that this reduction peak corresponds to the reductive stripping of a subsaturated NO adlayer. At the same time, note that we did not observe any considerable positive shift of the ER3
100 feature with decreasing NO coverage (for NO adlayers formed by NO dosing from nitrite; see Chapter 4, Figure 4.3). Therefore, we assume that the structure and the reactivity of the (subsaturated) NO adlayer formed as a result of HAM oxidation and that formed upon NO dosing from nitrite solution differ, although their structures are identical at saturation. A definite interpretation of the evolution of the voltammetric profile described in this paragraph is difficult, because the structure of the subsaturated NO adlayer is unclear.
The above interpretation of the oxidation feature EO1100 is confirmed by the
in situ infrared data presented in Figure 5.11. This figure contains a series of potential-difference spectra, which show a potential-dependent negative band (corresponding to the accumulation of a product) centered between ca. 1586 and 1620 cm-1. We assign this band to the N−O stretching mode of NO molecules adsorbed on (100) terraces, in agreement with previous in situ infrared studies by different groups. As the most important message of this figure, NOads can be detected at ca. 0.5 V or more positive potentials, which demonstrates that feature EO1
100 corresponds to HAM oxidation to NOads. Finally, in our infrared experiments we never observed the formation of nitrous oxide (the N−O and N−N stretching modes at ca. 1285 cm-1 and ca. 2230 cm-1, respectively) at Pt(100).
89

Chapter 5
Figure 5.11. The potential-difference infrared spectra for the electrochemical oxidation of hydroxylamine at Pt(100) surface. Exp. conditions: 0.1 M HClO4 + 1×10⁻³ M NH2OH (in D2O), p-polarized light, reference potential 0.1 V.
Figure 5.12 shows the results of the OLEMS measurements of HAM electrochemical transformations at the Pt(100) surface. No gaseous products are observed in the potential region between ca. 0.05 V and 0.9 V during the positive-going sweep (we also monitored m/z 26 (N2) and m/z 46 (NO2)). This result strongly suggests that the reduction feature ER1
100 corresponds to HAM reduction to ammonia and that this process, though involving a partial dehydrogenation of HAM, is not accompanied by side reactions (e.g., N−N condensation).
Furthermore, no gaseous products appear to accompany HAM oxidation to NOads (the oxidation feature EO1
100 at ca. 0.5 V). In contrast, the HAM oxidation to NOads on Pt(111) and Pt(110) surfaces is accompanied by the formation of some N2O at around 0.5 V. The (saturated) NO adlayer blocks sites for further HAM oxidation, acting as a catalyst poison. Therefore, low anodic current densities are observed in the positive-going scan (Figure 5.12, the solid black lines). The formation of N2O and the formation of a little NO are observed in the positive-going scan starting at ca. 0.9 V (Figure 5.12, the solid black lines) and in the subsequent negative-going scan between 1 and 0.7 V (Figure 5.12, the solid gray lines). The formation of nitrous oxide at highly oxidative potentials (around 0.9 V) is most probably related to a reaction between the nitrite, resulting from NOads oxidation, and HAM. Accumulation of some NO in solution may be tentatively assigned to (i) partial desorption of NO adlayer and/or (ii) (homogeneous) decomposition of nitrite to NO.
1600 1800 2000
1585-1620 cm-1
0.48
0.20
0.30
0.40
E / V
0.56
0.64
0.52
0.001 a.u.
Wavenumber / cm-1
As shown above, the oxidation of HAM in the potential window between ca. 0.45 and 0.6 V results in the formation of NOads. The negative-going scan in Figure 5.12 (the solid gray line) shows a profile virtually identical with the one recorded for the reductive stripping of a saturated NO adlayer in the absence of HAM in solution. Furthermore, no gaseous products are observed during the reductive stripping of this NO adlayer (the potentials region between ca. 0.4 and 0.05 V; Figure 5.12, the solid gray line), even in the presence of HAM. This result points again to ammonia as the product of NOads reduction on the Pt(100) surface.
90
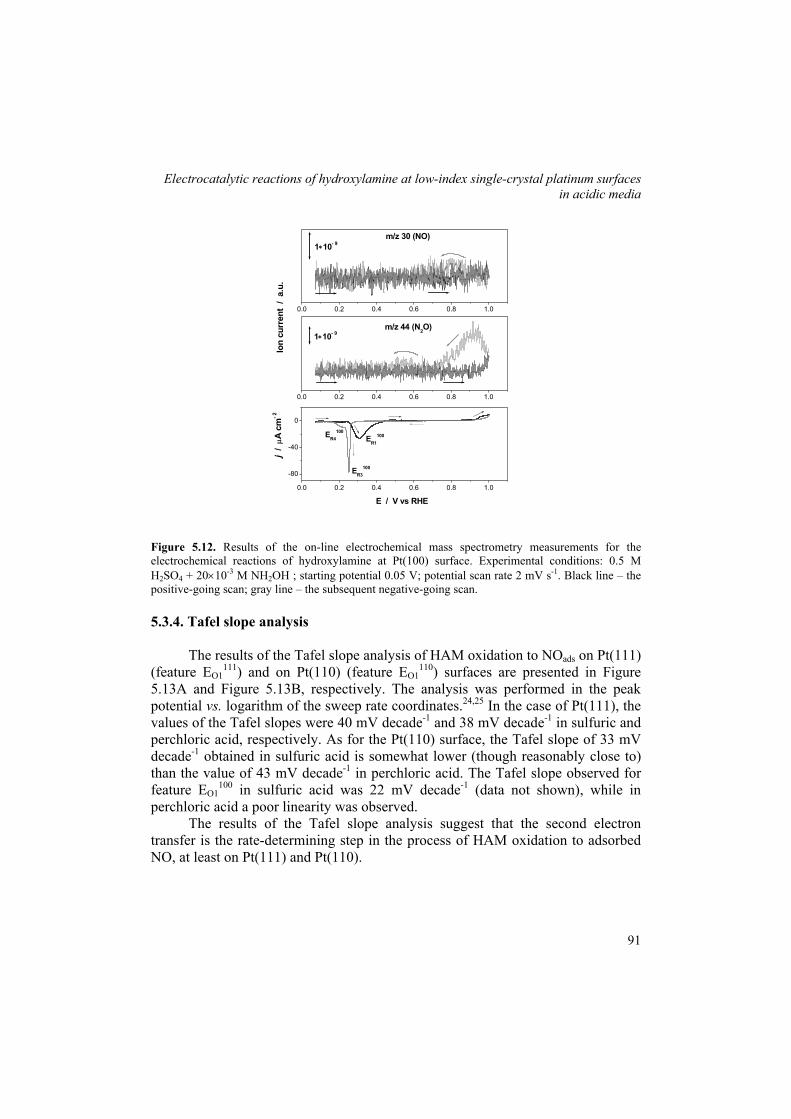
Electrocatalytic reactions of hydroxylamine at low-index single-crystal platinum surfaces in acidic media
0.0 0.2 0.4 0.6 0.8 1.0
1∗10- 9m/z 30 (NO)
Ion
curr
ent
/ a.
u.
0.0 0.2 0.4 0.6 0.8 1.0
1∗10- 9m/z 44 (N2O)
0.0 0.2 0.4 0.6 0.8 1.0
-80
-40
0
ER4100
ER3100
ER1100
j /
µA c
m- 2
E / V vs RHE
Figure 5.12. Results of the on-line electrochemical mass spectrometry measurements for the electrochemical reactions of hydroxylamine at Pt(100) surface. Experimental conditions: 0.5 M H2SO4 + 20×10-3 M NH2OH ; starting potential 0.05 V; potential scan rate 2 mV s-1. Black line – the positive-going scan; gray line – the subsequent negative-going scan.
5.3.4. Tafel slope analysis
The results of the Tafel slope analysis of HAM oxidation to NOads on Pt(111)
(feature EO1111) and on Pt(110) (feature EO1
110) surfaces are presented in Figure 5.13A and Figure 5.13B, respectively. The analysis was performed in the peak potential vs. logarithm of the sweep rate coordinates.24,25 In the case of Pt(111), the values of the Tafel slopes were 40 mV decade-1 and 38 mV decade-1 in sulfuric and perchloric acid, respectively. As for the Pt(110) surface, the Tafel slope of 33 mV decade-1 obtained in sulfuric acid is somewhat lower (though reasonably close to) than the value of 43 mV decade-1 in perchloric acid. The Tafel slope observed for feature EO1
100 in sulfuric acid was 22 mV decade-1 (data not shown), while in perchloric acid a poor linearity was observed.
The results of the Tafel slope analysis suggest that the second electron transfer is the rate-determining step in the process of HAM oxidation to adsorbed NO, at least on Pt(111) and Pt(110).
91
Chapter 5
-3 -2 -1
0.51
0.54
0.57Pt (110)
33 mV dec-1 H2SO4 HClO4
43 mV dec-1E pO111
0 / V
vs
RH
E
log (v / V s-1)-3 -2 -1
0.44
0.48
0.52
Pt (111)
H2SO4 HClO4
40 mV dec-1
38 mV dec-1
E pO111
1 / V
vs
RH
E
log (v / V s-1)
Figure 5.13. The Tafel slope analysis of the oxidation peaks EO1111 (A) and EO1
110 (B) in 0.5 M sulfuric acid and 0.5 M perchloric acid, as indicated in the legend. Experimental conditions: 5×10⁻³ M NH2OH; starting potential 0.06 V.
5.4. Discussion
We shall begin the Discussion section with an analysis of HAM
electrooxidation. Both voltammetric and spectroscopic data point to the surface-bonded NO as the key intermediate in electrooxidation of HAM, and not the adsorbed NOH (or HNO) intermediate, as suggested in earlier studies.12,14 Previously, this intermediate was assumed to be the main precursor in the formation of HNO2, through a reaction with the OHads species. In our experiments, the NO formation peak is observed at around 0.5 V on all surfaces examined, which would rather exclude the above scenario. Furthermore, HAM oxidation is essentially blocked by NO adlayer, which is stable over a relatively wide potential region (up to 0.7-0.9 V), depending on the surface orientation and the nature of the supporting electrolyte (perchlorate vs. sulfate). The oxidation of the platinum surface triggers oxidation of NOads at more positive potentials and, consequently, continuous HAM oxidation. Recent studies of NO adlayers on single-crystal platinum electrodes provide sufficient (both voltammetric and spectroscopic) evidence for HNO2(ads) as the main product of the (reversible) oxidation of adsorbed nitric oxide in the potential region between 0.9-1.1 V.27,30,35 Therefore, it would be reasonable to accept this scenario for the oxidation of NO adlayers on the surface in contact with a HAM-containing solution. However, no reversibility of the surface confined NO/HNO2 is observed,34 most probably due to an irreversible reaction between HAM and the surface HNO2.
The Tafel slope analysis of the voltammetric peak corresponding to HAM oxidation to NOads at the Pt(111) and Pt(110) surfaces, points to the second electron transfer as the rate-limiting step. This finding confirms the tentative mechanism proposed on the basis of previous results on polycrystalline platinum:13
92
Electrocatalytic reactions of hydroxylamine at low-index single-crystal platinum surfaces in acidic media
H3NOH+ H3NOH+ads (5.2)
H3NOH+ads H2NOads + 2H+ + e− (5.3)
H2NOads → HNOads + H+ + e− rds (5.4) HNOads → NOads + H+ + e− (5.5) Theoretical calculations shows that in vacuum the energy of the HNO and
H2NO intermediates is lower than that of the NOH and HNOH species, respectively, albeit the stability of the surface-bonded species is not known.16,36 Therefore the first two intermediates are indicated in reaction scheme 5.2-5.5. In acidic media, the protonated HAM molecule is commonly perceived as the reactive species.12,14,28 However, the exact nature of the reactive species in reaction (5.3) (H3NOH+
ads vs. H2NOHads) should be considered as unknown, as the acid-base properties of HAM could be significantly affected upon interaction with the surface. Accordingly, reaction (5.3) may be split in two steps:
H3NOH+
ads H2NOHads + H+ (5.3’) H2NOHads H2NOads + H+ + e− (5.3’’) The mechanism of the HAM oxidation to NOads may be compared with a
mechanism recently proposed for the reduction of NOads.16 Briefly, the reductive stripping of the NO adlayer is perceived as a stepwise hydrogenation process, in which the formation of HNO and H2NO intermediates is assumed:
NOads + H+ + e− HNOads equilibrium (5.6) HNOads + H+ + e− → H2NOads rds (5.7) H2NOads + 4H+ + 3e− → NH4
+ + H2O fast (5.8) Ammonia is shown as the main product of the reduction of the adsorbed NO
on platinum.16,17,37,38 Importantly, the protons in reactions (5.6) and (5.7) seem to be transferred directly from a solution hydronium species.16 Comparing schemes (5.2-5.5) and (5.6-5.8), reactions (5.4) and (5.7) are the forward and back reactions of the same transformation. At the same time, reactions (5.4) and (5.7) are the rate determining steps in the reaction schemes (5.2-5.5) and (5.6-5.8), respectively. Consequently, the energetic barrier for the HNOads↔H2NOads transformation seems to be the highest in the whole NOads↔NH2OH chain of transformations, whatever the direction. The implication of these intermediates in the rate-determining step may indicate their relative stability and possibly participation in side reactions, e.g. the formation of N2O and N2.
93

Chapter 5
Another important issue to be considered is the formation of N2O at moderately oxidative potentials. Spectroscopic data for Pt(111) and Pt(110) indicate the formation of nitrous oxide, starting at ca. 0.35 and 0.4 V, respectively. As the maximum of the N2O formation occurs in the potential region corresponding to a subsaturated NO adlayer (ca. 0.45 V at Pt(111) and ca. 0.5 V at Pt(110), a possible explanation would be an (electro)catalytic reaction between adsorbed NO and HAM (or NO and products of HAM partial dehydrogenation), resulting in a N−N condensation process. This interpretation of the formation of N2O (under potential control) is consistent with data on catalytic reactions between HAM and NO in acidic media at carbon-supported platinum catalysts, in which N2O was shown as the product,2 as well as with previous electrochemical studies of the HAM oxidation at polycrystalline platinum.12-14 Curiously enough, we never observed N2O formation in experiments on HAM oxidation at Pt(100).
We shall continue with a discussion of the HAM reductive activity. On Pt(111) the Hupd region is well separated from the (bi)sulfate adsorption region, corresponding to the unique situation of an electrode surface almost free of hydrogen and anion adsorption. At potentials around 0.3 V, the electrode surface is not covered by either hydrogen or (bi)sulfate. Therefore, the prominent reduction peak at about 0.3 V is a strong indicator of (i) a high reactivity of HAM at free platinum sites and (ii) a strong dependence of the reductive activity of HAM on the interactions of the surface with hydrogen and specifically adsorbed anions. Interestingly, the HAM reduction begins at ca. 0.20 V, corresponding to the Hupd coverage well below saturation (ca. 0.2 ML). This observation suggests that multiple adsorption sites (an “ensemble”) are needed for HAM to be activated for reduction. The situation is quite similar for Pt(100) surface: HAM is reduced in the potential region between ca. 0.3-0.4 V, corresponding to subsaturated hydrogen and a low (bi)sulfate coverage. On Pt(110) the picture is somewhat different; HAM is reduced over the whole Hupd region, although affected by the nature of the anion. Furthermore, HAM is reduced even at potentials corresponding to high hydrogen coverage, suggesting that the Pt(110) surface nearly-saturated with adsorbed hydrogen still exposes sites active for the activation of HAM reduction.
Before we proceed with discussing the mechanistic implications for HAM reduction, it would be interesting to briefly recall previous mechanistic work on HAM reduction. In an early study of HAM reduction on bright platinum, Möller and Heckner interpreted their data in terms of the HAM involvement in the hydrogen evolution reaction.8 In a later more detailed mechanistic study, the same authors assumed the breaking of the N−O bond in the first step, which was indicated as the rate-determining step (Eq. 5.10).
H3NOH+
ads + e− → (NH3)ads + OHads (5.10)
94
Electrocatalytic reactions of hydroxylamine at low-index single-crystal platinum surfaces in acidic media
In two subsequent steps a fast electron transfer to and the protonation of the adsorbed OH species is postulated. A low rate of HAM reduction was explained by the blocking effect of the adsorbed NH3 species.28 The reduction of HAM is positive order in HAM concentration, as deduced from polycrystalline13 as well as single crystal studies (this work), which is inconsistent with blockage by (NH3)ads species.
An important clue in looking for an alternative scenario for HAM reduction on platinum may be the fact that at all surfaces examined the features corresponding to HAM reduction and oxidation partially overlap (around 0.4 V), suggesting their simultaneous occurrence. Note that this observation is in agreement with the platinum-catalyzed disproportionation of HAM, resulting in the formation of ammonia and nitrous oxide.2 One possible explanation involves the assumption that the oxidation and reduction of HAM have a common intermediate. These considerations would lead us to the following tentative mechanism of HAM reduction:
H3NOH+ H3NOH+
ads equilibrium (5.11) H3NOH+
ads H2NOads + 2H+ + e− (5.12) H2NOads + 4H+ + 3e− → NH4
+ + H2O (5.13)
We assume that a possible way to activate reduction of HAM is partial dehydrogenation of the HAM (reaction 5.12) and formation of an adsorbed intermediate. Note that reactions (5.11) and (5.13) are identical to reactions (5.2) and (5.3), i.e. the first two steps of the scheme proposed for HAM oxidation to NOads. Therefore, we can assume that an intermediate (e.g., H2NOads) may serve as a precursor to both NH4
+ and NOads formation. In other words, the HAM reduction process contains an oxidative activation step – reaction (5.12). This reaction should require multiple adsorption sites, as can be inferred from the effect of the hydrogen and (bi)sulfate adsorption on HAM reduction on Pt(111) and Pt(100). In contrast to the mechanism proposed by Möller and Heckner, N−O bond is assumed to be broken at a later stage of the reaction.
Support to the reaction scheme (5.11-5.13) is provided by the voltammetric data for Pt(100). The voltammograms in Figure 5.12 show a feature at ca. 0.22 V corresponding to reduction of an (presumably) adsorbed species. The position and shape of this feature is zero order in HAM concentration (Figure 5.9B) and do not depend on the upper potential limit of the CVs (Figure 5.10), once the upper potential limit of ca 0.3 V is reached. Furthermore, the presence of the reduction feature at 0.22 V for all upper potential limits higher than 0.3 V suggests that this feature is related to the reduction of an intermediate of the NO reduction (or even
95

Chapter 5
NO itself). Accordingly, the adsorbate under consideration must be a compound in which nitrogen has formal oxidation state between (+2) and (−2) but it cannot be HAM, as the positive-going scan indicates that HAM cannot be reduced at these low potentials. The possible candidates are adsorbed H2NO (or HNOH) and HNO (or NOH) intermediates. The latter species could be preferred on Pt(100), in light of recent mechanistic studies of NOads reduction on Pt(100) (for more details, see Chapter 4, section 4.4.2). Regardless of our inability to exactly identify the nature of the species, the above considerations strongly suggest an oxidative activation scenario for the reduction of HAM.
Finally, let us comment on the structure sensitivity of the HAM reduction and oxidation in connection to its reactivity on polycrystalline platinum, as well as in connection to the structure sensitivity of the related nitrate reduction and methanol oxidation. Comparison of the reduction activity on the low-index planes to polycrystalline platinum leads to the conclusion that the reactivity of polycrystalline platinum is dominated by sites of (110) orientation. The Pt(111) and Pt(100) surfaces are more active towards HAM reduction, but only in a limited potential region, which in the case of Pt(111) is clearly related to a very low coverage of hydrogen and anions on the surface. Interestingly, both Pt(111) and Pt(100) become completely blocked for HAM reduction by hydrogen coverages that are significantly below saturation; for Pt(111) the critical coverage below which the HAM reduction starts is ca. 0.2-0.3 ML. The same observation was recently made for nitrate reduction on Pt(111),39 suggesting that both HAM and nitrate reduction need multiple adsorption sites (an “ensemble”) to adsorb and react. More generally, these results indicate that for weakly adsorbed reactants, such as HAM and nitrate, the reactive sites are those sites where the competition with coadsorbates is the least dominant. Such sites typically tend to be (111) and (100) terrace sites. The voltammetric data on HAM oxidation to NOads on the three surfaces examined point to an apparent structure insensitivity of this reaction. This is in sharp contrast with the observed structure sensitivity of a very similar reaction, namely methanol (MeOH) oxidation on platinum. Methanol oxidation is an order of magnitude faster on Pt(110) compared to Pt(111),40 and recent chronoamperometric results indicate that methanol decomposition to adsorbed carbon monoxide takes place preferentially on the step sites of stepped platinum electrodes.41 We assume that these differences between HAM and MeOH dehydrogenation kinetics may be traced back to their different adsorption strength.
5.5. Summary and Conclusions
This chapter has described the results of an investigation of the
electrochemistry of hydroxylamine at low-index single-crystal platinum electrodes
96

Electrocatalytic reactions of hydroxylamine at low-index single-crystal platinum surfaces in acidic media
in acidic media by voltammetry, in situ infrared spectroscopy, and on-line mass spectrometry. The study was focused particularly on the mechanistic aspects of HAM electrochemical transformations, structure sensitivity of HAM reactions, and the effect of the (co)adsorption phenomena on the HAM reactivity on platinum.
Hydroxylamine electrochemistry at platinum is largely controlled by the interaction of the other components of the solution or products of the HAM partial oxidation with the electrode surface, such as adsorbed hydrogen, sulfate and nitric oxide. Reduction of HAM seems to require multiple adsorption sites and is a structure sensitive reaction, at least through the structure sensitivity of the hydrogen adsorption on platinum. No formation of gaseous products was detected in the potential region corresponding to the Hupd region on Pt(111), Pt(110), and Pt(100) surfaces.
Voltammetric and spectroscopic data point to adsorbed NO as the main stable intermediate of the HAM oxidation. Being electrochemically stable in a wide potential region between ca. 0.5 and 0.8 V (dependent on the surface orientation and the nature of the supporting electrolyte), adsorbed NO acts as a poison for a further oxidation of HAM. The HAM oxidation to nitric oxide appears to be a structure-insensitive process and is somewhat affected by the anion coadsorption. The Tafel slope analysis suggests the second electron transfer to be the rate-determining step in HAM oxidation to adsorbed NO.
The mechanism of the HAM oxidation to NOads proposed here is consistent with the mechanism of the NOads reduction proposed elsewhere.16,38 Remarkably, the energetic barrier for the HNOads↔H2NOads transformation seems to be the highest in the NOads↔NH2OH chain of transformations, whatever the direction.
Voltammetric data for all three low-index surfaces indicate the possibility of the HAM reduction and oxidation (at moderate potentials) to occur simultaneously. This observation may be tentatively explained by the existence of an intermediate (H2NOads or HNOads), which appears both in reduction and oxidation of HAM. This observation suggests that the HAM reduction is activated by an oxidative (dehydrogenation) step. The existence of a common intermediate in the reduction and oxidation of HAM would provide a natural explanation for the platinum-catalyzed disproportionation of HAM.
References
(1) Ritz, J.; Fuchs, H.; Perryman, H. G. Hydroxylamine. In Ulmann's Encyclopedia of Industrial
Chemistry; 6th ed.; Wiley: Chichester, 2000. (2) Moesdijk van de, C. G. M. The catalytic reduction of nitrite and nitric oxide to hydroxylamine:
kinetics and mechanism. PhD thesis, Eindhoven University of Technology, 1979. (3) Tauszik, G. R.; Grocetta, P. Appl. Catal. 1985, 17, 1.
97

Chapter 5
(4) Gootzen, J. F. E. In situ spectroscopic and electrochemical studies related to liquid-phase heterogeneous catalysis. PhD thesis, Eindhoven University of Technology, 1997.
(5) Savodnik, N. N.; Shepelin, V. A.; Zalkind, T. I. Elektrokhimiya 1971, 7, 583. (6) Savodnik, N. N.; Shepelin, V. A.; Zalkind, T. I. Elektrokhimiya 1971, 7, 424. (7) Plieth, W. J. Nitrogen. In Encyclopedia of Electrochemistry of the Elements; Bard, A. J., Ed.;
Marcel Dekker: New-York, 1978; Vol. 8; pp 422. (8) Möller, D.; Heckner, K. H. Z. Chem. 1971, 11, 157. (9) Möller, D.; Heckner, K. H. Z. Chem. 1971, 11, 32. (10) Möller, D.; Heckner, K. H. Z. Chem. 1971, 11, 356. (11) Möller, D.; Heckner, K. H. Z. Phys. Chemie 1972, 251, 81. (12) Karabinas, P.; Wolter, O.; Heitbaum, J. Ber. Bunsen-Ges. Phys. Chem. 1984, 88, 1191. (13) Rosca, V.; Beltramo, G. L.; Koper, M. T. M. J. Electroanal. Chem. 2004, 566, 53. (14) Piela, B.; Wrona, P. K. J. Electrochem. Soc. 2004, 151, E69. (15) de Vooys, A. C. A.; Koper, M. T. M.; van Santen, R. A.; van Veen, J. A. R. J. Electroanal.
Chem. 2001, 506, 127. (16) Beltramo, G. L.; Koper, M. T. M. Langmuir 2003, 19, 8907. (17) Rosca, V.; Beltramo, G. L.; Koper, M. T. M. Langmuir 2005, 21, 1448. (18) Rosca, V.; Koper, M. T. M. Surf. Sci. 2005, 584, 258. (19) Clavilier, J.; Armand, D.; Sun, S. G.; Petit, M. J. Electroanal. Chem. Interfacial Electrochem.
1986, 205, 267. (20) Iwasita, T.; Nart, F. C.; Vielstich, W. Ber. Bunsen-Ges. Phys. Chem. 1990, 94, 1030. (21) Wonders, A.; Housmans, T. H. M.; Rosca, V.; Koper, M. T. M. J. Appl. Electrochem., submitted. (22) Lebedeva, N. P.; Koper, M. T. M.; Herrero, E.; Feliu, J. M.; Santen van, R. A. J. Electroanal.
Chem. 2000, 487, 37. (23) Lebedeva, N. P.; Rodes, A.; Feliu, J. M.; Koper, M. T. M.; Santen van, R. A. J. Phys. Chem. B
2002, 106, 9863. (24) Christiansen, P. A.; Hamnett, A. Techniques and Mechanisms in Electrochemistry; Blackie
Academic and Proffessional: Glasgow, 1994. (25) Koper, M. T. M.; Jansen, A. P. J.; Santen van, R. A.; Lukkien, J. J.; Hilbers, P. A. J. J. Chem.
Phys. 1998, 109, 6051. (26) Ye, S.; Kita, H. J. Electroanal. Chem. 1993, 346, 489. (27) Zang, Z.-H.; Wu, Z.-L.; Yau, S.-L. J. Phys. Chem. B 1999, 103, 9624. (28) Moeller, D.; Heckner, K. H. Z. Phys. Chemie 1974, 255, 33. (29) Nakamoto, K. Infrared and Raman Spectra of Inorganic and Coordination compounds; John
Wiley & Sons: New-York, 1986. (30) Gomez, R.; Rodes, A.; Orts, J. M.; Feliu, J. M.; Perez, J. M. Surf. Sci. 1995, 342, L1104. (31) Weaver, M. J.; Zou, S.; Tang, C. J. Chem. Phys. 1999, 111, 368. (32) Heyrowsky, M.; Vavrichka, S. Collect. Czech. Chem. Commun. 1969, 34, 1204. (33) Brown, W. A.; King, D. A. J. Phys. Chem. B 2000, 104, 2578. (34) Rosca, V.; Beltramo, G. L.; Koper, M. T. M. J. Phys. Chem. B 2004, 108, 8294. (35) Rodes, A.; Gomez, R.; Perez, J. M.; Feliu, J. M.; Aldaz, A. Electrochim. Acta 1996, 41, 729. (36) de Vooys, A. C. A.; Koper, M. T. M.; van Santen, R. A.; van Veen, J. A. R. Electrochim. Acta
2001, 46, 923. (37) Rodes, A.; Climent, V.; Orts, J. M.; Perez, J. M.; Aldaz, A. Electrochim. Acta 1998, 44, 1077. (38) Rosca, V.; Koper, M. T. M. J. Phys. Chem. B 2005, 109, 16750. (39) Dima, G. E.; Beltramo, G. L.; Koper, M. T. M. Electrochim. Acta 2003, 554-555, 15. (40) Herrero, E.; Franaszczuk, K.; Wieckowski, A. J. Phys. Chem. 1994, 98, 5074. (41) Housmans, T. H. M.; Koper, M. T. M. J. Phys. Chem. B 2003, 107, 8557.
98

6
Electrocatalytic oxidation of ammonia on Pt(111) and Pt(100) surfaces Abstract The electrocatalytic oxidation of ammonia on Pt(111) and Pt(100) has been studied using voltammetry, chronoamperometry, and in situ infrared spectroscopy. The oxidative adsorption of ammonia results in the formation of NHx (x=0-2) adsorbates. On Pt(111), ammonia oxidation occurs in the double-layer region and results in the formation of NH and, possibly, N adsorbates. The experimental current transients show a hyperbolic decay (t-1), which indicates strong lateral (repulsive) interactions between the (reacting) species. On Pt(100), the adsorbed NH2 fragment is the stable intermediate in ammonia oxidation. Stabilization of NH (and N) and NH2 fragments on Pt(111) and Pt(100), respectively, is in an interesting agreement with recent theoretical predictions. The Pt(111) surface shows extremely low activity in ammonia oxidation to dinitrogen, thus indicating that neither NH nor N (strongly) adsorbed species are active in dinitrogen production. Neither nitrous oxide nor nitric oxide is the product of ammonia oxidation on Pt(111) at potentials up to 0.9 V, as deduced from the in situ infrared measurements. The Pt(100) surface is highly active for dinitrogen production. This process is characterized by a Tafel slope of 30 mV decade-1, which is explained by a rate-determining dimerization of NH2 fragments followed by a fast decay of the surface-bound hydrazine formed to dinitrogen. Therefore, the high activity of the Pt(100) surface in ammonia oxidation to dinitrogen is likely to be related to its ability to stabilize the NH2 adsorbate.
This chapter is to be published.
99
Chapter 6
6.1. Introduction The electrochemical oxidation of ammonia on the transition metals has been
receiving considerable attention, particularly in connection with the possibility of using ammonia in the electrochemical fuel cells,1-4 in the environmental (electro)catalysis,5,6 and the electrochemical detection of ammonia.7,8 From a scientific point of view, ammonia electrooxidation on platinum, as well as on other metal surfaces, is an attractive electrocatalytic model system. Achieving a molecular level understanding of the electrocatalytic reactions of ammonia obviously requires studies on single-crystal surfaces and use of the non-electrochemical molecular-level probes.
In early studies on polycrystalline platinum, ammonia oxidation in alkaline media was commonly viewed as a stepwise electrocatalytic dehydrogenation process, resulting in the formation of NHx adsorbed species (x=0-2).5,9,10 It was assumed that molecular nitrogen was formed by the recombination of two nitrogen adatoms.9 In a later, more detailed, mechanistic study, Gerischer and Mauerer11 suggested that (partially) discharged hydroxyl takes part in the dehydrogenation steps. These authors pointed to the dimerization of the NHx (x=1,2) fragments and the subsequent dehydrogenation of the resulting dimer as the most plausible scenario for the formation of molecular nitrogen, whereas atomic nitrogen was assumed to act as a catalyst poison. The authors provided an ex situ analysis suggesting the formation of atomic nitrogen.
More recent studies provided further details on ammonia oxidation, mostly confirming and extending the Gerischer-Mauerer mechanism.12-14 Gootzen et al.13 identified the NH adsorbate to be the stable intermediate of ammonia oxidation to molecular nitrogen and also suggested atomic nitrogen as the catalyst poison. De Vooys et al.14 examined the reactivity of a series of transition and coinage metals for ammonia oxidation, using voltammetry and on-line differential electrochemical mass spectrometry (DEMS). The authors pointed to the importance of the nature of the products of ammonia anodic adsorption and the overpotentials at which these adsorbates are formed. An electrode surface was active for the dinitrogen formation, provided the NHx species were formed at sufficiently low overpotentials, whereas atomic nitrogen was indicated as the poison. In a subsequent in situ surface-enhanced Raman spectroscopy (SERS) study, de Vooys et al.15 demonstrated the formation of atomic nitrogen on palladium, which is a poor dinitrogen formation electrocatalyst, supporting the Gerischer-Mauerer assumption that atomic nitrogen acts as a poison. In a very recent rotating ring-disk electrode (RRDE) study, Endo et al.16 could detect in situ some weakly adsorbed intermediates, both oxidizable and reducible ones, suggesting the formation of a small amount of hydroxylamine.
100

Electrocatalytic oxidation of ammonia on Pt(111) and Pt(100) surfaces
There are few studies of ammonia oxidation on single-crystal platinum electrodes. Nonetheless, these studies provided important information on the structure sensitivity of ammonia oxidation. Gao et al.17 reported mass spectrometry measurements of ammonia oxidation on Pt(100) and pointed to the high activity of this surface. These authors also observed the production of molecular nitrogen between ca. 0.6 and 0.9 V. More recently, Vidal-Iglesias et al.18 reported a voltammetric study of ammonia oxidation on Pt(111), Pt(110) and Pt(100). The authors demonstrated a structure sensitivity of ammonia oxidation on platinum: Pt(100) was highly active for ammonia oxidation at potentials as low as 0.5 V, whereas Pt(111) and Pt(110) showed virtually no activity in the potential range up to ca. 0.9 V. In a subsequent paper, Vidal-Iglesias et al.19 concluded that the activity toward ammonia oxidation was quite sensitive to the width of the (100) terrace and the orientation of the step. Very recently, the same authors reported results of a DEMS study of ammonia oxidation on Pt(111), Pt(110) and Pt(100), using 15N labeled ammonia.20 The Pt(100) surface showed very high activity and selectivity towards ammonia oxidation to dinitrogen; at potentials above ca. 0.7 V vs. RHE, nitrous oxide and nitric oxide become dominant products. For a cyclic voltammogram with the upper potential limit of ca. 1.5 V, a strong deactivation of the surface was observed. Pt(111) and Pt(110) were shown to be much poorer electrocatalysts for ammonia oxidation in general and to dinitrogen in particular.
This chapter describes the results of a detailed voltammetric analysis and chronoamperometry of ammonia oxidation on Pt(111) and Pt(100) surfaces, aiming particularly at understanding the initial stages of the reaction and explaining the differences in activity between these two surfaces. In situ reflection-absorption infrared spectroscopy (FTIRRAS) was employed to identify the products of ammonia oxidation on Pt(111). Taking the Gerischer-Mauerer mechanism as the starting hypothesis, we critically analyze the mechanistic aspects of ammonia electrooxidation. The Pt(100) and Pt(111) surfaces were chosen as model electrocatalysts: the former is exceptionally active and the latter is inactive towards the ammonia oxidation to dinitrogen. On the basis of our experimental results, as well as relying on the available theoretical and ultrahigh vacuum (UHV) data, we propose a more detailed mechanistic picture of ammonia oxidation on the two surfaces and, most importantly, identify the factors controlling the activity towards dinitrogen production.
6.2. Experimental Section
The 0.5 M H2SO4 and 0.1 M NaOH solutions were prepared from the concentrated
sulfuric acid (95-98%, Suprapur, Merck) and from sodium hydroxide monohydrate (Suprapur, Merck), respectively, using ultrapure water (Millipore MilliQ system, 18.2 MΩ
101

Chapter 6
cm, 3-4 ppb total organic carbon) or deuterium oxide (Uvasol, Merck, deuteration degree min. 99%) as solvents. The 0.5 M ammonia solutions were prepared from a concentrated solution (25%, Suprapur, Merck) using either ultrapure water or deuterium oxide. A corresponding volume of this solution was added to the working electrolyte to create the necessary concentration of ammonia, the resulting dilution being negligible (less than 1%).
Two types of single-crystal platinum electrodes were used. Bead-type single-crystal platinum electrodes (ca. 2 mm diameter), prepared by Clavilier’s method,21 were used for most of the electrochemical measurements. For the in situ infrared measurements, commercial disc electrode were used (10 mm diameter; oriented within 1°; Surface Preparation Laboratory, Zaandam, The Netherlands). Before each experiment, the working electrode was flame-annealed, cooled to room temperature in an Ar:H2 (3:1) gas mixture and transferred to the electrochemical cell under the protection of a droplet of deoxygenated ultrapure water.
Electrochemical measurements were performed in a single-compartment three-electrode glass cell, using a computer-controlled potentiostat (AutoLab-PGSTAT20, Eco Chemie, Utrecht, The Netherlands). The cell and the other glassware were cleaned by boiling in a 1:1 mixture of the concentrated nitric and sulfuric acid, followed by repeated boiling with ultrapure water. A coiled platinum wire served as counter electrode. In NaOH solutions, the reference electrode was an internal reversible hydrogen electrode (RHE), connected via a Luggin capillary. In H2SO4 solutions a saturated mercury-mercury sulfate (Hg/Hg2SO4/K2SO4(sat)) electrode, also connected via a Luggin capillary, was used as reference. However, all potentials are quoted versus the RHE. Before each experiment, all solutions were deoxygenated by purging with pure (N50) argon for ca. 45 minutes.
The in situ Fourier transform infrared reflection-absorption spectroscopy (FTIRRAS) measurements were performed under external reflection conditions. The Fourier-transform infrared spectrometer was a Brüker IFS113V, equipped with a narrow-band MCT detector. The design of the spectroelectrochemical cell closely resembles that described elsewhere.22 The cell featured a prismatic CaF2 transmission window beveled at 60°. Five hundred interferograms were collected at each potential. The spectral resolution was 8 cm-1. The reflectance spectra were calculated as (R−R0)/R0, where R and R0 are the reflectance at the sample and the reference potential respectively. Therefore, the (R−R0)/R0 ratio gives negative bands for species that are formed and positive bands for species that are consumed at the sample potential, as compared to the reference potential.
The surface order and cleanliness of the working electrodes were checked before each experiment by recording the blank cyclic voltammograms in 0.5 M sulfuric acid and their comparison to the standard voltammetric profiles for the Pt(100)-(1×1) or Pt(111) surfaces.23-27 If the CV satisfied the criteria for the surface order, the electrode was transferred to the cell containing alkaline solution.
102

Electrocatalytic oxidation of ammonia on Pt(111) and Pt(100) surfaces
6.3. Results and Data Analysis
6.3.1. Ammonia oxidation on Pt(111)
6.3.1.1. Cyclic voltammetry The solid line in Figure 6.1 shows the blank voltammetric profile of a
Pt(111) electrode in alkaline solution. The cyclic voltammogram (CV) presents three distinct regions: (i) the hydrogen adsorption/desorption (or hydrogen underpotential deposition, Hupd) region between ca. 0.05 and 0.3 V, (ii) the double layer region between ca 0.3 and 0.65 V, and (iii) the oxygen (or hydroxide) adsorption and desorption region between ca. 0.65 and 0.9 V. Note that in the present study we examine ammonia oxidation in the potential region in which the Pt(111) surface maintains its structural order (between 0.05 and 0.9 V).
The bold solid line in Figure 6.1 represents the CV recorded in the presence of ammonia in solution. Ammonia shows no activity in the Hupd region. Ammonia oxidation begins in the double-layer region (voltammetric peak EO1
111 at ca. 0.5 V) and continues in the OH adsorption region (peak EO2
111 at ca. 0.7 V and feature EO3
111 at potentials higher than ca. 0.8 V). The reverse negative-going scan shows three characteristic reduction features: ER1
111 at ca. 0.65 V, and peaks ER2111 and
ER3111 between ca. 0.45 and 0.2 V. The latter two are strongly overlapped for CVs
recorded at low scan rates (lower than 10 mV s-1).
0.0 0.2 0.4 0.6 0.8 1.0-40
-20
0
20
40
ER3111 ER2
111ER1
111
EO3111
EO2111
EO1111
Pt(111) blank CV + 5 mM NH3
j /
µA c
m -2
E / V vs. RHE
Figure 6.1. Cyclic voltammograms recorded at Pt(111) electrode in 0.1 M NaOH in the absence of ammonia (solid line) and in the presence of ammonia (bold solid line). Experimental conditions: starting potential 0.05 V; scan rate 20 mV s-1; 5×10⁻³ M NH3.
103

Chapter 6
From the effect of the potential sweep rate on the peak height it was deduced that features EO1
111, ER1111, ER2
111 and ER3111 correspond to surface-confined
processes. Accordingly, their peak current densities show a linear increase with the potential sweep rate (in log(jp) – log (v) coordinates) in a wide scan rate window. The values of corresponding slopes were close to 1 (within 10% error). The linear regression analysis was applied to 8 to 12 experimental points and the square of the correlation coefficient (r2) was at least 0.999. The feature EO2 shows somewhat poorer linearity (8 experimental points, slope 0.92, r2 = 0.992), which must be related to errors in reading the peak position (it is a broad peak) and increasing overlap with peak EO1
111 at scan rates higher than ca. 100 mV s-1.
0.0 0.1 0.2 0.3 0.4 0.5-30
-20
-10
0
10
20
ER3111 ER2
111
j /
µA c
m -2
E / V vs. RHE0.2 0.4 0.6 0.8 1.0
-40
-20
0
20
40
ER3111 ER2
111 ER1111
EO2111
EO1111
654
32
1 1 - 0.40 V 2 - 0.50 V 3 - 0.56 V 4 - 0.66 V 5 - 0.80 V 6 - 0.90 V
j /
µA c
m -2
E / V vs. RHE
Figure 6.2. (left) Cyclic voltammograms recorded at Pt(111) electrode in 0.1 M NaOH in the presence of ammonia. The CVs differ by their upper-potential limit, as indicated in the legend of the figure. Experimental conditions: starting potential 0.05 V; scan rate 20 mV s-1; 1×10⁻³ M NH3. Figure 6.3. (right) Cyclic voltammogram showing the independent removal of the features ER2 and ER3 (see text for details). The bold solid line shows the complete removal of features ER2 and ER3 in a single run to 0.05 V. The dotted line (CV reversed at ca. 0.3 V) and the (thin) solid line (the CV reversed at 0.05 V) were recorded consecutively. Experimental conditions: 0.1 M NaOH + 5×10⁻⁵ M NH3; 20 mV s-1; starting potential 0.5 V.
Figure 6.2 illustrates the effect of the value of the upper-potential limit on
the negative-going part of the CV. In this experiment, the potential run was started at 0.1 V in the positive-going direction. Continuous potential cycling, combined with gradual increase of the upper potential limit of the CV, allowed us to follow the appearance of the features in the negative-going scan. First, it is obvious that the faradaic process corresponding to peak EO1 gives the reactants for the reduction process(es) related to peaks ER2
111 and ER3111. The gradual increase of the upper-
potential limit brings about the appearance (in the negative-going scan) of the peak
104

Electrocatalytic oxidation of ammonia on Pt(111) and Pt(100) surfaces
ER3 first and, next, of the peak ER2111. The position and shape of peaks ER2
111 and ER3
111 are independent of the value of the upper-potential limit, provided the upper-potential limit of ca. 0.7 V is achieved. The charge under peak EO1
111 (QO1), corrected for the double-layer charging, corresponded to ca. 147 µC cm-2. The charge under peaks ER2
111 and ER3111 (QR2+R3), corrected for the double-layer
charging and the H adsorption, is ca. 141 µC cm-2. The ratio QO1 / QR2+R3 is, therefore, very close to one, which suggests that the ammonia oxidation in the potential region up to ca. 0.7 V is chemically reversible. We assume that ammonia is the only product of the reductive stripping corresponding to ER2
111 and ER3111.
Second, ammonia oxidation in the OH adsorption region (between ca. 0.65 and 0.9 V), reflected in the appearance of peak EO2
111, can be also reversed in the negative-going scan (peak ER1
111). Feature EO3111 probably corresponds to the OH adsorption
at the available surface sites. The experimental charge corresponding to ammonia oxidation in the double-
layer region (ca. 145 µC cm-2) may be compared to the charge corresponding to one electron transfer per atom of Pt(111) surface (ca. 240 µC cm-2) in order to deduce the number of electrons transferred per ammonia molecule and the coverage of the adsorbed product(s). The transfer of one, two or three electrons per ammonia molecule would correspond to the formation of an adsorbate adlayer with a coverage of ca. 0.6 ML (of NH2(ads)), 0.3 ML (of NH(ads)) and 0.2 ML (of N(ads)), respectively. Strong lateral interactions between the reacting species, observed for ammonia oxidation in the double-layer region (see the subsection 6.3.1.2.), would exclude low coverage values. At the same time, the Tafel slope observed for feature EO1
111 (see subsection 6.3.1.3) suggests a multiple (at least two) electron transfer, leaving NH and N adsorbates as the most likely stable intermediates of ammonia dehydrogenation on Pt(111).
Figure 6.2 also shows that peaks ER3111 and ER2
111 appear consecutively in the negative going scan with the increasing upper-potential limit of the corresponding CVs. This result suggests that the two features do not correspond to consecutive steps of a single multistep process. Figure 6.3 gives further support to this assumption. In this experiment we have first generated an adlayer of the products of ammonia oxidation in the double-layer region (feature EO1) by keeping the potential at 0.65 V for ca. two minutes. Then, the electrode potential was stepped to 0.5 V for 5 seconds, followed by a complete stripping of the formed adsorbates (Figure 6.3, the bold solid line) or by performing two consecutive potential scans; the first was reversed at ca. 0.3 V (the dotted line) and the second was reversed at ca. 0.05 V (the thin solid line). The latter potentiodynamic program revealed that peaks ER2
111 and ER3111 could be removed consecutively and (to some
extent) independently. As an interpretation of this result, the two peaks may
105

Chapter 6
correspond to the reductive stripping of species having somewhat different reactivity (and, as presented in the subsection 6.3.1.3, showing different kinetics).
Figure 6.4. (left) Cyclic voltammograms recorded at Pt(111) electrode in 0.1 M NaOH in the presence of ammonia. Experimental conditions: starting potential 0.05 V; scan rate 10 mV s-1; ammonia concentration is indicated in the legend of the figure.
0.0 0.2 0.4 0.6 0.8 1.0-20
-10
0
10
20
ER3111 ER1
111
ER2111
EO2111
EO1111
1 x10⁻³ M 2 x10⁻³ M 5 x10⁻³ M 10 x10-3 M 20 x10-3 M
j /
µA c
m -2
E / V vs. RHE0.4 0.6 0.8
0
1
2
3
Line 1 - 5 mV s-1
Line 2 - 10 mV s-1
Line 3 - 20 mV s-1
Line 4 - 50 mV s-1
4
3
2
1
j / v
/ m
A c
m -2
V-1 s
E / V vs. RHE
Figure 6.5. (right) The scan-rate corrected cyclic voltammograms recorded at Pt(111) electrode in 0.1 M NaOH in the presence of ammonia. The CVs differ by the scan rate, as indicated by the numbers in the legend of the figure. Experimental conditions: starting potential 0.05 V; 1×10⁻³ M NH3.
Figure 6.4 shows the effect of the ammonia concentration on the
voltammetric profile recorded between 0.05 and 0.9 V. The increase of ammonia concentration does not result in a considerable increase of the current densities observed. Despite small changes, the voltammetric profile remains essentially the same. This result is in agreement with the earlier conclusion that all the voltammetric features observed in the presence of ammonia correspond to surface-confined processes. The observed changes must be related to the increasing ammonia (equilibrium) coverage with increasing concentration, as deduced from the negative shift of the peak EO1
111 position and slight increase of its charge, and, therefore, some increase of the coverage of the resulting adsorbed intermediates, as deduced form the change in the intensity of features ER2
111 and ER3111.
The positions of all the voltammetric features observed shift with the potential scan rate, which implies kinetic limitations. Figure 6.5 shows the voltammograms for ammonia oxidation at four different scan rates. The current density was corrected for the scan rate to facilitate the comparison of the relative intensities of the features EO1
111 and EO2111. An important observation here is that
the relative height and the charge of peak EO2111 (as compared to EO1) increases
with decreasing scan rate. This result indicates that peak EO2111 corresponds to a
106

Electrocatalytic oxidation of ammonia on Pt(111) and Pt(100) surfaces
slow continuous process, which involves the adsorbed species formed from ammonia oxidation in the double-layer region (peak EO1
111).
6.3.1.2. Chronoamperometry We performed potential step experiments to examine the rate law(s) of
ammonia oxidation as well as of the reductive stripping of the products of ammonia oxidation. Current transients provide more straightforward criteria for deducing the order of the reaction as well as for establishing the existence of (strong) lateral interactions, as compared to voltammetry. More specifically, a first-order reaction with insignificant lateral interactions between the (reacting) species would show an exponential decay, whereas a second order process would show a current transient with a maximum at half coverage.28,29 If strong repulsive interactions exist between the (reacting) species, a first-order reaction would show a hyperbolic (t−1) decay, whereas a second-order reaction would show a current transient with a maximum at coverages significantly higher than half coverage.28,29 (See Chapter 3)
Figure 6.6 shows a current transient for the potential step from 0.4 V to 0.65 V (feature EO1
111). The current transient shows a hyperbolic decay. The log-log plot shows a linear dependence over a wide time range with a slope very close to one. As shown elsewhere,28 such a behavior indicates (i) (apparent) first-order kinetics and (ii) strong lateral (repulsive) interactions.
0 2 4 6 8 100
3
6
9
Slope = - 0.937Nr. points = 196r2 = 0.9999
0.1 1 10
1E-6
1E-5
j /
µA c
m-2
t / s
Figure 6.6. Current transients recorded at Pt(111) in 0.1 M NaOH in the presence of ammonia. The insert shows the corresponding log-log plot and the statistics of the least-square regression line. Experimental conditions: Ein=0.3 V, Estep=0.55 V; 5×10⁻³ M NH3.
107

Chapter 6
We have used chronoamperometry to investigate the processes corresponding to other features observed in the voltammetry of ammonia oxidation. Potential step experiments within the potential windows that include features EO2
111, ER1111, ER2
111 and ER3111, showed exponential current decay only.
6.3.1.3. Tafel slope analysis
Figure 6.7 presents the results of a Tafel slope analysis. As shown
elsewhere,28,30,31 for complex surface-confined processes, such an analysis can be performed from a plot of the peak potential vs. the logarithm of the sweep rate. The observed slope was shown to be independent of the lateral interactions.28
-2 0
0.48
0.52
0.56
Slope 44 mV dec-1
N = 12r2 = 0.9992
(EO1111)
E p /
V vs
. RHE
log ( v / V s-1)
-2.5 -2.0 -1.5
0.36
0.40
(ER2111)
Slope 38 mV dec-1
N = 6r2 = 0.9987
E p /
V vs
. RH
E
log ( v / V s-1)-2 -1
0.15
0.20
0.25
Slope 96 mV dec-1
N = 9r2 = 0.9986
(ER3111)
E p /
V vs
. RH
E
log ( v / V s-1)
-2 0
0.52
0.56
0.60
(ER1111)
Slope 47 mV dec-1
N = 5r2 = 0.999
E p /
V vs
. RHE
log ( v / V s-1)
Figure 6.7. The results of the Tafel slope analysis of the voltammetric features observed in the CV recorded at Pt(111) in 0.1 M NaOH in the presence of ammonia. Exp. conditions: starting potential 0.05 V for analysis of anodic feature and 0.8 V for analysis of cathodic features; 5×10⁻³ M NH3.
Feature EO1
111 shows a Tafel slope of 44 mV decade-1 (Figure 6.7) This value is reasonably close to the theoretical value of 40 mV decade-1, typical for an electrochemical reaction involving at least two electron-transfer steps, the second electron transfer being the rate-determining step. Transfer of more than two electrons allows us to exclude the NH2 adsorbate as the product of the process corresponding to feature EO1
111. The Tafel slope values measured for the feature
108

Electrocatalytic oxidation of ammonia on Pt(111) and Pt(100) surfaces
EO2111 ranged between ca. 20 mV decade-1 at low concentrations (1-5 mM) to
almost 50 mV decade-1 at high concentrations (up to 20 mM), the linear regression statistics being quite poor in all cases (data not shown). The reduction features ER1
111 and ER2111 shows the Tafel slopes of 47 and 38 mV decade-1, respectively,
which are still reasonably close to the value of 40 mV decade-1. The Tafel slope observed for peak ER3
111 is significantly higher, close to 100 mV decade-1. This result may indicate kinetic limitations related to the first electron transfer.
6.3.1.4. In situ infrared spectroscopy
The main goal of our in situ infrared spectroscopy measurements was the
detection of the oxygen-containing products of ammonia oxidation in the potential region under investigation (0.05-0.9 V). Unfortunately, there is a strong overlap of the spectral regions, in which fundamentals of water and ammonia are observed.32 Using deuterium oxide instead of water as a solvent does not result in a better separation of the fundamentals of the deuterated water and ammonia.33 This fact, together with the exceeding water content, made it difficult to straightforwardly detect ammonia and detail on its consumption or formation with the applied potential. We have also examined the experimental data on the presence of any sign of the adsorbed NHx (x=1-3) species, but could not isolate any clear-cut spectroscopic signatures of the above adsorbates.
Figure 6.8 shows the potential-difference spectra for ammonia oxidation, recorded with the p-polarized light and using water as solvent. As expected, the spectra show a relative increase of the water content in the thin layer with the increasing potential (Fig. 6.8A). This was deduced from a strong negative band (accumulation of species) at ca. 1650 cm-1, which can be straightforwardly assigned to the water scissoring mode (δHOH). Figure 6.8B shows the spectral window between 3500 and 4000 cm-1. We assign the strong positive band, corresponding to the consumption of species, at ca. 3710 cm-1 to the νOH mode of the solution OH−. Accordingly, the position of this band is independent of the applied potential. Furthermore, this band was also observed in the absence of ammonia in solution. As can be deduced from the effect of the applied potential on the band intensity, moderate consumption of the hydroxyl anion in the 0.25-0.55 V region is followed by a significantly higher consumption of the hydroxyl in the 0.6-0.8 V. Such dependence was reproducibly observed in the presence of ammonia, but not in its absence, confirming that ammonia is oxidized in the entire potential region. Therefore, this dependence may reflect the trend of hydroxyl anion involvement in ammonia oxidation at different potentials. Most importantly, as is illustrated in Figure 6.8A, we never observed the presence of nitrous oxide, which
109
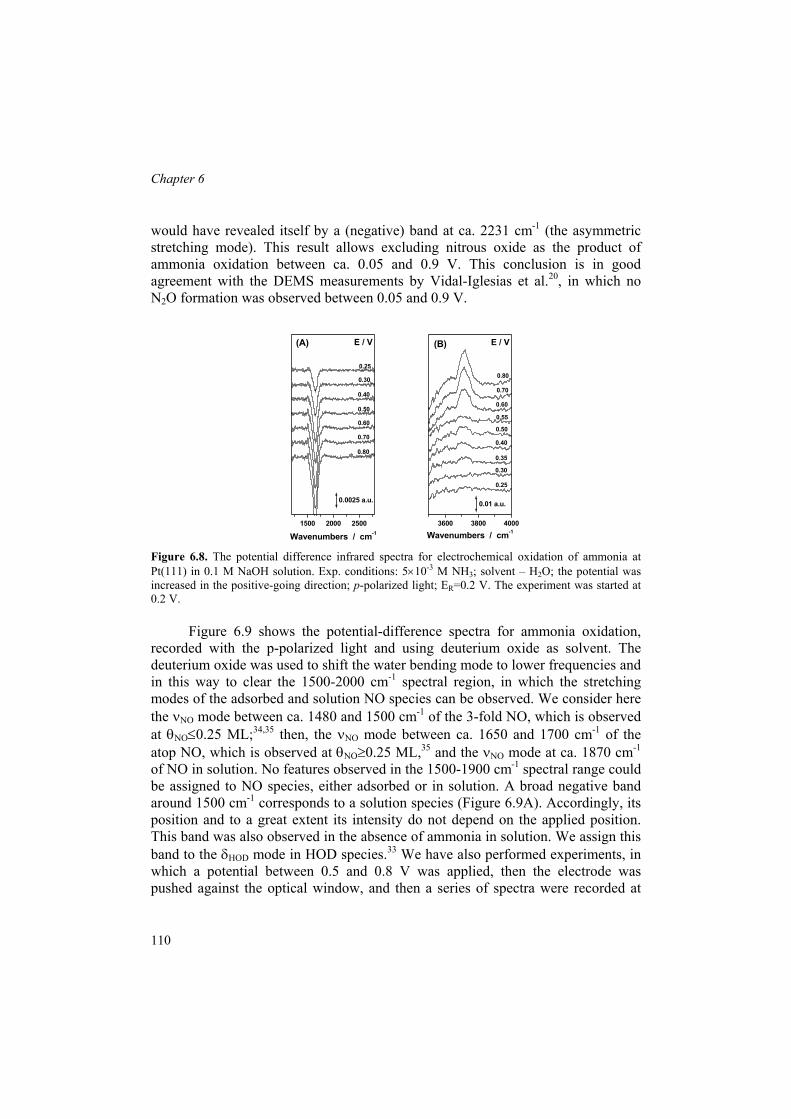
Chapter 6
would have revealed itself by a (negative) band at ca. 2231 cm-1 (the asymmetric stretching mode). This result allows excluding nitrous oxide as the product of ammonia oxidation between ca. 0.05 and 0.9 V. This conclusion is in good agreement with the DEMS measurements by Vidal-Iglesias et al.20, in which no N2O formation was observed between 0.05 and 0.9 V.
1500 2000 2500
(A)
0.25
0.30
0.40
E / V
0.80
0.60
0.50
0.70
0.0025 a.u.
Wavenumbers / cm-1
3600 3800 4000
(B)
0.25
0.30
0.35
0.40
E / V
0.80
0.55
0.60
0.50
0.70
0.01 a.u.
Wavenumbers / cm-1
Figure 6.8. The potential difference infrared spectra for electrochemical oxidation of ammonia at Pt(111) in 0.1 M NaOH solution. Exp. conditions: 5×10⁻³ M NH3; solvent – H2O; the potential was increased in the positive-going direction; p-polarized light; ER=0.2 V. The experiment was started at 0.2 V.
Figure 6.9 shows the potential-difference spectra for ammonia oxidation,
recorded with the p-polarized light and using deuterium oxide as solvent. The deuterium oxide was used to shift the water bending mode to lower frequencies and in this way to clear the 1500-2000 cm-1 spectral region, in which the stretching modes of the adsorbed and solution NO species can be observed. We consider here the νNO mode between ca. 1480 and 1500 cm-1 of the 3-fold NO, which is observed at θNO≤0.25 ML;34,35 then, the νNO mode between ca. 1650 and 1700 cm-1 of the atop NO, which is observed at θNO≥0.25 ML,35 and the νNO mode at ca. 1870 cm-1 of NO in solution. No features observed in the 1500-1900 cm-1 spectral range could be assigned to NO species, either adsorbed or in solution. A broad negative band around 1500 cm-1 corresponds to a solution species (Figure 6.9A). Accordingly, its position and to a great extent its intensity do not depend on the applied position. This band was also observed in the absence of ammonia in solution. We assign this band to the δHOD mode in HOD species.33 We have also performed experiments, in which a potential between 0.5 and 0.8 V was applied, then the electrode was pushed against the optical window, and then a series of spectra were recorded at
110

Electrocatalytic oxidation of ammonia on Pt(111) and Pt(100) surfaces
more negative potentials. Results of such an experiment are shown in Figure 6.9B. We never observed any spectroscopic evidence for the formation and then reductive stripping of the NOads species in these experiments, which strongly suggests that nitric oxide is not a stable intermediate (or product) of ammonia oxidation in the potential region considered. This conclusion is in agreement with the DEMS measurements by Vidal-Iglesias et al.20, in which no NO (in solution) was detected in the 0.05-0.9 V range.
1200 1600 2000
(A)
0.80
0.25
0.30
0.40
E / V
0.60
0.50
0.70
0.02 a.u.
Wavenumbers / cm-1
1600 1800 2000
(B)
0.15
0.20
0.30
0.40
E / V
0.75
0.60
0.50
0.70
0.001 a.u.
Wavenumbers / cm-1
Figure 6.9. The potential-difference infrared spectra for electrochemical oxidation of ammonia at Pt(111) in 0.1 M NaOH solution. Exp. conditions: 5×10⁻³ M NH3; solvent – D2O; p-polarized light. (A) The experiment was started at 0.2 V. The potential was gradually increased; ER=0.2 V. (B) The experiment was started at 0.8 V. The potential was gradually decreased in the negative-going direction; ER=0.1 V.
6.3.2. Ammonia oxidation on Pt(100).
6.3.2.1 Cyclic voltammetry.
The blank CV of the Pt(100) electrode, shown in the insert of Figure 6.10,
corresponds to a well-ordered Pt(100)-(1×1) surface and is stable for upper-potential limits up to 0.8 V. The CV of the Pt(100) electrode indicates that the Hupd region overlaps with the OH adsorption and desorption region. The local current minimum at ca. 0.43 V is taken in this work as the arbitrary boundary between the two regions. The charge obtained by integration between 0.1 and 0.7 V, and between 0.1 and 0.43 V, measured 250 µC cm-2 (QT
100) and 132 µC cm-2 (QH100),
respectively (after correction for the double-layer charging). The QH100 charge will
111

Chapter 6
be used for calculating the coverage of the products of ammonia oxidation in the potential region between 0.1 and 0.43 V.
Figure 6.10 shows the voltammetry of the ammonia oxidation on Pt(100). The pair of peaks, EO1
100 at ca. 0.35 V and ER1100 at ca. 0.32 V, observed in the Hupd
region apparently corresponds to a surface-confined redox couple. Accordingly, the height of both peaks shows a linear increase with the potential sweep rate in a wide range of the scan rates (up to 1 V s-1). The values of the corresponding slopes of the linear regression lines (in log(jp) – log (v) coordinates) were close to 1 (within 5% error). The linear regression analysis was applied to 15 experimental points and the square of the correlation coefficient (r2) was at least 0.9998. The position of these peaks, but not that much the integrated charge, is slightly dependent on the ammonia concentration in solution, and independent of the upper-potential limit. The latter fact points to the formation of a stable and reproducible adlayer of the products of ammonia oxidation. The net charge under peaks EO1
100 and ER1100
measures 63 µC cm-2 and 68 µC cm-2, respectively, for the integration between 0.1 V and 0.43 V and after the correction for the hydrogen adsorption (QH
100). Comparing this charge with the charge corresponding to the transfer of one electron per one Pt atom of Pt(100) surface (210 µC cm-2), we conclude that ammonia oxidation in the Hupd region involves a transfer of (approximately) one electron per three Pt atoms. Consequently, if the ammonia oxidation involves one electron transfer per molecule, the resulting coverage of the adsorbed product would be ca. 0.33 ML (of NH2) , whereas for a two- and three-electron-transfer processes the coverage of the adsorbed products would be ca. 0.17 ML (of NH) and 0.11 ML (of N), respectively.
At potentials more positive than 0.5 V, ammonia is further oxidized in a fast continuous process (Figures 6.10). Previous studies indicated molecular nitrogen as the product of this process.17,20 The DEMS measurements by Vidal-Iglesias et al.20 also point to the formation of N2O and some NO in solution, at potentials higher than ca. 0.7 V.
Our potentiodynamic measurements indicated no surface deactivation between 0.65 and 0.8 V. On the other hand, our steady-state current measurements (data not shown) indicated a slow surface deactivation in the same range of potentials, although the initial electrocatalytic activity, measured at 0.55 V, was recovered without the need of stepping to lower potentials.
6.3.2.2. Tafel slope analysis.
Figure 6.11 shows the results of the Tafel slope analysis of the peaks EO1
100 and ER1
100. The corresponding peak potential vs. the logarithm of the sweep rate
112

Electrocatalytic oxidation of ammonia on Pt(111) and Pt(100) surfaces
dependences indicate a (electrochemically) quasi-reversible system, the linear relationship (the electrochemical irreversibility) being observed at scan rates higher than ca. 0.4 V s-1. The values of the Tafel slope are ca. 100 mV decade-1 and ca. 121 mV decade-1 for EO1
100 and ER1100, respectively. These values suggest that the
first electron transfer is the rate-determining step (theoretically 120 mV decade-1) for both forward and back reactions. Moreover, the redox couple corresponding to peaks EO1
100 and ER1100 seems to involve a single electron transfer (most probably
combined with a proton transfer). First, we never observed any splitting of either peak with the increasing scan rate (up to 1 V s-1), which would suggest complexity of the process, e.g. multiple steps. Second, if the reaction would involve more than one electron, than the coverage of the adsorbed products would be ca. 0.17 ML or lower, which seems unlikely.
0.0 0.1 0.2 0.3 0.4 0.5 0.6 0.7 0.8
0
200
400
600
800
j /
µA c
m-2
E / V vs. RHE
0.1 0.2 0.3 0.4 0.5 0.6 0.7
-30
0
30
ER1100
EO1100
-0.8 -0.6 -0.4 -0.2 0.0 0.2
0.10
0.15
0.20
0.25
0.30
0.35
0.40
0.45
0.50
Slope 121 mV decade-1
N = 7r2=0.9993
Slope 97 mV decade-1
N = 8r2=0.9994
E p /
V vs
. RH
E
lg ( ν / V s-1)
Figure 6.10. (left) Cyclic voltammograms recorded at Pt(100) electrode in 0.1 M NaOH in the absence of ammonia (solid line in the inset) and in the presence of ammonia (bold solid line). Experimental conditions: starting potential 0.05 V; scan rate 10 mV s-1; 1×10⁻³ M NH3. Figure 6.11. (right) The results of the Tafel slope analysis of the voltammetric feature EO1
100 and ER1
100 observed in the CV recorded at Pt(100) in 0.1 M NaOH in the presence of ammonia. Experimental conditions: starting potential 0.05 V for analysis of anodic feature and 0.45 V for analysis of the cathodic feature; 5×10⁻³ M NH3.
Figure 6.12 shows the polarization curve for ammonia oxidation at a low
scan rate (2 mV s-1). At such a slow scan rate the condition of (quasi-) reversibility should apply and the log (j) vs. E plot at the “foot” of the voltammetric wave should give the Tafel slope. The insert shows the result of the Tafel slope analysis at the foot of the wave. The semi-logarithmic plot is indeed linear in the potential
113

Chapter 6
range between ca. 0.5 V and 0.54 V: the slope is ca. 30 mV decade-1 and is independent of the ammonia concentration (between 1×10⁻³ and 20×10-3 M NH3) and of the scan rate (up to 10 mV s-1).
0.1 0.2 0.3 0.4 0.5 0.6 0.7 0.8
0.0
0.5
1.0
1.5
2.0
2.5
0.54 V
0.495 V
j /
mA
cm
-2
E / V vs. RHE
0.45 0.50 0.55 0.60 0.65
1E-6
1E-5
1E-4
1E-3Slope 30 mV decade-1
N = 137r2=0.9999
Figure 6.12. Cyclic voltammograms recorded at Pt(100) electrode in 0.1 M NaOH in the presence of ammonia. The insert shows the results of the Tafel slope analysis “at the foot” of the wave (see text for details). Experimental conditions: starting potential 0.05 V; scan rate 2 mV s-1; 5×10⁻³ M NH3.
6.3.3. Hydrazine oxidation on Pt(100).
This subsection describes the voltammetry and on-line mass spectrometry
measurements of hydrazine oxidation on Pt(100) in alkaline media. It is beyond the scope of this chapter to address the electrochemical oxidation of hydrazine in detail. Instead, we shall point at several aspects of the hydrazine oxidation on Pt(100) that seem relevant for a better understanding of the mechanism of ammonia oxidation to dinitrogen on the same surface.
Figure 6.13 compares the electrochemical oxidation of ammonia and hydrazine on Pt(100) in alkaline media under the same experimental conditions. As an important observation, the hydrazine oxidation begins at ca. 0.15 V, which is ca. 400 mV more negatively than the onset of ammonia oxidation (ca. 0.5 V). The on-line electrochemical mass spectrometry measurements point to molecular nitrogen as the only product of hydrazine oxidation on Pt(100), at least under given
114
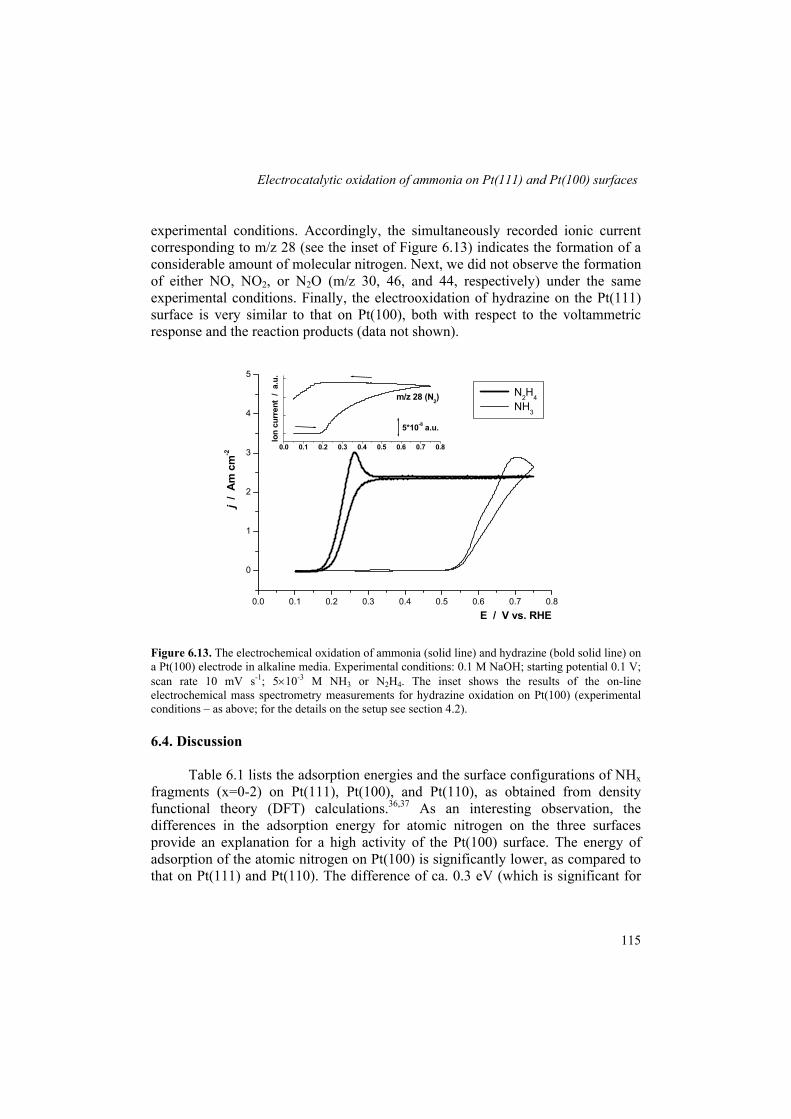
Electrocatalytic oxidation of ammonia on Pt(111) and Pt(100) surfaces
experimental conditions. Accordingly, the simultaneously recorded ionic current corresponding to m/z 28 (see the inset of Figure 6.13) indicates the formation of a considerable amount of molecular nitrogen. Next, we did not observe the formation of either NO, NO2, or N2O (m/z 30, 46, and 44, respectively) under the same experimental conditions. Finally, the electrooxidation of hydrazine on the Pt(111) surface is very similar to that on Pt(100), both with respect to the voltammetric response and the reaction products (data not shown).
0.0 0.1 0.2 0.3 0.4 0.5 0.6 0.7 0.8
0
1
2
3
4
5
N2H4 NH3
j /
Am
cm
-2
E / V vs. RHE
0.0 0.1 0.2 0.3 0.4 0.5 0.6 0.7 0.8
Ion
curr
ent
/ a.
u.
5*10-8 a.u.
m/z 28 (N2)
Figure 6.13. The electrochemical oxidation of ammonia (solid line) and hydrazine (bold solid line) on a Pt(100) electrode in alkaline media. Experimental conditions: 0.1 M NaOH; starting potential 0.1 V; scan rate 10 mV s-1; 5×10⁻³ M NH3 or N2H4. The inset shows the results of the on-line electrochemical mass spectrometry measurements for hydrazine oxidation on Pt(100) (experimental conditions – as above; for the details on the setup see section 4.2).
6.4. Discussion
Table 6.1 lists the adsorption energies and the surface configurations of NHx
fragments (x=0-2) on Pt(111), Pt(100), and Pt(110), as obtained from density functional theory (DFT) calculations.36,37 As an interesting observation, the differences in the adsorption energy for atomic nitrogen on the three surfaces provide an explanation for a high activity of the Pt(100) surface. The energy of adsorption of the atomic nitrogen on Pt(100) is significantly lower, as compared to that on Pt(111) and Pt(110). The difference of ca. 0.3 eV (which is significant for
115
Chapter 6
DFT calculations) corresponds to ca. three hundred millivolts in overpotential difference. The Gerischer-Mauerer mechanism, which found support in many recent studies on polycrystalline studies, identifies the atomic nitrogen as the catalyst poison, and not as the precursor to dinitrogen formation. Therefore, the above trend provides an explanation to the high activity of Pt(100), in the sense that Pt(100) should poison the least rapidly, and should be the most active. In the following, we will discuss how the experimental results in combination with the DFT results in Table 1 may help in identifying the key active intermediates in N2 formation.
Table 6.1. Adsorption energies (in eV) of NHx (x=0-2) at 0.25 ML.
Ref. Species Pt (100) Pt (111) Pt (110) NH2 −2.15 (on top)
−3.14 (bridge) −2.00 (on top) −2.47 (bridge)
-
NH −3.81 (bridge) −4.01 (hollow)
−4.24 (fcc-hollow) −3.84 (hcp-hollow)
- [36]
N −4.40 (hollow) −4.80 (fcc-hollow) −4.51 (hcp-hollow)
-
[37] N −3.95 (hollow) a
−3.94 (bridge) −4.32 (fcc-hollow) a −4.39 (short bridge)
a We assume that the consistent difference of 0.45-0.5 eV between our results for Nads and those from ref. 36 is related to the fact that the energy of isolated N was in our case calculated in the spin-unrestricted formalism.
6.4.1. Ammonia oxidation on Pt(111). The experimental results for ammonia oxidation on Pt(111) allows us to
draw the following picture of ammonia oxidation on Pt(111) (in the potential region between 0.05 and 0.9 V). Ammonia oxidation in the double-layer region is a surface-confined process (feature EO1
111), resulting in the formation of an adlayer of adsorbed intermediates (NH and N). As an important indication of the mechanism of the reaction, the Tafel slope for EO1
111 (ca. 40 mV decade-1) proves the involvement of a multielectron-transfer reaction. Additionally, the appreciable charge under the peak EO1
111 can be reasonably explained by the occurrence of a multielectron transfer. Therefore, we rule out the formation of (significant amounts) of the NH2 adsorbate. On the basis of the above considerations, we propose the following mechanism for the process corresponding to peak EO1
111:
116

Electrocatalytic oxidation of ammonia on Pt(111) and Pt(100) surfaces
NH3 + * NH3 (ads) equilibrium (6.1) NH3 (ads) + HO− NH2 (ads) + e− + H2O fast (6.2) NH2 (ads) + HO− NH(ads) + e− + H2O rds (6.3) NH(ads) + HO− N(ads) + e− + H2O slow (6.4) The NH2, NH, and N adsorbates were shown to be the intermediates of
ammonia oxidation on Pt(111) in UHV.38-40 These species are strongly adsorbed on Pt(111) surface, NH(ads) being particularly stable near room temperature (300-400 K).38,40 The intermediates of ammonia oxidation can be stripped off reductively, complete stripping being achieved at 0.2 V or lower potentials. Ammonia oxidation on Pt(111) begins in the double-layer region (peak EO1
111). Therefore, the oxidative adsorption of ammonia does not require coadsorbed hydroxyl, which is in disagreement with the Gerischer-Mauerer mechanism.
On the basis of the charge analysis, we conclude that the NH adsorbate is the dominant product of ammonia oxidation in the double-layer region. At the same time, the reductive stripping of the products of ammonia oxidation in this region shows a more complex picture. Features ER2
111 and ER3111 do not seem to
correspond to the consecutive steps of a single process. First, these two features can be removed consecutively and (to a great extent) independently. Second, they show different kinetics: feature ER2
111 has the Tafel slope of ca. 40 mV decade-1, whereas feature ER3
111 has a significantly higher Tafel slope, ca. 100 mV decade-1. These two observations can be explained by the formation and the reductive stripping of a single species (e.g., NH(ads)) having different reactivity and kinetics. These differences can be determined by the fact that the species occupies different adsorption sites (see subsection 6.4.3). An alternative explanation is the formation and reductive stripping of two different species, e.g. coadsorbed NH and N fragments. These species are known to prefer different adsorption geometries and may, therefore, show different reactivity (see subsection 6.4.3).
In the potential region corresponding to OH adsorption (potentials more positive than 0.65 V), ammonia oxidation is strongly inhibited. The inhibition must be related to a blockage by a strongly adsorbed species, atomic nitrogen being the best candidate for that role. Therefore, we assume that the NH adsorbate could be further dehydrogenated to N(ads) at potentials more positive than ca. 0.65 V, e.g. according to reaction (6.4). Indeed, the progressive dehydrogenation of ammonia on Pt(111) is associated with increasing activation energy.36,41 Therefore, the final dehydrogenation step may require high overpotentials, and possibly assistance by coadsorbed OH.
Feature EO2111 corresponds to a continuous, although apparently very
sluggish, process. The resulting adsorbate is a reducible species (feature ER1111).
117

Chapter 6
Significantly, we have not observed the formation of any nitrous oxide in solution or nitric oxide, either in solution or adsorbed. Previous DEMS measurements on Pt(111) demonstrated the formation of small amounts of molecular nitrogen between ca. 0.7 and 0.9 V.20 Therefore, we assume that molecular nitrogen is the product of the process corresponding to peak EO2
111. We are not in a position to discuss details on the mechanism of this process: the results of the Tafel slope analysis of peak EO2 were inconclusive. Nevertheless, we can probably rule out the atomic mechanism of N2 formation, that is, the recombination of two N(ads). Atomic nitrogen is strongly adsorbed in hollow sites; therefore its diffusion across the surface and reaction must be associated with high energetic barriers. On the contrary, we expect the atomic nitrogen to act as a catalyst poison. The previously proposed recombination of the NHx surface species (x=1,2) (Gerischer-Mauerer mechanism) seem to be a more reasonable scenario, although we have no direct evidence for such a process. In some gas phase and UHV studies of ammonia oxidation at near-room temperature38,42 (as well as nitric oxide reduction)43 on Pt(111) at room temperature, the HNO adsorbate is suggested as an intermediate. Therefore, we would not rule out the possibility of a molecular mechanism of N2 formation on Pt(111) involving formation of unstable oxygen-containing species. Irrespective of our inability to deduce the exact mechanism of that slow process, it seems reasonable to assume that the formation of N−O bond is very sluggish on Pt(111), even in the presence of coadsorbed OH.
6.4.2. Ammonia oxidation on Pt(100)
The oxidative adsorption of ammonia on Pt(100) electrode (peak EO1
100) occurs at potentials corresponding to negligible OH (co)adsorption. The voltammetric data indicate a surface confined dehydrogenation step, involving the transfer of a single electron. Therefore, the reaction scheme (6.1-6.2) should apply to the first step of ammonia dehydrogenation on Pt(100) as well. The resulting NH2 adsorbate may occupy the bridge site, by analogy with UHV and theoretical studies.36,44 Interestingly, in a recent theoretical study it was predicted that on Pt(100) the NH2 fragment should stabilize during ammonia reactions.36
The product of ammonia oxidation on Pt(100) between 0.5 and 0.65 V is molecular nitrogen.17,20 Oxygen-containing species (NO, N2O) are observed at more positive potentials.20 The reaction takes place in the potential region corresponding to OH adsorption, although the exact role of the OH adsorbate is not clear. The Tafel slope measured at the foot of the wave (between ca. 0.5 and 0.55 V, Figure 6.12) is 30 mV decade-1. The following tentative mechanism provides a simple explanation to the above value:
118

Electrocatalytic oxidation of ammonia on Pt(111) and Pt(100) surfaces
NH3 + * NH3 (ads) equilibrium (6.5) NH3 (ads) + HO− NH2 (ads) + e− + H2O fast (6.6) 2 NH2 (ads) N2H4 (ads) (rds) (6.7) N2H4 (ads) … N2 + 2* fast (6.8)
We assume that the second reaction step is a chemical and the rate-determining step. This reaction scheme corresponds to the experimental Tafel slope of 30 mV decade-1, as the rate-determining step is second order in the NH2 coverage. This mechanism identifies (surface) hydrazine (N2H4 (ads)) as the key precursor for dinitrogen formation, which seems to be a very plausible feature. Note, however, that a Tafel slope of 30 mV decade-1 in mechanism 6.3-6.8 would be obtained only if the NH2 surface coverage follows Nernst’s law. Figure 6.10 suggests that at the potential of N2 formation, the NH2 coverage is at saturation, and therefore, not potential dependent.
The fact that the formation of NH2 adsorbate below ca. 0.5 V (feature EO1100)
does not result in immediate dimerization of this species may be related to an insufficient-coverage situation. If ammonia interacts non-reactively with the Pt(100) surfaces covered with NH2 adlayer (at ca. 0.4 V), then we can assume that more positive potentials are required to activate ammonia and create the sufficient NH2 coverage.
There have been numerous studies of the hydrazine oxidation on polycrystalline platinum, as well as on other electrode materials.45,46 Most of the studies show that the hydrazine oxidation occurs at the N−H bond and not at the N−N bond, the dominant product being molecular nitrogen.45 Mass spectrometry measurements using labeled hydrazine are particularly conclusive in this respect.47,48 The mechanism of hydrazine oxidation to dinitrogen is commonly viewed as a stepwise electrocatalytic dehydrogenation process.49,50 On polycrystalline platinum in contact with an alkaline solution, hydrazine reacts to dinitrogen at approximately 0.1 V vs. RHE,49 that is, ca. 400 mV more negatively than ammonia oxidation to dinitrogen. The results on hydrazine oxidation presented in subsection 6.3.3 indicate that the above view is applicable to hydrazine oxidation on Pt(100) and Pt(111). As a key observation from the data on hydrazine oxidation, the decomposition of the surface-bonded hydrazine, which assumedly appears as an intermediate in ammonia oxidation to dinitrogen (reaction scheme 6.5-6.8), should not limit the overall reaction rate, thus leaving the dimerization of NH2 species as a better candidate.
In the light of the above considerations, the surface-bonded hydrazine or, more generally, a hydrogenated N−N dimer seems to be a good candidate for being a key intermediate in the ammonia oxidation to dinitrogen.
119

Chapter 6
6.4.3. Factors controlling the activity of NH3 oxidation to N2 In a recent detailed theoretical study, Novell-Leruth et al.36 showed that the
adsorption of ammonia (atop) and the NH2 adsorbate (bridge) is more favorable on Pt(100) than on Pt(111), whereas the adsorption energies for NH and N fragments were quite similar (Table 6.1). The significantly lower energy of the NH2 adsorbate on Pt(111), as compared with Pt(100), was attributed to different geometric and electronic factors associated with this adsorbate.36 Therefore, the surface structure determines the most stable NHx fragment: the NH2 is stable on Pt(100) and NH is stable on Pt(111). Remarkably, the above trend, which is in reasonable agreement with the UHV data,40,44 appears to apply to the reactions of ammonia in an electrochemical environment as well: our experimental data indicate that the NH2 adsorbate is stabilized on Pt(100), whereas on Pt(111) the NH (and possibly N(ads)) adsorbed species are stabilized at moderately oxidative potentials. Furthermore, we postulated the NH2 adsorbate as the precursor for dinitrogen formation on Pt(100). The atomic nitrogen is likely to act as the catalyst poison, in accordance with the Gerischer-Mauerer formalism. Stabilization of NH adsorbate on Pt(111) does not seem to be enough to assure an appreciable activity for the production of dinitrogen.
The above findings point to the importance of an “early” stabilization of the products of ammonia dehydrogenation. Indeed, the deeper the level of dehydrogenation of ammonia, the higher the coordination (and, therefore, the adsorption energy, see Table 6.1) of the resulting species is, and the less favorable the formation of N−N bond is. Therefore, a high activity of Pt(100) surface in ammonia oxidation to molecular nitrogen could be related to the ability of this surface to stabilize the NH2 fragment, which can dimerize to form surface-bonded hydrazine and then decay to dinitrogen in a surface reaction. Also, a relatively low affinity of Pt(100) for atomic nitrogen prevents poisoning of this surface at moderately oxidative potentials. On Pt(111), a deeper dehydrogenation of ammonia results in the formation of strongly adsorbed NH and N fragments, which seem to be unable to form dinitrogen at appreciable rates.
6.5. Summary and Conclusions
The electrocatalytic oxidation of ammonia on Pt(111) and Pt(100) electrodes
was characterized by voltammetry, chronoamperometry and in situ infrared spectroscopy.
The initial stages of the electrochemical oxidation of ammonia on Pt(111) surface take place in the double-layer region, resulting in formation of NH and, possibly, N adsorbates. The initial stages of the electrochemical oxidation of
120

Electrocatalytic oxidation of ammonia on Pt(111) and Pt(100) surfaces
ammonia on Pt(100) surface take place in the Hupd region, resulting in the formation of NH2 adsorbate. The above observations indicate that the adsorbed hydroxyl does not participate in the initial dehydrogenation steps on both surfaces examined. Stabilization of NH2 adsorbate on Pt(100) and NH adsorbate on Pt(111) surfaces in ammonia oxidation under electrochemical conditions is an interesting similarity with ammonia oxidation in the gas phase or in UHV.
Neither nitrous oxide nor nitric oxide is the product of ammonia oxidation on Pt(111) between ca. 0.05 and 0.9 V, as deduced from the in situ infrared measurements. This result leaves N2 as the likely product of ammonia oxidation in the OH adsorption region of potentials, that is, between ca. 0.65 and 0.9 V. At the same time, the dinitrogen formation on Pt(111) is a very sluggish process, thus indicating that neither NH nor N adsorbates can form dinitrogen at appreciable rates. A high activity of Pt(100) in ammonia oxidation to N2 (between ca. 0.5 and 0.65 V) can be explained by the ability of this surface to stabilize the NH2 adsorbate. In the tentative mechanism proposed here, two NH2 fragments form surface-bonded hydrazine, which is rapidly dehydrogenated to dinitrogen.
References (1) Wynveen, R. A. Fuel Cells 1963, 2, 153. (2) Strickland, G. J. Hydrogen Energy 1984, 9, 759. (3) Simons, E. L.; Cairns, E. J.; Surd, D. J. J. Electrochem. Soc. 1969, 116, 556. (4) Vitse, F.; Cooper, M.; Botte, G. G. J. Power Sources 2005, 142, 18. (5) Marincic, L.; Leitz, F. B. J. Appl. Electrochem. 1978, 8, 333. (6) Feng, C.; Sugiura, N.; Shimada, S.; Maekawa, T. J. Hazard. Mater. 2003, 103, 65. (7) Pfennig, D.-M.; Deprez, J.; Kitzelmann, D. Ber. Bunsenges. Phys. Chem. 1990, 94, 988. (8) Lopez de Mishima, B. A.; Lescano, D.; Molina Holgado, T.; Mishima, H. T. Electrochim. Acta 1997, 43, 395. (9) Oswin, H. G.; Salomon, M. Can. J. Chem. 1963, 41, 1686. (10) Despic, A. R.; Drazic, D. M.; Rakin, P. M. Electrochim. Acta 1966, 11, 997. (11) Gerischer, H.; Mauerer, A. J. Electroanal. Chem. 1970, 25, 421. (12) Wasmus, S.; Vasini, E. J.; Krausa, M.; Mishima, H. T.; Vielstich, W. Electrochim. Acta 1994, 39, 23. (13) Gootzen, J. F. E.; Wonders, A.; Visscher, W.; van Santen, R. A.; van Veen, J. A. R. Electrochim. Acta 1998, 43, 1851. (14) de Vooys, A. C. A.; Koper, M. T. M.; van Santen, R. A.; van Veen, J. A. R. J. Electroanal. Chem. 2001, 506, 127. (15) de Vooys, A. C. A.; Mrozek, M. F.; Koper, M. T. M.; Van Santen, R. A.; Van Veen, J. A. R.; Weaver, M. J. Electrochem. Comm. 2001, 3, 293. (16) Endo, K.; Katayama, Y.; Miura, T. Electrochim. Acta 2005, 50, 2181. (17) Gao, Y.; Kita, H.; Hattori, H. Chem. Lett. 1994, 11, 2093. (18) Vidal-Iglesias, F. J.; Garcia-Araez, N.; Montiel, V.; Feliu, J. M.; Aldaz, A. Electrochem. Comm. 2003, 5, 22.
121

Chapter 6
(19) Vidal-Iglesias, F. J.; Solla-Gullon, J.; Montiel, V.; Feliu, J. M.; Aldaz, A. J. Phys. Chem. B 2005, 109, 12914. (20) Vidal-Iglesias, F. J. PhD thesis, Universidad de Alicante, 2005. (21) Clavilier, J.; Armand, D.; Sun, S. G.; Petit, M. J. Electroanal. Chem. 1986, 205, 267. (22) Iwasita, T.; Nart, F. C.; Vielstich, W. Ber. Bunsenges. Phys. Chem. 1990, 94, 1030. (23) Clavilier, J.; Feliu, J. M.; Fernandez-Vega, A.; Aldaz, A. J. Electroanal. Chem. 1989, 269, 175. (24) Rodes, A.; Clavilier, J.; Orts, J. M.; Feliu, J. M.; Aldaz, A. J. Electroanal. Chem. 1992, 338, 317. (25) Al-Akl, A.; Attard, G. A.; Price, R.; Timothy, B. J. Electroanal. Chem. 1999, 467, 60. (26) Lebedeva, N. P.; Koper, M. T. M.; Herrero, E.; Feliu, J. M.; van Santen, R. A. J. Electroanal. Chem. 2000, 487, 37. (27) Lebedeva, N. P.; Rodes, A.; Feliu, J. M.; Koper, M. T. M.; van Santen, R. A. J. Phys. Chem. B 2002, 106, 9863. (28) Koper, M. T. M. Z. Phys. Chem. 2003, 217, 547. (29) Rosca, V.; Koper, M. T. M. Surf. Sci. 2005, 584, 258. (30) Koper, M. T. M.; Jansen, A. P. J.; Santen van, R. A.; Lukkien, J. J.; Hilbers, P. A. J. J. Chem. Phys. 1998, 109, 6051. (31) Christiansen, P. A.; Hamnett, A. Techniques and Mechanisms in Electrochemistry; Blackie Academic and Proffessional: Glasgow, 1994. (32) Nakamoto, K. Infrared and Raman Spectra of Inorganic and Coordination compounds; John Wiley & Sons: New-York, 1986. (33) Punchas, S.; Laulicht, I. Infrared Spectra of Labelled Compounds; Academic Press: London, 1971. (34) Weaver, M. J.; Zou, S.; Tang, C. J. Chem. Phys. 1999, 111, 368. (35) Rosca, V.; Beltramo, G. L.; Koper, M. T. M. Langmuir 2005, 21, 1448. (36) Novell-Leruth, G.; Valcarcel, A.; Clotet, A.; Ricart, J. M.; Perez-Ramirez, J. J. Phys. Chem. B 2005, 109, 18061. (37) Results of our own calculations. The computational details are essentially identical to those in ref. 36 (four-layers slab; 5x5x1 k-points; 400 eV energy cut-off). A (2x2) unit cell was considered with the adsorbate coverage of 1/4 ML. The important difference was that the energy of the N adsorbate was in our case calculated in the spin-unrestricted formalism. (38) Smirnov, M. Y.; Gorodetskii, V. V.; Cholach, A. R. In Fundamental Aspects of Heterogeneous Catalysis Studied by Particle Beams; van Santen, R. A., Ed., 1991; pp 249. (39) Mieher, W. D.; Ho, W. Surf. Sci. 1995, 322, 151. (40) Sun, Y.-M.; Sloan, D.; Ihm, H.; White, J. M. J. Vac. Sci. Technol. 1996, 14, 1516. (41) Fahmi, A.; van Santen, R. A. Z. Phys. Chem. 1996, 197, 203. (42) Il'chenko, N. I. Russ. Chem. Rev. 1976, 45, 1119. (43) Smirnov, M. Y.; Gorodetskii, V. V.; Block, J. H. J. Mol. Catal. A: Chem. 1996, 107, 359. (44) Zemlyanov, D. Y.; Smirnov, M. Y.; Gorodetskii, V. V. Surf. Sci. 1997, 391, 37. (45) Plieth, W. J. Encyclopedia of Electrochemistry of the Elements; Bard, A. J., Ed.; Marcel Dekker: New-York, 1978; Vol. 8. (46) Fukumoto, Y.; Matsunaga, T.; Hayashi, T. Electrochim. Acta 1981, 26, 631. (47) Schulz-Ekloff, G.; Baresel, D. J. Electroanal. Chem. 1972, 35, 73. (48) Petek, M.; Bruckenstein, S. J. Electroanal. Chem. 1973, 47, 329. (49) Harrison, J. A.; Khan, Z. A. J. Electroanal. Chem. 1970, 26, 1. (50) Kodera, T.; Honda, M.; Kita, H. Electrochim. Acta 1985, 30, 669.
122

Summary The mechanism and structure sensitivity of electrocatalytic reactions of nitric
oxide, hydroxylamine, and ammonia on low-index single-crystal platinum electrodes were studied using electrochemical techniques, in situ Fourier transform reflection-absorption infrared spectroscopy (FTIRRAS), and on-line electro-chemical mass spectrometry (OLEMS).
The main product of the reductive stripping of nitric oxide adlayers on platinum in acidic media is the ammonium cation, largely irrespective of the surface structure and the adsorbate coverage. The activity of platinum in the electrochemical reduction of adsorbed nitric oxide (NOads) is related to the coordination of NOads. As deduced from experiments on Pt(111), Pt(110), and Pt(100) surfaces, the reactivity of NOads species increases in the order NOatop>NObridge>NO3-fold-hollow. Difference in reactivity explains the appearance of multiple reduction features (peaks) in the stripping voltammetry of nitric oxide adlayers (Chapter 2).
The current transients recorded for NOads reduction on Pt(111) and Pt(110) indicate significant lateral (repulsive) interactions between the reacting species at high coverages of NO. The second-order kinetics observed for NOads reduction on Pt(110) in the limit of high coverages (ca. 1 ML) indicates the necessity of a neighboring free site, which is required most likely for breaking the N−O bond. Three fast (at equilibrium) combined electron and proton transfers precede the breaking of the N−O bond on Pt(110). The first-order kinetics was deduced from current transients recorded for NOads reduction on Pt(111) and Pt(100) at all coverages. Nevertheless, the apparent first-order kinetics can be related to a significantly lower saturation coverage of NOads on Pt(111) and Pt(100) (ca. 0.5 ML) as compared to that on Pt(110) (ca. 1 ML) and, therefore, to the availability of free sites at all coverages. A detailed mechanism of NOads reduction on Pt(110) was proposed (Chapter 3).
The reduction of NOads on Pt(100) follows an EC mechanism, in which the first electron/proton transfer is at equilibrium, resulting in the formation of HNOads intermediate, whereas the second reaction step is a chemical and the rate-determining step. This chemical step is assumed to involve the N−O bond breaking in the HNOads intermediate, which most probably requires a neighboring free site. From a comparison of NOads reduction on Pt(100), Pt(111), and Pt(110) it follows that (i) the reaction mechanism is structure sensitive and (ii) Pt(100) is the most active surface for breaking the N−O bond, which is in agreement with the trend observed under UHV conditions (Chapter 4).
123

The reactivity of hydroxylamine (HAM) at platinum electrodes is controlled by the interaction of the other components of the solution or products of the HAM oxidation with the electrode surface. Reduction of HAM to ammonia is a structure sensitive reaction, at least through the structure sensitivity of the hydrogen adsorption on platinum. Voltammetric data for Pt(111), Pt(110), and Pt(100) indicate the possibility of the HAM reduction and oxidation to occur simultaneously. This observation was tentatively explained by the existence of an intermediate, which appears both in the reduction and oxidation processes. Moreover, the reduction of HAM is likely to be activated by a dehydrogenation step. H2NOads and HNOads species were suggested as candidates. Adsorbed nitric oxide (NOads) was demonstrated to be the key intermediate in the oxidation of HAM. Being electrochemically stable in a wide potential region, NOads acts as a poison in continuous oxidation of HAM. The HAM oxidation to NOads appears to be a structure-insensitive process, though somewhat affected by the anion coadsorption. The formation of N2O at moderately oxidative potentials (below ca. 0.9 V vs. RHE) was observed for HAM oxidation at Pt(111) and Pt(110), but not at Pt(100). Mechanisms for the reduction and oxidation of HAM are proposed (Chapter 5).
The oxidative adsorption of ammonia on Pt(100) and Pt(111) in alkaline media results in the formation of NHx (x=0-2) adsorbates. On Pt(111), ammonia oxidation occurs in the double-layer region and results in the formation of NH and, possibly, N adsorbates. On Pt(100), the NH2 adsorbed fragment is the stable intermediate of ammonia oxidation. Interestingly, stabilization of NH and NH2 fragments on Pt(111) and Pt(100), respectively, is in agreement with recent theoretical predictions. The Pt(111) surface shows extremely low activity for ammonia oxidation to dinitrogen, thus indicating that neither NH nor N (strongly) adsorbed species are active in dinitrogen production. Neither nitrous oxide nor nitric oxide is the product of ammonia oxidation on Pt(111) at potentials up to 0.9 V vs. RHE, as deduced from the in situ infrared measurements. The Pt(100) surface is highly active for dinitrogen production. This process is characterized by a Tafel slope of 30 mV decade-1, which was explained by a rate-determining dimerization of NH2 fragments followed by a fast decay of the resulted surface-bound hydrazine to molecular nitrogen. Therefore, a high activity of the Pt(100) surface in ammonia oxidation to molecular nitrogen is likely to be related to its ability to stabilize the NH2 adsorbate (Chapter 6).
124

Samenvatting Het mechanisme en de structuurgevoeligheid van de elektrokatalytische
reacties van stikstofoxide, hydroxylamine en ammoniak op lage index eenkristal platina elektroden werden onderzocht m.b.v. elektrochemische technieken, in situ Fourier getransformeerde reflectie-absorptie infrarood spectroscopie (FTIRRAS) en on-line elektrochemische massa spectrometrie (OLEMS).
Het hoofdproduct van reducerend strippen van stikstofoxide adlagen op platina in zure oplossing is het ammonium kation, dat grotendeels onafhankelijk van de structuur van het oppervlak en de bedekkingsgraad van het adsorbaat gevormd wordt. De activiteit van platina in de elektrochemische reduktie van geadsorbeerd stikstofoxide (NOads) is gerelateerd aan de coördinatie van NOads. Zoals werd herleid uit experimenten aan Pt(111), Pt(110) en Pt(100) oppervlakken, neemt de reactiviteit van NOads toe in de orde van NOstap>NObrug>NOdrievoudig. Deze reactiviteitsdifferentiatie verklaart de verschijning van meerdere reductie-kenmerken (pieken) in de “stripping voltammetry” van stikstofoxide adlagen (Hoofdstuk 2).
De stroom-tijd curves gemeten voor de reductie van NOads aan Pt(111) en Pt(110) laten bij hoge bedekkingsgraden van NOads significante laterale (repulsive) interacties tussen de reagerende species zien. De tweede-orde reactiekinetiek, waargenomen voor NOads reductie aan Pt(110) bij hoge bedekkingsgraad (ca. 1 ML), geeft de noodzakelijkheid aan van een aangrenzende vrije site, die hoogstwaarschijnlijk nodig is voor het breken van de N−O binding. Drie snelle gecombineerde elektron- en protonoverdrachten (in evenwicht) gaan vooraf aan het breken van de N−O binding op Pt(110). De eerste-orde kinetiek werd herleid uit stroom-tijd curves gemeten voor de reductie van NOads aan Pt(111) en Pt(110) bij alle bedekkingsgraden. Desalniettemin kan de ogenschijnlijke eersteorde kinetiek gerelateerd worden aan een significant lagere maximale bedekkingsgraad van NOads op Pt(111) en Pt(100) (ca. 0.5 ML) vergeleken met die op Pt(110) (ca. 1 ML), en derhalve aan de beschikbaarheid van vrije sites bij alle bedekkingsgraden. Een gedetailleerd mechanisme van de NOads reductie aan Pt(110) werd voorgesteld (Hoofdstuk 3).
De reductie van NOads aan Pt(100) volgt een “EC” mechanisme, waarbij de eerste elektron/proton overdracht in evenwicht is, resulterend in de vorming van een HNOads intermediair, met de tweede chemische reactiestap als snelheidsbepalende stap. Bij deze chemische stap wordt het breken van de N−O binding in het HNOads intermediair verondersteld, wat waarschijnlijk een naburige vrije site nodig heeft. Uit een vergelijking van de NOads reductie aan Pt(100), Pt(111) en Pt(100) kan geconcludeerd worden dat (i) het reactiemechanisme
125

structuurgevoelig is en (ii) dat Pt(100) het meest actieve oppervlak is voor het breken van de N−O binding, wat in overeenstemming is met de onder ultra-hoog vacuum condities waargenomen trend (Hoofdstuk 4).
De reactiviteit van hydroxylamine (HAM) aan platina elektroden wordt bepaald door de interactie van de andere componenten van de oplossing of producten van de HAM oxidatie met het elektrodeoppervlak. Reductie van HAM naar ammoniak is een structuurgevoelige reactie, op zijn minst door de structuurgevoeligheid van de waterstof adsorptie op platina. Voltammetrische data voor Pt(111), Pt(110) en Pt(100) geeft de mogelijkheid weer van gelijktijdige HAM reductie en oxidatie. Dit waarneming werd tentatief uitgelegd door het bestaan van een intermediair, dat zowel in het reductie- als oxidatieproces een rol vervult. Bovendien wordt de reductie van HAM waarschijnlijk geactiveerd door een dehydrogenatiestap. H2NOads en HNOads species werden gesuggereerd als kandidaten. Geadsorbeerd stikstofoxide (NOads) werd aangetoond als het belangrijkste intermediair in de oxidatie van HAM. Omdat NOads elektrochemisch stabiel is over een breed potentiaal gebied, gedraagt het zich als een gif voor de verdere oxidatie van HAM. De HAM oxidatie naar NOads lijkt een structuurongevoelig proces te zijn, ofschoon enigszins beïnvloedbaar door anion adsorptie. De vorming van N2O bij matig oxidatieve potentialen (beneden ca. 0.9 V versus RHE) werd waargenomen tijdens de oxidatie van HAM aan Pt(111) en Pt(110), maar niet aan Pt(100). Mechanismen voor de reductie en oxidatie van HAM worden voorgesteld (Hoofdstuk 5).
De oxidatieve adsorptie van ammoniak aan Pt(100) en Pt(111) in alkalische media resulteert in de vorming van NHx (x=0-2) adsorbaten. Aan Pt(111) vindt de ammoniak oxidatie plaats in het dubbellaag gebied en leidt tot de vorming van NH en, mogelijkerwijs, N adsorbaten. Aan Pt(100) is het NH2 fragment een stabiel intermediair van de ammonia oxidatie. Stabilisatie van NH en NH2 fragmenten op Pt(111) en Pt(100), respectievelijk, is, interessant genoeg, in overeenstemming met recente theoretische berekeningen. Het Pt(111) oppervlak laat een extreem lage activiteit zien voor de ammonia oxidatie naar moleculair stikstof, wat aangeeft dat de (sterk) geadsorbeerde species NH en N beide niet actief zijn in de stikstof vorming. Zowel N2O (lachgas) als stikstofoxide worden niet waargenomen tijdens de ammoniak oxidatie aan Pt(111) bij potentialen tot 0.9 V vs. RHE, zoals herleid uit in situ infrarood metingen. Het Pt(100) oppervlak is zeer actief voor de stikstof productie. Dit proces wordt gekarakteriseerd door een Tafel helling van 30 mV decade-1, wat wordt verklaard door een snelheidsbepalende dimerisatie van NH2 fragmenten, gevolgd door een snel verval van de oppervlaktegebonden hydrazine tot stikstof. Derhalve is de hoge activiteit van het Pt(100) oppervlak voor de ammoniak oxidatie naar stikstof waarschijnlijk gerelateerd aan de mate waarin het oppervlak in staat is om het NH2 adsorbaat te stabiliseren.
126

Rezumat Mecanismul reacţiilor electrocatalitice ale monoxidului de azot,
hidroxilaminei şi amoniacului şi dependenţa lor de structura suprafeţei au fost studiate pe suprafeţe monocristaline principale ale platinei, utilizând metode electrochimice, spectroscopia în infraroşu de reflexie-absorbţie cu trasformata Fourier (FTIRRAS) şi spectrometria de masă electrochimică (OLEMS).
Produsul de bază al stripării reductive a stratului adsorbit de monoxid de azot pe suprafeţe platinice este cationul de amoniu, indiferent de structura suprafeţei si acoperirea adsorbatului. Activitatea electrochimică a platinei în procesul de reducere a monoxidului de azot in starea adsorbită (NOads), este strâns legată de numărul de coordonare al adsorbatului. Experimentele pe suprafeţe principale − Pt(111), Pt(110) si Pt(100) − au demonstrat că reactivitatea speciilor NOads scade cu creşterea numarului de coordonare (NOmonocoord>NObicoord>NOtricoord). Reactivitatea diferită explică apariţia vârfurilor succesive de reducere în voltametria de stripare a monostraturilor de NOads (Capitolul 2).
În cazul reducerii monostratului de NOads cu acoperire mare a suprafeţelor Pt(111) şi Pt(110), răspunsul cronoamperometric indică existenţa interacţiunilor laterale de repulsie între speciile adsorbite. Cinetica de ordinul doi, observată în cazul reducerii monostratului de NOads cu acoperire mare a suprafeţei Pt(110), se explică prin implicarea în scindarea legăturii N−O a unui centru liber de adsorbţie adiacent. Trei etape rapide (de echilibru) de transfer combinat de electron şi proton preced scindarea legăturii N−O pe suprafaţa Pt(110). Cinetica de ordinul unu a fost evidenţiată pentru reducerea monostratului de NOads pe suprafeţe Pt(111) şi Pt(100), indiferent de valoarea acoperirii. Totodată, acoperirea la saturaţie a NOads-ului pe suprafeţe Pt(111) (ca. 0.5 ML) şi Pt(100) (ca. 0.5 ML) este mult mai mică decât pe suprafaţa Pt(110) (ca. 1 ML). În consecinţă, acea poziţie liberă de adsorbţie necesară pentru scindarea legăturii N−O poate fi accesibil pe suprafeţele Pt(111) si Pt(100) la toate valorile acoperirii suprafeţei (Capitolul 3).
Reducerea NOads pe suprafaţa Pt(100) urmează un mecanism de reacţie de tip EC, în care prima etapă este un transfer rapid (la echilibru) de electron şi proton, din care rezultă intermediarul HNOads. Etapa a doua este o etapă chimică, fiind şi etapa determinantă de viteză. Se presupune că această etapă implică scindarea legăturii N−O în intermediarul HNOads şi probabil necesită o poziţie liberă de adsorbţie adiacentă. O comparaţie a reducerii NOads pe suprafeţele Pt(111), Pt(110) şi Pt(100) arată că (i) mecanismul de reacţie depinde de structura suprafeţei şi că (ii) suprafaţa Pt(100) este cea mai activă în scindarea legăturii N−O dintre toate
127

suprafeţele, fapt care este în bun acord cu tendinţa similară observată în studii în vid înalt (Capitolul 5).
Reactivitatea hidroxilaminei pe electrozi de platină este controlată de interacţiuni ale altor componenţi din soluţie sau ale produşilor de oxidare a hidroxilaminei cu suprafaţa electrodului. Reducerea hidroxilaminei la cationul de amoniu este o reacţie dependentă de structura suprafeţei electrodului, cel puţin prin efectul structurii suprafeţei asupra adsorbţiei hidrogenului. Rezultatele voltametriei indică posibilitatea unei desfăşurări simultane a reducerii şi oxidării hidroxilaminei pe cele trei suprafeţe studiate – Pt(111), Pt(110) si Pt(100). Această observaţie poate fi explicată prin existenţa unui intermediar comun, care figurează atât în procesul de oxidare cât şi în cel de reducere. Specii ca H2NOads si HNOads sunt propuse drept candidaţi pentru acel rol de intermediar comun. Monoxidul de azot în stare adsorbită este intermediarul stabil cheie în oxidarea hidroxilaminei pe suprafeţe platinice. NOads este electrochimic stabil într-un domeniu larg de potenţiale şi, în consecinţă, acţionează drept otravă pentru catalizator. Procesul de oxidare a hidroxilaminei la NOads nu este afectat de structura suprafeţei, însă este afectat de adsorbţia de anioni. Oxidarea hidroxilaminei pe suprafeţele Pt(111) şi Pt(110), însa nu şi pe Pt(100), este însoţită de formarea protoxidului de azot (N2O) la potenţiale moderate de oxidare (mai negativ de 0.9 V). În final, sunt propuse mecanismele reacţiilor de oxidare şi reducere a hidroxilaminei (Capitolul 5).
Prin oxidarea electrocatalitică a amoniacului pe suprafeţele Pt(100) şi Pt(111) în mediu alcalin rezultă speciile adsorbite de tip NHx (x=0-2). Oxidarea amoniacului pe suprafaţa Pt(111) are loc la potenţiale corespunzătoare încărcării stratului dublu electric şi este soldată cu formarea speciilor adsorbite NH şi, posibil, N. Pe suprafaţa Pt(100) adsorbatul NH2 este intermediarul stabil. Este interesant de menţionat că stabilizarea adsorbatului NH pe suprafaţa Pt(111) şi adsorbatului NH2 pe suprfaţa Pt(100) este în acord cu prezicerile teoretice recente. Suprafaţa Pt(111) este practic inactivă pentru oxidarea amoniacului la azot molecular. Astfel, atât adsorbatul NH cât şi adsorbatul N sunt inactivi în formarea azotului molecular. Măsuratori in situ de spectroscopie în infraroşu au permis excluderea atât a monoxidului de azot căt şi a protoxidului de azot din produşii de oxidare a amoniacului pe suprafaţa Pt(111). Suprafaţa Pt(100) este exceptional de activă în oxidarea amoniacului la azot molecular. Acest proces este caracterizat prin panta Tafel de 30 mV, care poate fi explicată prin desfăşurarea unui proces al carui viteză este limitată de dimerizarea speciilor NH2 pe suprfaţa electrodului şi ulterioara descompunere a hidrazinei formate în azot molecular. În concluzie, activitatea de excepţie a suprafeţei Pt(100) în oxidarea electrocatalitică a amoniacului la azot molecular se poate atribui capacităţii sale de a stabiliza adsorbatul NH2 (Capitolul 6).
128

Резюме Механизм электрохимических превращений монооксида азота,
гидроксиламина и аммиака на монокристаллах платины, а также влияние структуры поверхности электрода, были исследованы с помощью электрохимических методов, in situ инфракрасной спектроскопии и электро-химической масс-спектрометрии.
Основным продуктом элетрохимического восстановления адсорбированного слоя ΝΟ (ΝΟадс) на платине в кислой среде является катион аммония вне зависимости от структуры и степени заполнения поверхности. Активность платины в восстановлении ΝΟадс напрямую зависит от координационной насыщености адсорбата. На основании экспери-ментальных данных полученных для монокристаллов Pt(111), Pt(110) и Pt(100) было установлено, что перенапряжение восстановления ΝΟадс увеличивается в следующем порядке: ΝΟмонокоорд<NOбикоорд<NOтрикоорд. Это различие в реакционной способности адсорбированных молекул ΝΟ объясняет появление пиков восстановления на соответствующих вольт-амперных кривых (Глава 2).
По данным хроноамперометрии, электрохимическое восстановление ΝΟадс при высоком или максимальном поверхностном заполнении (до 1 ML) на кристалле Pt(110) характеризуется кинетикой второго порядка по ΝΟадс и значительным отталкивающим взаимодействием между частицами адсорбата. Кинетика второго порядка объяснена участием дополнительного адсорбционного места, по всей вероятности, в разрыве связи Ν−Ο. Показано, что реакция включает три последовательные равновесные стадии переноса электрона (и протона) и последующую медленную стадию разрыва связи Ν−Ο. Восстановление ΝΟадс на монокристаллах Pt(111) и Pt(100) характе-ризуется кинетикой первого порядка по ΝΟадс, независимо от степени заполнения поверхности. Кинетика первого порядка объяснена значительно более низкими значениями максимального поверхностного заполнения ΝΟадс на Pt(111) (около 0.5 ML) и Pt(100) (около 0.5 ML), чем на Pt(110) (до 1 ML) и, соответственно, достаточным количеством дополнительных адсорбци-онных мест при любых степенях заполнения. Предложен детальный механизм электрохимического восстановления ΝΟадс на монокристалле Pt(110) (Глава 3).
Электрохимическое восстановление ΝΟадс на монокристалле Pt(100) включает равновесный перенос электрона (и протона) и последующую
129

медленную химическую стадию. Предположительно, эта химическая стадия включает разрыв связи Ν−Ο в адсорбированном интермедиате HNO (или NOH) и предусматривает участие дополнительного адсорбционного места. Сравнение механизмов восстановления ΝΟадс на монокристаллах Pt(111), Pt(110) и Pt(100) позволило установить, что механизм реакции зависит от структуры поверхности. Кроме того, установлено, что плоскость (100) является наиболее активной в разрыве связи Ν−Ο, что хорошо согласуется с данными, полученными при изучении восстановления ΝΟадс в высоком вакууме (Глава 4).
Электрохимические превращения гидроксиламина на платиновых электродах в значительной степени контролируются взаимодействием компонентов раствора или продуктов окисления гидроксиламина с поверхностью электрода. Восстановление гидроксиламина до аммиака является структурно-чувствительной реакцией, по крайней мере опосредовано, из-за структурно-чувствительной адсорбции водорода. На основе данных вольтамперометрии, полученных на монокристаллах Pt(111), Pt(110) и Pt(100), было установлено, что электрохимическое окисление и восстановление гидроксиламина могут протекать одновременно. Это наблюдение указывает на возможность существования интермедиата, общего для реакций окисления и восстановления. Адсорбированные частицы H2NO и HNO предложенны в качестве кандидатов. Частичная дегидрогенизация гидроксиламина вероятно необходима для инициации его полного восстановления. Адсорбированный ΝΟ является ключевым стабильным интермедиатом окисления гидроксиламина на платине. Поскольку адсорбированные слои ΝΟ проявляют электрохимическую стабильность в широкой области потенциалов, ΝΟадс представляет собой каталитический яд для последующего окисления гидроксиламина. Установлено, что окисление гидроксиламина до ΝΟадс не является структурно-чувствительным процессом, хотя специфическая адсорбция анионов оказывает влияние на адсорбцию NO. Образование закиси азота (Ν2Ο) наблюдается на монокристаллах Pt(111) и Pt(110), но не на монокристалле Pt(100). Предложен детальный механизм электрохимического окисления и восстановления гидроксиламина на платине (Глава 5).
Электрохимическое окисление аммиака в щелочной среде на монокристаллах Pt(111) и Pt(100) приводит вначале к образованию адсорбатов с общей формулой NHх (х=1-2). Установлено, что на Pt(111) анодная адсорбция аммиака происходит в области потенциалов соответствующих заряжению двойного электрического слоя, и приводит к образованию адсорбированной частицы NH и, возможно, N. В случае
130
окисления аммиака на монокристалле Pt(100), адсорбированный NH2 является стабильным интермедиатом. Стабилизация адсорбированного фрагмента NH на Pt(111) и NH2 на Pt(100) согласуется с недавно опубли-кованными теоретическими данными. Монокристалл Pt(111) проявляет крайне низкую активность в окислении аммиака до молекулярного азота, что указывает на низкую реакционную способность NHадс и Nадс. По данным in situ ИК-спектроскопии установлено, что Ν2Ο и ΝΟ не являются продуктами окисления аммиака на Pt(111) в области умеренных перенапряжений окисления (до 900 мВ). Монокристалл Pt(100) чрезвычайно активен в реакции окисления аммиака до молекулярного азота. Тафелевский наклон составляет 30 мВ, что вероятно объясняется наличием медленной стадии димеризации адсорбированного NH2 и последующим быстрым распадом образовавшегося димера до молекулярного азота. В соответствии с предложенным механизмом, высокая активность монокристалла Pt(100) в образовании молекулярного азота объясняется способностью этой плоскости к стабилизации адсорбированного NH2 (Глава 6).
131
List of Publications
Rosca, V.; Koper, M.T.M. Mechanism of electrocatalytic reduction of nitric oxide on Pt(100) surface. J. Phys. Chem. B 2005, 109, 16750.
Rosca, V.; Koper, M.T.M. Rate laws for reductive stripping of NO adlayers at single-crystal platinum electrodes as deduced from transient experiments. Surf. Sci. 2005, 584, 258.
Rosca, V.; Beltramo, G.L.; Koper, M.T.M. Reduction of NO adlayers on Pt(110) and Pt(111) in acidic media: evidence for adsorption site - specific reduction. Langmuir 2005, 21, 1448.
Rosca, V.; Beltramo, G.L.; Koper, M.T.M. Hydroxylamine electrochemistry at low-index single-crystal platinum electrodes in acidic media. J. Phys. Chem. B 2004, 108, 8294.
Rosca, V.; Beltramo, G.L.; Koper, M.T.M. Hydroxylamine electrochemistry at polycrystalline platinum in acidic media: a voltammetric, DEMS and FTIR study. J. Electroanal. Chem. 2004, 566, 53.
Rosca, V.; Koper, M. T. M. Electrocatalytic oxidation of ammonia on Pt(111) and Pt(100) surfaces., manuscript in preparation.
Dima, G.E.; Rosca, V.; Koper, M.T.M. Role of promoters in electrocatalysis. Nitrate reduction at Pt/Ge electrode in acidic media. J. Electroanal. Chem., in press.
Wonders, A.H.; Housmans, T.H.M.; Rosca, V.; Koper, M.T.M. On-line mass spectrometry system for measurements at single-crystal electrodes in hanging meniscus configuration. J. Appl. Electrochem., in press.
Rosca, V.; Popescu, I.C. Kinetic analysis of horseradish peroxidase 'wiring' in polyelectrolyte-peroxidase multilayer assemblies. Electrochem. Comm. 2002, 4, 904.
Rosca, V.; Muresan, L.; Popescu, I.C.; Cristea, C.; Silberg, I.A. Gold electrodes modified with 16H-dibenzo[c,l]-7,9-dithia-16,18-diazapentacene for electrocatalytic oxidation of NADH. Electrochem. Comm. 2001, 3, 439.
132

Acknowledgements I am grateful to my supervisors, Prof. Rutger A. van Santen and Prof. Marc
T.M. Koper, for giving me a unique opportunity to study and work in Eindhoven. I would like to thank Marc, my daily supervisor, for guidance, so many helpful discussions, and, importantly, criticism.
A significant part of the work presented in this thesis was done in collaboration with Dr. Guillermo L. Beltramo. Guillermo, thank you for many interesting discussions we had (and are still having) and for a very helpful introduction into the practice of in-situ spectroscopy of electrode surfaces. My special thanks to Natalia (Dr. N.P. Lebedeva) and to Guillermo for giving me the invaluable lessons in (meta)physics and (al)chemistry of single-crystal electrodes.
Several members of the technical staff supported my work. I thank Ad Wonders for making possible the mass spectrometry measurements; Jos van Wolput for assistance in my first in situ infrared measurements; both Ad Wonders and Martin Otten for help in dealing with everyday laboratory issues. I would like to acknowledge the professionalism and cooperation of the glassblower team (Frans Kuijpers et al.) and the precise instrumentation team (Jos de Laat et al.), who dealt so well with the versatility and obscurity of my orders.
I thank members of the doctorate committee for their comments and suggestions, which were helpful in improving the text of this thesis.
My complements to the members of the scientific as well as of the supporting staff of SKA for creating such a stimulating and friendly working environment. I thank all the former and current members of the department for their help, occasional corridor chat or for a friendly greeting. My special thanks to all the former and current members of the electrocatalysis group, my brothers in arms, so to say, for keeping me company at work and at leisure. Ad, Afifa, Alexander, Gabi, Guillermo, Martin, Natalia, Peter, Tom, Tanya, Thijs, I am glad we met and had such a great time together. Andrey and Evgeny, thanks for many chats and laughs we had; that was fun indeed.
I want to take this opportunity and thank Dr. Pushnyak A.N., supervisor of my diploma project, for helping me in getting to my first “Eureka!”-experiences. I thank Prof. Ionel C. Popescu and Dr. Adrian Nicoara (both of University of Cluj-Napoca, Romania) for teaching me electrochemistry.
Carina, Gabi, Guillermo, Ionel, Natalia, Sorinela, Tony and Mihaela, my friends, this four-year “quest” could be much more troublous and much less fun without you around.
Katia, I could not go so far without you by my side. Thank you for your support and understanding. I dedicate this work to you and Alex.
133

Curriculum Vitæ Victor Rosca was born on the 21st of July 1976 in Chisinau, Republic of
Moldova (Soviet Union, at that time). He studied chemistry and chemical technology at the State University of Moldova and received his degree in 1998. The diploma work concerned adsorption on natural and synthetic adsorbents. Same year, he was appointed as research assistant at the Department of Physical Chemistry, University of Cluj-Napoca, Romania, where he worked in the field of electroanalytical chemistry. In February 2002 he joined the electrocatalysis group, Laboratory of Inorganic Chemistry and Catalysis, Eindhoven University of Technology, The Netherlands, as research assistant and worked on the mechanistic aspects of the electrocatalytic reactions of inorganic nitrogen compounds on single-crystal platinum surfaces. The most important results of this research are described in the present thesis.
134