mechanisms of ischemic brain damage in hyperglycemic strokes
TRANSCRIPT
From the Institute of Experimental and Clinical
Pharmacology and Toxicology
of the University of Lübeck
Director: Prof. Dr. Markus Schwaninger
Mechanisms of ischemic brain damage in hyperglycemic strokes
Dissertation
in Fulfillment of Requirements
for the Doctoral Degree
- Dr. rer. nat.-
of the University of Lübeck
Submitted by
Mahtab Ahmad Khan
from Multan, Pakistan
Lübeck, 2015
First referee: Prof. Dr. Markus Schwaninger
Second referee: Prof. Dr. Tamás Laskay
Chairman: Prof. Dr. Wolfgang Jelkmann
Date of oral examination: 20/08/2015
Approved for printing: 24/08/2015

I
ACKNOWLEDGEMENT
I would like to acknowledge all the people who have supported me during these years of work.
Unfortunately, I cannot mention all of them; nevertheless, I assure them all of my sincerest
thanks.
First of all, I would like to express my immense gratitude to my supervisor
Prof. Markus Schwaninger, for providing me the opportunity to work in his group and for
guiding me through these years. His constructive criticism, great support and optimism towards
my work have motivated me at every stage of this thesis.
I am very grateful to Dr. Mahbubur Rahaman for all the great support in teaching me the MCAO
technique. I would like to thank my post-doc colleagues, Dr. Jan Wenzel and Dr. Helge Müller-
Fielitz for teaching me all I had to know about fluorescence and confocal microscopy,
Dr. Jochen Ohnmacht and Dr. Godwin Dogbevia for their help in understanding the imaging
software. I would also like to thank Dr. Dirk A Ridder for his advice in statistics and his ever
supportive attitude. I would like to thank Mr. Dr. Walter Häuser for providing his expertise and
support in maintaining the mouse lines for the whole experiments. I would like to thank
Dr. Thomas Flemming from the University of Heidelberg for kindly providing the RAGE-/-
mice.
I am grateful to all the members from our animal core facility that contributed in any way to my
work and supported me during these years. I would like to thank Mr. Sajad Ahmad for his
guideline in MS office. I appreciate the efforts of Mr. Julian Assmann for translating the
summary of my project. I am grateful to Ms. Sina Schultz for her extensive contribution to the
study.
II
I am thankful to Higher Education Commission (HEC) Pakistan for granting me a scholarship to
pursue my PhD and Deutscher Akademischer Austausch Dienst (DAAD) for their wonderful
coordination in Germany.
I am really thankful to my family and my parents for being there for me in every conceivable
way and a special thanks to my father, for his encouragement and support.
Mahtab Ahmad Khan

III
ZUSAMMENFASSUNG
Es ist bekannt, dass eine Hyperglykämie die Folgen eines Schlaganfalles verschlimmert. Eine
Hyperglykämie ist beim akuten Schlaganfall sehr häufig, unabhängig von einer vorbestehenden
Diabeteserkrankung.
In dieser Arbeit wurden die möglichen Mechanismen untersucht, die zu einem schwereren
Verlauf von Schlaganfällen unter hyperglykämischen Bedingungen führen.
Dazu wurde bei Mäusen die A. cerebri media verschlossen (middle cerebral artery occlusion,
MCAO), um einen Schlaganfall herbeizuführen. Die Glukosekonzentration im Blut wurde durch
intraperitoneale Glukoseinjektionen erhöht. Anschließend wurde das Infarktvolumen ermittelt.
Mittels Durchflusszytometrie wurden die inflammatorischen Zellpopulationen in Gehirn und
Blut bestimmt. Zusätzlich wurden die in vivo Daten mit Immunfluoreszenzfärbungen und
Konfokalmikroskopie bestätigt.
Durch die Verwendung von chimären Mäusen konnten wir zeigen, dass aus dem Knochenmark
stammende Monozyten /Makrophagen schon 24 Stunden nach dem Schlaganfall in das Gehirn
einwandern und sich deren Zahl nach 48 Stunden weiter erhöht hat. Außerdem haben wir
beobachtet, dass Nikotinsäure und ß-Hydroxybutyrat (BHB) ihren neuroprotektiven Effekt über
den Hydroxycarboxylsäurerezeptor 2 (hydroxy-carboxylic acid receptor 2, HCA2 / GPR109a)
vermitteln. Dieser Rezeptor befindet sich auf den alternativ aktivierten Monozyten /
Makrophagen, den sogenannten M2-Makrophagen.
Das Infarktvolumen unter hyperglykämischen Bedingungen war 48 Stunden nach MCAO
signifikant erhöht. Mittels Durchflusszytometrie konnte gezeigt werden, dass M2-Makrophagen
(CD45Hi
CD11b+ Ly6-G
- Ly6-C
Lo), die einen protektiven Effekt vermitteln, unter diesen
IV
Bedingungen erniedrigt sind. Für eine nähere Untersuchung der Rolle dieser Zellen haben wir
von Monozyten abstammende Zellen in CD11b-DTR Mäusen deletiert. Um den Erfolg dieser
Methode zu zeigen, wurde mit Hilfe von Durchflusszytometrie das Blut von Wildtyp- und
CD11b-DTR Mäusen analysiert. Die Auswertung zeigte, dass der Anteil an CD11b+ Zellen um
80-85% reduziert war, ohne die Anzahl an neutrophilen Granulozyten zu beeinflussen.
Nach Deletion der von Monozyten abstammenden Zellen war Infarkt unter hyperglykämischen
Bedingungen nicht vergrößert , während dies für Wildtyp-Mäuse der Fall war.
Die Bildung von “advanced glycation end products” (AGEs) und ihre Interaktion mit dem
Rezeptor für AGEs (RAGE) vermitteln den schädlichen Effekt von hyperglykämischen
Schlaganfällen. Für die Analyse des RAGE-assoziierten Gehirnschadens wurde eine MCAO in
RAGE-/-
Mäusen durchgeführt. Im Vergleich zu hyperglykämischen Kontrollen wiesen Mäuse,
die defizient für RAGE waren, ein signifikant verringertes Infarktvolumen auf.
Arginase I (ArgI) ist ein spezifischer Marker für M2-Makrophagen. Die Quantifizierung der
ArgI-exprimierenden Makrophagen mittels Immunfluoreszenzfärbung und Konfokalmikroskopie
ergab eine Reduktion unter hyperglykämischen Bedingungen.
Die oben aufgeführten Daten zeigen, dass eine Reduktion der protektiven Makrophagen im
Gehirn unter hyperglykämischen Bedingungen zu einem vergrößerten Infarktvolumen führt.

V
SUMMARY
It is well established that hyperglycemia aggravates stroke outcome. Hyperglycemic conditions
are likely to be present in stroke patients regardless of pre-existing diabetes.
In this study, I have investigated the possible mechanisms involved in worsening of stroke
outcomes under hyperglycemic conditions. I occluded the middle cerebral artery (MCA) to
produce stroke in mice. To elevate the glucose concentration in blood, I have injected glucose
intraperitoneally. Then, the infarct volume was measured. I used flow cytometry to identify the
inflammatory cell population in brain and blood. Finally, immune fluorescence and confocal
microscopy have been utilized to confirm the in vivo data.
By using chimeric mice strong evidence was obtained that bone marrow-derived monocytes and
/ or macrophages migrate to the brain after stroke as earlier as 24 hours and their number
increased after 48 hours. In previous experiments we had observed that nicotinic acid and ß-
hydroxyl butyrate (BHB) mediate their neuroprotective action through hydroxy-carboxylic acid
receptor 2 (HCA2, GPR109A). This receptor is located on the alternatively activated monocytes
and/or macrophages. These cells are also called M2 macrophages.
The infarct volume is significantly increased under hyperglycemic conditions after 48 hours of
MCAO. Using flow cytometry, I confirmed that M2 macrophages (CD45Hi
CD11b+ Ly6-G
- Ly6-
CLo
), that are protective in action, are decreased under hyperglycemic conditions. To investigate
their role further, I ablated monocyte-derived cells in CD11b-DTR mice. To confirm the
ablation, I performed flow cytometry of blood cells after diphtheria toxin treatment in wild-type
and CD11b-DTR mice. These experiments showed that 80-85% of CD11b+ cells were depleted
in CD11b-DTR mice without affecting neutrophils. The infarct volume in CD11b-DTR mice did
not differ under normoglycemic and hyperglycemic conditions while the infarct volume
VI
remained higher in wild-type hyperglycemic mice. Advanced glycation end products (AGEs)
formation and their interaction with the receptor for AGEs (RAGE), mediate the deleterious
effect of hyperglycemic stroke. To investigate the role of RAGE associated brain damage, I
performed MCAO in RAGE-/-
mice. Mice lacking RAGE showed significantly reduced infarct
volumes as compared to hyperglycemic controls. Arginase I (ArgI) is a specific marker for M2
macrophages. Using immunofluorescence and confocal microscopy the number of ArgI
expressing macrophages were decreased under hyperglycemic condition.
In view of above experiments, it is concluded that a reduced number of protective macrophages
leads to larger infarct volumes under hyperglycemic conditions.
VII
Affectionately dedicated to my respected
teachers and my beloved parents

VIII
CONTENTS
ACKNOWLEDGEMENT ................................................................................................. i
ZUSAMMENFASSUNG ................................................................................................. iii
SUMMARY ........................................................................................................................v
LIST OF FIGURES ........................................................................................................ xii
ABBREVIATIONS ........................................................................................................ xiii
1. INTRODUCTION ......................................................................................................1
1.1. Stroke ....................................................................................................................1
1.2. Animal stroke models............................................................................................3
1.3. Hyperglycemia worsens the stroke outcome .........................................................5
1.4. Glucose metabolism and advanced glycation end (AGE) products ......................6
1.5. Immune response after stroke and macrophage polarization ................................9
1.6. Aims and objectives ............................................................................................12
2. MATERIALS AND METHODS .............................................................................13
2.1. Materials ..............................................................................................................13
2.1.1. Chemicals and commercial kits ...................................................................13
2.1.2. List of antibodies..........................................................................................15
2.1.3. Equipment and instruments..........................................................................16
2.1.4. Computer hardware and software ................................................................17
2.2. Methods for animal experiments .........................................................................18
2.2.1. Experimental animals...................................................................................18
2.2.2. Preparation for surgery ................................................................................19
2.2.3. Preparation of 4% paraformaldehyde (PFA) ...............................................19
2.2.4. Preparation of diphtheria toxin (DT) ...........................................................19
2.2.5. Bone marrow transplantation .......................................................................20
IX
2.2.6. Blood glucose measurement ........................................................................21
2.2.7. Middle cerebral artery occlusion (MCAO) surgery .....................................22
2.2.8. Perfusion and removal of the intact brain ....................................................24
2.2.9. Cryosectioning .............................................................................................24
2.2.10. Silver staining ..............................................................................................25
2.2.10.1. Impregnation solution ...........................................................................25
2.2.10.2. Developer solution ................................................................................25
2.2.11. Scanning .......................................................................................................25
2.2.12. Method for the infarct size measurement.....................................................26
2.3. Methods for flow cytometry experiments ...........................................................27
2.3.1. Preparation of fluorescence activated cell sorting (FACS) solutions ..........27
2.3.2. FACS buffer .................................................................................................27
2.3.3. Digestion buffer ...........................................................................................27
2.3.4. Erythrolysis buffer .......................................................................................27
2.3.5. Phosphate buffered saline (PBS) 10x (1 L) .................................................27
2.3.6. Preparation of Percol (90%).........................................................................28
2.3.7. Preparation of Percol-A (78%) ....................................................................28
2.3.8. Preparation of Percol-B (30%).....................................................................28
2.4. Procedures ...........................................................................................................29
2.4.1. Brain cell preparation ...................................................................................29
2.4.1.1. Perfusion and collection of brain ..........................................................29
2.4.1.2. Preparation of cells ...............................................................................30
2.4.1.3. Staining protocol...................................................................................31
2.4.2. Blood ............................................................................................................31
2.5. Immune fluorescence microscopy .......................................................................32
2.5.1. Preparation of solutions ...............................................................................32
X
2.5.1.1. Preparation of 30% sucrose ..................................................................32
2.5.1.2. Preparation of the citrate buffer ............................................................32
2.5.1.3. Preparation of 0.05% Tween-20 ...........................................................32
2.5.1.4. Preparation of 5% and 10% BSA .........................................................32
2.5.1.5. Preparation of Mowiol ..........................................................................32
2.6. Perfusion..............................................................................................................33
2.7. Staining................................................................................................................33
2.8. Statistical analysis ...............................................................................................34
3. EXPERIMENTS AND RESULTS ..........................................................................35
3.1. Sample size calculations......................................................................................35
3.2. Establishment of a mouse model of hyperglycemic stroke .................................37
3.3. BM-derived HCA2-positive cells are M2 polarized macrophages ......................40
3.4. Hyperglycemia downregulates M2 monocytes/macrophages .............................45
3.5. Reduced number of arginase I (Arg I) expressing M2 macrophages ..................49
3.6. Identifying the role of monocytes/macrophages in hyperglycemic stroke .........52
3.7. Measurement of infarct volume in CD11b-DTR ................................................55
3.8. Measurement of infarct volume in RAGE-/-
........................................................57
4. DISCUSSION ............................................................................................................59
4.1. Rodent stroke models ..........................................................................................59
4.2. Hyperglycemic stroke .........................................................................................60
4.3. Role of infiltrating immune cells after cerebral ischemia ...................................62
4.4. Hyperglycemia downregulates M2 macrophages ...............................................63
4.5. Hyperglycemia reduces arginase I expressing M2-macrophages .......................63
4.6. Role of monocytes/macrophages in hyperglycemic stroke .................................65
4.7. RAGE mediates the ischemic brain damage .......................................................66
5. CONCLUSION .........................................................................................................67

XI
6. FUTURE PERSPECTIVE .......................................................................................68
7. REFERENCES .........................................................................................................69
XII
LIST OF FIGURES
Figure 1 Schematic diagram of ischemic stroke. .................................................................... 2
Figure 2 Methodology based classification of the ischemic stroke. ....................................... 4
Figure 3 Mechanism of hyperglycemia in ischemic stroke patients ....................................... 5
Figure 4 Formation of AGE .................................................................................................... 7
Figure 5 Macrophage populations ......................................................................................... 11
Figure 6 Experiment protocol................................................................................................ 21
Figure 7 Steps of MCAO surgery.......................................................................................... 23
Figure 8 Hyperglycemia increases infarct volume. .............................................................. 38
Figure 9 Flow cytometric characterization of HCA2-expressing cells in brain .................... 41
Figure 10 Flow cytometric characterization of HCA2-expressing cells in blood .................... 43
Figure 11 Hyperglycemia downregulates M2 macrophages. .................................................. 46
Figure 12 Quantification of flow cytometric results. .............................................................. 48
Figure 13 Hyperglycemia reduced arginase I positive M2 macrophages. .............................. 50
Figure 14 Diphtheria toxin administration to wild-type controls and CD11b-DTR mice. ..... 53
Figure 15 Infarct volume measurements in CD11b-DTR and WT mice. ............................... 56
Figure 16 RAGE -/-
mice have reduced infarcts compared to wild-type mice during
hyperglycemia. .............................................................................................................................. 58
XIII
ABBREVIATIONS
AGE Advanced glycation end products
ANOVA Analysis of variance
Arg I Arginase I
ATP Adenosine tri-phosphate
BAC Bacterial artificial chromosome
BHB Beta hydroxyl butyrate
BM Bone marrow
BSA Bovine serum albumin
CCA Common carotid artery
CD11b Cluster of differentiation molecule 11B
DABCO 1, 4-diazobicyclo [2.2. 2] octane
dpi Dots per inches
DT Diphtheria toxin
FACS Fluorescence activated cell sorting
GPCR G-protein coupled receptor
HCA2 Hydroxy carboxylic acid receptor 2
HG Hyperglycemic

XIV
ICA Internal carotid artery
ip Intraperitoneal
Ly-6C Lymphocyte antigen 6 complex
MCAO Middle cerebral artery occlusion
MG Methylglyoxal
NG Normoglycemic
RAGE Receptor for advanced glycation end products
Rcf Relative centrifugal force
TBE Tribomoethanol
TIF Tagged image file
WHO World health organization
WT Wild-type
Introduction
1 1. INTRODUCTION
The world health organization (WHO) fact sheet had reported that 15 million people suffer from
stroke every year. Out of those 5 million people had died and another 5 million people were
permanently disabled (Anonymous 2008). A large number of other clinical data also reported the
association of hyperglycemia with poor stroke outcome (Moulin, Tatu et al. 1997; Weir, Murray
et al. 1997). Therefore, hyperglycemia (plasma glucose concentration > 8 mmol/l) is regarded as
an independent risk factor in worsening of stroke (Counsell, McDowall et al. 1997).
1.1. Stroke
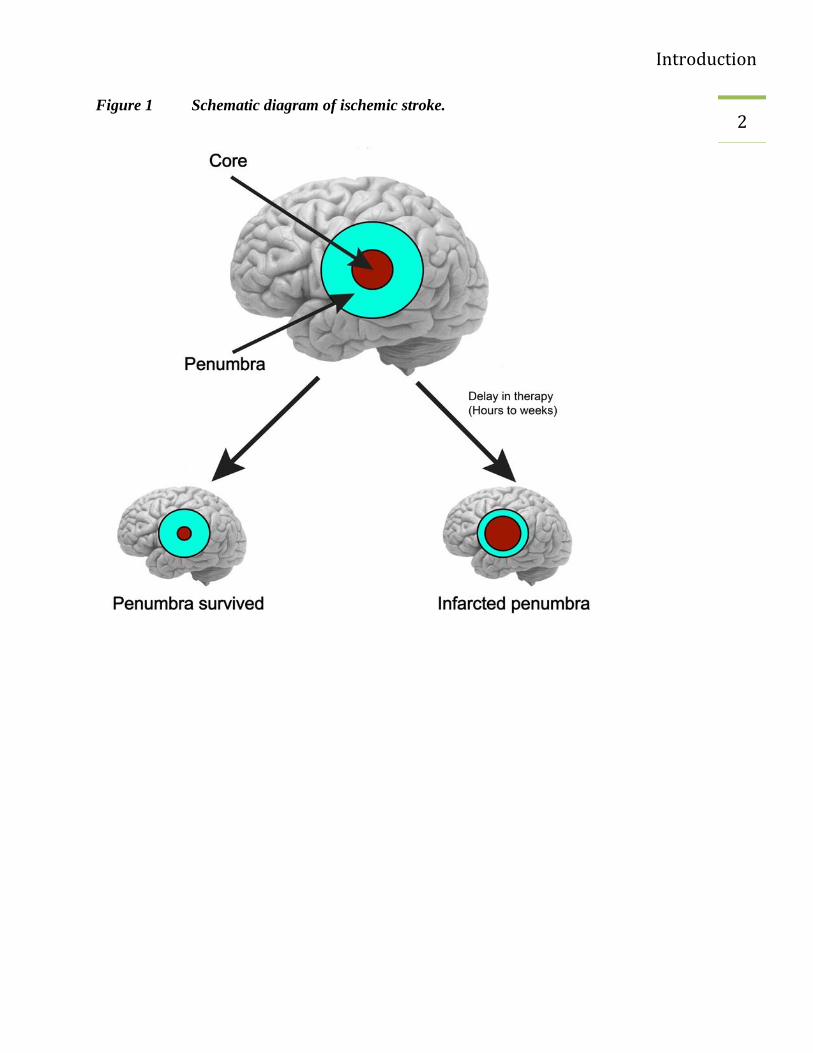
Stroke is caused by reduced blood flow by successful restoration of the blood supply the
ischemic region can be protected against permanent damage. Experimental data have shown that
parts of the ischemic zone can be saved. This area is called penumbra. In the penumbra, the
blood flow is indeed so low that the function cannot be maintained but still the blood flow is
sufficient to ensure the structural metabolism of the tissue. Under favorable conditions, the
penumbra can survive but under unfavorable conditions it is also infarcted (Figure 1). Hours
after the event different pathological mechanisms endanger the survival of the penumbra
(Dirnagl, Iadecola et al. 1999).
Introduction
2 Figure 1 Schematic diagram of ischemic stroke.
Introduction
3 1.2. Animal stroke models
Different animal species have been used in stroke study and this has enhanced the understanding
of stroke pathophysiology. Mice and rats are widely used animals in stroke studies (Casals, Pieri
et al. 2011). The selection of a suitable animal model is very important while interpreting the
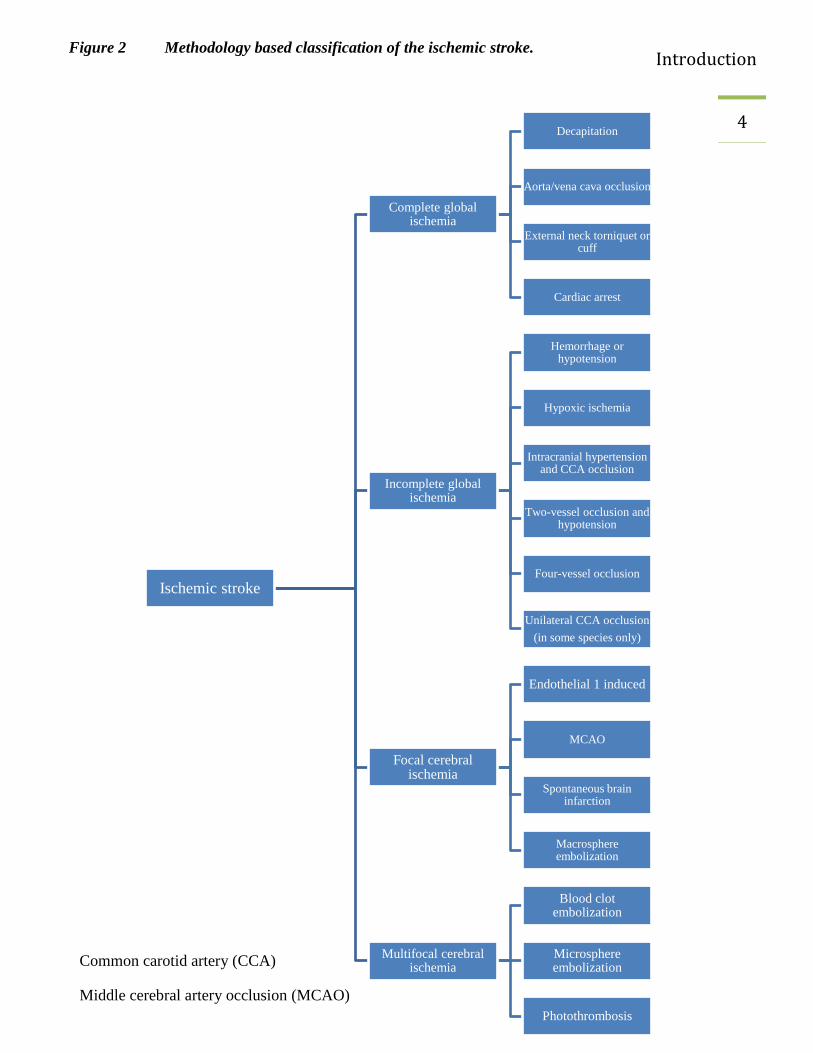
results and inferences. Numerous techniques have been used to induce an ischemic stroke; for
example complete and incomplete ischemia, focal and multifocal cerebral ischemia (Watson,
Dietrich et al. 1985; Dietrich, Ginsberg et al. 1986; Ahmad, Saleem et al. 2010; Mecca,
Regenhardt et al. 2011; Beretta, Riva et al. 2013; Speetzen, Endres et al. 2013; Shmonin,
Melnikova et al. 2014). Among these stroke models, transient and permanent vessel occlusion
are two commonly employed types of focal cerebral ischemia. In the transient stroke model, a
silicon-coated filament is inserted in an internal carotid artery (ICA) through the common carotid
artery (Ahmad, Saleem et al. 2006). The duration of the filament placement (occlusion) inside
the ICA and its removal (reperfusion) differ in different studies. In the permanent stroke model,
which is more reproducible and reliable, the middle cerebral artery (MCA) is blocked
permanently (occlusion) either by ligation (Davis, Lay et al. 2013) or by electrical coagulation
(Rahman, Muhammad et al. 2014).
In this study, we used a permanent stroke model in mice, which involves craniotomy and
occlusion of the distal MCA.
Introduction
4
Ischemic stroke
Complete global ischemia
Decapitation
Aorta/vena cava occlusion
External neck torniquet or cuff
Cardiac arrest
Incomplete global ischemia
Hemorrhage or hypotension
Hypoxic ischemia
Intracranial hypertension and CCA occlusion
Two-vessel occlusion and hypotension
Four-vessel occlusion
Unilateral CCA occlusion
(in some species only)
Focal cerebral ischemia
Endothelial 1 induced
MCAO
Spontaneous brain infarction
Macrosphere embolization
Multifocal cerebral ischemia
Blood clot embolization
Microsphere embolization
Photothrombosis
Figure 2 Methodology based classification of the ischemic stroke.
Common carotid artery (CCA)
Middle cerebral artery occlusion (MCAO)
Introduction
5 1.3. Hyperglycemia worsens the stroke outcome
Hyperglycemia is likely to be present in stroke patients with or without preexisting diabetes,
especially in patients not older than 65 years of age (Allport, Butcher et al. 2004; Kissela,
Khoury et al. 2005; Kruyt, Biessels et al. 2010). It has also been reported that hyperglycemia
increases the risk of stroke by about 1.7- to 2.1-times (Spencer, Pirie et al. 2008). Hyperglycemia
has also been found to be involved in increasing the infarct size and mortality in animal stroke
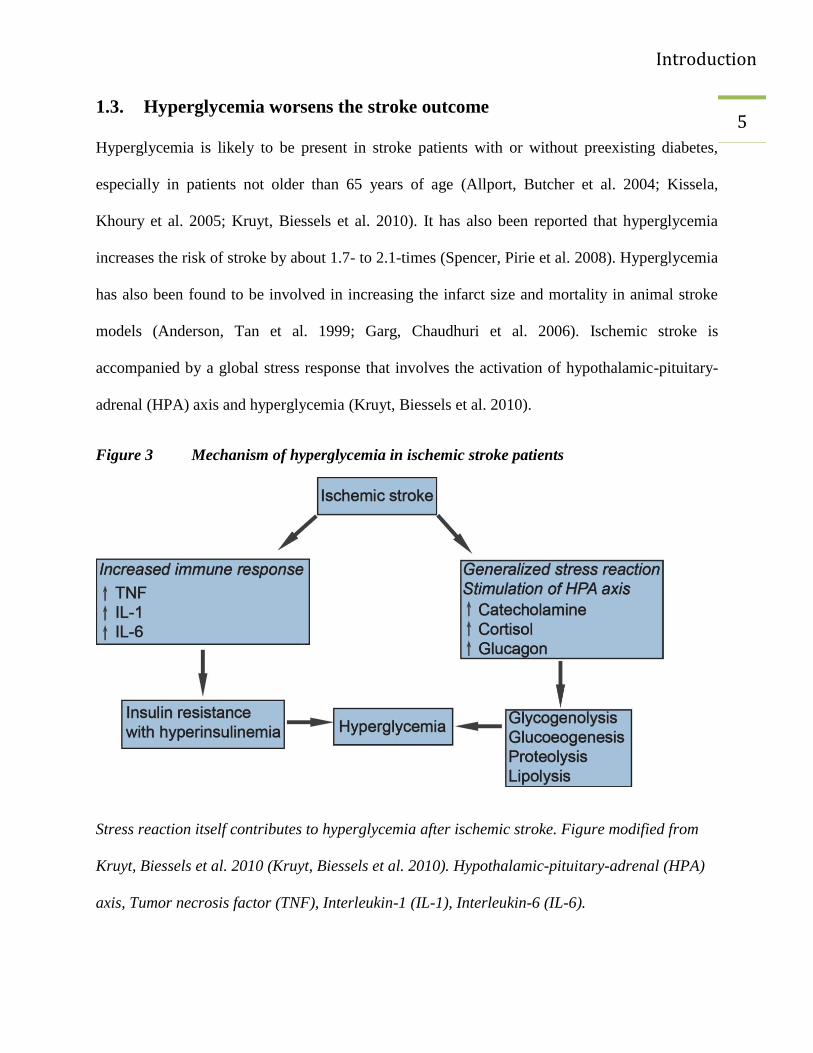
models (Anderson, Tan et al. 1999; Garg, Chaudhuri et al. 2006). Ischemic stroke is
accompanied by a global stress response that involves the activation of hypothalamic-pituitary-
adrenal (HPA) axis and hyperglycemia (Kruyt, Biessels et al. 2010).
Figure 3 Mechanism of hyperglycemia in ischemic stroke patients
Stress reaction itself contributes to hyperglycemia after ischemic stroke. Figure modified from
Kruyt, Biessels et al. 2010 (Kruyt, Biessels et al. 2010). Hypothalamic-pituitary-adrenal (HPA)
axis, Tumor necrosis factor (TNF), Interleukin-1 (IL-1), Interleukin-6 (IL-6).
Introduction
6 1.4. Glucose metabolism and advanced glycation end (AGE) products
Glucose is a substantial source of nutrient for brain except during prolonged starvation.
Glycolysis is the major pathway of glucose metabolism and it occurs in the cytosol of all cells.
This process can occur either aerobically or anaerobically (Robert K. Murray 2003). During
ischemic conditions (e.g., ischemic stroke), there is a reduced oxygen and glucose supply to the
ischemic region that will result in cell death (Robbins and Swanson 2014). Other tissues,
including heart, can utilize amino acids and fatty acids, but the entry of most of these nutrients to
the brain is difficult due to the blood-brain barrier (Siesjo 1978). Glucose metabolism is
disturbed in the majority of acute stroke patients (Matz, Keresztes et al. 2006). The rate of
glycolysis increases 4- to 7-fold after brain ischemia, as observed in different experimental
mouse models. Anaerobic glycolysis will synthesize less (2 moles) ATP (adenosine tri-
phosphate) molecules per mole of glucose oxidized than aerobic metabolism. For this reason, the
glucose demand increases under anaerobic conditions as compared to aerobic conditions (Robert
K. Murray 2003).
Advanced glycation end (AGE) products are proteins or lipids that have reacted non-
enzymatically with sugar (Vlassara, Brownlee et al. 1981; Goldin, Beckman et al. 2006). The
degree of hyperglycemia, the extent of oxidative stress and rate of turnover of proteins are vital
factors for the synthesis of AGEs. During the formation of AGEs, either glucose or dicarbonyl
compounds react with proteins at lysine and arginine residues by means of the Maillard reaction
(Thornalley 2005). The accumulation and interaction of AGEs with receptor for advanced
glycation end products (RAGE) produce permanent damage to the tissue; stimulate cytokines
and reactive oxygen species (ROS) production as well as the modification of intracellular

Introduction
7 proteins (Brownlee 1995; Srikanth, Maczurek et al. 2011). However, the role of RAGE in
hyperglycemic stroke has not been studied.
Figure 4 Formation of AGE
Glucose metabolism via the glycolysis is shown on the left. Intracellular methylglyoxal (MG)
formation and its elimination. Adopted from Kiefer, Fleming et al. 2014 (Kiefer, Fleming et al.
2014). The breakdown of glucose to pyruvate via the Embden–Meyerhof pathway of glycolysis is
shown on the left. The spontaneous dephosphorylation of triose phosphate intermediates (TPI)
leads to the formation of methylglyoxal (MG). MG either synthesizes advanced glycation end
products or enzymatically converted to d-lactate (dashed arrows on the right side). The grey
arrows show increased production of AGEs and MG under hyperglycemic conditions. This leads
to proinflammatory condition. Advanced glycation end product (AGE), adenosine triphosphate
Introduction
8 (ATP), adenosine diphosphate (ADP), glucose-6-phosphate isomerase (G-6-P isomerase),
Triphosphate intermediates (TPI)
Introduction
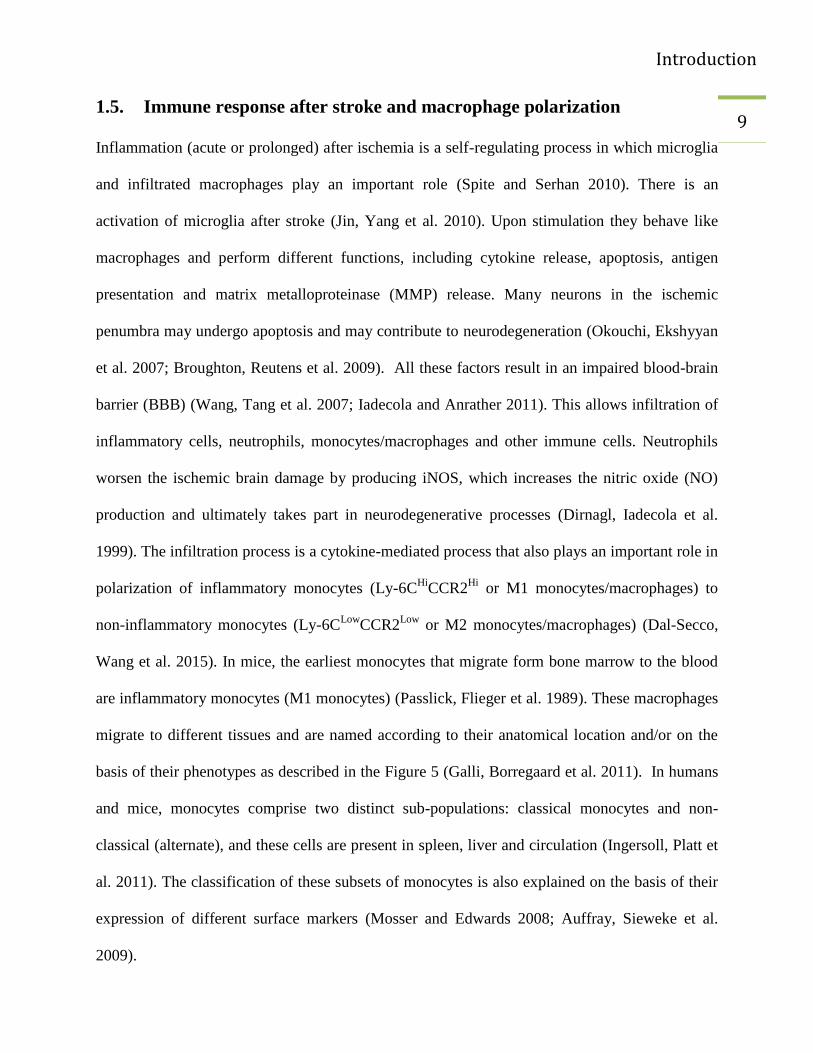
9 1.5. Immune response after stroke and macrophage polarization
Inflammation (acute or prolonged) after ischemia is a self-regulating process in which microglia
and infiltrated macrophages play an important role (Spite and Serhan 2010). There is an
activation of microglia after stroke (Jin, Yang et al. 2010). Upon stimulation they behave like
macrophages and perform different functions, including cytokine release, apoptosis, antigen
presentation and matrix metalloproteinase (MMP) release. Many neurons in the ischemic
penumbra may undergo apoptosis and may contribute to neurodegeneration (Okouchi, Ekshyyan
et al. 2007; Broughton, Reutens et al. 2009). All these factors result in an impaired blood-brain
barrier (BBB) (Wang, Tang et al. 2007; Iadecola and Anrather 2011). This allows infiltration of
inflammatory cells, neutrophils, monocytes/macrophages and other immune cells. Neutrophils
worsen the ischemic brain damage by producing iNOS, which increases the nitric oxide (NO)
production and ultimately takes part in neurodegenerative processes (Dirnagl, Iadecola et al.
1999). The infiltration process is a cytokine-mediated process that also plays an important role in
polarization of inflammatory monocytes (Ly-6CHi
CCR2Hi
or M1 monocytes/macrophages) to
non-inflammatory monocytes (Ly-6CLow
CCR2Low
or M2 monocytes/macrophages) (Dal-Secco,
Wang et al. 2015). In mice, the earliest monocytes that migrate form bone marrow to the blood
are inflammatory monocytes (M1 monocytes) (Passlick, Flieger et al. 1989). These macrophages
migrate to different tissues and are named according to their anatomical location and/or on the
basis of their phenotypes as described in the Figure 5 (Galli, Borregaard et al. 2011). In humans
and mice, monocytes comprise two distinct sub-populations: classical monocytes and non-
classical (alternate), and these cells are present in spleen, liver and circulation (Ingersoll, Platt et
al. 2011). The classification of these subsets of monocytes is also explained on the basis of their
expression of different surface markers (Mosser and Edwards 2008; Auffray, Sieweke et al.
2009).
Introduction
10 The role of these monocytes/macrophages is tissue-specific and their functions are regulated by
different signals originating from the tissue (Gordon and Taylor 2005; Murray and Wynn 2011).
Monocytes/macrophages express chemokine receptors and pathogen recognition receptors that
facilitate the migration of these cells from circulation to the tissues involved by inflammation
(Serbina, Jia et al. 2008). Chemokines are a large group of proteins that attract leukocytes. CCL2
is the main chemokine that attracts monocytes/microglia to the site of injury (McTigue, Tani et
al. 1998). The receptor for chemokine is CCR2 that interacts with CCL2 produced from
microglia during the ischemic conditions and promotes the recruitment of inflammatory
monocytes/macrophages.
Introduction
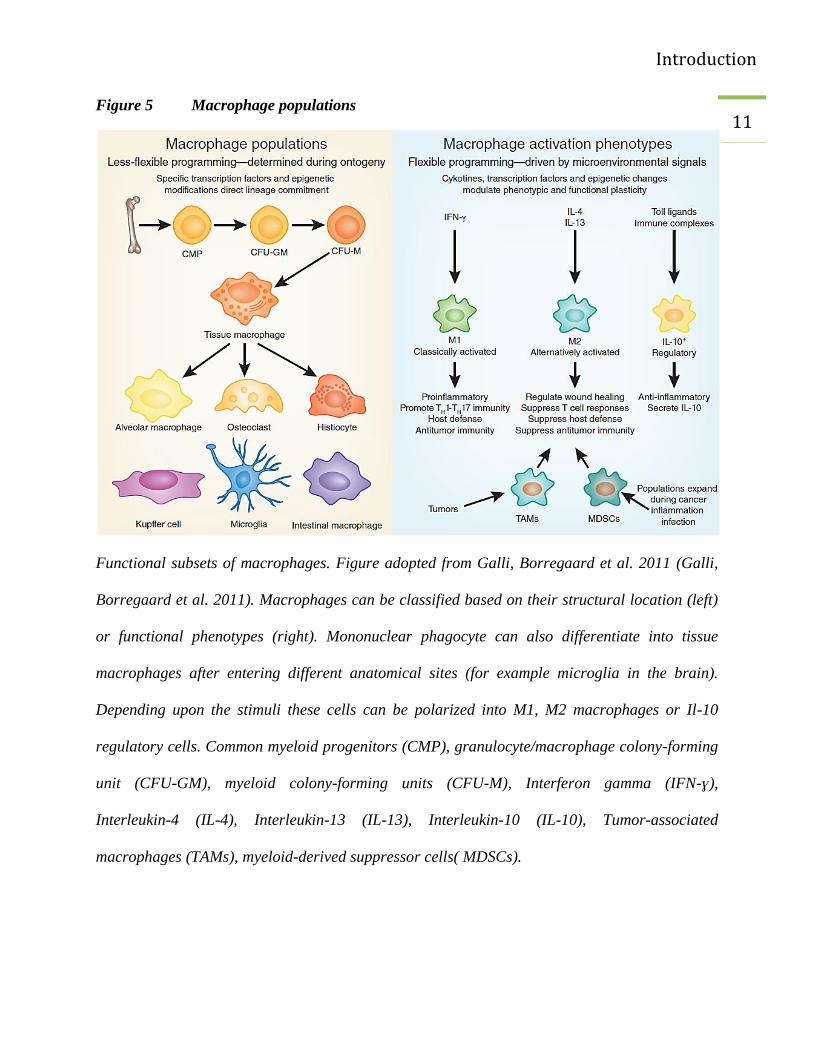
11 Figure 5 Macrophage populations
Functional subsets of macrophages. Figure adopted from Galli, Borregaard et al. 2011 (Galli,
Borregaard et al. 2011). Macrophages can be classified based on their structural location (left)
or functional phenotypes (right). Mononuclear phagocyte can also differentiate into tissue
macrophages after entering different anatomical sites (for example microglia in the brain).
Depending upon the stimuli these cells can be polarized into M1, M2 macrophages or Il-10
regulatory cells. Common myeloid progenitors (CMP), granulocyte/macrophage colony-forming
unit (CFU-GM), myeloid colony-forming units (CFU-M), Interferon gamma (IFN-ɣ),
Interleukin-4 (IL-4), Interleukin-13 (IL-13), Interleukin-10 (IL-10), Tumor-associated
macrophages (TAMs), myeloid-derived suppressor cells( MDSCs).
Introduction
12 1.6. Aims and objectives
The polarization of monocytes/macrophages is mediated by the release of chemokines and their
interaction with specific receptors. Hyperglycemic conditions may interfere with the polarization
of these cells consequently leading to an increased damage of the brain after stroke.
In this study, we aimed to investigate effects of hyperglycemia on the role of
monocytes/macrophages in cerebral ischemia with the following intentions:
1. To establish a model of hyperglycemic stroke by inducing permanent occlusion of middle
cerebral artery (MCAO), under normoglycemic (NG) and hyperglycemic conditions
(HG).
2. To investigate the effect of hyperglycemic stroke on brain-infiltrating immune cells.
3. Does hyperglycemia affect the polarization of monocytes/macrophages after stroke?
4. Does ablation of CD11b positive monocytes/macrophages has an effect on infarct
volume?
5. To explore the effect of AGE-RAGE interaction on infarct volume during hyperglycemia.
Materials and methods
13 2. MATERIALS AND METHODS
2.1. Materials
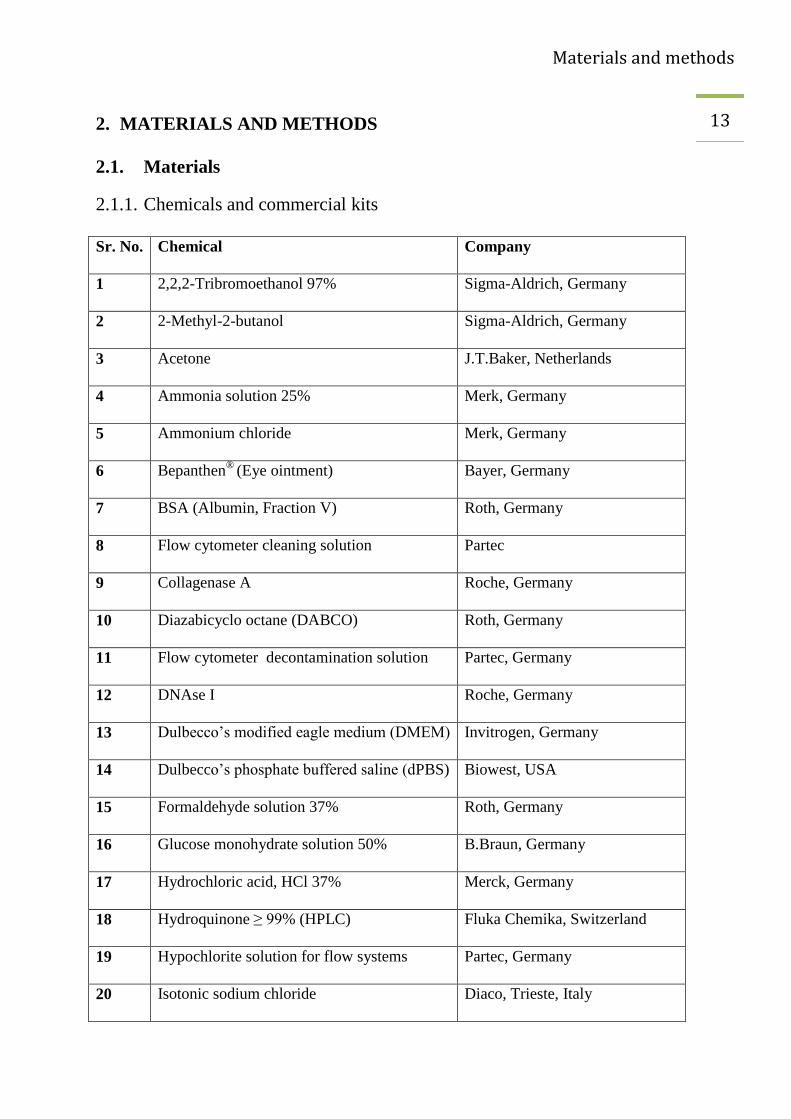
2.1.1. Chemicals and commercial kits
Sr. No. Chemical Company
1 2,2,2-Tribromoethanol 97% Sigma-Aldrich, Germany
2 2-Methyl-2-butanol Sigma-Aldrich, Germany
3 Acetone J.T.Baker, Netherlands
4 Ammonia solution 25% Merk, Germany
5 Ammonium chloride Merk, Germany
6 Bepanthen®
(Eye ointment) Bayer, Germany
7 BSA (Albumin, Fraction V) Roth, Germany
8 Flow cytometer cleaning solution Partec
9 Collagenase A Roche, Germany
10 Diazabicyclo octane (DABCO) Roth, Germany
11 Flow cytometer decontamination solution Partec, Germany
12 DNAse I Roche, Germany
13 Dulbecco’s modified eagle medium (DMEM) Invitrogen, Germany
14 Dulbecco’s phosphate buffered saline (dPBS) Biowest, USA
15 Formaldehyde solution 37% Roth, Germany
16 Glucose monohydrate solution 50% B.Braun, Germany
17 Hydrochloric acid, HCl 37% Merck, Germany
18 Hydroquinone ≥ 99% (HPLC) Fluka Chemika, Switzerland
19 Hypochlorite solution for flow systems Partec, Germany
20 Isotonic sodium chloride Diaco, Trieste, Italy
Materials and methods
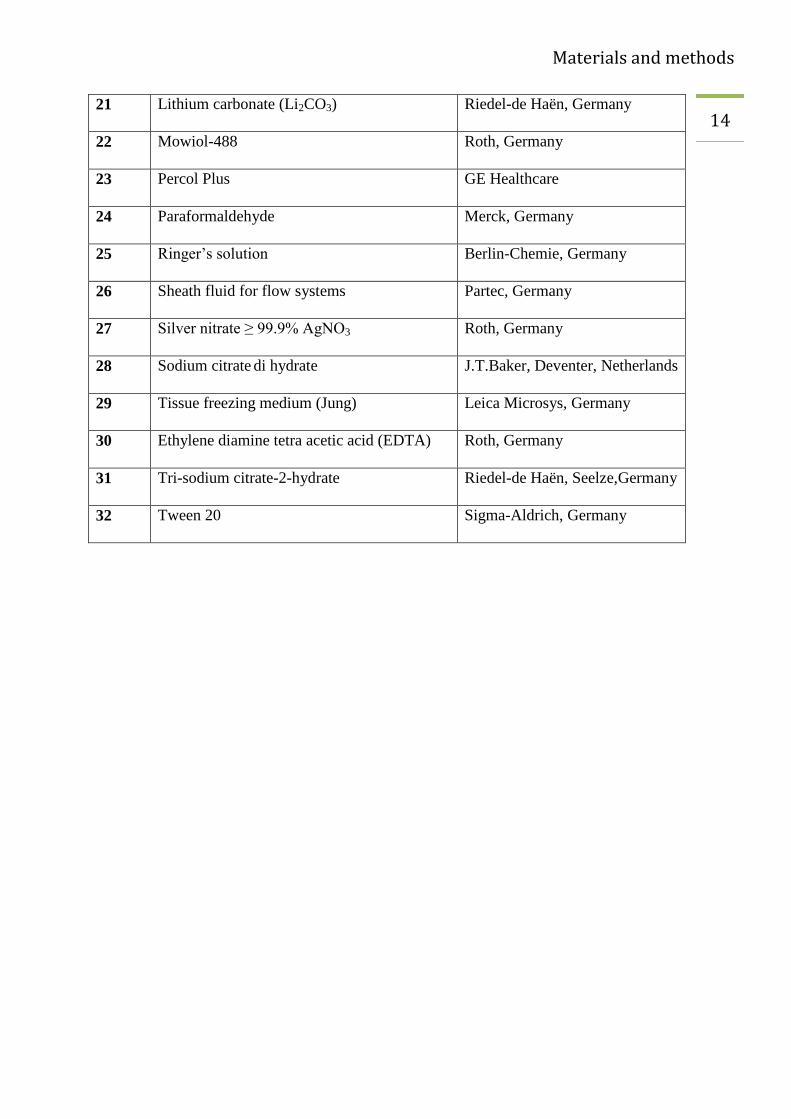
14 21 Lithium carbonate (Li2CO3) Riedel-de Haën, Germany
22 Mowiol-488 Roth, Germany
23 Percol Plus GE Healthcare
24 Paraformaldehyde Merck, Germany
25 Ringer’s solution Berlin-Chemie, Germany
26 Sheath fluid for flow systems Partec, Germany
27 Silver nitrate ≥ 99.9% AgNO3 Roth, Germany
28 Sodium citrate di hydrate J.T.Baker, Deventer, Netherlands
29 Tissue freezing medium (Jung) Leica Microsys, Germany
30 Ethylene diamine tetra acetic acid (EDTA) Roth, Germany
31 Tri-sodium citrate-2-hydrate Riedel-de Haën, Seelze,Germany
32 Tween 20 Sigma-Aldrich, Germany
Materials and methods
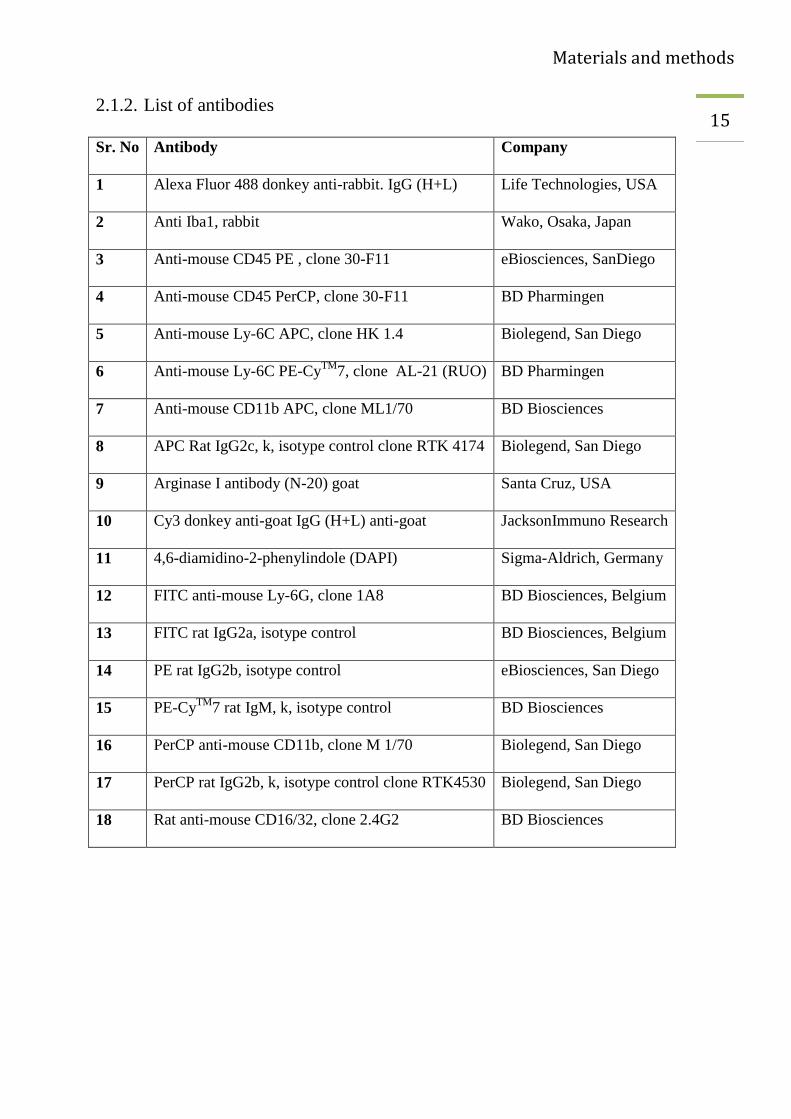
15 2.1.2. List of antibodies
Sr. No Antibody Company
1 Alexa Fluor 488 donkey anti-rabbit. IgG (H+L) Life Technologies, USA
2 Anti Iba1, rabbit Wako, Osaka, Japan
3 Anti-mouse CD45 PE , clone 30-F11 eBiosciences, SanDiego
4 Anti-mouse CD45 PerCP, clone 30-F11 BD Pharmingen
5 Anti-mouse Ly-6C APC, clone HK 1.4 Biolegend, San Diego
6 Anti-mouse Ly-6C PE-CyTM
7, clone AL-21 (RUO) BD Pharmingen
7 Anti-mouse CD11b APC, clone ML1/70 BD Biosciences
8 APC Rat IgG2c, k, isotype control clone RTK 4174 Biolegend, San Diego
9 Arginase I antibody (N-20) goat Santa Cruz, USA
10 Cy3 donkey anti-goat IgG (H+L) anti-goat JacksonImmuno Research
11 4,6-diamidino-2-phenylindole (DAPI) Sigma-Aldrich, Germany
12 FITC anti-mouse Ly-6G, clone 1A8 BD Biosciences, Belgium
13 FITC rat IgG2a, isotype control BD Biosciences, Belgium
14 PE rat IgG2b, isotype control eBiosciences, San Diego
15 PE-CyTM
7 rat IgM, k, isotype control BD Biosciences
16 PerCP anti-mouse CD11b, clone M 1/70 Biolegend, San Diego
17 PerCP rat IgG2b, k, isotype control clone RTK4530 Biolegend, San Diego
18 Rat anti-mouse CD16/32, clone 2.4G2 BD Biosciences
Materials and methods
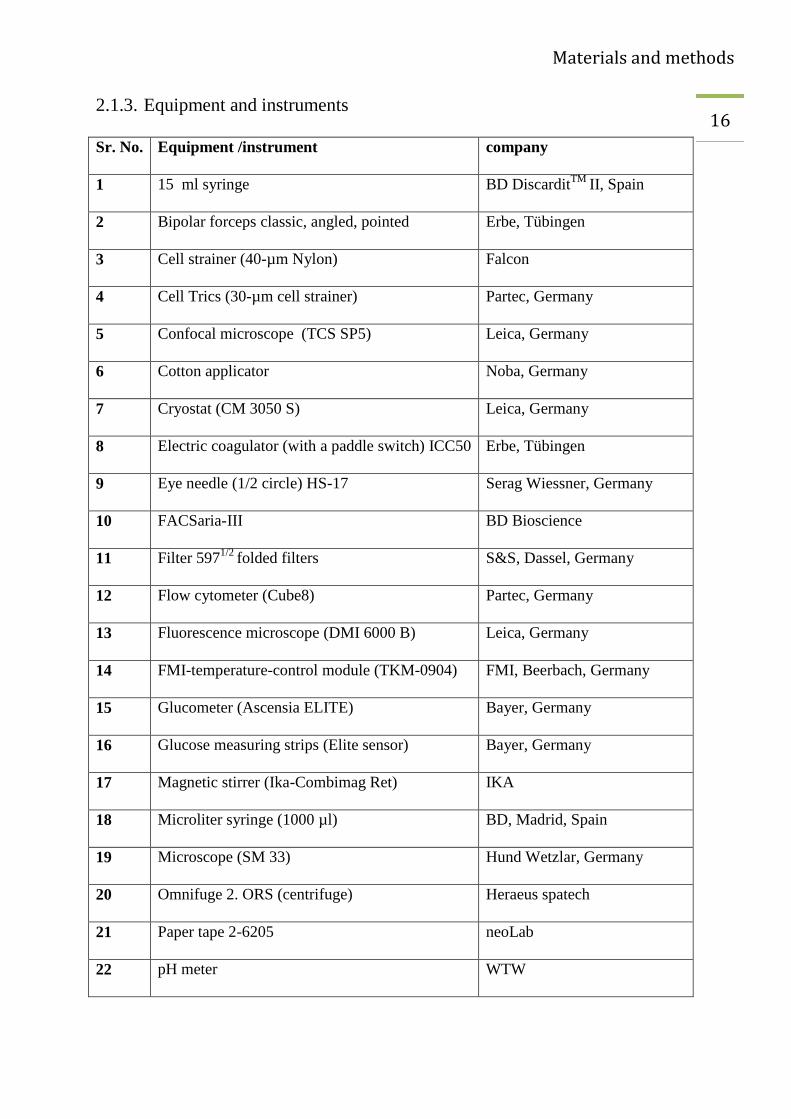
16 2.1.3. Equipment and instruments
Sr. No. Equipment /instrument company
1 15 ml syringe BD DiscarditTM
II, Spain
2 Bipolar forceps classic, angled, pointed Erbe, Tübingen
3 Cell strainer (40-µm Nylon) Falcon
4 Cell Trics (30-µm cell strainer) Partec, Germany
5 Confocal microscope (TCS SP5) Leica, Germany
6 Cotton applicator Noba, Germany
7 Cryostat (CM 3050 S) Leica, Germany
8 Electric coagulator (with a paddle switch) ICC50 Erbe, Tübingen
9 Eye needle (1/2 circle) HS-17 Serag Wiessner, Germany
10 FACSaria-III BD Bioscience
11 Filter 5971/2
folded filters S&S, Dassel, Germany
12 Flow cytometer (Cube8) Partec, Germany
13 Fluorescence microscope (DMI 6000 B) Leica, Germany
14 FMI-temperature-control module (TKM-0904) FMI, Beerbach, Germany
15 Glucometer (Ascensia ELITE) Bayer, Germany
16 Glucose measuring strips (Elite sensor) Bayer, Germany
17 Magnetic stirrer (Ika-Combimag Ret) IKA
18 Microliter syringe (1000 µl) BD, Madrid, Spain
19 Microscope (SM 33) Hund Wetzlar, Germany
20 Omnifuge 2. ORS (centrifuge) Heraeus spatech
21 Paper tape 2-6205 neoLab
22 pH meter WTW
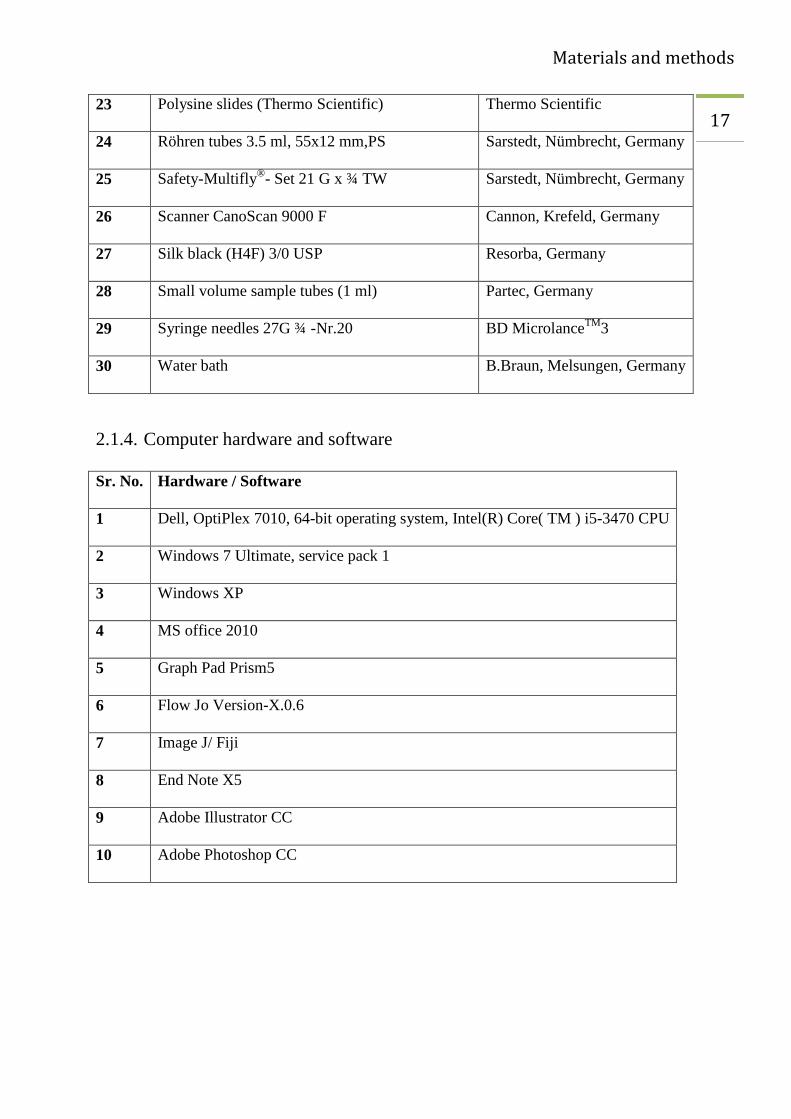
Materials and methods
17 23 Polysine slides (Thermo Scientific) Thermo Scientific
24 Röhren tubes 3.5 ml, 55x12 mm,PS Sarstedt, Nümbrecht, Germany
25 Safety-Multifly®
- Set 21 G x ¾ TW Sarstedt, Nümbrecht, Germany
26 Scanner CanoScan 9000 F Cannon, Krefeld, Germany
27 Silk black (H4F) 3/0 USP Resorba, Germany
28 Small volume sample tubes (1 ml) Partec, Germany
29 Syringe needles 27G ¾ -Nr.20 BD MicrolanceTM
3
30 Water bath B.Braun, Melsungen, Germany
2.1.4. Computer hardware and software
Sr. No. Hardware / Software
1 Dell, OptiPlex 7010, 64-bit operating system, Intel(R) Core( TM ) i5-3470 CPU
2 Windows 7 Ultimate, service pack 1
3 Windows XP
4 MS office 2010
5 Graph Pad Prism5
6 Flow Jo Version-X.0.6
7 Image J/ Fiji
8 End Note X5
9 Adobe Illustrator CC
10 Adobe Photoshop CC
Materials and methods
18 2.2. Methods for animal experiments
2.2.1. Experimental animals
For all the experiments in this work, experimental animals were age- and gender-matched
between groups. All experiments were conducted according to the German animal protection
regulations and sanctioned by the local animal welfare authorities (Ministerium für
Energiewende, Landwirtschaft, Umwelt und ländliche Räume, Kiel, Germany). In all the
experiments 8- to 12-week-old mice were used. Experimenter was blinded for the treatment- and
genotype- of groups before the start of each experiment. The sample size was calculated on the
basis of the effect size (ε) calculations by dividing the difference in means (∆) by the standard
deviation (σ).
The following formula was used to calculate sample size:
ε = ∆/ σ
To measure the infarct volume, under normoglycemic (NG) and hyperglycemic (HG) conditions,
C57BL/6 male mice (10-12 weeks) were used. Similarly, for flow cytometric analysis of immune
cells infiltrating the brain, C57BL/6 and Hca2mRFP
(Gpr109amRFP
) mice were used (Hanson,
Gille et al. 2010). To test the effect of monocyte-depletion on infarct volume CD11b-DTR mice
were utilized. To explore the involvement of the receptor for advanced glycation end products
(RAGE) in ischemic brain damage under NG and HG conditions, RAGE-/-
mice were used.
RAGE-/-
mice were kindly provided by Dr. Thomas Fleming and Prof. P. Nawroth, University of
Heidelberg. In-house bred, age-matched C57BL6/N mice were used as control because the
RAGE -/-
were 18 times backcrossed with C57BL6/N. Breeding pairs of C57BL6/N mice were
purchased from Charles River, Germany.
Materials and methods
19 2.2.2. Preparation for surgery
The surgical instruments were sterilized with 70% ethanol. Pentobarbital (0.075-0.01 mg/g) was
used as an anesthetic agent (Weiss and Zimmermann 1999). The anesthetic agent was prepared
by diluting commercially available pentobarbital (96 mg/1.8 ml) with sterile PBS and the stored
the diluted solution at 4° C in a light-protected bottle. The final concentration of the
pentobarbital solution was 5 mg/ml. All mice were kept in 37 x 19 x 12-cm (length x width x
height) cages at 20-24 °C and 50-70% humidity.
2.2.3. Preparation of 4% paraformaldehyde (PFA)
PFA (40 g) was mixed with 2.5 ml of NaOH (1N; 40 g NaOH per 1000 ml) and PBS (800 ml).
This solution was heated to 70° C. The solution was left for a while to cool down and the pH was
adjusted to 7.4. The final volume was made up to 1000 ml by adding water. Aliquots of the
solution were stored at -20° C in the 50-ml Falcon tubes.
2.2.4. Preparation of diphtheria toxin (DT)
Diphtheria toxin (1 mg) was diluted with distilled water (1 ml). Aliquots of 50 µl were kept at -
20° C. For injecting, a 50 µl aliquot was diluted with 10 ml of sterile PBS. Diphtheria toxin (25
ng per gram body weight) was administered intra-peritoneal (i.p).

Materials and methods
20 2.2.5. Bone marrow transplantation
Bone marrow transplantation (BMT)* was performed as described previously (Muhammad,
Barakat et al. 2008) with the following modifications. Mice were killed by cervical dislocation,
and bone marrow was aseptically collected from femurs and tibias. Unfractionated bone marrow
cells were resuspended in 0.25 ml sterile PBS and injected retro-orbitally into 10- to 13-week-old
C57BL/6 and Hca2mRFP
mice that had been lethally irradiated (dose of 10 Gy in 2 divided
sessions, 5 Gy each time with a 4-hours interval, 10 MV- bremsstrahlung, dose rate of 3 Gy /
min) 1 day before. Six weeks after reconstitution, mice were subjected to MCAO. Flow
cytometry of blood cells was performed before and 24 hours after MCAO, while flow cytometry
of the brain cells was performed 24 hours and 48 hours after MCAO.
* Preparation and radiation of the recipient mice was done by me. Preparation of bone marrow cells was performed
by Dr. Dirk A. Ridder and Dr. Hui Chen. Six weeks after BMT, MCAO and flow cytometry of blood and brain was
performed by me. Cryosection, immune staining, calculation and analysis of flow cytometry data were done by me.

Materials and methods
21 2.2.6. Blood glucose measurement
Blood glucose concentrations were measured after anesthetizing the mice from the tail. A
marginal difference in glucose concentration has been reported between blood samples obtained
from the retro-orbital or tail vein (Rogers, Holder et al. 1999). A small cut was made on the tip
of the tail. A drop of blood was transferred directly on the glucose measuring strip (Elite sensor,
Bayer). The concentration was noted in milligram per deciliter (mg/dl). Blood glucose
concentrations were measured at three time points. The first measurement was performed
immediately after anesthetizing the mice (0 minute), the second measurement after 30 minutes
and the third one after 50 minutes of the first measurement.
To induce hyperglycemia, 200 µl of 25% glucose solution was administered i.p, while in control
mice; an equal volume of 0.9% NaCl was injected.
0.9% sodium chloride (0.9% NaCl), Middle cerebral artery occlusion (MCAO), Injection (inj)
Anesthesia
(Pentobarbital)
Glucose measurement
(0 minute)
Glucose or 0.9%
NaCl inj.
MCAO
Glucose measurement
(30 minutes)
Glucose measurement
(50 minutes)
Figure 6 Experiment protocol
Materials and methods
22 2.2.7. Middle cerebral artery occlusion (MCAO) surgery
MCAO was performed as described previously (Bargiotas, Muhammad et al. 2012).The mice
were anesthetized with an i.p injection of pentobarbital (0.075-0.1 mg/g body weight). One-2
minutes after injection, the hind limb paw was pressed with the finger to confirm that the mice
were under adequate anesthesia. During the whole surgical procedure, its body temperature was
maintained between 37° C to 37.5° C by a rectal thermometer controlling the heating pad. An
eye ointment (e.g., 5% dexpanthenol (Bepanthen®) was administered to protect both eyes. The
skin was disinfected with 70% ethanol. Under a surgical microscope (SM33 Hund Wetzlar,
Germany), a skin incision of 2-4 cm was made between the left orbit and tragus to expose the
temporal muscle. The temporal muscle was removed with the help of a microbipolar electrical
coagulator (Erbe, 20195-013). After the removal of the temporal muscle, the bifurcation of the
MCA was visible under the skull, indicating the site of craniotomy. Some drops of 0.9% NaCl
were added and drilling was started on the skull. For drilling a dental drill (Proxxon, 41415-
2008) was used at a speed of 10-17 thousand cycles per minute. When a circular hole with a
diameter of about 2 mm was drilled, the dura was exposed and it was removed carefully with a
fine forceps. The left distal MCA (dMCA) was occluded below and above the bifurcation with
an electrical coagulator. Occlusion was done at three sites to ensure that it is irreversible. The
wound was closed by stitching the skin with black silk (3/0 USP) using a half circle needle (HS-
17). Then mice were kept under red light for approximately 15-20 minutes and returned to the
home cages. After MCAO surgery, the mice were observed two times a day till perfusion was
done.
Materials and methods
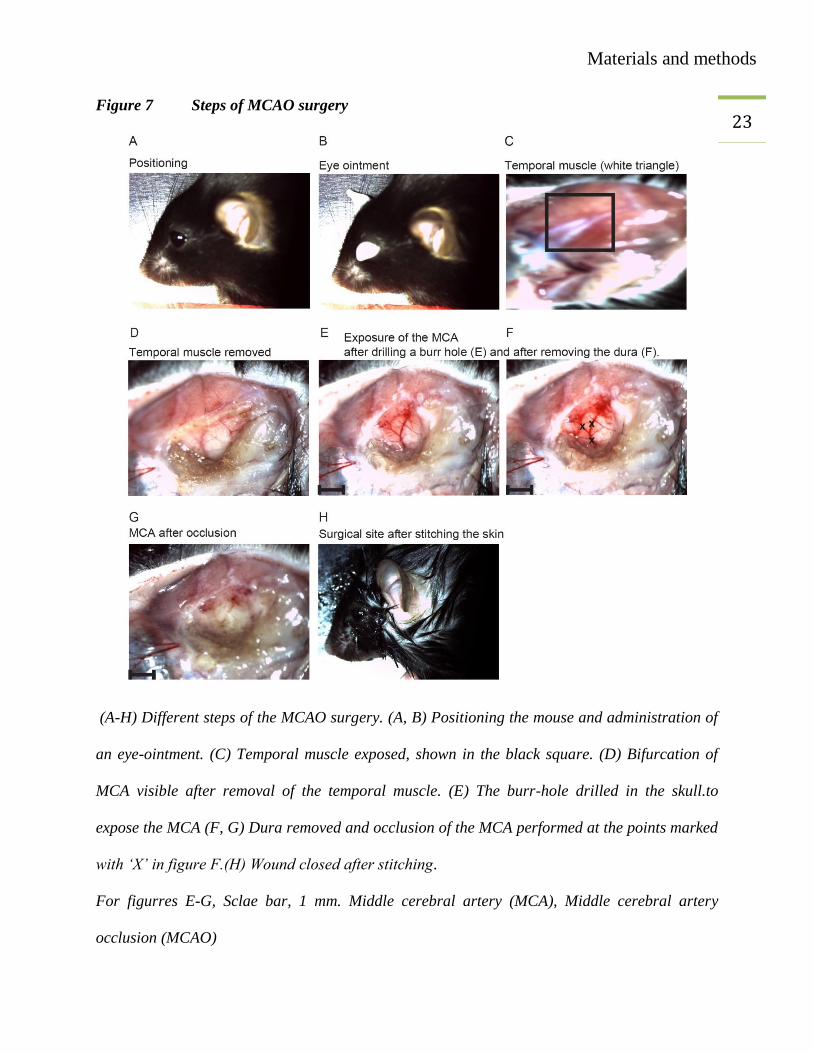
23 Figure 7 Steps of MCAO surgery
(A-H) Different steps of the MCAO surgery. (A, B) Positioning the mouse and administration of
an eye-ointment. (C) Temporal muscle exposed, shown in the black square. (D) Bifurcation of
MCA visible after removal of the temporal muscle. (E) The burr-hole drilled in the skull.to
expose the MCA (F, G) Dura removed and occlusion of the MCA performed at the points marked
with ‘X’ in figure F.(H) Wound closed after stitching.
For figurres E-G, Sclae bar, 1 mm. Middle cerebral artery (MCA), Middle cerebral artery
occlusion (MCAO)
Materials and methods
24 2.2.8. Perfusion and removal of the intact brain
Two days after MCAO, the mice were reanesthetized with 2.5% TBE given i.p. at a dose of 20
µl/g body weight. The mice were fixed on a thermopore sheet in a supine position. The thoracic
cavity was opened, an 18G ¾ butterfly needle was inserted through the left ventricle into the
ascending aorta. After opening the right atrium the mice were perfused by injecting 15-20 ml
Ringer’s lactate buffer at a constant pressure. After perfusion, the brain was exposed and
carefully dissected without damaging its surface. The brain was kept on dry-ice and then stored
at -20° C or -80° C in a well labelled plastic container.
2.2.9. Cryosectioning
For cryosectioning a temperature of -20° C and a section thickness of 20 µm were used. A small
volume of tissue freezing medium was dropped on the specimen disc and the brain was
positioned vertically. The specimen disc was placed on the quick freeze shelf inside the cryostat.
The whole brain was covered with tissue freezing medium and was placed inside the cryotome
until it was completely frozen.
In the meantime, the slides of series-1 (S1) to series-3 (S3) were labelled with adequate
information about the experiment. The specimen disc and the blade were fixed. The olfactory
bulb was trimmed, and 20 µm thick sections of each series S1 to S3 were collected on slides. A
distance of 400 µm was maintained between two consecutive sections on each slide. In this way
usually 23-24 sections per brain were obtained. The slides were stored at -20 ° C or -80 ° C in
well-labelled plastic boxes. Series-1 (S1) was dried at room temperature before the start of silver
staining.
Materials and methods
25 2.2.10. Silver staining
Impregnation and developing solutions were prepared.
2.2.10.1. Impregnation solution
For 60 slides, 3.375 g AgNO3 was dissolved in 33.75 ml H2O (10% w/v AgNO3). In a separate
conical flask, 67.5 ml H2O was added to 0.81 g LiCO3 to make a suspension. Then, 10% AgNO3
was mixed with the LiCO3 suspension (color turns yellowish). Ammonia solution (25 %) was
added drop by drop until a gray solution was reached (maximum volume 3.6 ml). Finally, 506.25
ml water was added.
N: An excess of ammonia was avoided because it would disturb.
2.2.10.2. Developer solution
In a 1000 ml conical flask, 1.8 g hydroquinone and 6.6 g Sodium citrate were dissolved in
filtered 37% formaldehyde solution (120 ml). Then, acetone (90 ml) and H2O 420 ml were
added. The flask was wrapped with aluminum foil to protect from light. The solution was mixed
with a magnetic stirrer for about 1 h until its color turned to a light red. The slides were
incubated in the impregnation solution for 2 minutes and washed three times for 1 minute with
aqua dest. Then the slides were placed in the developing solution for 2-3 minutes and again
washed with aqua dest three times for 1 minute. Before scanning, the stained slides were dried
overnight at room temperature.
2.2.11. Scanning
A small scale was fixed at one side of the scanner. Slides from series 1 (S-1) were put next to
this scale in an inverted position. After scanning the images were saved in TIF format using grey
scale and a resolution of 300 dpi.
Materials and methods
26 2.2.12. Method for the infarct size measurement
A computer program (ImageJ) was used to measure the area of silver deficit, the right
hemisphere, and the left hemisphere on all sections. Sections without silver deficit were also
analyzed.
The infarct area was calculated for each section with the following equation:
Right hemisphere + silver deficit – left hemisphere = Infarct area
Edema was calculated with the following equation:
Left hemisphere – right hemisphere = Edema
The infarct volume was calculated by adding the infarct areas and multiplying the sum by the
distance between sections. In the same way, the edema volume was calculated.

Materials and methods
27 2.3. Methods for flow cytometry experiments
2.3.1. Preparation of fluorescence activated cell sorting (FACS) solutions
2.3.2. FACS buffer
BSA (2.5 g) and NaN3 solution (1.54 ml, 1 M) were mixed in PBS (500 ml).
One molar NaN3 solution: Sodium azide (NaN3, 3.2505 g) was dissolved in 50 ml of PBS.
2.3.3. Digestion buffer
Collagenase-A (100 mg) and DNAse (10 mg) were diluted in 100 ml of DMEM. Aliquots were
stored at -20° C in 5-ml Falcon tubes.
2.3.4. Erythrolysis buffer
NH4Cl (8.02 g), KHCO3 (1 g), Na2EDTA (0.037 g) were dissolved in deionized water and the
final volume was adjusted to 1000 ml. The pH was adjusted to 7.2 – 7.4.
2.3.5. Phosphate buffered saline (PBS) 10x (1 L)
NaCl (80.0 g), KCl (2.0 g), Na2HPO4.7H2O (26.8 g), KH2PO4 (2.4 g) were added in 1000 ml of
H2O. The pH was adjusted to 7.4.
Materials and methods
28 2.3.6. Preparation of Percol (90%)
Percol-plus (90 ml) and 10x PBS (10 ml) were mixed and stored at 4° C.
2.3.7. Preparation of Percol-A (78%)
Forty seven milliliters of 90 % Percol were diluted with 1x PBS (13 ml) and stored at 4° C.
2.3.8. Preparation of Percol-B (30%)
Twenty milliliters of 90% percol were added to 40 ml of DMEM and stored at 4° C.
Note: All the containers were well labeled and tightly closed.

Materials and methods
29 2.4. Procedures
2.4.1. Brain cell preparation
Before starting the cell preparation, the water bath was turned on to attain a temperature of
37° C, and the centrifuge was cooled down to 4° C. The digestion medium was thawed and the
other required materials were prepared.
2.4.1.1. Perfusion and collection of brain
The mice were deeply anesthetized with TBE (2.5%) by administering a dose of 20 µl/g. After
perfusion with 15 ml Ringer’s solution, the brains were collected and the cerebella and olfactory
bulbs were removed. The brains were divided into left and right hemispheres for cell preparation.
Then, the tissue was collected into a petri dish containing ~5 ml PBS until all the brains were
removed. The hemispheres were transferred into another dry petri dish and a drop of digestion
medium was added. The hemispheres were cut it into small pieces. Digestion medium (~1 ml)
was added and transferred with the tissue into 50-ml Falcon tubes with a 10-ml pipette. The
remaining 4 ml of the digestion medium aliquot was also added in the 50-ml Falcon tubes. The
Falcon tubes with brain tissue suspension were incubated in a shaking water bath at 37° C for 30
minutes. The brain tissue was homogenized thoroughly with a 10-ml pipette. The digested tissue
was passed through a 40-µm nylon cell strainer (BD Biosciences). The cell strainer was washed
with 40 ml cold PBS. The cell suspension was centrifuged at 310 g for 10 minutes at 4° C.
Materials and methods
30 2.4.1.2. Preparation of cells
The cell pellet was resuspended in 5 ml erythrocyte lysis buffer and was incubated for 7 minutes
on ice to lyse the red blood cells (RBCs). The Falcon tubes were filled with cold PBS and
centrifuged at a speed of 310 g for 10 minutes at 4° C. After centrifugation the supernatant was
discarded and the cells were resuspended in 2.8 ml percoll B (30%). The suspension was
transferred to another 15-ml Falcon tubes. A 5-ml pipette was slowly advanced to the bottom of
the tube and percoll B underlied with percoll A (2.5 ml). The weight of the tubes was balanced
(if necessary) with percoll B. The Falcon tubes were centrifuged (without brake, Decel = 0) at
1350 g for 30 minutes at 4° C. The cells were collected from the interface of the gradient with a
1-ml pipette and were transferred to fresh 15-ml Falcon tubes. The tubes were filled with FACS
buffer and mixed gently by inverting. Then they were centrifuged at 700 g, 10 minutes and 4° C
(brake turned on again). The cell pellet was washed 1-2 times with 10 ml of FACS buffer at
centrifugation 310 g for 10 minutes at 4° C. The supernatant was discarded and the cells were
resuspended in 100 µl FACS buffer.
Materials and methods
31 2.4.1.3. Staining protocol
A first step was to determine the optimal antibody concentration and incubation time. The cell
suspension (100 µl) was incubated on ice for 15 minutes with anti-mouse CD 16/32 (Fc-block,
BD Pharmingen, 1 µl). Then, the cells were incubated with the antibodies or their respective
isotype controls (1 µl for 100 µl cell suspension) for 45 – 60 minutes at 4° C in the dark.
2.4.2. Blood
The mice were anesthetized with an i.p injection of 2.5% TBE at a dose of 20 µl per gram body
weight. Ten µl 0.5 M EDTA (sterile filtered) was aspirated into a syringe and was spread across
the syringe walls by pipetting it up and down. The blood was collected from the inferior vena
cava (alternatively: cardiac puncture) and kept in a shaker until the staining was performed. One-
hundred µl of whole blood was incubated with antibodies (1 µl for 100 µl cell suspension) for 45
to 60 minutes at 4° C in the dark. The erythrolysis buffer (1 ml) was added and mixed gently.
This mixture was then transferred to 15-ml Falcon tubes and were incubated for 7 minutes on
ice. After adding PBS (4 ml) the whole suspension was centrifuged at a speed of 310 g for 10
minutes at 4° C. The supernatant was discarded carefully and of FACS-buffer (400 µl) was
added before analyzing with the flow cytometer (Partec Cube 8).
Materials and methods
32 2.5. Immune fluorescence microscopy
2.5.1. Preparation of solutions
2.5.1.1. Preparation of 30% sucrose
Sucrose (30 g) was dissolved in 100 ml of PBS.
2.5.1.2. Preparation of the citrate buffer
Sodium citrate (2.94 g) was mixed in 1000 ml H2O and the pH was adjusted at 6.
2.5.1.3. Preparation of 0.05% Tween-20
Tween-20 (500 µl) was dissolved in 1000 ml of 1x PBS (PBST).
2.5.1.4. Preparation of 5% and 10% BSA
For a 10% BSA solution, BSA (10 g) was dissolved in 100 ml of PBST. To prepare a 5%
dilution, 10 % BSA was diluted with an equal volume of PBST.
BSA (10 %) was used as blocking solution and 5 % BSA was utilized for the preparation of
antibody dilutions.
2.5.1.5. Preparation of Mowiol
Poly (vinyl alcohol)/Mowiol® 488 (2.4 g, 10% W/V), glycerol (6g, 25% W/V), water (6 ml) and
Tris-buffer (12 ml, 0.2 M, pH 8.5) and 0.1 % DABCO (Roth) were mixed for 24 hours. Then, the
mixture was centrifuged for 15 minute at a speed of 6198 g. The aliquots of supernatant were
stored at - 20° C.
Materials and methods
33
2.6. Perfusion
Two days after the MCAO, the mice were reanesthetized and slowly perfused with 10 ml
Ringer’s lactate buffer followed by 10 ml 4% PFA. Post-fixation was done for 24 hours in 4%
PFA at 4° C and the cryoprotection was done for 24 hours at 4° C in 30% sucrose. The brains
were quickly frozen in the super-cooled isopentane and then the brains were transferred on dry
ice. The brains were stored at -70° C to -80° C. Before cryosectioning the brains were
maintained at -20° C for 30 minutes. The cryosections of 20-µm thickness were used for immune
staining and the slides were stored at -20° C or -70° C.
2.7. Staining
After drying the frozen sections for 1 hour, a rectangle was drawn around the sections with an
ImmEdge Pen (Vector). The slides were rehydrated in 1x PBS for 5 minutes. For antigen
retrieval, citrate buffer was heated to 98° C. When the temperature dropped to 92° C at room
temperature, then the slides were incubated in the buffer till its temperature dropped to 35° C.
The slides were washed three times in PBST for 5 minutes and kept in blocking solution (10%
BSA in PBST) for 35 minutes. Arginase I (1:200) and Iba1 (1:100) antibodies dilutions were
prepared in 5% BSA. The slides were incubated overnight (O/N) at RT with 250 µl of primary
antibodies dilution. Next day, after washing with PBST, the slides were incubated with
respective secondary antibodies (1:400) and DAPI (1:2000). Anti-goat Cy3 and anti-rabbit
Alexa-488 were used as secondary antibodies for arginase I and Iba-1 respectively. Mounting
medium was added after washing the slides with PBST. Imaging was performed on a
fluorescence (DMI 6000 B, Leica) or a confocal microscope (TCS SP5, Leica) using the same
settings for the whole experiment.
Materials and methods
34 2.8. Statistical analysis
All data are illustrated as means ± SEM. Two groups were compared by using unpaired, two-
tailed t-test. Three or more groups were statistically compared with two-way analysis of variance
(ANOVA), followed by Bonferroni posthoc tests (GraphPad Prism 5.0 software). Values were
considered to be significant at p-values <0.05.

Experiments and results
35 3. EXPERIMENTS AND RESULTS
3.1. Sample size calculations
One of the most important features of planning a research project is the calculation of the sample
size. In general the sample size depends on the acceptable level of significance, power of the
experiment, estimated effect size and standard deviation of the population (Kirby, Gebski et al.
2002). In this study, the sample size was calculated on the basis of effect size (ε) calculated by
dividing the difference in means (∆) by the standard deviation (σ).
The following formula was used to calculate the effect size:
ε = ∆/ σ
∆ = 7.28 and σ = 4.71
ε = 7.28 / 4.71 = 1.54
Effect size (ε) = 1.54

Experiments and results
36 The following table lists typical sample sizes for diverse effect sizes.
Table 1 Sample size estimation. The values are based on a power of 0.8 and p<0.05.
Effect size t-Test t-Test (one) t-Test (two) ANOVA 3 Gr. ANOVA 4 Gr. ANOVA 6 Gr.
0.8 15 21 26 31 35 41
0.9 122 16 21 25 28 33
1. 10 14 17 20 23 27
1.1 9 11 15 17 19 22
1.2 8 10 12 15 16 19
1.3 7 9 11 13 14 17
1.4 7 8 10 11 13 14
1.5 6 7 9 10 11 13
Student's t-test (t-Test), One-sample Student's t-test (t-Test (one)), Two-sample Student's t-test
(t-Test 8two)), Analysis of variance with three groups (ANOVA 3 Gr.), Analysis of variance
with four groups (ANOVA 4 Gr.), Analysis of variance with six groups (ANOVA 6 Gr.).
The effect size 1.54 corresponds to the sample size 11 in the column of ANOVA with 4 groups.
Therefore, we used 11 mice in each group.
Experiments and results
37 3.2. Establishment of a mouse model of hyperglycemic stroke
It is well established that preischemic hyperglycemia (HG) enhances ischemic brain damage in
human as well as in animal models of both global and focal cerebral ischemia. Both experimental
and clinical studies have shown that besides the susceptibility to stroke occurrence and the
severity of brain damage, the likelihood of death from stroke are increased in persons with
hyperglycemic conditions regardless of a preexisting diabetes. The molecular mechanisms
underlying this important, clinically relevant phenomenon are not fully understood. Therefore, to
find out the effect of hyperglycemia on infarct size we used an animal model of stroke in mice.
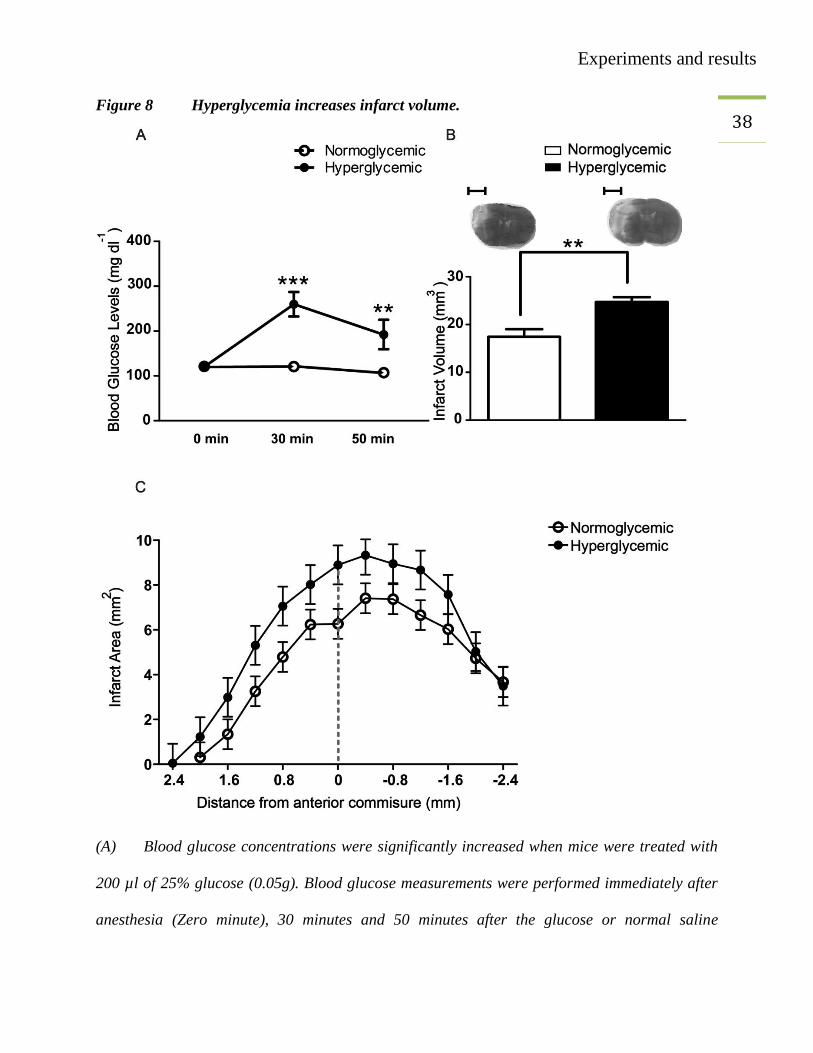
The mean blood glucose levels were significantly higher in hyperglycemic groups than that of
normoglycemic groups. The higher blood glucose levels were observed at both time points (30
minutes and 50 minutes) after glucose administration (Figure 8 A). Forty-eight hours after
MCAO, the mice were anesthetized with TBE (20 µl per gram body weight), perfused with
Ringer’s solution and the brains were harvested. The infarct size was significantly higher in
hyperglycemic mice than that of the mice in the normoglycemic group (Figure 8 B).
Experiments and results
38 Figure 8 Hyperglycemia increases infarct volume.
(A) Blood glucose concentrations were significantly increased when mice were treated with
200 µl of 25% glucose (0.05g). Blood glucose measurements were performed immediately after
anesthesia (Zero minute), 30 minutes and 50 minutes after the glucose or normal saline

Experiments and results
39 injections. White circles for normoglycemic and black circles for hyperglycemic mice. MCAO
was performed after the first measurement. Two-way ANOVA, *** p=<0.001. **p=<0.01
(Bonferroni posttests), values are mean ± SEM (n=11/group).
(B) Hyperglycemic group had higher infarct volume as compared to normoglycemic group.
Unpaired t-test, **p<0.0016, values are mean ± SEM (n=13/group) scale bar= 2.5 mm
(C) Distribution of infarct over coronal sections in normoglycemic (white circles line) and
hyperglycemic groups (black circles).
Experiments and results
40 3.3. BM-derived HCA2-positive cells are M2 polarized macrophages
In our previous study, it was proved that the neuroprotective effect of nicotinic acid was
mediated through the HCA2 receptor. The expression of HCA2 was localized in the brain, by
using the BAC-transgenic mouse line Hca2mRFP
(Gpr109amRFP
). Normally, mRFP was expressed
exclusively by CD11b+ microglia, but not by astrocytes and neurons. After MCAO, mRFP
+ cells
accumulated along the periphery of the cortical ischemia. Based on the expression of CD11b and
Iba1, HCA2+ cells were identified as microglia or monocytes/macrophages that infiltrated the
ischemic brain. To categorize, these two cell populations, chimeric mice were used. Wild-type
bone marrow was transplanted to Hca2mRFP
mice (WT>Hca2mRFP
) and Hca2mRFP
bone marrow to
wild-type mice (Hca2mRFP
>WT). Flow cytometry was performed to characterize the sub-
population of mRFP+
cells. It was found that in the brain, mRPF was expressed largely by Ly-
6CLo
monocytes/macrophages (Figure 9). Bone marrow-derived mRFP+ cells expressing CD11b
were already detected 24 hours after MCAO in the ischemic brain of Hca2mRFP
> WT mice, but
their number was higher 48 hours after MCAO (Figure 9). Further analysis confirmed that the
bone-marrow derived brain infiltrated mRFP+ cells were CD45
+CD11b
+Ly-6G
-, that confirmed
their monocytic/macrophagic identity (Figure 9 F and G). In contrast, in blood
mRFP+CD45
+CD11b
+Ly-6G
- monocytes were equally distributed between Ly-6C
Lo and Ly-6C
Hi
subpopulations before MCAO (Figure 10). After MCAO, the number of Ly-6CHi
monocytes
reduced but Ly-6CLo
monocytes remained unchanged (Figure 10).
Experiments and results
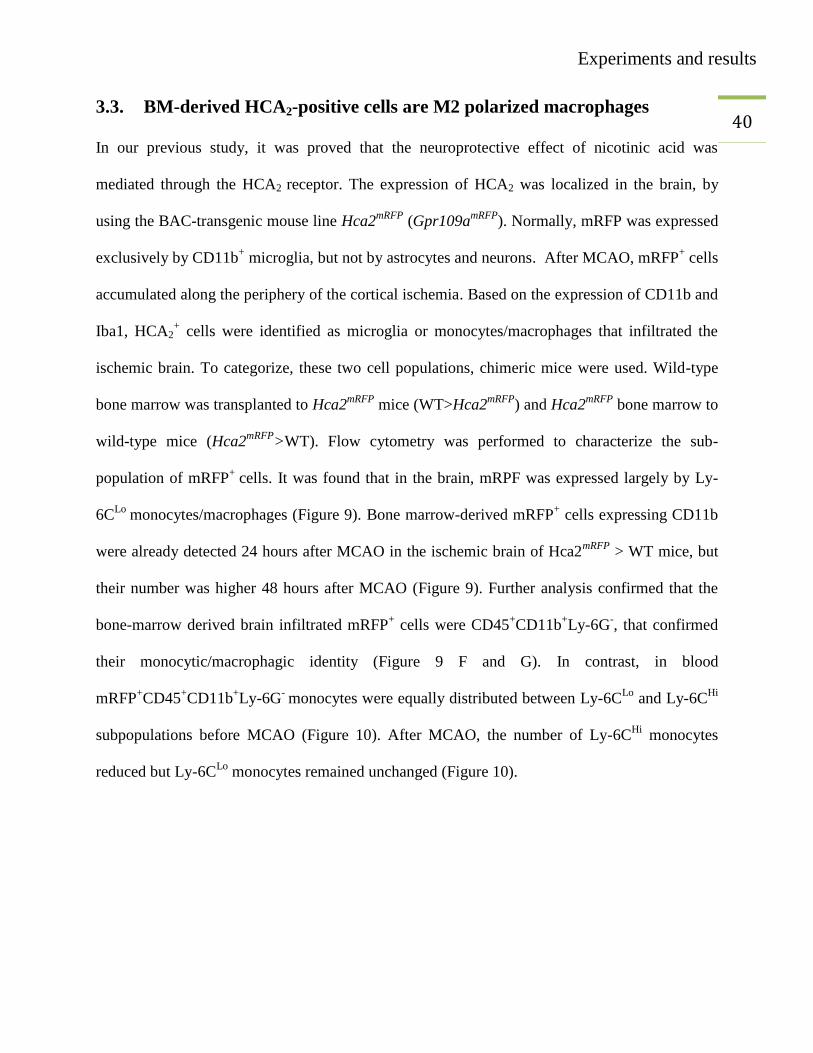
41 Figure 9 Flow cytometric characterization of HCA2-expressing cells in brain
Flow cytometric characterization of HCA2-expressing bone marrow-derived cells in the
ischemic brain. (A–C) Using flow cytometry after MCAO, we detected mRFP+ cells in the brain
of chimeric Hca2mRFP
>WT mice but not in wild-type (WT) animals. The number of mRFP+ cells
Experiments and results
42 increased between 24 hours and 48 hours after MCAO. Hca2
mRFP>WT mice were generated by
transplanting Hca2mRFP
bone marrow to WT animals. (D, E) Gated mRFP+ (red dots) and
mRFP- (black dots) cells in the ischemic hemisphere were CD11b
+CD45
+. (F, G) Gated mRFP
+
cells were mainly Ly-6CLo
and Ly-6G- in contrast to mRFP
- cells. Only CD45
+CD11b
+ cells are
shown.
Experiments and results
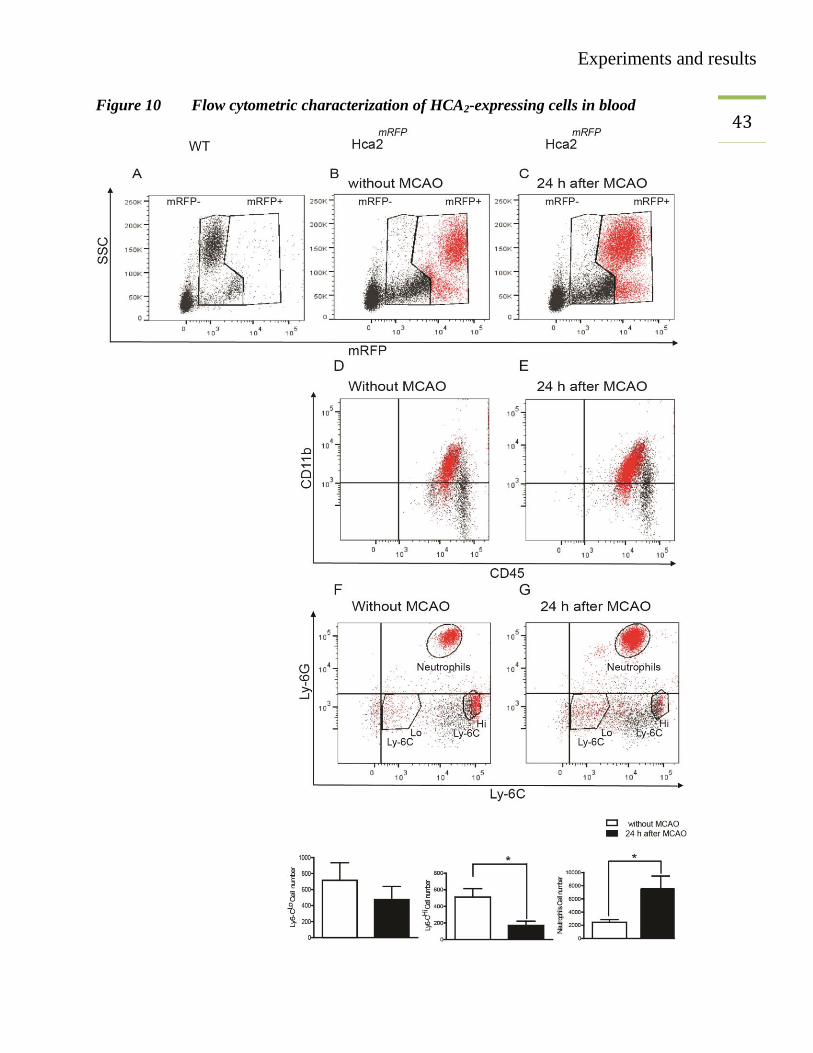
43 Figure 10 Flow cytometric characterization of HCA2-expressing cells in blood
Experiments and results
44 Flow cytometric characterization of HCA2-expressing cells in blood. (A–C)We detected RFP
+
cells only in the blood of Hca2mRFP
mice before and 24 hours after MCAO. (D, E) Gated mRFP+
(red dots) and mRFP- (black dots) cells were CD11b
+CD45
+. (F, G) Gated mRFP
+ cells fell into
three populations: Ly-6G+ (neutrophils), Ly-6G
-Ly-6C
Lo and Ly-6G
-Ly-6C
Hi monocytes. Only
CD45+CD11b
+ cells are shown. Quantification of mRFP
+ cells revealed an increase of
neutrophils and a decrease of Ly-6CHi
monocytes 24 hours after MCAO. Values are means ±
S.E.M (n=6). *P<0.05 (unpaired t-test).
Experiments and results
45 3.4. Hyperglycemia downregulates M2 monocytes/macrophages
These findings increased the curiosity whether hyperglycemia would affect brain infiltrating
immune cells. We investigated the effect of hyperglycemia on these cells by flow cytometry.
MCAO was performed in wild-type mice under normoglycemic and hyperglycemic conditions.
Forty-eight hours after MCAO surgery, the brains were collected and immune cells were
prepared from brains. The cells were stained with CD45 PE, CD-11b PerCP, Ly-6C APC and
Ly-6G FITC antibodies. Flow cytometry was performed on these cell-preparations and the cell
populations were gated against CD45 and CD11b. The CD45+CD11b
+ cells were distributed into
two distinct CD11b+CD45
Low and CD11b
+CD45
Hi subsets (Figure 11 B, E). These subsets of
CD45 were further gated, against Ly-6C and Ly-6G. CD45Lo
cells, consisted of a single
population of Ly-6CLo
cells (Figure 11 C, F). In contrast among CD45Hi
cells, three distinct sub-
populations of Ly-6CLo
, Ly-6CHi
and neutrophils could be distinguished. Interestingly, the
number of CD45Hi
CD11b+Ly-6G
-Ly-6C
Lo (M2 monocytes/macrophages) was reduced under
hyperglycemic conditions. However, the numbers of CD45Lo
Ly-6CLo
, CD45Hi
Ly-6CHi
and
neutrophils remained unaffected (Figure 12).
Experiments and results
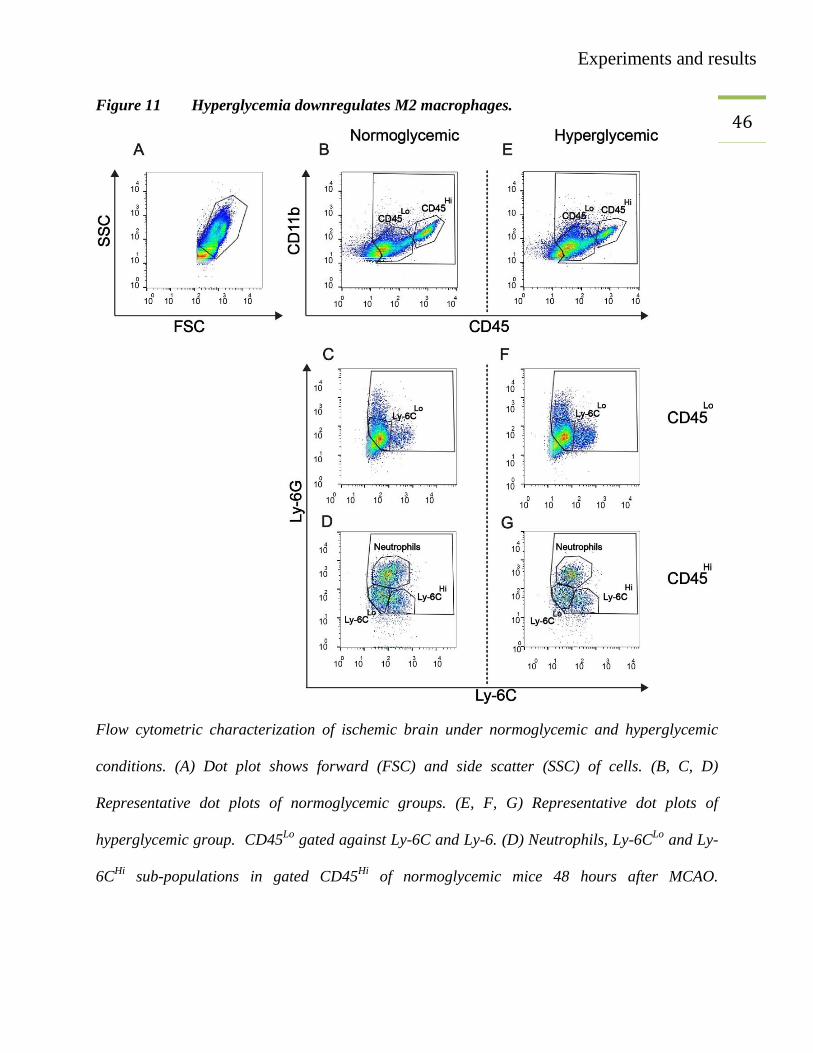
46 Figure 11 Hyperglycemia downregulates M2 macrophages.
Flow cytometric characterization of ischemic brain under normoglycemic and hyperglycemic
conditions. (A) Dot plot shows forward (FSC) and side scatter (SSC) of cells. (B, C, D)
Representative dot plots of normoglycemic groups. (E, F, G) Representative dot plots of
hyperglycemic group. CD45Lo
gated against Ly-6C and Ly-6. (D) Neutrophils, Ly-6CLo
and Ly-
6CHi
sub-populations in gated CD45Hi
of normoglycemic mice 48 hours after MCAO.

Experiments and results
47 (G) Neutrophils, Ly-6C
Lo and Ly-6C
Hi sub-populations in gated CD45
Hi of hyperglycemic mice
48 hours after MCAO.
Experiments and results
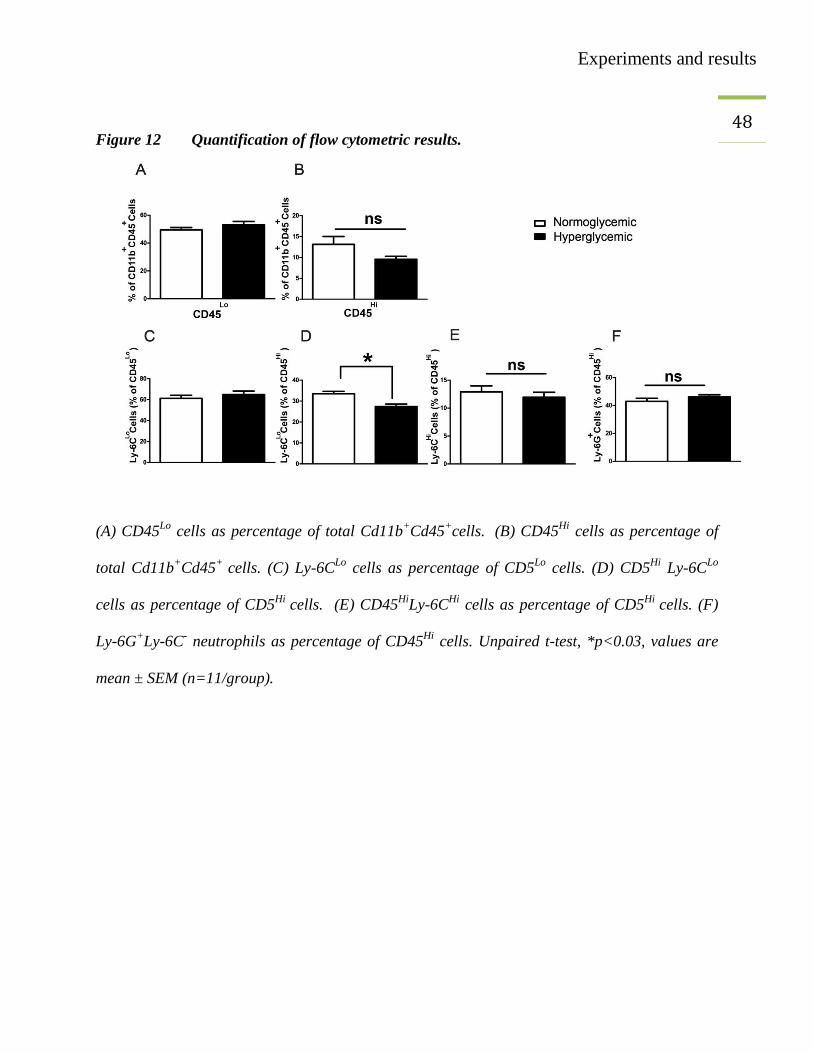
48
Figure 12 Quantification of flow cytometric results.
(A) CD45Lo
cells as percentage of total Cd11b+Cd45
+cells.
(B) CD45
Hi cells as percentage of
total Cd11b+Cd45
+ cells. (C) Ly-6C
Lo cells as percentage of CD5
Lo cells. (D) CD5
Hi Ly-6C
Lo
cells as percentage of CD5Hi
cells. (E) CD45Hi
Ly-6CHi
cells as percentage of CD5Hi
cells. (F)
Ly-6G+Ly-6C
- neutrophils as percentage of CD45
Hi cells. Unpaired t-test, *p<0.03, values are
mean ± SEM (n=11/group).
Experiments and results
49 3.5. Reduced number of arginase I (Arg I) expressing M2 macrophages
In vivo results and flow cytometry results were further confirmed by using immune fluorescence
microscopy techniques. A staining technique was established to identify the infiltrating
monocytes/macrophages. Arginase I is an important enzyme involved in the degradation of the
amino acid toxic product (arginine) to non-toxic one (ornithine). Arginase I expression is
induced in BMDC by Th2 cells, when BMDC are incubated with Th2 cells for 48 hours
(Munder, Eichmann et al. 1999). In this experiment, MCAO was performed in C57BL/6 mice,
under hyperglycemic and normoglycemic conditions. Forty-eight hours after MCAO surgery, the
mice were perfused and arginase I staining was performed. The imaging of stained slides was
performed with a fluorescence or a confocal microscope. Three regions of interests (ROI) were
defined on the periphery of the infarct. The double and single positive cells were counted by
using Fiji (NIH free software). The colocalization of Iba1 and arginase I was confirmed by
confocal imaging (Figure 13). The double positive arginase I and Iba1 cells were considered to
be M2 monocytes/macrophages corresponding to Ly-6CLo
cells, while single Iba1 positive cells
were considered as M1 macrophages corresponding to Ly-6CHi
cells. The immunefluorescence
microscopy also confirmed the reduced number of M2 macrophages in ischemic brains under
hyperglycemic conditions (Figure 13).
Experiments and results
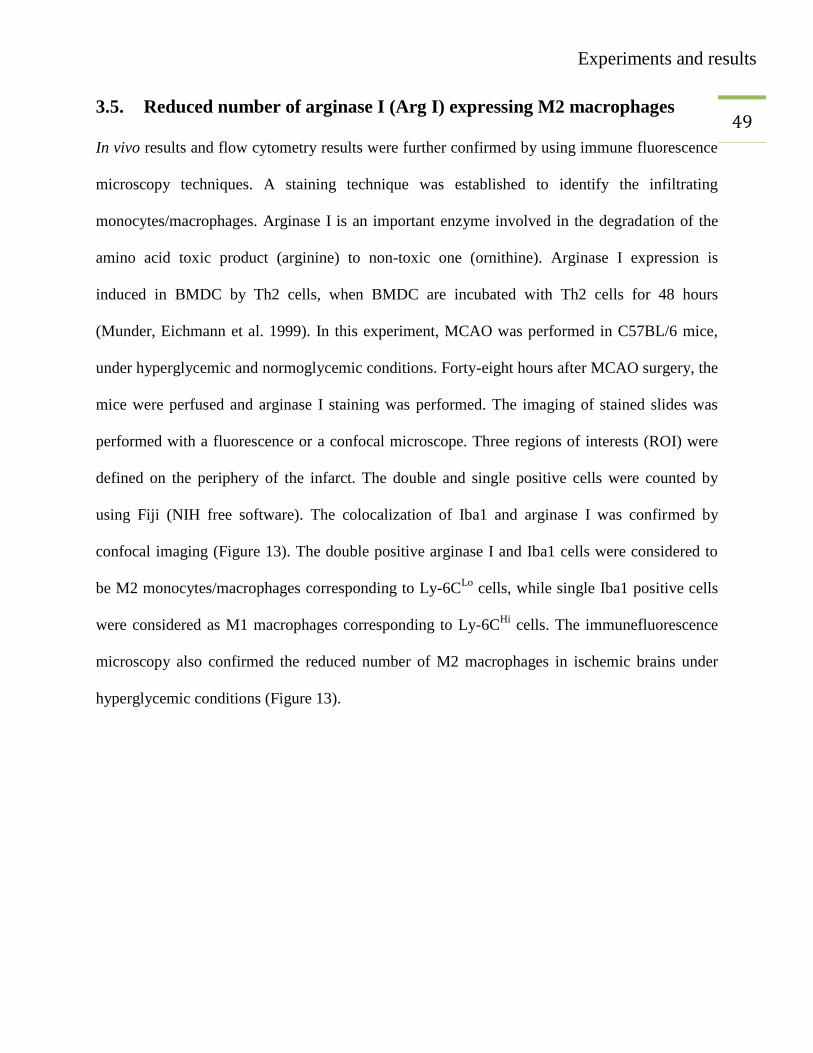
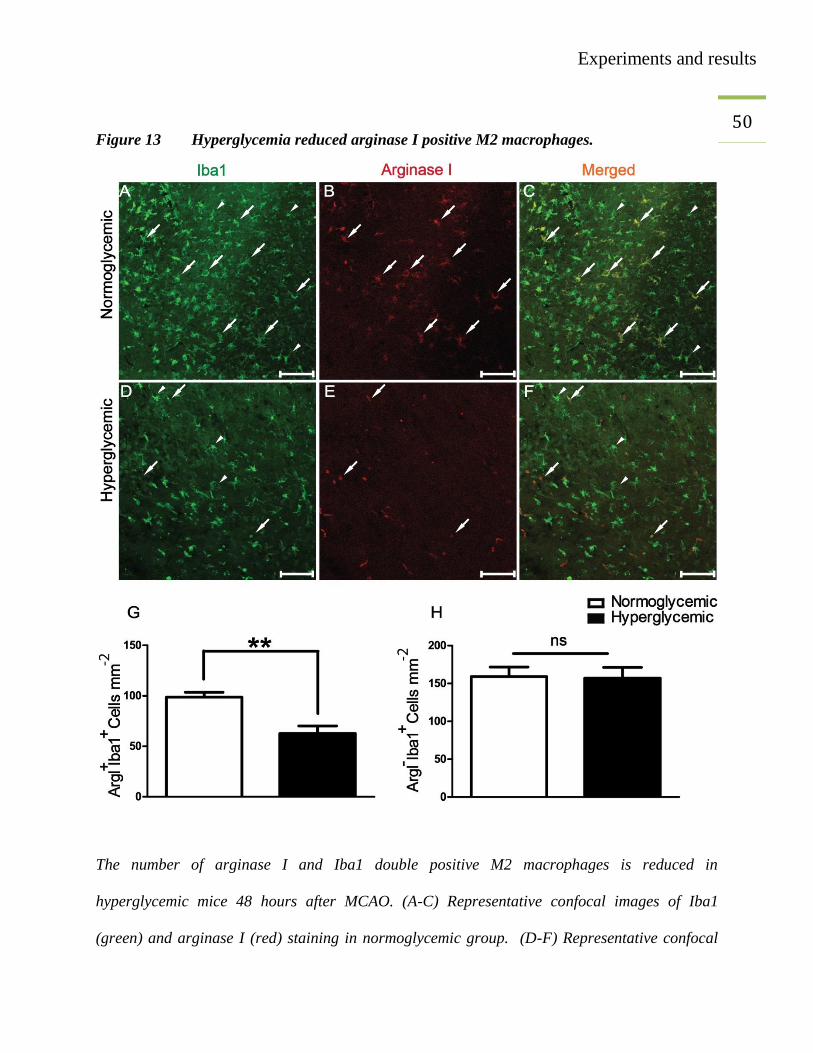
50
Figure 13 Hyperglycemia reduced arginase I positive M2 macrophages.
The number of arginase I and Iba1 double positive M2 macrophages is reduced in
hyperglycemic mice 48 hours after MCAO. (A-C) Representative confocal images of Iba1
(green) and arginase I (red) staining in normoglycemic group. (D-F) Representative confocal
Experiments and results
51 images of Iba1 (green) and arginase I (red) staining in the hyperglycemic group. White arrows
correspond to M2 monocytes/macrophages and white arrow-heads show M1
monocytes/macrophages. (G-H) Quantification of immune fluorescence microscopy results.
Unpaired t-test, **p<0.003, values are mean ± SEM. Scale bar, 100 µm (n=3-4/group).
Experiments and results
52 3.6. Identifying the role of monocytes/macrophages in hyperglycemic stroke
In different models of inflammation, macrophages perform inflammatory or anti-inflammatory
roles (Duffield, Forbes et al. 2005). To identify the role of monocytes/macrophages in brain after
induction of stroke, CD11b-DTR mice (n=4 in each group) were utilized, in which
monocytes/macrophages can be selectively ablated after administration of diphtheria toxin.
Diphtheria toxin was administered i.p (25 ng/g body weight) to both CD11b-DTR mice and their
littermate controls. Administration of diphtheria toxin 24 hours and 48 hours before analysis
ablated blood monocytes/macrophages. The ablation was confirmed by flow cytometry of blood
cells (Figure 14). No significant differences were observed in the accumulation of
CD45+Cd11b
+Ly-6G
+Ly-6C
- (neutrophils) (Figure 14 M). In contrast, Cd45
+Cd11b
+Ly-6C
+Ly-
6G-
(monocyte/macrophages) were significantly ablated (>80%) in CD11b-DTR mice treated
with diphtheria toxin, while the number of these cells remained unaffected in wild-type controls
or NaCl treated CD11b-DTR mice (Figure 14 K and L).

Experiments and results
53 Figure 14 Diphtheria toxin administration to wild-type controls and CD11b-DTR mice.

Experiments and results
54 Diphtheria toxin administration to wild-type controls and CD11b-DTR mice (A) Forward and
side scatter dot plots of the blood-cells. (B-G) Representative dot plots showing blood cells gated
against CD45 and CD11b. Upper right quadrant contains the CD45+CD11b
+ population of all
groups. (D-I) The CD45+CD11b
+ population gated against Ly-6C and Ly-6G to separate
neutrophils, Ly-6CHi
and Ly-6CLo
monocytes/macrophages. (J-M) Quantification of flow
cytometry results (n=10/group). A 100 µl of whole blood was used to count the cells.
Experiments and results
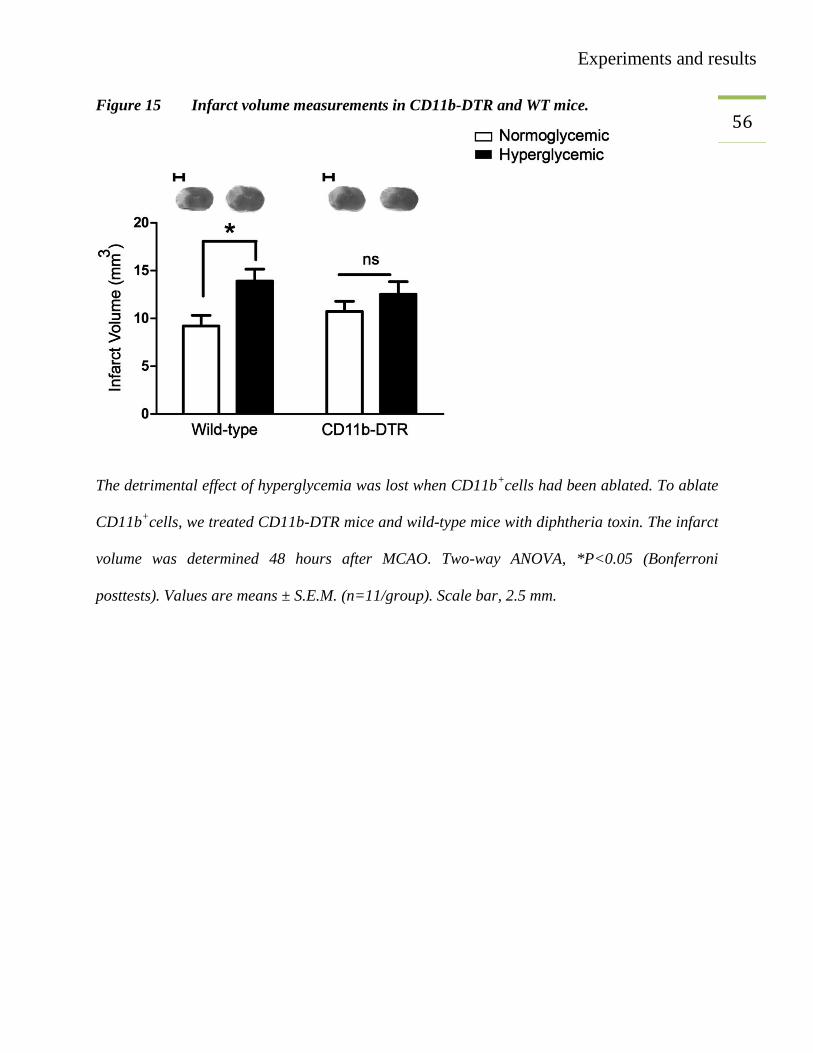
55 3.7. Measurement of infarct volume in CD11b-DTR
To identify the effect of monocytes/macrophages depletion on infarct volume, MCAO was
performed in CD-11b-DTR mice. Age- and gender-matched mice were randomly divided into
normoglycemic (NG) and hyperglycemic (HG) groups. All the mice were treated with diphtheria
toxin (25 ng/g body weight). Forty-eight hours after MCAO infarct volume was measured. The
results showed that the detrimental effect of hyperglycemia was lost in diphtheria toxin treated
CD11b-DTR mice (Figure 15), nevertheless the infarct size in wild-type mice was bigger in
hyperglycemic mice than that of normoglycemic mice (Figure 15).
Experiments and results
56 Figure 15 Infarct volume measurements in CD11b-DTR and WT mice.
The detrimental effect of hyperglycemia was lost when CD11b+cells had been ablated. To ablate
CD11b+cells, we treated CD11b-DTR mice and wild-type mice with diphtheria toxin. The infarct
volume was determined 48 hours after MCAO. Two-way ANOVA, *P<0.05 (Bonferroni
posttests). Values are means ± S.E.M. (n=11/group). Scale bar, 2.5 mm.
Experiments and results
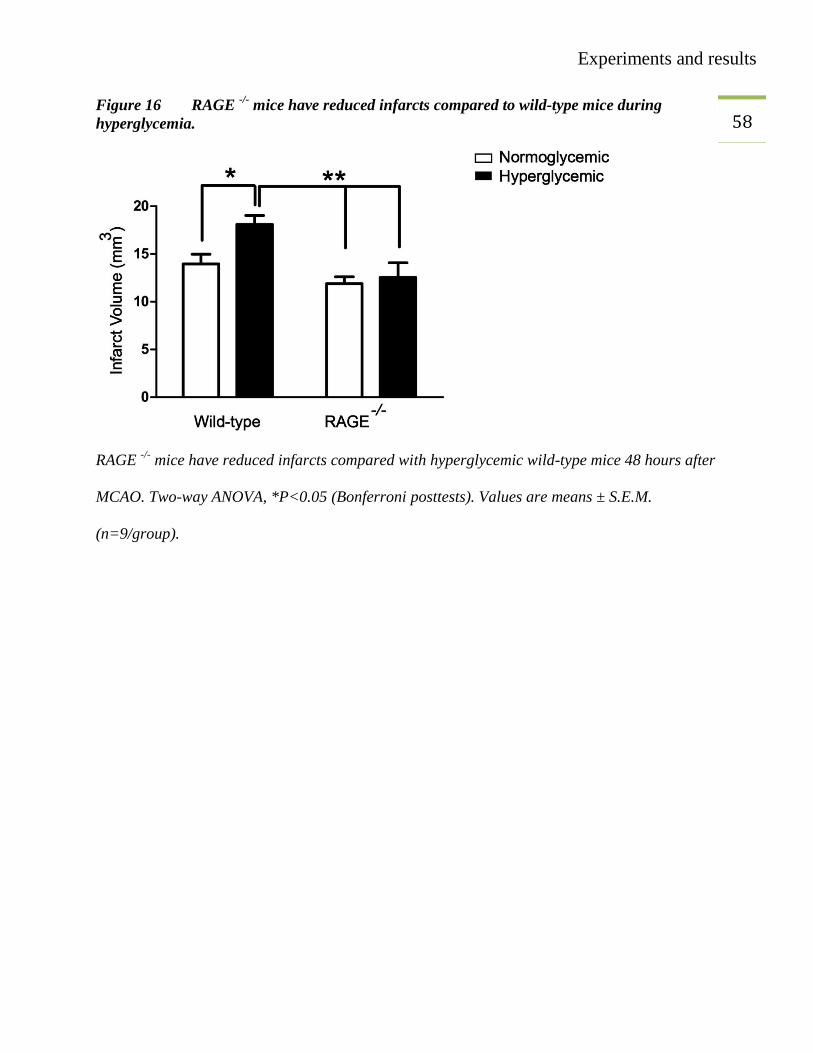
57 3.8. Measurement of infarct volume in RAGE
-/-
To identify the involvement of RAGE in hyperglycemic stroke we sought to perform an MCAO
experiment in RAGE-/-
mice. We used 8-10 weeks old RAGE-/-
mice and performed MCAO
under normoglycemic and hyperglycemic conditions. Forty-eight hours after MCAO, mice were
perfused and brains were harvested. Infarct volume measurement showed that hyperglycemic
wild-type mice had significantly bigger infarcts than animals in the normoglycemic and
hyperglycemic RAGE-/-
group (Figure 16). Therefore, RAGE mediates the detrimental effect of
hyperglycemia in focal cerebral ischemia.
Experiments and results
58 Figure 16 RAGE
-/- mice have reduced infarcts compared to wild-type mice during
hyperglycemia.
RAGE -/-
mice have reduced infarcts compared with hyperglycemic wild-type mice 48 hours after
MCAO. Two-way ANOVA, *P<0.05 (Bonferroni posttests). Values are means ± S.E.M.
(n=9/group).
Discussion
59 4. DISCUSSION
4.1. Rodent stroke models
Different rodent models of cerebral ischemia have been used to study the pathophysiology of
stroke. The focal (stroke) and global (cardiac arrest) model represent major types of cerebral
ischemia. Focal cerebral ischemia is further divided into transient and permanent stroke models
(Sicard and Fisher 2009). The choice of a suitable stroke model plays an important role to
validate the findings of a preclinical research. In this study, we used a permanent stroke model in
mice. In this model, we occluded the distal middle cerebral artery (MCA) permanently. The
permanent stroke results in a region of severe damage (ischemic core) which is surrounded by a
region of less damage (penumbra). The core is a region which is unable to resist stroke
conditions, and the region near the periphery of the infarct is called as penumbra (Bandera,
Botteri et al. 2006). The permanent stroke model is advantageous, for example, because of high
reproducibility and low mortality rate. The consequence of cerebral ischemia is to reduce the
access of oxygen and glucose to the brain tissue. This decline in the supply of essential nutrients
to the brain increases the brain damage after ischemia (Traystman 2003). This shows that
glucose and oxygen are essential for the integrity of the brain. On the other hand, excess of
glucose (hyperglycemia) causes more damage to the ischemic brain instead of being useful. To
understand the glucose paradox, this study was conducted.
Discussion
60
4.2. Hyperglycemic stroke
Hyperglycemia is considered to be an independent risk factor for stroke (Jorgensen, Nakayama et
al. 1994; Wannamethee, Perry et al. 1999; Ahmed, Davalos et al. 2010; Fang, Zhang et al. 2013).
Hyperglycemia worsens the stroke outcome by different mechanisms that include reduced blood
flow to penumbra (Dandona, James et al. 1978; Duckrow, Beard et al. 1985; Kawai, Keep et al.
1998) modifications in brain metabolism (Folbergrova, Memezawa et al. 1992) increased edema
(Berger and Hakim 1986) and most significantly glucose facilitated oxidative stress (Mohanty,
Hamouda et al. 2000). In animal stroke models, it has been indicated that rising glucose levels to
10, 15 or 20 mmol/L have an effect in increasing the infarct volume and apoptosis after stroke
(Rizk, Rafols et al. 2006; Won, Tang et al. 2011). In vitro data have also shown that 12-15
mmol/L glucose is sufficient to provide hyperglycemic conditions during cell-culture (Krankel,
Adams et al. 2005). In our study, a single intraperitoneal injection of 25% glucose (200 µl)
before MCAO was able to induce acute hyperglycemia in mice. In humans due to a generalized
stress response after stroke, the HPA axis is stimulated that increases the glucose production by
different mechanism (Kruyt, Biessels et al. 2010) and ultimately the stroke patients are
hyperglycemic (Ziegler and Herman 2002; Kruyt, Biessels et al. 2010). This is why we
administered glucose immediately before MCAO to induce acute hyperglycemia. Thirty minutes
and 50 minutes after the glucose injection, the blood glucose levels were found to be elevated up
to ± 260 mg/dl (14.66 mmol/L) in hyperglycemic mice. These conditions correspond to a clinical
situation, in which admission hyperglycemia is observed in stroke patients (Ahmed, Davalos et
al. 2010). Forty-eight hours after MCAO, the infarct volume was measured, and it was
significantly larger in HG groups than that in NG counterparts. Our results suggest that higher
Discussion
61 plasma levels of glucose at the time of ischemia play a crucial role in increasing the infarct size.
These data are also consistent with previous findings (Yip, He et al. 1991). In the ischemic brain,
there is a region which has very low blood supply after ischemia but still enough to maintain its
metabolic functions. This region is called penumbra. Hyperglycemia increases the risk of
damage to the penumbra because of increased lactic acid production and damage to the blood-
brain barrier (Parsons, Barber et al. 2002).
According to the European stroke organization (ESO) 2008 guideline under the section of good
clinical practice (GCP), it is recommended to lower high blood glucose (>180 mg/dl or 10 mM)
with insulin titrations and in case of hypoglycemia (<50 mg/dl or 2.8 mM) to treat with i.v
dextrose or 10-20% glucose infusion (Anonymous 2008).
Discussion
62 4.3. Role of infiltrating immune cells after cerebral ischemia
Blood leukocytes and microglia are activated after the stroke, and these cells migrate to the brain
tissue subsequently leading to brain injury (Wang, Tang et al. 2007). After microglial activation,
there is a release of different chemokines that attract blood-derived leukocytes to the site of
inflammation. Monocyte chemoattractant protein 1 (CCL2/MCP-1) is one of those chemokines
that attracts monocytes-derived cells (Hinojosa, Garcia-Bueno et al. 2011). It has been shown
previously that infiltration of immature Ly-6CHi
monocytes (M1-macrophages) and their
polarization into mature Ly-6CLo
(M2-macrophages) starts as early as 24 hours after MCAO
(Gliem, Mausberg et al. 2012).
Macrophages are found at the sites of brain injury where they stimulate both injury and repair.
Therefore, the involvement of M1/M2 macrophages cannot be ignored (Kigerl, Gensel et al.
2009). It has also been reported that intense infiltration of immune cells in the brain occurs quiet
early after stroke and this infiltration of cells is more pronounced in the absence of reperfusion
(Chu, Kim et al. 2014). Previously, we have shown that the ß-hydroxy butyrate (BHB) receptor
HCA2 (GPR109) activates a neuroprotective subset of macrophages. We used Hca2-/-
, HCA2mRFP
and wild-type mice. BHB administration reduced the infarct volume in wild-type mice, but the
protective effect was lost in Hca2-/-
mice. In parallel, BHB treatment improved to sensory-motor
function as shown by the corner test. Nicotinic acid is an agonist of the HCA2 receptor. The
nicotinic acid treatment also reduced infarct volume and neurological outcome after MCAO. To
identify the location of HCA2 receptor, we generated chimeric mice. In those mice, wild-type
bone-marrow was transplanted to HCA2mRF
(WT > HCA2mRF
) and HCA2mRF
bone-marrow was
transplanted to wild-type mice (HCA2mRFP
> WT). Immunofluorescence microscopy confirmed
that the HCA2 receptor is located on bone-marrow derived monocytes/macrophages infiltrating

Discussion
63 the brain. Flow cytometry showed that these cells are Ly-6C
Lo monocytes/macrophages. The
analysis of mRFP+ cells, in the brain, was performed 24 hours and 48 hours after MCAO.
4.4. Hyperglycemia downregulates M2 macrophages
Keeping in view the role of immune cells in general, and M2 macrophages in particular, we
intended to investigate infiltrating immune cells in the brain after MCAO under normoglycemic
and hyperglycemic conditions. Forty-eight hours after MCAO mice were perfused with Ringer’s
lactate and brain cells preparation was done. The brain cells were stained with antibodies against
CD45, CD-11b, Ly-6C and Ly-6G. Flow cytometry was used to distinguish different cell-
populations. These data have proved that under hyperglycemic conditions, CD45Hi
Ly-6CLo
cells
(M2 macrophages) are reduced while the number of CD45Lo
, CD45Hi
, Ly-6CHi
and neutrophils
remained unchanged.
4.5. Hyperglycemia reduces arginase I expressing M2-macrophages
Arginases are the group of enzymes involved in the breakdown of arginine to ornithine and urea.
Two isoforms of arginase were found, one in cytosolic fractions (Arginase I, Liver arginase) and
the other in mitochondrial fractions (Arginase II, kidney arginase) (Jackson, Beaudet et al. 1986).
It has been reported that in mouse embryonic development arginases are required and arginase I
is the most important form needed (Yu, Iyer et al. 2002). An imbalance in the expression of
arginase I isoform, may also cause endothelial dysfunction in the chronic intermittent hypoxia
(CIH) rats (Krause, Del Rio et al. 2015). It has been reported that the macrophage-specific
expression of arginase I is anti-inflammatory and promotes tissue repair after injury (Pesce,
Ramalingam et al. 2009). Arginase I is also specifically expressed by M2 macrophages in the
spinal cord after a spinal cord injury (SCI) (Pomeshchik, Kidin et al. 2015). Many other diseases
Discussion
64 also confirmed the involvement of arginases (Sindrilaru, Peters et al. 2011; Munro, Perreau et al.
2012; Hochstedler, Leidinger et al. 2013; Turtzo, Lescher et al. 2014). To see a potential effect
of hyperglycemia on arginase I expressing cells after stroke, we used Iba1 and arginase I staining
on brain sections. Forty-eight hours after MCAO the mice were perfused with Ringer’s lactate
followed by PFA perfusion and post-fixation. We found macrophagic and microglial responses
with features of mixed populations of M1 and M2 phenotypes. Arginase I and Iba1 staining
confirmed that the double-positive cells are M2 monocytes/macrophages, while the single Iba1
positive cells were considered as M1 macrophages. Quantitative analysis has shown that after
MCAO, the number of arginase I expressing cells is reduced under hyperglycemic conditions in
comparison to normoglycemic conditions.
Discussion
65 4.6. Role of monocytes/macrophages in hyperglycemic stroke
Conditional ablation of monocytes/macrophages in CD11b-DTR mice is a nice tool to study their
role in different diseases. We investigated CD11b-DTR mice and their littermate controls. In
these mice, monocytes/macrophages express the human diphtheria toxin receptor under the
control of the CD11b promoter (Cailhier, Partolina et al. 2005). The sensitivity of human DTR to
diphtheria toxin is 103 to 10
5-times higher than mouse DTR. Therefore, when the human DTR is
expressed in the mouse, the cells will die in the presence of diphtheria toxin (Chow, Brown et al.
2011). Different studies have confirmed that this technique is used to deplete
monocytes/macrophages not only in the peripheral blood but also in different tissues (Cailhier,
Sawatzky et al. 2006; Stoneman, Braganza et al. 2007). Therefore using macrophage ablation
techniques, throws light on the role of monocytes/macrophages in ischemic stroke under
hyperglycemic conditions. We have provided evidence that M2 macrophages are reduced under
HG conditions 48 hours after MCAO and these cells are positive for CD11b and Iba1. The Iba1
co-expression showed these cells resemble the morphology of resident macrophages/microglia.
After diphtheria toxin administration, there was approximately 80% depletion of blood
monocytes/macrophages. The depletion of peripheral monocytes/macrophages was confirmed by
flow cytometry of blood cells. Infarct volume measurements showed that hyperglycemic wild-
type mice had larger infarcts while this increase in the infarct volume was lost if diphtheria toxin
was administered to CD11b-DTR mice. These data confirm the involvement of
monocytes/macrophages in controlling the infarct volume under hyperglycemic conditions.
These data are also consistent with our previous finding in which nicotinic acid was unable to
perform neuroprotective action in the diphtheria toxin treated CD11b-DTR mice, because the
HCA2 receptor for nicotinic acid was found to be located on Ly-6CLo
cells.
Discussion
66 4.7. RAGE mediates the ischemic brain damage
Our study indicates that RAGE mediates the ischemic brain injury under hyperglycemic
conditions. RAGE is a multiligand receptor found on neurons, glia and endothelial cells (Deane,
Du Yan et al. 2003). Its role in increasing the brain damage after cerebral ischemia has also been
proved (Muhammad, Barakat et al. 2008). The expression of RAGE is increased in the presence
of its ligands (Chavakis, Bierhaus et al. 2004). The ligands for RAGE are high mobility box 1
(HMGB1), S100 proteins, amyloid beta peptide (Aß peptide) and several damage-associated
molecular pattern molecules (DAMPs) released during tissue damage (Sessa, Gatti et al. 2014).
RAGE is expressed by almost all the cells in the brain and its activation leads to formation of
reactive oxygen species (ROS). Therefore, an indirect involvement of RAGE in increasing the
infarct size is also possible (Yan, Chen et al. 1996; Muhammad, Barakat et al. 2008). In vitro
data have reported a hyper-responsive phenotype of human monocytes which produce a burst of
superoxide (O2-) under hyperglycemic conditions. RAGE is involved in inducing O2
- generation
by its ligand S100B (Ding, Kantarci et al. 2007). The presence of S100B, a RAGE ligand, has
been reported in the brain, white fat and testes of diabetic patients (Zimmer, Chessher et al.
1997).
In this study, we have observed significantly reduced infarct volumes in RAGE-/-
mice under NG
and HG conditions and also the number of M2 monocytes/macrophages is reduced in the
hyperglycemic ischemic brains. Therefore, there might be involvement of another phenotype of
monocytes that expresses RAGE and increases oxidative stress under hyperglycemic conditions.
It can be concluded that in the absence of RAGE, the glycated products are unable to induce
cellular disorders or oxidative stress under hyperglycemic conditions

Discussion
67 5. CONCLUSION
These data confirm that the M2 monocyte/macrophages are depleted under hyperglycemic
conditions and this plays a role in deteriorating the stroke outcome.
Discussion
68 6. FUTURE PERSPECTIVE
Considering the hyperglycemic conditions as a predictor of bad stroke outcome, it has been
suggested to improve the metabolic conditions by lowering glucose levels. Insulin therapy can be
an option (Bruno, Liebeskind et al. 2010; McCormick, Hadley et al. 2010).
AGEs worsen the stroke outcome by interacting with RAGE. Expression of RAGE is
upregulated in diabetic patients due to increased levels of its ligands. Therefore, reduction in the
level of these compounds can be helpful in reducing the brain damage in stroke patients. Soluble
RAGE (sRAGE) is a shortened form of RAGE that inhibits the AGE- mediated signaling by
acting as a scavenger (Kankova, Kalousova et al. 2008). Therefore, administration of sRAGE or
HMGB1 antagonist would be alternative ways to ameliorate the AGE-RAGE or HMGB1-RAGE
mediated brain damage respectively (Muhammad, Barakat et al. 2008).
There is a need for further studies to investigate the mechanism of the involvement of RAGE in
mediating the brain damage. The role of the ligands for RAGE (S100A8/S100A9, S100B, and
HMGB1) needs to be defined under HG conditions.
The arginase I expression in the ischemic brain is decreased under hyperglycemic conditions and
this confirms a lower number of the M2 macrophages. A strategy could be to stimulate the
polarization of M2 macrophages. These macrophages would play an important role in reducing
hyperglycemic infarcts by promoting the healing process. There is a need for in vitro studies
concerning the expression analysis of macrophage colony stimulating factor (MCSF) or CCL2
under hyperglycemic conditions.
Use of antioxidants that may inhibit NF-kB pathway in diabetic patients might be helpful in
reducing the inflammation (Hofmann, Schiekofer et al. 1999).
References
69 7. REFERENCES
"Hilfsmittel zur Fallzahlplanung." Retrieved 01.01.2012, 2012, from http://www.uni-
heidelberg.de/md/tier-schutz/tierschutz/info_planungshilfe.pdf.
Ahmad, M., S. Saleem, et al. (2010). "The PGE2 EP2 receptor and its selective activation are
beneficial against ischemic stroke." Exp Transl Stroke Med 2(1): 12.
Ahmad, M., S. Saleem, et al. (2006). "1-hydroxyPGE reduces infarction volume in mouse
transient cerebral ischemia." Eur J Neurosci 23(1): 35-42.
Ahmed, N., A. Davalos, et al. (2010). "Association of admission blood glucose and outcome in
patients treated with intravenous thrombolysis: results from the Safe Implementation of
Treatments in Stroke International Stroke Thrombolysis Register (SITS-ISTR)." Arch
Neurol 67(9): 1123-1130.
Allport, L. E., K. S. Butcher, et al. (2004). "Insular cortical ischemia is independently associated
with acute stress hyperglycemia." Stroke 35(8): 1886-1891.
Anderson, R. E., W. K. Tan, et al. (1999). "Effects of glucose and PaO2 modulation on cortical
intracellular acidosis, NADH redox state, and infarction in the ischemic penumbra."
Stroke 30(1): 160-170.
Anonymous (2008). "Guidelines for management of ischaemic stroke and transient ischaemic
attack 2008." Cerebrovasc Dis 25(5): 457-507.
Auffray, C., M. H. Sieweke, et al. (2009). "Blood monocytes: development, heterogeneity, and
relationship with dendritic cells." Annu Rev Immunol 27: 669-692.
Bandera, E., M. Botteri, et al. (2006). "Cerebral blood flow threshold of ischemic penumbra and
infarct core in acute ischemic stroke: a systematic review." Stroke 37(5): 1334-1339.
Bargiotas, P., S. Muhammad, et al. (2012). "Connexin 36 promotes cortical spreading
depolarization and ischemic brain damage." Brain Res 1479: 80-85.
Beretta, S., M. Riva, et al. (2013). "Optimized system for cerebral perfusion monitoring in the rat
stroke model of intraluminal middle cerebral artery occlusion." J Vis Exp(72).
Berger, L. and A. M. Hakim (1986). "The association of hyperglycemia with cerebral edema in
stroke." Stroke 17(5): 865-871.
Broughton, B. R., D. C. Reutens, et al. (2009). "Apoptotic mechanisms after cerebral ischemia."
Stroke 40(5): e331-339.
Brownlee, M. (1995). "Advanced protein glycosylation in diabetes and aging." Annu Rev Med
46: 223-234.
Bruno, A., D. Liebeskind, et al. (2010). "Diabetes mellitus, acute hyperglycemia, and ischemic
stroke." Curr Treat Options Neurol 12(6): 492-503.
Cailhier, J. F., M. Partolina, et al. (2005). "Conditional macrophage ablation demonstrates that
resident macrophages initiate acute peritoneal inflammation." J Immunol 174(4): 2336-
2342.
References
70 Cailhier, J. F., D. A. Sawatzky, et al. (2006). "Resident pleural macrophages are key
orchestrators of neutrophil recruitment in pleural inflammation." Am J Respir Crit Care
Med 173(5): 540-547.
Casals, J. B., N. C. Pieri, et al. (2011). "The use of animal models for stroke research: a review."
Comp Med 61(4): 305-313.
Chavakis, T., A. Bierhaus, et al. (2004). "RAGE (receptor for advanced glycation end products):
a central player in the inflammatory response." Microbes Infect 6(13): 1219-1225.
Chow, A., B. D. Brown, et al. (2011). "Studying the mononuclear phagocyte system in the
molecular age." Nat Rev Immunol 11(11): 788-798.
Chu, H. X., H. A. Kim, et al. (2014). "Immune cell infiltration in malignant middle cerebral
artery infarction: comparison with transient cerebral ischemia." J Cereb Blood Flow
Metab 34(3): 450-459.
Counsell, C., M. McDowall, et al. (1997). "Hyperglycaemia after acute stroke. Other models find
that hyperglycaemia is not independent predictor." BMJ 315(7111): 810; author reply
811.
Dal-Secco, D., J. Wang, et al. (2015). "A dynamic spectrum of monocytes arising from the in
situ reprogramming of CCR2+ monocytes at a site of sterile injury." J Exp Med 212(4):
447-456.
Dandona, P., I. M. James, et al. (1978). "Cerebral blood flow in diabetes mellitus: evidence of
abnormal cerebrovascular reactivity." Br Med J 2(6133): 325-326.
Davis, M. F., C. Lay, et al. (2013). "Permanent cerebral vessel occlusion via double ligature and
transection." J Vis Exp(77).
Deane, R., S. Du Yan, et al. (2003). "RAGE mediates amyloid-beta peptide transport across the
blood-brain barrier and accumulation in brain." Nat Med 9(7): 907-913.
Dietrich, W. D., M. D. Ginsberg, et al. (1986). "Photochemically induced cortical infarction in
the rat. 2. Acute and subacute alterations in local glucose utilization." J Cereb Blood
Flow Metab 6(2): 195-202.
Ding, Y., A. Kantarci, et al. (2007). "Activation of RAGE induces elevated O2- generation by
mononuclear phagocytes in diabetes." J Leukoc Biol 81(2): 520-527.
Dirnagl, U., C. Iadecola, et al. (1999). "Pathobiology of ischaemic stroke: an integrated view."
Trends Neurosci 22(9): 391-397.
Duckrow, R. B., D. C. Beard, et al. (1985). "Regional cerebral blood flow decreases during
hyperglycemia." Ann Neurol 17(3): 267-272.
Duffield, J. S., S. J. Forbes, et al. (2005). "Selective depletion of macrophages reveals distinct,
opposing roles during liver injury and repair." J Clin Invest 115(1): 56-65.
Fang, Y., S. Zhang, et al. (2013). "Hyperglycaemia in acute lacunar stroke: a Chinese hospital-
based study." Diab Vasc Dis Res 10(3): 216-221.
Folbergrova, J., H. Memezawa, et al. (1992). "Focal and perifocal changes in tissue energy state
during middle cerebral artery occlusion in normo- and hyperglycemic rats." J Cereb
Blood Flow Metab 12(1): 25-33.
References
71 Galli, S. J., N. Borregaard, et al. (2011). "Phenotypic and functional plasticity of cells of innate
immunity: macrophages, mast cells and neutrophils." Nat Immunol 12(11): 1035-1044.
Garg, R., A. Chaudhuri, et al. (2006). "Hyperglycemia, insulin, and acute ischemic stroke: a
mechanistic justification for a trial of insulin infusion therapy." Stroke 37(1): 267-273.
Gliem, M., A. K. Mausberg, et al. (2012). "Macrophages prevent hemorrhagic infarct
transformation in murine stroke models." Ann Neurol 71(6): 743-752.
Goldin, A., J. A. Beckman, et al. (2006). "Advanced glycation end products: sparking the
development of diabetic vascular injury." Circulation 114(6): 597-605.
Gordon, S. and P. R. Taylor (2005). "Monocyte and macrophage heterogeneity." Nat Rev
Immunol 5(12): 953-964.
Hanson, J., A. Gille, et al. (2010). "Nicotinic acid- and monomethyl fumarate-induced flushing
involves GPR109A expressed by keratinocytes and COX-2-dependent prostanoid
formation in mice." J Clin Invest 120(8): 2910-2919.
Hinojosa, A. E., B. Garcia-Bueno, et al. (2011). "CCL2/MCP-1 modulation of microglial
activation and proliferation." J Neuroinflammation 8: 77.
Hochstedler, C. M., M. R. Leidinger, et al. (2013). "Immunohistochemical detection of arginase-
I expression in formalin-fixed lung and other tissues." J Histotechnol 36(4): 128-134.
Hofmann, M. A., S. Schiekofer, et al. (1999). "Peripheral blood mononuclear cells isolated from
patients with diabetic nephropathy show increased activation of the oxidative-stress
sensitive transcription factor NF-kappaB." Diabetologia 42(2): 222-232.
Iadecola, C. and J. Anrather (2011). "The immunology of stroke: from mechanisms to
translation." Nat Med 17(7): 796-808.
Ingersoll, M. A., A. M. Platt, et al. (2011). "Monocyte trafficking in acute and chronic
inflammation." Trends Immunol 32(10): 470-477.
Jackson, M. J., A. L. Beaudet, et al. (1986). "Mammalian urea cycle enzymes." Annu Rev Genet
20: 431-464.
Jin, R., G. Yang, et al. (2010). "Inflammatory mechanisms in ischemic stroke: role of
inflammatory cells." J Leukoc Biol 87(5): 779-789.
Jorgensen, H., H. Nakayama, et al. (1994). "Stroke in patients with diabetes. The Copenhagen
Stroke Study." Stroke 25(10): 1977-1984.
Kankova, K., M. Kalousova, et al. (2008). "Soluble RAGE, diabetic nephropathy and genetic
variability in the AGER gene." Arch Physiol Biochem 114(2): 111-119.
Kawai, N., R. F. Keep, et al. (1998). "Hyperglycemia induces progressive changes in the cerebral
microvasculature and blood-brain barrier transport during focal cerebral ischemia." Acta
Neurochir Suppl 71: 219-221.
Kiefer, A. S., T. Fleming, et al. (2014). "Methylglyoxal concentrations differ in standard and
washed neonatal packed red blood cells." Pediatr Res 75(3): 409-414.
Kigerl, K. A., J. C. Gensel, et al. (2009). "Identification of two distinct macrophage subsets with
divergent effects causing either neurotoxicity or regeneration in the injured mouse spinal
cord." J Neurosci 29(43): 13435-13444.
References
72 Kirby, A., V. Gebski, et al. (2002). "Determining the sample size in a clinical trial." Med J Aust
177(5): 256-257.
Kissela, B. M., J. Khoury, et al. (2005). "Epidemiology of ischemic stroke in patients with
diabetes: the greater Cincinnati/Northern Kentucky Stroke Study." Diabetes Care 28(2):
355-359.
Krankel, N., V. Adams, et al. (2005). "Hyperglycemia reduces survival and impairs function of
circulating blood-derived progenitor cells." Arterioscler Thromb Vasc Biol 25(4): 698-
703.
Krause, B. J., R. Del Rio, et al. (2015). "Arginase-endothelial nitric oxide synthase imbalance
contributes to endothelial dysfunction during chronic intermittent hypoxia." J Hypertens
33(3): 515-524.
Kruyt, N. D., G. J. Biessels, et al. (2010). "Hyperglycemia in acute ischemic stroke:
pathophysiology and clinical management." Nat Rev Neurol 6(3): 145-155.
Matz, K., K. Keresztes, et al. (2006). "Disorders of glucose metabolism in acute stroke patients:
an underrecognized problem." Diabetes Care 29(4): 792-797.
McCormick, M., D. Hadley, et al. (2010). "Randomized, controlled trial of insulin for acute
poststroke hyperglycemia." Ann Neurol 67(5): 570-578.
McTigue, D. M., M. Tani, et al. (1998). "Selective chemokine mRNA accumulation in the rat
spinal cord after contusion injury." J Neurosci Res 53(3): 368-376.
Mecca, A. P., R. W. Regenhardt, et al. (2011). "Cerebroprotection by angiotensin-(1-7) in
endothelin-1-induced ischaemic stroke." Exp Physiol 96(10): 1084-1096.
Mohanty, P., W. Hamouda, et al. (2000). "Glucose challenge stimulates reactive oxygen species
(ROS) generation by leucocytes." J Clin Endocrinol Metab 85(8): 2970-2973.
Mosser, D. M. and J. P. Edwards (2008). "Exploring the full spectrum of macrophage
activation." Nat Rev Immunol 8(12): 958-969.
Moulin, T., L. Tatu, et al. (1997). "The Besancon Stroke Registry: an acute stroke registry of
2,500 consecutive patients." Eur Neurol 38(1): 10-20.
Muhammad, S., W. Barakat, et al. (2008). "The HMGB1 receptor RAGE mediates ischemic
brain damage." J Neurosci 28(46): 12023-12031.
Munder, M., K. Eichmann, et al. (1999). "Th1/Th2-regulated expression of arginase isoforms in
murine macrophages and dendritic cells." J Immunol 163(7): 3771-3777.
Munro, K. M., V. M. Perreau, et al. (2012). "Differential gene expression in the EphA4 knockout
spinal cord and analysis of the inflammatory response following spinal cord injury."
PLoS One 7(5): e37635.
Murray, P. J. and T. A. Wynn (2011). "Protective and pathogenic functions of macrophage
subsets." Nat Rev Immunol 11(11): 723-737.
Okouchi, M., O. Ekshyyan, et al. (2007). "Neuronal apoptosis in neurodegeneration." Antioxid
Redox Signal 9(8): 1059-1096.
References
73 Parsons, M. W., P. A. Barber, et al. (2002). "Acute hyperglycemia adversely affects stroke
outcome: a magnetic resonance imaging and spectroscopy study." Ann Neurol 52(1): 20-
28.
Passlick, B., D. Flieger, et al. (1989). "Identification and characterization of a novel monocyte
subpopulation in human peripheral blood." Blood 74(7): 2527-2534.
Pesce, J. T., T. R. Ramalingam, et al. (2009). "Arginase-1-expressing macrophages suppress Th2
cytokine-driven inflammation and fibrosis." PLoS Pathog 5(4): e1000371.
Pomeshchik, Y., I. Kidin, et al. (2015). "Interleukin-33 treatment reduces secondary injury and
improves functional recovery after contusion spinal cord injury." Brain Behav Immun 44:
68-81.
Rahman, M., S. Muhammad, et al. (2014). "The β-hydroxybutyrate receptor HCA2 activates a
neuroprotective subset of macrophages." Nat Commun 5.
Rizk, N. N., J. A. Rafols, et al. (2006). "Cerebral ischemia-induced apoptosis and necrosis in
normal and diabetic rats: effects of insulin and C-peptide." Brain Res 1096(1): 204-212.
Robbins, N. M. and R. A. Swanson (2014). "Opposing effects of glucose on stroke and
reperfusion injury: acidosis, oxidative stress, and energy metabolism." Stroke 45(6):
1881-1886.
Robert K. Murray, D. K. G., Peter A. Mayes, Victor W. Rodwell (2003). Harper's Illustrated
Biochemistry, Lange Medical Books/McGraw-Hill, Medical Publishing Division.
Rogers, I. T., D. J. Holder, et al. (1999). "Influence of Blood Collection Sites on Plasma Glucose
and Insulin Concentration in Conscious C57BL/6 Mice." Contemp Top Lab Anim Sci
38(6): 25-28.
Serbina, N. V., T. Jia, et al. (2008). "Monocyte-mediated defense against microbial pathogens."
Annu Rev Immunol 26: 421-452.
Sessa, L., E. Gatti, et al. (2014). "The receptor for advanced glycation end-products (RAGE) is
only present in mammals, and belongs to a family of cell adhesion molecules (CAMs)."
PLoS One 9(1): e86903.
Shmonin, A., E. Melnikova, et al. (2014). "Characteristics of cerebral ischemia in major rat
stroke models of middle cerebral artery ligation through craniectomy." Int J Stroke 9(6):
793-801.
Sicard, K. M. and M. Fisher (2009). "Animal models of focal brain ischemia." Exp Transl Stroke
Med 1: 7.
Siesjo, B. K. (1978). "Brain energy metabolism and catecholaminergic activity in hypoxia,
hypercapnia and ischemia." J Neural Transm Suppl(14): 17-22.
Sindrilaru, A., T. Peters, et al. (2011). "An unrestrained proinflammatory M1 macrophage
population induced by iron impairs wound healing in humans and mice." J Clin Invest
121(3): 985-997.
Speetzen, L. J., M. Endres, et al. (2013). "Bilateral common carotid artery occlusion as an
adequate preconditioning stimulus to induce early ischemic tolerance to focal cerebral
ischemia." J Vis Exp(75): e4387.

References
74 Spencer, E. A., K. L. Pirie, et al. (2008). "Diabetes and modifiable risk factors for cardiovascular
disease: the prospective Million Women Study." Eur J Epidemiol 23(12): 793-799.
Spite, M. and C. N. Serhan (2010). "Novel lipid mediators promote resolution of acute
inflammation: impact of aspirin and statins." Circ Res 107(10): 1170-1184.
Srikanth, V., A. Maczurek, et al. (2011). "Advanced glycation endproducts and their receptor
RAGE in Alzheimer's disease." Neurobiol Aging 32(5): 763-777.
Stoneman, V., D. Braganza, et al. (2007). "Monocyte/macrophage suppression in CD11b
diphtheria toxin receptor transgenic mice differentially affects atherogenesis and
established plaques." Circ Res 100(6): 884-893.
Thornalley, P. J. (2005). "Dicarbonyl intermediates in the maillard reaction." Ann N Y Acad Sci
1043: 111-117.
Traystman, R. J. (2003). "Animal models of focal and global cerebral ischemia." ILAR J 44(2):
85-95.
Turtzo, L. C., J. Lescher, et al. (2014). "Macrophagic and microglial responses after focal
traumatic brain injury in the female rat." J Neuroinflammation 11: 82.
Vlassara, H., M. Brownlee, et al. (1981). "Nonenzymatic glycosylation of peripheral nerve
protein in diabetes mellitus." Proc Natl Acad Sci U S A 78(8): 5190-5192.
Wang, Q., X. N. Tang, et al. (2007). "The inflammatory response in stroke." J Neuroimmunol
184(1-2): 53-68.
Wannamethee, S. G., I. J. Perry, et al. (1999). "Nonfasting serum glucose and insulin
concentrations and the risk of stroke." Stroke 30(9): 1780-1786.
Watson, B. D., W. D. Dietrich, et al. (1985). "Induction of reproducible brain infarction by
photochemically initiated thrombosis." Ann Neurol 17(5): 497-504.
Weir, C. J., G. D. Murray, et al. (1997). "Is hyperglycaemia an independent predictor of poor
outcome after acute stroke? Results of a long-term follow up study." BMJ 314(7090):
1303-1306.
Weiss, J. and F. Zimmermann (1999). "Tribromoethanol (Avertin) as an anaesthetic in mice."
Lab Anim 33(2): 192-193.
Won, S. J., X. N. Tang, et al. (2011). "Hyperglycemia promotes tissue plasminogen activator-
induced hemorrhage by Increasing superoxide production." Ann Neurol 70(4): 583-590.
Yan, S. D., X. Chen, et al. (1996). "RAGE and amyloid-beta peptide neurotoxicity in
Alzheimer's disease." Nature 382(6593): 685-691.
Yip, P. K., Y. Y. He, et al. (1991). "Effect of plasma glucose on infarct size in focal cerebral
ischemia-reperfusion." Neurology 41(6): 899-905.
Yu, H., R. K. Iyer, et al. (2002). "Arginase expression in mouse embryonic development." Mech
Dev 115(1-2): 151-155.
Ziegler, D. R. and J. P. Herman (2002). "Neurocircuitry of stress integration: anatomical
pathways regulating the hypothalamo-pituitary-adrenocortical axis of the rat." Integr
Comp Biol 42(3): 541-551.
References
75 Zimmer, D. B., J. Chessher, et al. (1997). "S100A1 and S100B expression and target proteins in
type I diabetes." Endocrinology 138(12): 5176-5183.
