mechanismsfor laser control of chemical reactions
TRANSCRIPT

Mechanisms for Laser Control of Chemical Reactions
Ben R. Torralva and Roland E. Allen
Department of Physics, Texas A&M University,College Station, Texas 77843, USA
Abstract
During the past several years our group has developed and employed a new techniquefor realistic simulations of the interaction of light with matter. Recent simulations of laserpulses interacting with molecules clearly demonstrate the potential for control of chemicalreactions, through various mechanisms which include the following: (i) excitation of electronsto states which have different bonding properties; (ii) control of electron populations througha coherent pump-pulse, control-pulse sequence; and (iii) control of molecular vibrationsthrough a pump-control sequence. Significant chemical insights are gained when one canwatch a realistic animation of species interacting and reacting. One can monitor the timeevolution of electronic states and their occupancy, as well as the motion of the atoms. Onecan also observe the evolution from reactants to products through transition states. Finally,one can determine how this evolution is affected by the various properties of the laser pulses,including intensity, duration, phase, and the interval between pulses.
1 Introduction
For decades, chemists have dreamed of using lasers to selectively control chemical reactions.It was initially believed that by properly tuning the laser to the local mode frequency corre-sponding to a specific chemical bond, enough energy could be deposited to break the bondsselectively, and consequently drive a chemical reaction which would not normally occur orwhich only occurs inefficiently. In practice, however, it became clear that, except for thesmallest molecules, the energy deposited rapidly redistributes throughout the molecule, de-stroying the selectivity [1]. On the other hand, developments in laser technology, togetherwith an understanding that the explicit quantum nature of the system must be recognizedand exploited (through, e.g., constructive and destructive interference), have permitted re-cent progress in manipulating larger systems on an atomic scale.
The improvements in laser technology that have led to a rapid increase in activity inthis area of chemistry are the following: (i) the development of laser systems capable ofproducing ultrashort pulses, allowing the energy of the electromagnetic field to be deliveredin as little as 4.5 fs; (ii) the ability to tailor the frequency, envelope, and phase of pulses,so that they can be designed to bring about some specific change in the molecular system;and (iii) the ability to produce phase-locked pulse trains, with multiple pulses time-delayed,
1

so that one pulse will either constructively or destructively interfere with the state set inmotion by a preceding pulse.
We will address two of the three major types of experiments in what has become knownas the field of femtochemistry. First, we will present simulations in which a single pulse isused to bring about a specific change in an organic system. In practice, these are carried outas pump-probe experiments, where the pump pulse is used to facilitate a chemical reactionand a probe pulse is used to monitor the subsequent real-time quantum dynamics. In oursimulations we can monitor the system directly, and we will report on the dynamics of thesystem, as well as the occupancy of the excited states and the kinetic energy . The secondtype of simulation that we present in this paper is one in which a phase-locked pump-pulse,control-pulse pair is separated by a variable time delay, whose value is tuned to achieve eitherconstructive or destructive interference in the quantum dynamics of the electrons, or in thevibrational motion of the atoms.
The technique used for our simulations is density-functional-based tight-binding electron-ion dynamics (DFTED) [2-8]. We have provided a complete description of this techniqueelsewhere [5, 6]. Here we mention only the following features: (a) The vector potential A(x, t)for the radiation field is included in the electronic Hamiltonian H through a time-dependentPeierls substitution. (b) The time-dependent Schrodinger equation is solved with an algo-rithm that conserves probability and satisfies the Pauli exclusion principle. (c) The atomicforces are obtained from a generalized Hellmann-Feynman theorem, which may also be inter-preted as a generalized Ehrenfest theorem. (d) The method is accurate and computationallyefficient because it is based on a simplified form of density functional theory [9-12].
With the present approach, one can investigate potential mechanisms for laser controlof chemical reactions, through realistic simulations which reveal in microscopic detail howthe reacting molecules are affected by changes in the laser-pulse parameters: for example,the intensity and duration of each pulse, and the time interval between pump and controlpulses.
In these initial studies, we examine four mechanisms:• Promotion of electrons to excited states with different bonding properties – so that,
e.g., a symmetry-forbidden reaction becomes symmetry-allowed. In this paper we specificallyconsider photoinduced cycloaddition of ethylene molecules and selective photodissociationof cyclobutane.• Photoisomerization of a molecule – a change of molecular structure resulting from the
absorption of radiation. Here we specifically consider photoisomerization of butadiende.• Control of electron populations through a pump-pulse, control-pulse sequence. The
specific molecule treated here is benzene.• Control of molecular vibrations through a pump-control sequence. Again, the present
simulations are specifically for benzene.Let us now turn to a detailed discussion of our results for each of the above processes.
2 Photoinduced 2+2 Cycloaddition
The idea of conservation of orbital symmetry, introduced by Woodward and Hoffmann [13],has been shown to be a powerful tool in understanding whether a given reaction will proceed
2

according to lowest-order symmetry considerations. The main idea is that reactions proceedreadily if there is congruence between orbital symmetry characteristics of reactants andproducts.
Figure 1: The formation of cyclobutane from two molecules of ethylene is a symmetry-forbidden reaction. However, through the photoexcitation of electrons to antibonding or-bitals, the reaction can be made symmetry-allowed. The above is a schematic drawing, andresults from a realistic computer simulation are shown in Fig. 9.
1
23
Figure 2: The maximum symmetry approach for ethylene is with relative motion only inplane 3. Then the orbitals in Fig. 3 can be defined first by their symmetry with respect toplane 1, and second by their symmetry with respect to plane 2. After Ref. 13.
The reaction that we consider here is the formation of cyclobutane from two moleculesof ethylene, shown schematically in Fig. 1. This is the prototypical symmetry-forbiddenreaction. Fig. 2 schematically depicts two ethylene molecules which we will describe withrespect to the three planes shown. The two molecules are made to approach each other inthe maximum-symmetry direction, namely with relative motion only in plane 3. We canthen describe the π-bonding of the p orbitals with respect to planes 1 and 2, as well as thechange in energy of the molecular orbitals with respect to the motion in plane 3. All ofthis information is contained in the correlation diagram of Fig. 3. The π and π∗ on the leftside of the figure indicate the π-bonding and π−antibonding molecular orbitals derived from
3
AAAS
SASS
AA
SA
ASSS
π∗
π
σ∗
σ
Ene
rgy→
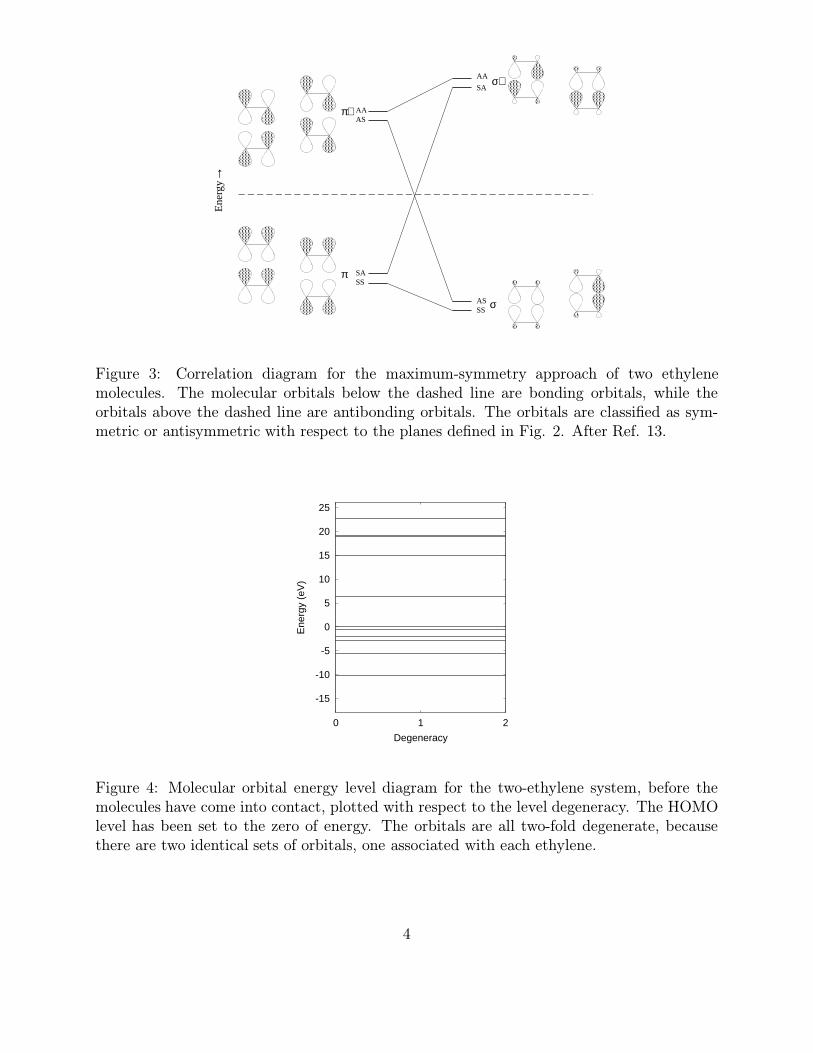
Figure 3: Correlation diagram for the maximum-symmetry approach of two ethylenemolecules. The molecular orbitals below the dashed line are bonding orbitals, while theorbitals above the dashed line are antibonding orbitals. The orbitals are classified as sym-metric or antisymmetric with respect to the planes defined in Fig. 2. After Ref. 13.
-15
-10
-5
0
5
10
15
20
25
0 1 2
Ene
rgy
(eV
)
Degeneracy
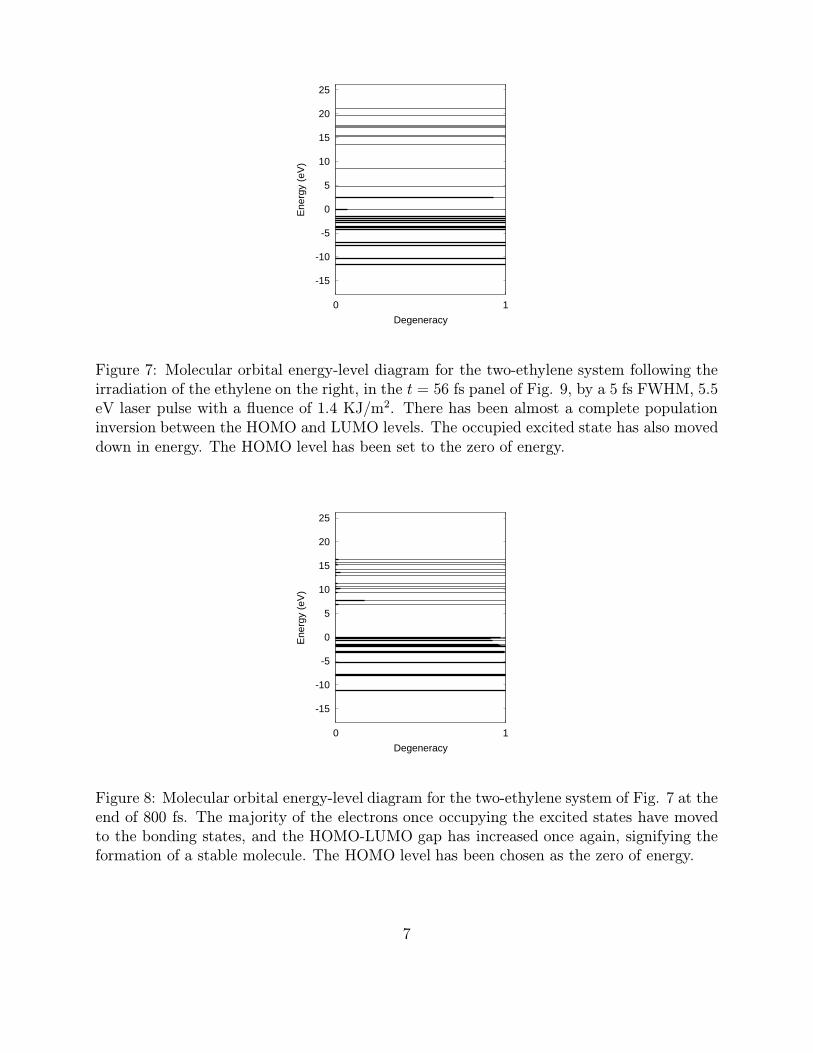
Figure 4: Molecular orbital energy level diagram for the two-ethylene system, before themolecules have come into contact, plotted with respect to the level degeneracy. The HOMOlevel has been set to the zero of energy. The orbitals are all two-fold degenerate, becausethere are two identical sets of orbitals, one associated with each ethylene.
4

the p atomic orbitals, which are extended in plane 3. The letters S and A indicate whetherthe molecular orbitals are symmetric or antisymmetric with respect to (first) plane 1 and(second) plane two. In the ground state, the molecular orbitals below the dashed line areoccupied, whereas the molecular levels above this line are unoccupied. The movement inthe energy levels is due to the interaction of the orbitals as they approach one another. Onthe right side of the figure, the p orbitals have become σ-bonded, as they would be in thecyclobutane molecule.
Figure 5: Snapshots of a simulation of two ethylene molecules approaching each other inthe maximum-symmetry direction, with a kinetic energy of 0.2 eV. At t = 43 fs, the twoethylenes reach their closest point, with a separation of only 1.63 A. However, they bounceoff each other rather than bonding, and are 7.46 A apart at t = 81 fs.
There are several interesting things to take note of in Fig. 3. First, the two energy levelsare allowed to cross since they have different symmetry. Second, the occupied SA π-orbitalon the left must move up in energy if we are to form molecular orbitals of cyclobutane on theright. Likewise, the AS π∗-orbital on the left will move down in energy to form the molecularorbital of cyclobutane. As a result of the motion, we are left with a molecule which has anunoccupied bonding state, as well as an occupied antibonding state. An estimate of thesymmetry-imposed barrier for the face-to-face combination of two ethylene molecules is 5eV. This is a significant barrier for thermal reactions, and indeed it is found experimentallythat ethylene is very stable with respect to formation of cyclobutane.
Fig. 4 shows the ground state molecular orbital structure of the two ethylene moleculesbefore they have come into contact. Notice that all of the levels are two-fold degenerate since
5

Figure 6: Snapshots of a simulation of two ethylene molecules approaching each other, in themaximum-symmetry direction, with a kinetic energy of 5.0 eV. At t = 16 fs, the ethylenesare within 0.95 A of each other, and then they violently bounce apart. The bonds shownbetween the two ethylenes at t = 16 fs are an artifact of the animation program used tomake the snapshots, and do not represent true bonds.
we have two identical ethylenes. Fig. 5 shows snapshots of an animation of the interactionof two ethylenes, initially in the ground state, but given 0.2 eV of kinetic energy, put entirelyinto motion along the maximal-symmetry direction with zero impact parameter. At t = 43fs, the two ethylene molecules reach their closest point of contact, with a separation of only1.63 A. However, they do not bond, and instead simply bounce off each other. The dashedline in the snapshot at t = 81 fs is to indicate that the two molecules have moved out of theoriginal field of view, and are 7.46 A apart.
In Fig. 6, the ethylenes were given 5.0 eV of kinetic energy along the maximal-symmetrydirection. At t = 16 fs, the molecules are within 0.95 A of each other, but show no signsof bonding. (The bonds shown in the figure are artifacts of the animation program.) Theethylenes then violently recoil, and the carbon-hydrogen bonds are broken. At t = 35 fs thecarbon atoms are 6.4 A apart.
On the other hand, if we first pump the electrons from the HOMO state to the LUMOstate through the use of a properly-designed laser pulse, the reaction to form cyclobutanebecomes energetically favorable as the two ethylenes approach each other in plane 3, allowingan occupied antibonding orbital to move down in energy to become a bonding orbital ofcyclobutane, as well as letting an unoccupied bonding orbital move up in energy to become
6
-15
-10
-5
0
5
10
15
20
25
0 1E
nerg
y (e
V)
Degeneracy
Figure 7: Molecular orbital energy-level diagram for the two-ethylene system following theirradiation of the ethylene on the right, in the t = 56 fs panel of Fig. 9, by a 5 fs FWHM, 5.5eV laser pulse with a fluence of 1.4 KJ/m2. There has been almost a complete populationinversion between the HOMO and LUMO levels. The occupied excited state has also moveddown in energy. The HOMO level has been set to the zero of energy.
-15
-10
-5
0
5
10
15
20
25
0 1
Ene
rgy
(eV
)
Degeneracy
Figure 8: Molecular orbital energy-level diagram for the two-ethylene system of Fig. 7 at theend of 800 fs. The majority of the electrons once occupying the excited states have movedto the bonding states, and the HOMO-LUMO gap has increased once again, signifying theformation of a stable molecule. The HOMO level has been chosen as the zero of energy.
7
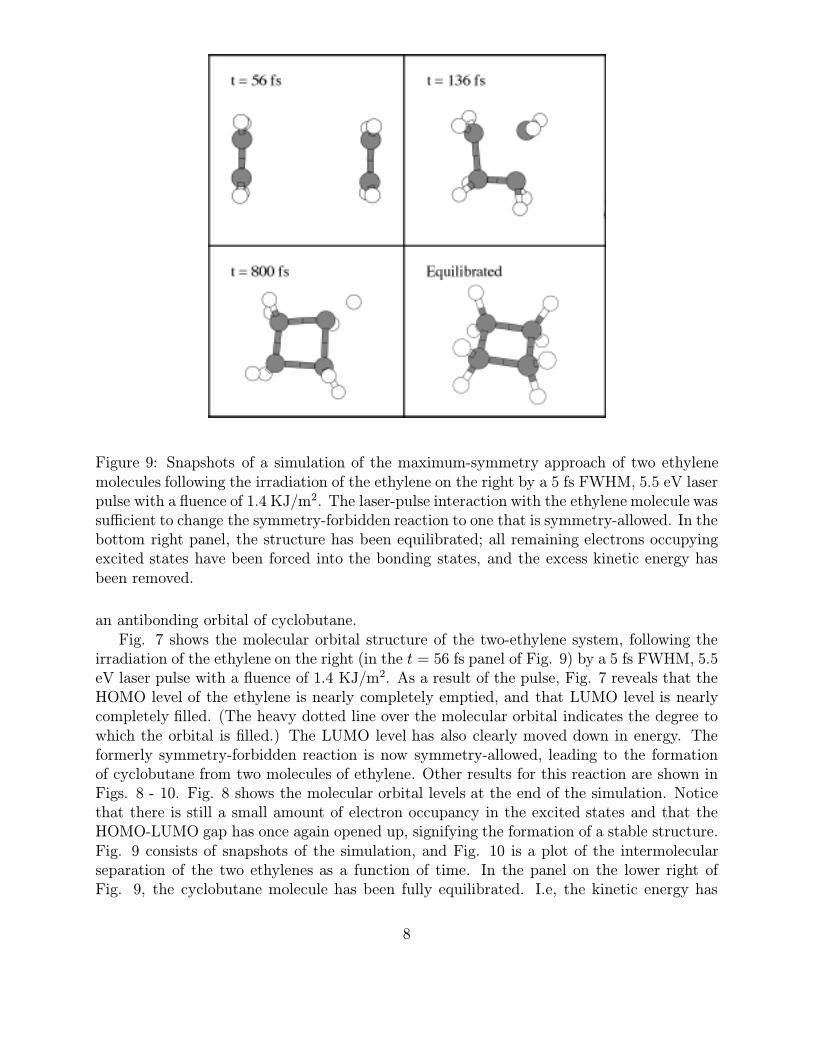
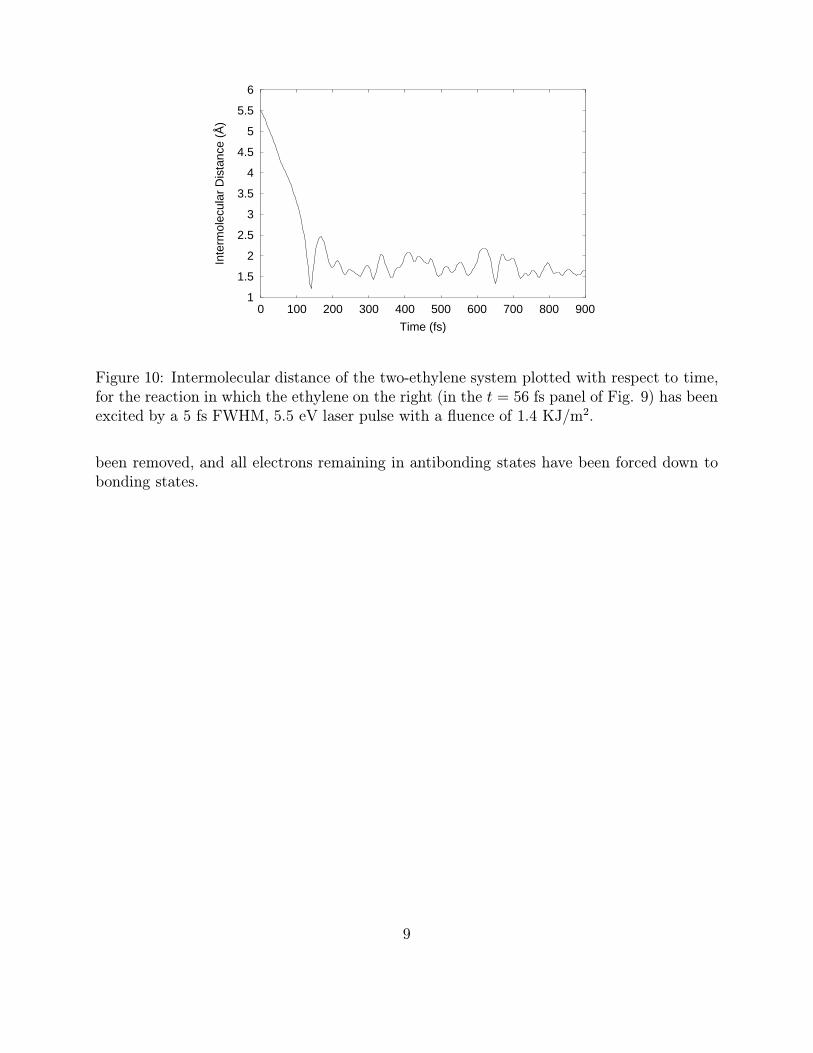
Figure 9: Snapshots of a simulation of the maximum-symmetry approach of two ethylenemolecules following the irradiation of the ethylene on the right by a 5 fs FWHM, 5.5 eV laserpulse with a fluence of 1.4 KJ/m2. The laser-pulse interaction with the ethylene molecule wassufficient to change the symmetry-forbidden reaction to one that is symmetry-allowed. In thebottom right panel, the structure has been equilibrated; all remaining electrons occupyingexcited states have been forced into the bonding states, and the excess kinetic energy hasbeen removed.
an antibonding orbital of cyclobutane.Fig. 7 shows the molecular orbital structure of the two-ethylene system, following the
irradiation of the ethylene on the right (in the t = 56 fs panel of Fig. 9) by a 5 fs FWHM, 5.5eV laser pulse with a fluence of 1.4 KJ/m2. As a result of the pulse, Fig. 7 reveals that theHOMO level of the ethylene is nearly completely emptied, and that LUMO level is nearlycompletely filled. (The heavy dotted line over the molecular orbital indicates the degree towhich the orbital is filled.) The LUMO level has also clearly moved down in energy. Theformerly symmetry-forbidden reaction is now symmetry-allowed, leading to the formationof cyclobutane from two molecules of ethylene. Other results for this reaction are shown inFigs. 8 - 10. Fig. 8 shows the molecular orbital levels at the end of the simulation. Noticethat there is still a small amount of electron occupancy in the excited states and that theHOMO-LUMO gap has once again opened up, signifying the formation of a stable structure.Fig. 9 consists of snapshots of the simulation, and Fig. 10 is a plot of the intermolecularseparation of the two ethylenes as a function of time. In the panel on the lower right ofFig. 9, the cyclobutane molecule has been fully equilibrated. I.e, the kinetic energy has
8
1
1.5
2
2.5
3
3.5
4
4.5
5
5.5
6
0 100 200 300 400 500 600 700 800 900
Inte
rmol
ecul
ar D
ista
nce
(Å)
Time (fs)
Figure 10: Intermolecular distance of the two-ethylene system plotted with respect to time,for the reaction in which the ethylene on the right (in the t = 56 fs panel of Fig. 9) has beenexcited by a 5 fs FWHM, 5.5 eV laser pulse with a fluence of 1.4 KJ/m2.
been removed, and all electrons remaining in antibonding states have been forced down tobonding states.
9

3 Photodissociation of Cyclobutane
The selective dissociation of cyclobutane, to form two molecules of ethylene, is also a veryinteresting and historically significant reaction. If we look back at the correlation diagramin Fig. 3, we can reverse the arguments that we used to understand the symmetry-forbiddennature of the reaction to form cyclobutane from two molecules of ethylene, to see that thedissociation of cyclobutane into two molecules of ethylene is also symmetry-forbidden. How-ever, as in the previous simulation, if we promote electrons into the excited states with alaser pulse, the reaction can become symmetry-allowed. A question that arises, and thatchemists have been investigating for the past 60 years both theoretically and experimentally,is the following: In what manner does the ring opening of cyclobutane to form two ethy-lene molecules occur? There are two possibilities. First, the reaction may proceed directlythrough a transition state at the saddle point of the activation barrier, as pictured schemati-cally in Fig. 11, where the two σ-bonds in the cyclobutane ring break simultaneously to formtwo ethylene molecules. Calculations by Hoffmann et al. [14] indicated that the potentialenergy surface (PES) should be flat, allowing a transition state lifetime of ∼ 40 fs.
‡
Figure 11: Schematic of the photodissociation reaction of cyclobutane to form two ethylenemolecules. In this first scenario the cyclobutane molecule passes through a transition statein a concerted reaction, maintaining the original symmetry.
The second possibility is that the reaction proceeds through a two-step process, with oneof the σ-bonds first breaking to form tetramethylene as a diradical reaction intermediate,which then passes through a transition state to yield the final products. This possibility ispictured in Fig. 12. The diradical mechanism is important because the concept of diradicalsas intermediates has been hypothesized to be the prototype of chemical bond transformationsin many classes of thermally activated and photochemical reactions. The question of whichpath the reaction follows is crucial in understanding the fundamental nature of the reactiondynamics: a concerted one-step process, or a nonconcerted two-step process.
Theorists have not been able to produce a definitive answer to this problem. However,the ground-breaking work of the Zewail group (one of the five discoveries cited in the an-
10

‡‡
Figure 12: Schematic of the photodissociation reaction of cyclobutane to form two ethylenemolecules. In this second scenario the cyclobutane molecule first forms the tetramethy-lene diradical reaction intermediate, before transitioning to the final state of two ethylenemolecules.
0
0.2
0.4
0.6
0.8
1
1.2
1.4
1.6
1.8
2
0 100 200 300 400 500 600 700 800 900
Exc
ited
Sta
te E
lect
ron
Occ
up
atio
n
Time (fs)
Figure 13: Excited state electron occupancy plotted as a function of time, for a cyclobutanemolecule irradiated by a 60 fs FWHM laser pulse, centered at 6.5 eV, with a fluence of 42.21KJ/m2. The electrons are mainly excited by a two-photon process until about 110 fs, wherea one-photon process becomes possible because the excited-state energies have decreased.
nouncement of Ahmed Zewail’s receiving the 1999 Nobel Prize in Chemistry) showed thatthe reaction proceeded through the two-step process [15]: first forming the tetramethylenediradical, and then proceeding to the products. They were able to control the lifetime of thereaction intermediate from 340 fs to 700 fs by adjusting the fluence of the pump pulse froma 60 fs FWHM laser, using a two-photon process.
To photodissociate cyclobutane in our simulations, via a two-photon process, we used a60 fs FWHM laser pulse, centered at 6.5 eV, with a fluence of 42.21 KJ/m2. Fig. 13 showsthe number of electrons occupying the excited states as a function of time. Notice the rapid
11

Figure 14: Snapshots of a simulation of the photodissociation of cyclobutane to form twoethylene molecules. The cyclobutane molecule was irradiated by a 60 fs FWHM laser pulse,centered at 6.5 eV, with a fluence of 42.21 KJ/m2. The formation of the tetramethylenediradical reaction intermediate appears at about t = 117 fs. At t = 465 fs, the diradicalmakes a transition to the final products: two ethylenes which are seen to be stable at t = 750fs. The vertical bar in the bottom-right panel indicates that the two ethylene molecules areno longer contained in the original field of view.
oscillations that occur during the first 110 fs of the pulse, where the absorption is dominatedby a two-photon process. During the final 10 fs of the pulse (which has a total durationof 120 fs for the pulse shape used in these simulations [5, 6]), the excited-state molecularorbitals have moved down in energy, leading to very rapid absorption that can now occurthrough a one-photon process. This is accompanied by breaking of a σ-bond, which producesthe tetramethylene diradical reaction intermediate, as can be seen in the top-right panel ofFig. 14 where snapshots from the simulation are shown. At the end of the pulse, about 1.25electrons occupy the excited states. Soon after the pulse the occupancy of excited states isincreased by about 0.25 electrons; this is associated with a rapid conversion of kinetic energyto effective potential energy, as can be seen in the plot of kinetic energy with respect to timein Fig. 15. Near 200 fs, approximately 0.8 electrons rapidly fall back into bonding states.Fig. 16 shows the occupation of excited states with respect to time between 195 fs and 205 fs.Notice that the depopulation of excited states occurs in less than 2 fs. It is characteristic ofbarrierless electronic transitions that they can occur in time intervals which are of the orderof a few cycles of the characteristic frequency – which is less than 1 fs for 6.5 eV radiation.
12

0
0.5
1
1.5
2
2.5
0 100 200 300 400 500 600 700 800 900
Kin
etic
En
erg
y (e
V)
Time (fs)
Figure 15: Kinetic energy plotted as a function of time for a cyclobutane molecule irradiatedby a 60 fs FWHM laser pulse, centered at 6.5 eV, with a fluence of 42.21 KJ/m2.
1
1.1
1.2
1.3
1.4
1.5
1.6
1.7
1.8
196 198 200 202 204
Exc
ited
Sta
te E
lect
ron
Occ
up
atio
n
Time (fs)
Bond Length
Figure 16: A portion of Fig. 13 shown in more detail to exhibit the time scale for the rapidtransition near 200 fs. This transition occurs on a time scale comparable to a few periods ofthe radiation field, indicating that it is a barrierless transition.
The diradical passes through its transition state at ∼ 465 fs, with the appearance of twoethylene molecules. Fig. 17 is a plot of the carbon-carbon interatomic bondlength for thetwo carbons on the left side of the cyclobutane molecule in the top-left panel of Fig. 14. At
13

1.25
1.3
1.35
1.4
1.45
1.5
1.55
1.6
1.65
0 100 200 300 400 500 600 700 800 900
C−
C I
nte
rato
mic
Dis
tan
ce (
Å)
Time (fs)
Figure 17: Plot of the carbon-carbon interatomic bondlength for the two carbons makingup the left side of the cyclobutane molecule (in the top-left panel of Fig. 14). At t = 0, thevalue for the bondlength is 1.54 A, characteristic of cyclobutane. After the passage throughtwo transition states, we see that the value finally begins oscillating around 1.35 A, which ischaracteristic of the carbon-carbon bondlength in ethylene.
t = 0, the value for the bondlength is 1.54 A, which is characteristic of cyclobutane. Afterthe passage through two transition states, we see that the value of the bondlength finallybegins oscillating around 1.35 A, which is characteristic of the carbon-carbon bondlength inethylene. Our simulation thus yields a lifetime for the reaction intermediate of approximately348 fs, in good agreement with the experiments discussed above.
We never obtained a lifetime longer than 348 fs in our simulations. However, we wereable to obtain shorter lifetimes by increasing the pump fluence by only 9.6 × 10⁻³%. Theresults of this simulation are shown in Figs 18-21. The lifetime of the reaction intermediatein this case was approximately 197 fs. If we increased the fluence further, hydrogen atomswere ejected from the cyclobutane molecule, leading to very different dynamics.
The ability to correctly describe the photodissociation of cyclobutane, as demonstratedin these last two simulations, is a surprising triumph for DFTED. To accurately describe theexcited-state energy surface for a complex system, with 30 vibrational degrees of freedomand 24 valence electrons, represents a highly nontrivial level of success.
14

0
0.2
0.4
0.6
0.8
1
1.2
1.4
1.6
1.8
2
0 100 200 300 400 500 600 700
Excited State Electron Occupation
Time (fs)
Figure 18: Excited-state electron occupancy plotted as a function of time for a cyclobutanemolecule irradiated by a 60 fs FWHM laser pulse, centered at 6.5 eV, with an increase inthe pump fluence of only 9.6× 10⁻³% compared to the simulation of Fig. 13. The electronsare found to be excited by a two-photon process until 110 fs, where they are then excitedthrough a one-photon process. (Since the full-width-at-half-maximum duration of the pulseis 60 fs, the total duration is 120 fs for the pulse shape used in the present simulations [5, 6].)
15

Figure 19: Snapshots of a simulation of the photodissociation of cyclobutane to form twoethylene molecules. The cyclobutane molecule was irradiated by a 60 fs FWHM laser pulse,centered at 6.5 eV, with an increase in pump fluence of only 9.6× 10⁻³% compared to thesimulation in Fig. 13. The formation of the tetramethylene diradical reaction intermediateappears at about t = 113 fs. At t = 310 fs, the diradical undergoes a transition to the finalproducts: two ethylenes which are seen to be stable at t = 750 fs. The vertical bar in thebottom-right panel indicates that these ethylene molecules are no longer contained in theoriginal field of view.
16

0
0.5
1
1.5
2
2.5
3
3.5
4
4.5
5
0 100 200 300 400 500 600 700 800 900
Kinetic Energy (eV)
Time (fs)
Figure 20: Kinetic energy plotted as a function of time for a cyclobutane molecule irradiatedby a 60 fs FWHM laser pulse, centered at 6.5 eV, with an increase in the pump fluence of9.6× 10−3% compared to the simulation in Fig. 13.
1.2
1.3
1.4
1.5
1.6
1.7
1.8
1.9
2
0 100 200 300 400 500 600 700 800
C−C Interatomic Distance (
Å)
Time (fs)
Figure 21: Plot of the carbon-carbon interatomic bondlength of the two carbons making upthe left side of the cyclobutane molecule (in the top-left panel of Fig. 19). At t = 0 fs, thevalue for the bondlength is 1.54 A, characteristic of cyclobutane. After the passage throughtwo transition states at 310 fs, we see that the value finally begins oscillating around 1.35A, which is characteristic of the carbon-carbon bondlength in ethylene.
17
4 Photoisomerization of Butadiene
Isomerization reactions are an important class of chemical reactions. They involve the changeof a molecule from one conformation to another. One of the most important and mostfascinating is the cis-to-trans photoisomerization of retinal, the chromospore in rhodopsin.This is the primary event in the process of vision. It has been recently shown in the beautifulpump-probe experiments of Mathies and co-workers to occur in only 200 fs [16, 17].
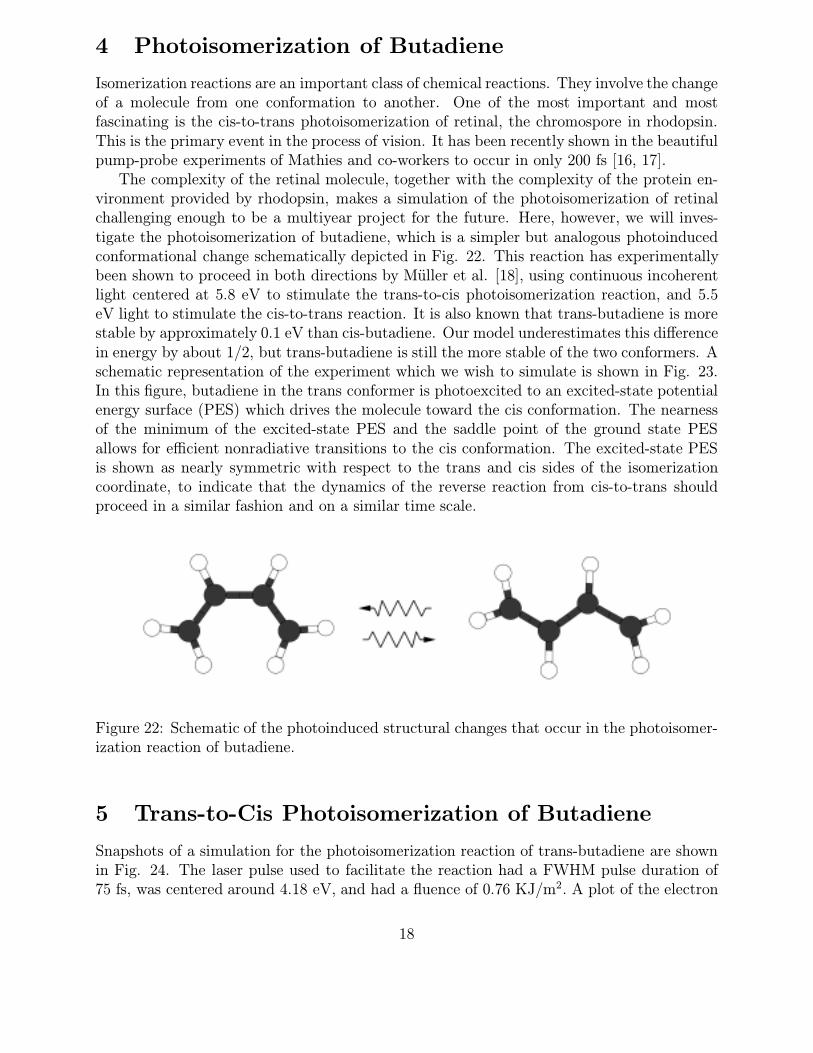
The complexity of the retinal molecule, together with the complexity of the protein en-vironment provided by rhodopsin, makes a simulation of the photoisomerization of retinalchallenging enough to be a multiyear project for the future. Here, however, we will inves-tigate the photoisomerization of butadiene, which is a simpler but analogous photoinducedconformational change schematically depicted in Fig. 22. This reaction has experimentallybeen shown to proceed in both directions by Muller et al. [18], using continuous incoherentlight centered at 5.8 eV to stimulate the trans-to-cis photoisomerization reaction, and 5.5eV light to stimulate the cis-to-trans reaction. It is also known that trans-butadiene is morestable by approximately 0.1 eV than cis-butadiene. Our model underestimates this differencein energy by about 1/2, but trans-butadiene is still the more stable of the two conformers. Aschematic representation of the experiment which we wish to simulate is shown in Fig. 23.In this figure, butadiene in the trans conformer is photoexcited to an excited-state potentialenergy surface (PES) which drives the molecule toward the cis conformation. The nearnessof the minimum of the excited-state PES and the saddle point of the ground state PESallows for efficient nonradiative transitions to the cis conformation. The excited-state PESis shown as nearly symmetric with respect to the trans and cis sides of the isomerizationcoordinate, to indicate that the dynamics of the reverse reaction from cis-to-trans shouldproceed in a similar fashion and on a similar time scale.
Figure 22: Schematic of the photoinduced structural changes that occur in the photoisomer-ization reaction of butadiene.
5 Trans-to-Cis Photoisomerization of Butadiene
Snapshots of a simulation for the photoisomerization reaction of trans-butadiene are shownin Fig. 24. The laser pulse used to facilitate the reaction had a FWHM pulse duration of75 fs, was centered around 4.18 eV, and had a fluence of 0.76 KJ/m2. A plot of the electron
18

g
Isomerization Coordinate
trans-butadienecis-butadiene
Ene
rgy
S1
0S
Figure 23: Schematic diagram of butadiene in the trans conformer, photoexcited to anexcited-state potential energy surface (PES) which drives the molecule towards the cis con-formation. The nearness of the minimum of the excited-state PES to the saddle point ofthe ground-state PES allows for efficient nonradiative transitions to the cis conformation.The excited-state PES is shown as nearly symmetric with respect to the trans and cis sidesof the isomerization coordinate, to imply that the dynamics of the reverse reaction fromcis-to-trans should proceed in a similar fashion and on a similar time scale.
occupancy of the excited states as a function of time is show in Fig. 25. It is interestingto note the step-like behavior in the occupancy, as the electrons nonradiatively fall backto the bonding orbitals after the pulse has been completed (at 150 fs, since the total pulseduration is twice the FWHM duration). These downward steps in electron occupation of theexcited states are associated with rotation of the two outer carbons about their respectivedouble bonds, as can be seen for the outer carbon on the right in the top-right panel of Fig.24. From a molecular-orbital point of view, this rotation acts to mix the excited-state andground-state molecular orbitals of butadiene. The drop in the occupancy of the excited-state orbitals is also evident in the plot of the kinetic energy with respect to time in Fig.26. By t = 250 fs, the electron occupancy has stabilized and the motion of the molecule ishighly kinetic. However, the motion is within an overall trans-butadiene conformer until, at530 fs, there is dramatically different motion about the single bond joining the two middlecarbon atoms, as can be seen in the bottom left panel of Fig. 24. At this point we observethe sudden emergence of the cis conformation. Although the motion is still highly kinetic,there is now no manifestation of the trans conformation. This transformation is very clearlyapparent in the plot of Fig. 27 showing the bondlength for the two outside carbon atoms,which has a value of about 3.7 A for trans and 3.1 A for cis. The last thing to note is thatthe dramatic rotation about the single bond, which signaled the onset of the cis conformer,did not produce a change in the electron occupancy, shown in Fig. 25. This feature can be
19

Figure 24: Snapshots of the photoisomerization reaction of trans-butadiene induced by a laserpulse of duration 75 fs FWHM, centered at 4.18 eV and having a fluence of 0.76 KJ/m2. Att = 155 fs, the carbon on the left of the structure rotates about its carbon-carbon doublebond. At t = 530 fs, the middle carbon atoms rotate about their single bond, leading to theformation of cis-butadiene. The entire reaction takes place in 550 fs.
understood if we consider a rotation about the single bond joining the two middle carbonatoms in Fig. 28, and its effect on the π-orbitals. This type of rotation does not mix thebonding and antibonding states.
6 Cis-to-Trans Photoisomerization of Butadiene
To investigate the reverse reaction, the photoisomerization of cis-butadiene, we irradiatedthis molecule with a 75 fs FWHM, 4.15 eV laser pulse, having a fluence of 1.3 KJ/m2. Theresults are shown in Figs. 29 - 32, and they demonstrate that the reaction can indeed proceedin both directions, as was found experimentally. Fig. 29 also shows the step-like behavioras the electrons occupying the excited states nonradiatively fall back to the bonding states.The large drop in excited-state occupancy is correlated with a very efficient simultaneousrotation of both outer carbon atoms, as shown in the upper right panel of Fig. 32. Therotation about the single bond in this reaction occurs at 519 fs. Just as before, it signals achange in conformation, after which we see only the trans conformer.
The striking similarities between the two reactions appear to validate the hypothesis that
20

0
0.2
0.4
0.6
0.8
1
1.2
1.4
1.6
1.8
2
0 200 400 600 800 1000 1200
Excited State Electron Occupancy
Time (fs)
Figure 25: Plot of the occupation of the antibonding states as a function of time during thephotoisomerization reaction of trans-butadiene induced by a laser pulse with a duration of75 fs FWHM, centered at 4.18 eV and having a fluence of 0.76 KJ/m2.
0
1
2
3
4
5
6
0 200 400 600 800 1000 1200
Ene
rgy
(eV
)
Time (fs)
Figure 26: Kinetic energy plotted as a function of time during the photoisomerization reac-tion of trans-butadiene induced by a laser pulse with a duration of 75 fs FWHM, a photonenergy of 4.18 eV, and a fluence of 0.76 KJ/m2.
the excited state PES is nearly symmetric with respect to the two potential wells along thereaction coordinate.
21

2.4
2.6
2.8
3
3.2
3.4
3.6
3.8
4
4.2
4.4
0 200 400 600 800 1000 1200
C1
− C
4 In
term
olec
ular
Dis
tanc
e (Å
)
Time (fs)
Figure 27: Carbon-carbon bondlength for the carbon atoms on the ends of a butadienemolecule, plotted as a function of time during the photoisomerization reaction of trans-butadiene, induced by a laser pulse with a duration of 75 fs, a photon energy of 4.18 eV, anda fluence of 0.76 KJ/m2. The characteristic bondlength for trans-butadiene is about 3.7 A,and that for cis-butadiene is 3.1 A.
The remarkable success of the above simulations for butadiene offers the promise that wewill be able, at some point in the future, to simulate a complex biological process like thephotoisomerization of retinal.
22

Ene
rgy
→
Figure 28: The π-orbitals of butadiene, and how they transform with respect to a 180 degreerotation about the single bond – i.e., the bond connecting the two inner carbon atoms.
0
0.5
1
1.5
2
2.5
3
3.5
0 200 400 600 800 1000 1200 1400 1600
Excited State Electron Occupancy
Time (fs)
Figure 29: Occupation of the antibonding states as a function of time during the photoiso-merization reaction of cis-butadiene induced by a laser pulse of duration 75 fs, photon energyof 4.15 eV, and fluence of 1.3 KJ/m2.
23

2.4
2.6
2.8
3
3.2
3.4
3.6
3.8
4
4.2
0 200 400 600 800 1000 1200 1400 1600
C1
− C
4 In
term
olec
ular
Dis
tanc
e (Å
)
Time (fs)
Figure 30: Carbon-carbon bondlength for the carbon atoms on the ends of the butadi-ene molecule, plotted as a function of time during the photoisomerization reaction of cis-butadiene, induced by a laser pulse with a duration of 75 fs, photon energy of 4.15 eV,and fluence of 1.3 KJ/m2. The characteristic bondlength for cis-butadiene is 3.1 A. Thecharacteristic bondlength for trans-butadiene is 3.7 A.
0
1
2
3
4
5
0 200 400 600 800 1000 1200 1400 1600
Ene
rgy
(eV
)
Time (fs)
Figure 31: Kinetic energy plotted as a function of time during the photoisomerization reac-tion of cis-butadiene induced by a laser pulse of duration 75 fs, photon energy 4.15 eV, andfluence 1.3 KJ/m2. Notice the sharp increase of kinetic energy at t = 248 fs.
24
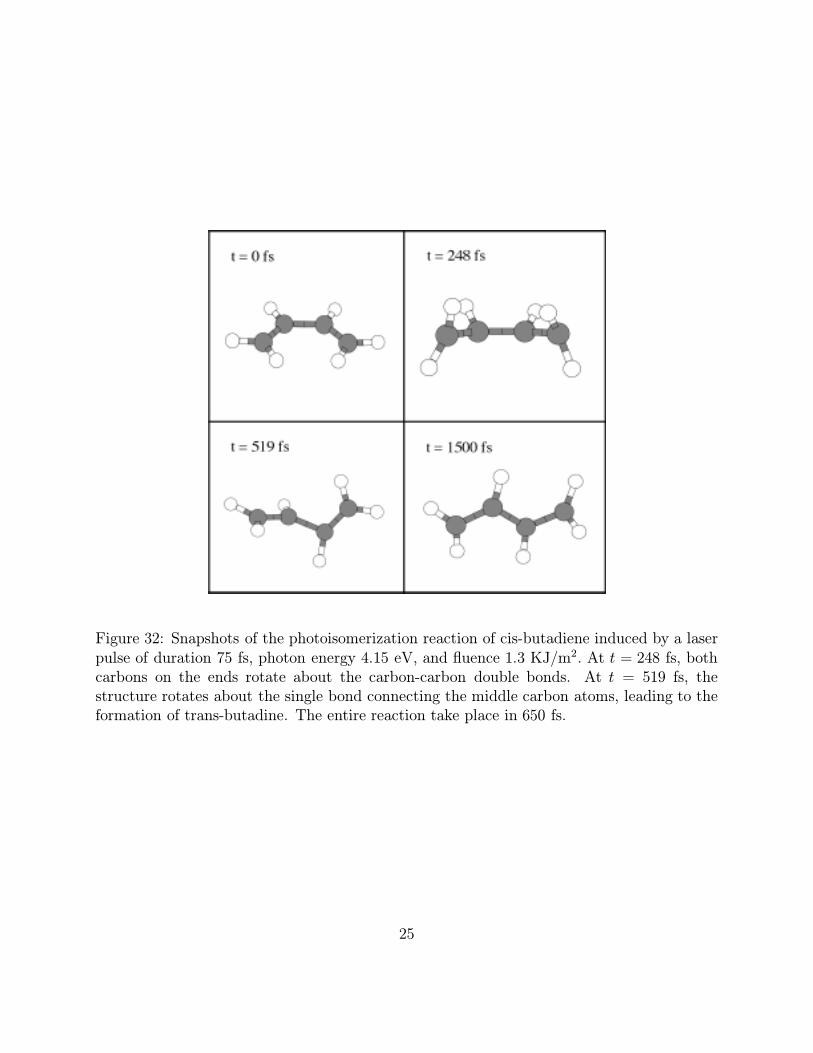
Figure 32: Snapshots of the photoisomerization reaction of cis-butadiene induced by a laserpulse of duration 75 fs, photon energy 4.15 eV, and fluence 1.3 KJ/m2. At t = 248 fs, bothcarbons on the ends rotate about the carbon-carbon double bonds. At t = 519 fs, thestructure rotates about the single bond connecting the middle carbon atoms, leading to theformation of trans-butadine. The entire reaction take place in 650 fs.
25

7 Two-Pulse Coherent Control of Benzene
Advances in laser technology have stimulated new interest in the goal of harnessing inter-ference phenomena– inherent in the interaction between light and matter, as well as in thequantum behavior of electrons and nuclei– to drive a chemical system to a desired finalstate. Experimentally, progress has been made in the control of vibrational modes in ma-terials [19], the creation and destruction of excitons in semiconductor quantum wells [20],the ground-state rotational coherence of linear molecules [21], and the femtosecond-scalechemical reactions of small molecules [22]. Theoretical investigations have relied on linear-response theory to solve the Liouville equation [23, 24], or direct solution of the Schrodingerequation [25, 26]. In contrast to such one-photon theoretical approaches, multi-photon con-trol schemes have been developed and utilized in experiments [27, 28]. A theoretical schemethat includes higher-order processes is therefore needed for comparison with the availableexperimental data, as well as for understanding future experiments in this evolving frontierof science.
Using linear response theory, Shapiro [25] showed that the effect of a short laser pulse onthe coefficient of some final state of a quantum system is given by
cf (t) = − (µfi/ih)∫ t−∞
dt′ exp (iωfit′) ε (t′) , (1)
whereµfi = 〈ψf |µ|ψi〉 (2)
is the dipole-moment matrix element for the transition from the initial to the final state,ε (t′) is the electric field of the laser pulse, and ωfi = ωf − ωi. He then showed that
cf (∞) = (2πi/h) µfi ε (ωfi) (3)
where ε is the Fourier transform of the pulse. He further argued that, since no transitions arepossible after the completion of the pulse, the infinite-time condition should be establishedsoon after the completion of the pulse, provided that the pulse is short with respect to otherprocesses in the system. Since the coefficients now contain resonant-frequency informationfrom the pulse, a second pulse properly delayed in time and phase can lead to interferenceeffects which can be used to control the outcome for the system.
In our simulations, we explore coherent control of both the electronic excitations and theatomic vibrations, via a pump-pulse, control-pulse sequence applied to benzene. The choiceof benzene allows us to continue our work with organic molecules, as well as demonstratecoherent control of a complex system containing 30 valence electrons and 30 vibrationaldegrees of freedom.
An equilibrated benzene molecule is shown in Fig. 33. We will be primarily interestedin the two fully-symmetric vibrational modes of this molecule: In the breathing mode, thecarbon and hydrogen atoms move radially together in the plane of the molecule; whereas thebeating mode involves radial motion of the carbons and hydrogens in opposite directions.
Before we examine the response of benzene to a pump-pulse, control-pulse sequence, letus first consider the response to a single 10 fs FWHM, 5.2 eV pump pulse with a fluenceof 3.0 × 10⁻³ KJ/m2. The effect on the occupation of excited states is shown in Fig. 34.
26

Figure 33: Benzene molecule in the ground state. It has two fully-symmetric vibrationalmodes: In the breathing mode, the carbon and hydrogen atoms move radially together inthe plane of the molecule; in the beating mode they also move radially, but in oppositedirections.
0
0.1
0.2
0.3
0.4
0.5
0.6
0 10 20 30 40 50 60 70 80
Population of Excited States
Time (fs)
Figure 34: Population of electrons in excited states, plotted as a function of time followinga 10 fs FWHM pump laser pulse, centered at 5.2 eV, with a fluence of 3.0× 10⁻³ KJ/m2.
The HOMO-LUMO gap of benzene in our model is 5.14 eV, so we see the excited statesbeing filled in a typical one-photon resonant process. After the completion of the pulse at20 fs, the occupation is constant, with ∼2% of the electrons occupying the excited statesfor the remaining picosecond of the simulation. This indicates that there are no appreciablenonradiative processes in benzene at this fluence, and that benzene is stable with this level ofoccupation of the excited states. Fig. 35 shows the Fourier power spectrum for a subsequentone picosecond simulation, following the laser pulse described above. The spectrum is dom-
27
0
50
100
150
200
250
300
350
400
450
500
0 500 1000 1500 2000 2500 3000 3500
Intensity (arb. units)
Frequency [cm-1]
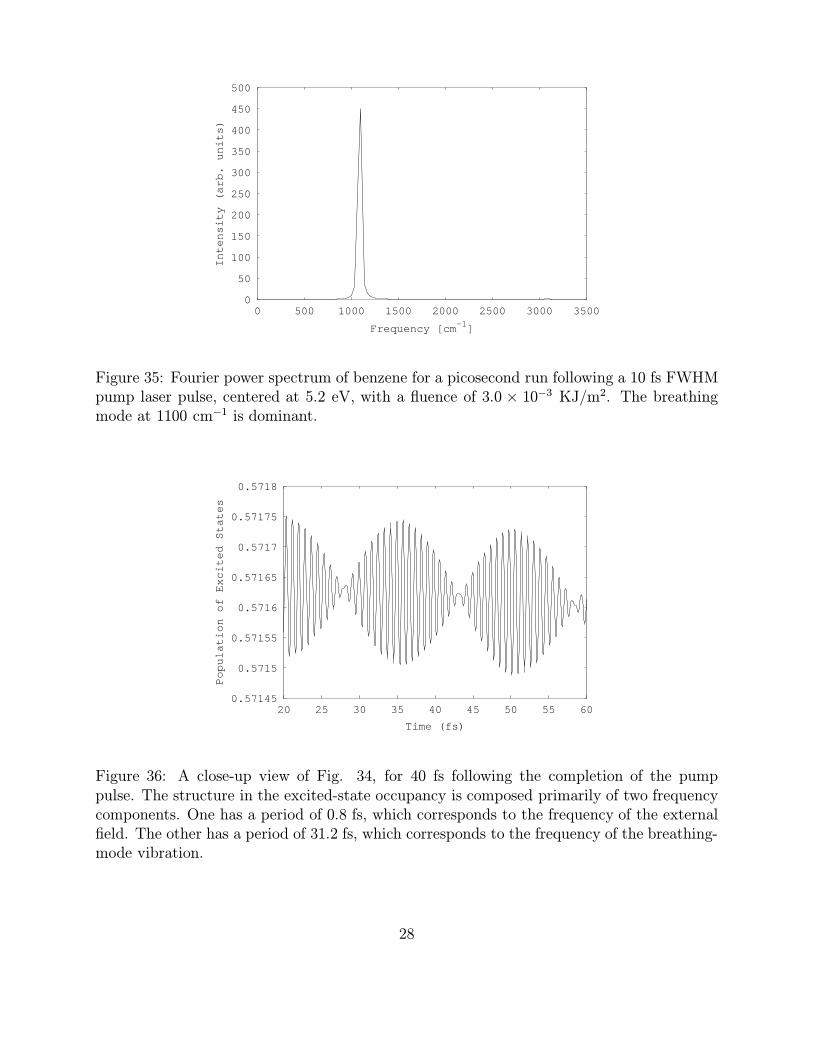
Figure 35: Fourier power spectrum of benzene for a picosecond run following a 10 fs FWHMpump laser pulse, centered at 5.2 eV, with a fluence of 3.0 × 10⁻³ KJ/m2. The breathingmode at 1100 cm−1 is dominant.
0.57145
0.5715
0.57155
0.5716
0.57165
0.5717
0.57175
0.5718
20 25 30 35 40 45 50 55 60
Population of Excited States
Time (fs)
Figure 36: A close-up view of Fig. 34, for 40 fs following the completion of the pumppulse. The structure in the excited-state occupancy is composed primarily of two frequencycomponents. One has a period of 0.8 fs, which corresponds to the frequency of the externalfield. The other has a period of 31.2 fs, which corresponds to the frequency of the breathing-mode vibration.
28

0
0.2
0.4
0.6
0.8
1
1.2
1.4
1.6
0 10 20 30 40 50 60 70 80
Population of Excited States
Time (fs)
Figure 37: Population of the excited states resulting from a pump-pulse, control-pulse se-quence, using identical pulses as described in the text, with a time delay of 62.4 fs betweenpulses. Constructive interference increases the excited state occupancy to 4.3%.
0
2000
4000
6000
8000
10000
12000
0 500 1000 1500 2000 2500 3000 3500
Intensity (arb. units)
Frequency [cm−1]
Figure 38: Fourier power spectrum for a one picosecond simulation following the controlpulse. Notice the enormous enhancement of the breathing-mode vibration, by more than afactor of 20 when compared to Fig. 35.
inated by the breathing-mode vibration, which is typical of systems excited by ultrashortlaser pulses with an intensity high enough to produce significant absorption.
29

0
0.1
0.2
0.3
0.4
0.5
0.6
0 10 20 30 40 50 60 70 80
Population of Excited States
Time (fs)
Figure 39: Population of the excited states resulting from a pump-pulse, control-pulse se-quence, using identical pulses as described in the text, with a time delay of 62.8 fs betweenthem. Destructive interference leads to a depopulation of the excited states, so that only2× 10−2% of the electrons are left in these states.
0
10
20
30
40
50
60
70
0 500 1000 1500 2000 2500 3000 3500
Intensity (arb. units)
Frequency [cm−1]
Figure 40: Fourier power spectrum for a one picosecond simulation following the controlpulse, which was delayed by an interval chosen to depopulate the excited states but retainthe breathing-mode vibration. The breathing-mode amplitude was decreased by a factor of7 compared to Fig. 35, but is still appreciable.
30

0
0.1
0.2
0.3
0.4
0.5
0.6
0.7
0.8
0.9
0 10 20 30 40 50 60 70 80
Population of Excited States
Time (fs)
Figure 41: Population of the excited states resulting from a pump-pulse, control-pulse se-quence using identical pulses, as described in the text, with a time delay of 46.8 fs betweenpulses. Destructive interference leading to a depopulation of the excited states might havebeen expected, but the actual result is a net increase of roughly 40% in the excited-stateelectron occupancy. As explained in the text, this is due to a very interesting subtlety in-volving a Jahn-Teller distortion and splitting of initially-degenerate and partially-occupiedexcited states.
The condition for constructive interference, viewed in the simplest way, is that the delay intime between the phase-locked pump pulse and control pulse should be an integer multiple ofthe characteristic period of vibration. Fig. 36 is a close-up view of Fig. 34 for 40 fs followingthe completion of the pump pulse. Notice the structure in the excited-state occupancy. AFourier transform reveals that the motion is dominated by two characteristic periods. Theyare 0.8 fs, which is the period of vibration of the pump pulse, and 31.2 fs, which correspondsto the period of the breathing-mode vibration. Therefore, if we want the control pulse toconstructively interfere with the electronic excitation as well as the breathing-mode vibration,the delay between the pulses should be an integer multiple of both of these periods. A delayof 62.4 fs satisfies this condition.
The result of a pump-pulse, control-pulse sequence using identical pulses as describedabove, with a time delay of 62.4 fs between the pulses, does indeed reveal constructiveinterference. This sequence leads to a greater population of the excited states, as can beseen in Fig. 37, with 4.3% of the electrons now occupying the excited states. Fig. 38 showsthe Fourier power spectrum for a one picosecond simulation following the control pulse.Notice the enormous enhancement of the breathing-mode vibration, by more than a factorof 20 when compared to Fig. 35.
To examine the degree to which we can control the population of excited states, wechanged the delay between the two pulses to 62.8 fs, an increase of only 0.4 fs. With this
31

0
0.5
1
1.5
2
2.5
3
3.5
4
4.5
5
0 500 1000 1500 2000 2500 3000 3500
Intensity (arb. units)
Frequency [cm−1]
Figure 42: Fourier power spectrum for a one picosecond simulation, following a control pulsewhose delay was chosen to both depopulate the excited states and suppress the breathing-mode. The breathing-mode amplitude is decreased by a factor of 400 when compared to Fig.35, whereas the amplitude of the beating mode is relatively unaffected.
0
0.005
0.01
0.015
0.02
0.025
0.03
0.035
0 200 400 600 800 1000 1200
Kinetic Energy (eV)
Time (fs)
Figure 43: The kinetic energy as a function of time for a pump-pulse, control-pulse sequencewith the control-pulse time-delayed by 46.8 fs. The kinetic energy is greatly diminished bythe control pulse. However, some kinetic energy is regained after about 400 fs through aJahn-Teller distortion of the occupied excited states.
32

4.6
4.7
4.8
4.9
5
5.1
5.2
0 0.2 0.4 0.6 0.8 1
Ene
rgy
(eV
)
Degeneracy
Figure 44: Energies of two originally degenerate excited states in a benzene molecule, fol-lowing a pump-pulse, control-pulse sequence, with the control-pulse time-delayed by 46.8fs. These states were degenerate at the completion of the control pulse, but a Jahn-Tellerdistortion then splits the levels by about 0.2 eV, with approximately 33% greater occupancyfor the lower level.
delay we would expect to get destructive interference, resulting in a decrease in the excited-state occupancy. However, this time delay should still give constructive interference for thebreathing mode, since the ratio of the delay to the breathing-mode period is 62.8/31.2 =2.013. The results for the excited-state electron occupancy are shown in Fig. 39, whichclearly reveals that the result of the control pulse was to depopulate the excited states,leaving only about 2×10⁻²% of these states occupied. The effect on the vibrations is shownin Fig. 40, which shows that this vibration was decreased by a factor of 7 when comparedto the simulation with no control pulse, even though one might have expected that thiscommensurate time delay would increase the breathing-mode amplitude. Nevertheless, thischosen pump-pulse, control-pulse sequence has left the system with virtually no occupationof the excited states, while having a far smaller effect on the coherent breathing mode.
We now consider the results of a pump-pulse, control-pulse simulation with a time delayof 46.8 fs, which, in the simple picture involving destructive interference, should depopulatethe excited states as well as suppress the breathing-mode vibration. The results for thepopulation of excited states are shown in Fig. 41. Although the population begins todecrease at the onset of the control pulse, it starts to rise approximately halfway throughthe pulse, and at the end there is a net increase in the excited-state population of roughly40%. Detailed study reveals a subtlety behind this phenomenon, which demonstrates thatthe interplay of electron and ion dynamics can be surprisingly complex. If we look at
33

0
0.005
0.01
0.015
0.02
0.025
0 2 4 6 8 10 12 14 16 18 20
Population of Excited States
Time (fs)
Figure 45: Electron population of the excited states resulting from a 10 fs FWHM laserpulse, centered at 2.0 eV and with a fluence of 1.1 × 10⁻² KJ/m2. Notice that there is nonet occupancy of the excited states at the end of the pulse.
0
0.01
0.02
0.03
0.04
0.05
0.06
0.07
0.08
0.09
0 500 1000 1500 2000 2500 3000 3500
Intensity (arb. units)
Frequency [cm-1]
Figure 46: Fourier power spectrum of a one picosecond simulation following a 10 fs FWHMlaser pulse, centered at 2.0 eV with a fluence of 1.1× 10⁻² KJ/m2.
the Fourier power spectrum in Fig. 42, we see that the control was extremely effective indecreasing the intensity of the breathing-mode vibration, reducing it by a factor of nearly400. Furthermore, if we look at the kinetic energy during this simulation, as shown in
34

0
0.1
0.2
0.3
0.4
0.5
0.6
0.7
0.8
0.9
0 500 1000 1500 2000 2500 3000 3500
Intensity (arb. units)
Frequency [cm-1]
Figure 47: Fourier power spectrum for a one picosecond simulation following a pump-pulse,control-pulse sequence, using two identical laser pulses of 10 fs FWHM duration, centeredat a photon energy of 2.0 eV, and with a fluence of 1.1 × 10⁻² KJ/m2. The control pulsewas delayed by 63.14 fs in order to enhance the breathing mode. One can see that there isindeed an order-of-magnitude increase in the breathing mode amplitude as compared to Fig.46.
Fig. 43, we see that initially this quantity was dramatically decreased, since most of it wasassociated with the breathing-mode vibration. However, following the control pulse there isa significant occupancy of the initially-degenerate excited states. The result is a Jahn-Tellerdistortion which splits these two levels by approximately 0.2 eV, with approximately 33%greater occupancy of the lower level, as shown in Fig. 44.
These coherent-control simulations for benzene have thus provided a clear demonstrationof the complex interplay between electronic excitations and molecular vibrations.
Finally, we show how depopulation of excited states, after the laser pulse is complete,can lead to control of the vibrational motion for ultrashort nonresonant pulses. Fig. 45 isa plot of the electron population of the excited states following a 10 fs FWHM laser pulse,centered at a photon energy of 2.0 eV, with a fluence of 1.1 × 10⁻² KJ/m2. Notice thatthere is no net occupation of the excited states at the end of the pulse. The resulting Fourierpower spectrum, for a simulation of one picosecond following the laser pulse, is shown in Fig.46. If we now use two identical pulses in a pump-pulse, control-pulse sequence, time-delayedby 63.14 fs, we obtain constructive interference for the breathing-mode vibration. As canbe seen in Fig. 47, there is an order-of-magnitude increase in the excitation of this mode.On the other hand, if we delay the control pulse by 77.63 fs, in order to achieve destructiveinterference for the breathing mode, we get the result shown in Fig. 48: a decrease in thebreathing-mode amplitude by more than a factor of 10. Notice also that the control of thebreathing mode, over a range of more than 2 orders of magnitude, has been attained with
35

0
0.005
0.01
0.015
0.02
0.025
0.03
0.035
0 500 1000 1500 2000 2500 3000 3500
Intensity (arb. units)
Frequency [cm-1]
Figure 48: Fourier power spectrum for a one picosecond simulation following a pump-pulse,control-pulse sequence using two identical laser pulses of 10 fs FWHM duration, centeredat 2.0 eV with a fluence of 1.1 × 10⁻² KJ/m2. The control pulse was delayed by 77.63 fsin order to diminish the breathing mode. One can see that there is more than an order ofmagnitude decrease in the breathing mode amplitude as compared to Fig. 46.
essentially no effect on the other vibrational modes.
8 Conclusion
In this paper we studied the following specific problems:(1) Photoinduced cycloaddition of ethylene molecules. When two ethylene molecules ap-
proach each other in the ground state as in Figs. 5 and 6, they do not react even at highenergy. After absorption of laser radiation, however, one molecule is in a more reactive ex-cited state, and a strongly attractive bonding interaction is oberved in our simulations. Onecan see in Fig. 10 that the molecules are in fact pulled together quickly by this interaction.
(2) Selective photodissociation of cyclobutane. In Fig. 14, the cyclobutane moleculecleanly separates into two ethylene molecules. Moreover, with the present approach one canmonitor the detailed behavior on a femtosecond time scale. We found that the reaction pro-ceeds through a tetramethylene reaction intermediate, as portrayed in Fig. 12 and actuallyobserved in Fig. 14.
(3) Photoisomerization of butadiende. Both the trans-to-cis and cis-to-trans isomeriza-tions were observed in our simulations. All the features of the molecular motion during thetransition can be studied in detail – for example, a rotation about the carbon-carbon bondin Fig. 24.
(4) Two-pulse coherent control of benzene. One can enhance the population of excitedelectrons, as in Fig. 37, or drive them back to the ground state, as in Fig. 39. One can also
36

greatly enhance specific vibrational modes, as in Fig. 38, or greatly suppress them, as inFig. 42.
These results demonstrate that it is possible to perform realistic simulations of moleculesresponding to laser pulses, and that such simulations can provide genuine guidance towardachieving the goal of laser control of chemical reactions.
Acknowledgement
This work was supported by the Robert A. Welch Foundation.
37

References
[1] W. S. Warren, H. Rabitz, and M. Dahleh, Science 259, 1581 (1993).
[2] J. S. Graves and R. E. Allen, Phys. Rev. B 58, 13 627 (1998).
[3] T. Dumitrica and R. E. Allen, Solid State Commun. 113, 653 (2000).
[4] T. Dumitrica, B. Torralva, and R. E. Allen, in The Optical Properties of Materials,edited by J. Chelikowsky, S. Louie, G. Martinez, and E. Shirley (Materials ResearchSociety, Warrendale, Pennsylvania, 2000).
[5] R. E. Allen, T. Dumitrica, and B. Torralva, Chapter 7 of Ultrafast Physical Processesin Semiconductors, edited by K. T. Tsen (Academic, New York, 2001).
[6] B. R. Torralva, Ph. D. dissertation, Texas A&M University (May, 2001).
[7] B. Torralva, T. Niehaus, M. Elstner, Th. Frauenheim, S. Suhai, and R. E. Allen, to bepublished.
[8] B. Torralva and R. E. Allen, to be published.
[9] D. Porezag, Th. Frauenheim, Th. Kohler, G. Seifert, and R. Kaschner, Phys. Rev. B.51, 12947 (1994).
[10] Th. Frauenheim, F. Weich, Th. Kohler, S. Uhlmann, D. Porezag, and G. Seifert, Phys.Rev. B 52, 11492 (1995).
[11] A. Sieck, D. Porezag, Th. Frauenheim, M. R. Pederson, and K. Jackson, Phys. Rev. A56, 4890 (1997).
[12] M. Elstner, D. Porezag, G. Jungnickel, J. Elsner, M. Haugk, Th. Frauenheim, S. Suhai,and G.Seifert, Phys. Rev. B 58, 7260 (1998).
[13] R. B. Woodward and R. Hoffmann, The Conservation of Orbital Symmetry (Academicpress, 1970).
[14] R. Hoffmann, S. Swaminathan, B. G. Odell, and R. Gleiter, J. Am. Chem. Soc. 92,7091 (1970).
[15] S. Pedersen, J. L. Herek, and A. H. Zewail, Science 266, 1359 (1994).
[16] R. A. Mathies, Novartis Foundation Symposium 226: Rhodopsin & Phototransduction(John Wiley & Sons, 1999).
[17] S. W. Lin, M. Groesbeek, I. van der Hoef, P. Verdegem, J. Lugtenburg, and R. A.Mathies, J. Phys. Chem. B 102, 2787 (1998).
[18] G. Muller, K. K. Gneuss, H.-P. Kriemler, A. I. Scott, and A. J. Irwin, J. Am. Chem.Soc. 101, 3658 (1979).
38

[19] M. Hase, K. Mizoguchi, H. Harima, S. Nakashima, M. Tani, K. Sakai, and M. Hangyo,Appl. Phys. Lett. 69, 2474 (1996).
[20] A. P. Heberle, J. J. Baumberg, and K. Kohler, Phys. Rev. Lett. 75, 2598 (1995).
[21] E. H. Hertz, O. Faucher, B. Lavorel, F. DallaVia, and R. Chaux, Phys. Rev. A 61,33816 (2000).
[22] E. D. Potter, J. L. Herek, S. Pedersen, Q. Liu, and A. H. Zewail, Nature 355, 66 (1992).
[23] A. P. Peirce, M. A. Dahleh, and H. Rabitz, Phys. Rev. A 37, 4950 (1988).
[24] J. L. Krause, R. M. Whitnel, K. R. Willson, Y. Yan, and S. Mukamel, J. Chem. Phys.99, 6563 (1993).
[25] M. Shapiro, J. Phys. Chem, 97, 7396 (1993).
[26] V. Blanchet, M. A. Bouchene, and G. Girard, J. Chem. Phys. 108, 4862 (1998).
[27] S. M. Park, S. P. Lu, and R. J. Gordon, J. Chem. Phys. 94, 8622 (1991).
[28] V. D. Kleiman, L. Zhu, H. Alen, and R. J. Gordon, J. Chem. Phys 103, 10800 (1995).
39