mechanismsof hanging causedby dust in shaft furnace
TRANSCRIPT
ISIJ International, Vol. 31 (1 991 ), No. 9, pp. 939-946
Mechanismsof Hanging Causedby Dust In a Shaft Furnace
Hideyuki YAMAOKAlron and Steel Research Laboratories. Research and Development Division, SumitomoHasaki-cho. Kashima-gun. Jbaraki-ken, 31 4-02 Japan.
(Received on February 13. 1991, accepted in final form on April 26. 1991)
Meta l Industries, Ltd. . Sunayama,
The mechanismof hanging caused by the dust in reducing gas in the reduction shaft furnace wasinvestigated. Through experimental studies using a rectangular model and theoretical studies using a twodimensional mathematical simulation model, it was clarified that the dust in reducing gas stuck on thepacked particles to form a dust blockade zone in front of tuyeres and whenthe dust concentration of re-
ducing gas was increased or the descending velocity of packed bed wasdecreased, the dust blockade zoneexpandedand the gas pressure drop increased to cause hanging.
KEYWORDS:shaft furnace; hanging; dust; two phase flow of gas and powders; mathematical model.
l. Introduction
In the analysis of the blast furnace the gas flow hasusually been regarded as the clean gas flow and rep-resented with Ergun's equation, etc. However, manykinds of dust are produced through manyprocesses such
as the size degradations of coke and ore by mechanicalforces and the recoagulation of vapors of metal andmetaloxide evaporated in the high temperature region and theyaffect on the gas fiow in the blast furnace. From this
point of view, characteristics of the two phase flow of
gas and powder in packed bed was investigated and its
effect on the permeability of commercial blast furnace
wasdiscussed previously by the author.1'2)
Onthe other hand, in the pilot plant operation of the
newironmaking process namedSCprocess consisted ofthe shaft type reduction furnace and the cupola type
melting furnace, 3'4) ahanging phenomenonwasobservedwhenthe reducing gas containing dust was used at the
reduction furnace. This can be regarded as a typical
exampleto showthe effects of the dust in gas on the gasflow as well as on the desce~rt of burden.
Here, theoretical as well as experimental studies weremade to clarify the connection between the dust in
reducing gas and the hanging phenomenonoccurred in
the shaft type reduction furnace.
2. Hanging Phenomenonin the Reduction Furnace
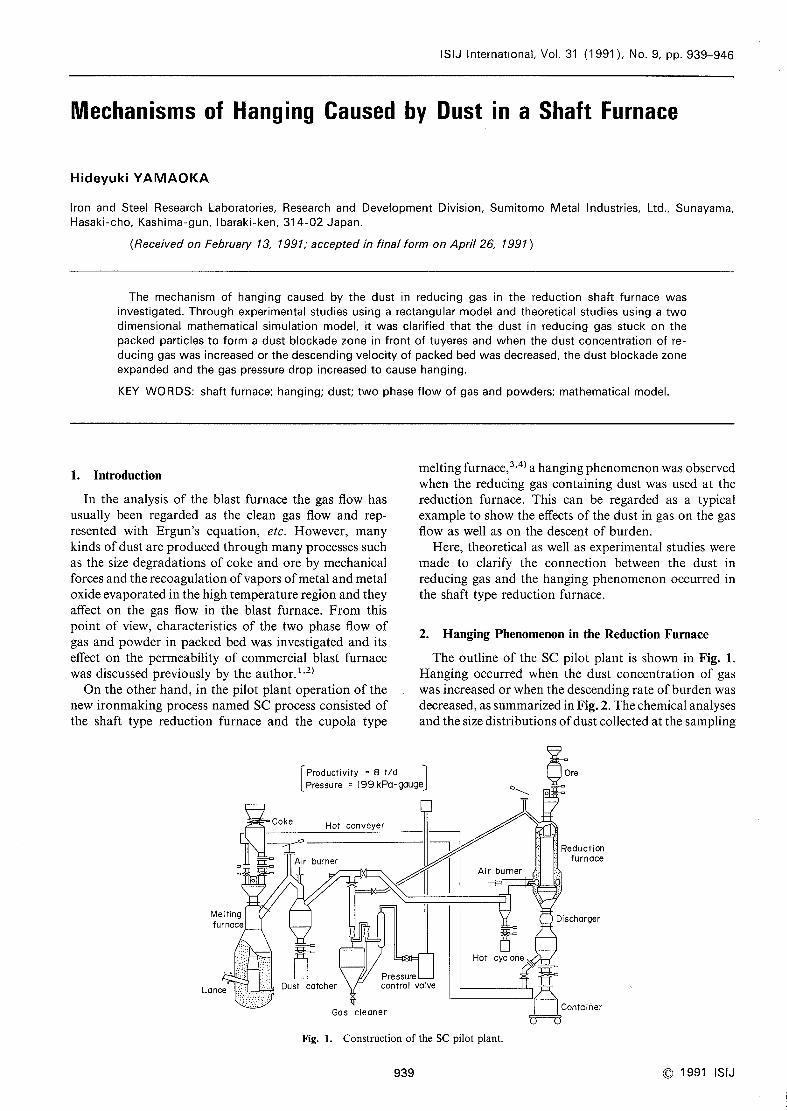
The outline of the SCpilot plant is shownin Fig. l.
Hanging occurred when the dust concentration of gaswasincreased or whenthe descending rate of burden wasdecreased, as summarizedin Fig. 2. Thechemical analyses
and the size distributions of dust collected at the sampling
lproductivity * 8 t/d
pressure ' 199kPa-gaugeJ
~~,=r..**
^''
Hot conveyer
Meiting
furnace
burner
I~1-]
~~
Lance Dust catcher
Air burner
Pressurecontrol vaive
Hot cyclone ~~:~
~•,-
Reductionfurnace
Discharger
~~
Gas ceaner
Fig. 1. Construction of the SCpilot plant.
';contaiher
939 C 1991 ISIJ
ISIJ International, Vol. 31 (1991 ), No, 9
Table l. Properties of dust collected from the reduction furnace pilot plant.
Chemical analysis (wto/.)
Sampling point T.C T.Fe Si02 Al203 MgO CaO Na20+K20 S
Dust catcher
Hot cycloneInlet of R.F.
62.443.912.6
8.2
4. l2.9
l I.8
22.0
35.3
5.9
9.8
l5.4
l .5
2. l5,9
5.5
l0.4
l9.4
0.461.14
8.9
l .O
0.7
0.5
Size distribution (wto/o)
Sampling point #60 60- IOO lO(~l50 I50-200 20C)-325 325
Dust catcher
Hot cycloneInlet of R.F.
4.94O. 170.06
8.23
0.02
0.05
8.60
o.07
0,07
6.72O. 180.04
l0.82
l.13
0.04
60.6999.4399.74
Ez\o,
oo]
oo
oc
o
::
Q
40
30
20
IO
o J~-o
,
B
A
e A
HangjngJo Sinter
~ Pellet
~:\
o~$4;
e:~~\~~~
\:~*
\c;~)\e
C \;(~
8A oo~ooo
Fig. 2.
e:~
o~4;
O I.O 4.O2.0 5.0
Descending rate (crn/min)
Effects of the dust concentration in gas anddescending rate on the occurrence of hanging.
(mm)
Tuyere
(Na2o+K20 kg/t}
Sinter Coke Dust0.7i .54 2. 18
m)+2500
~J+2000 (Ha f melt)
+1500
+IOOO (MeIt)
+500 CoolO, 13
~:o o. 8- 500
0.20Slag (!) 180
l -2K,o)+Si02+coNa2Si03 +c- 2Na,1' +Si02+co
theManometersstand
Fig. 4.
Filter
h t250wxlooo x43
Dispenser
Tuyere
Air
Dlscharger
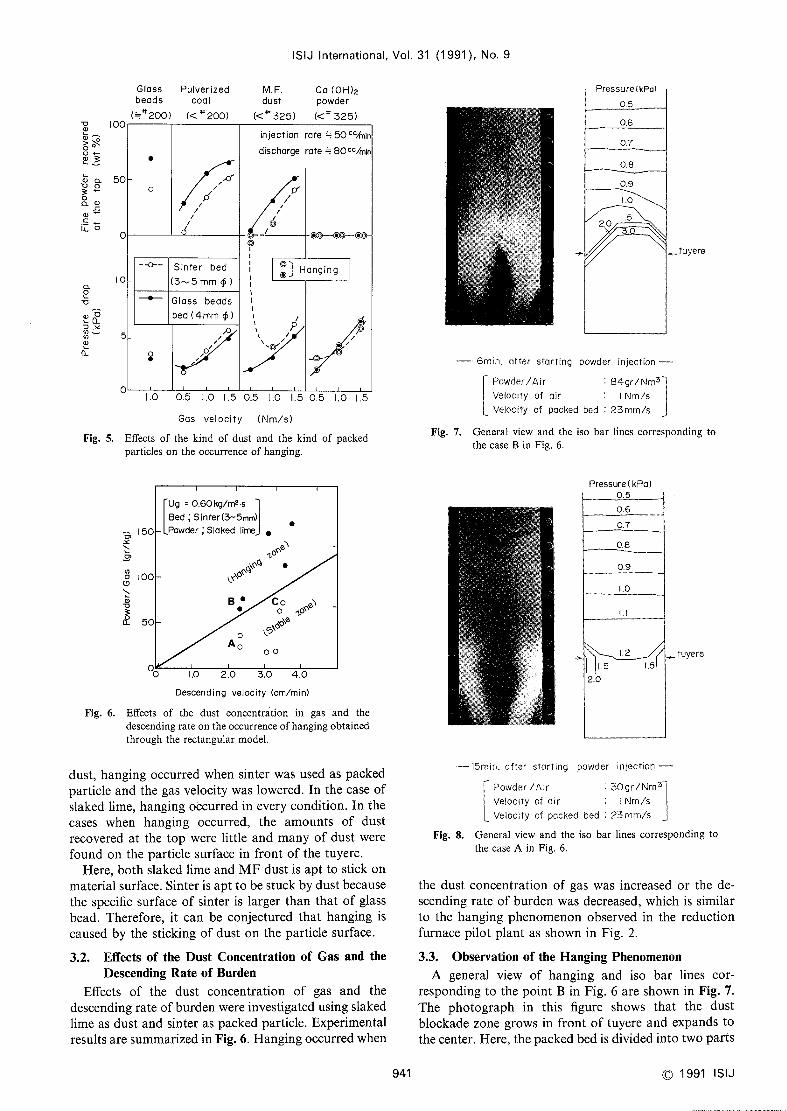
Rectangular model used to investigate the hangingphenomenoncaused by dust in the reduction furnacepilot plant.
alkaline materials charged into the furnace evaporate in
the lower part of the furnace and go out of the furnace
as dust mixed with gas.Followed by these results, it can be considered that
the dust produced through the recoagulation of vaporproduced in the high temperature region of the meltingfurnace fiows into the reduction furnace and causeshanging.
oR 2~9)+2C02- K2C05+co
2Nacg'+2C02- Na2CO5+co
Fig. 3. Circulating behavior of alkaline materials inside the
melting furnace pilot plant.
points along the gas duct are listed in Table l. Thedustpassed through the dust catcher and the hot cyclone wasvery small and enriched with alkaline materials. Thebehavior of alkaline materials in the melting furnaceestimated through the chemical analyses of coke, ore andslag sampledfrom the melting furnace after quenchedis
shownin Fig. 3. This figure indicates that most of the
3. Rectangular ModelExperiment on the MechanismofHanging
An experimental study wasmadeon the mechanismof hanging observed in the reduction furnace with arectangular modelshownin Fig. 4. Glass bead, pulverizedcoal, slaked lime and MFdust (melting furnace dust)collected from the SCpilot plant wereused as dust. Glassbead and sinter with the diameter between 3and 5mmwere used as packed particle.
3.1. Effects of the Kind of Dust and the Kind of PackedParticle
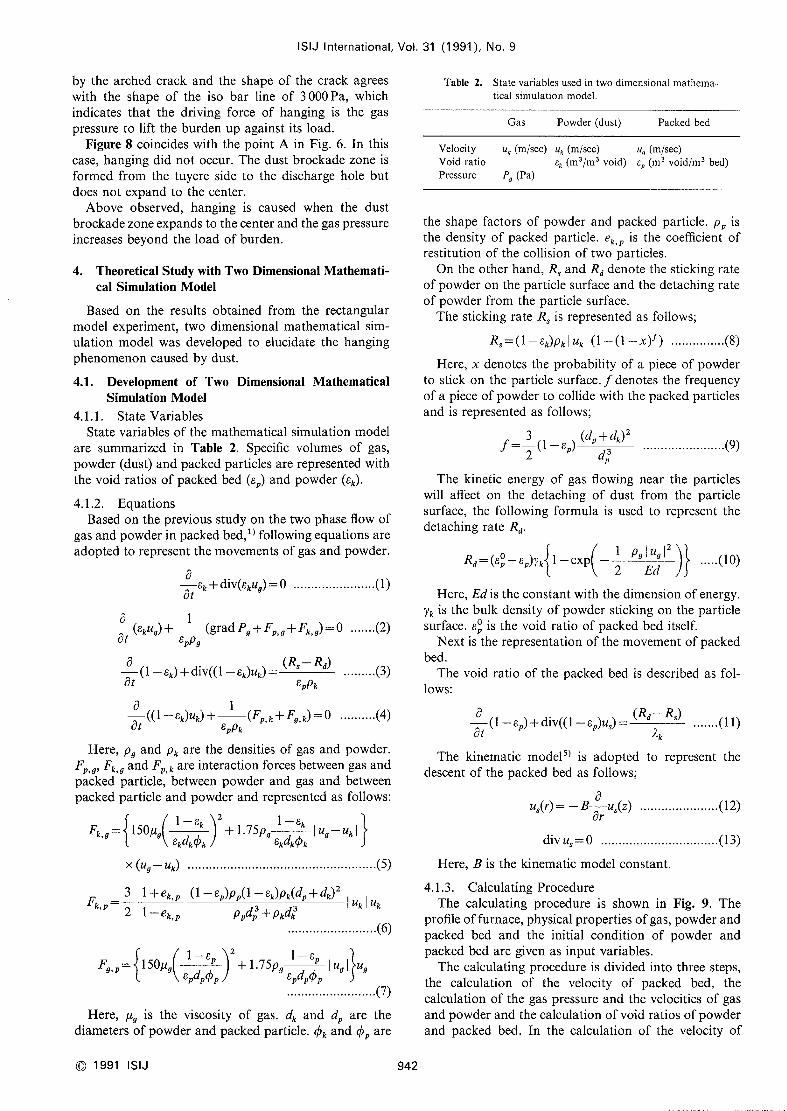
Effects of the kind of dust and the kind of packedparticles were investigated. Experimental results aresummarizedin Fig. 5. In the case of pulverized coal orglass bead, hanging did not occur. In the case of MF
C 1991 ISIJ 940
IS]J International, Vol. 31 (1991). No, 9
1:'
~o(~;>>~oo-cD~
(1'c~~:)o~~ocLe)
~:e'
c:~~lo
~o10
Q,VLO_::~e
CL
lOO
Fig. 5.
50
o
IO
5
o
Glassbeads
(~#200)
Pulverized MF. CaCOH)2coai dust powder
( # 200) ( 325) ( 325)
injection rate ~~ 50cc/min
discharge rate ~80cclmine
~r/
o // ;f
;) // /
/ /// /
/ C/ ~~~~C-~~
CI~
- ~o••- Sinter bed
3-5 mmc) i lCC Hangjng
[l-f- Glass beads ltbed (4mmc) !1 ? ,
lO /lC
/ \ //\C//
8 ol/
/ ~>.~'
l,
lO O.5 10 1.5 O.5 1.0 15 05 1.0 .5
Gas veloclty (Nmls)
Effects of the kind of dust and the kind of packedparticles on the occurrence of hanging.
Pressu re (kPa)05
oe
0.7
080.9
IO
2.0 5~I{~~
~~_tu ye~e
Fig.
- emin Gffer starting powder injection --: 84gr/Nms~;Powder/ Air
Veiocity of clir : INmlsiL_
Velocity of pecked bed : 23mm/s_
7. General view and the iso bar lines corresponding to
the case Bin Fig. 6.
~150
x\I~
~ iOO(~)
\~~~ 50
o
Ug = 0.60kg/m2 sBed;Sinter(3-5mm)
ePowder;Slaked lime e1;o(~e~
~~~!C;(~~\(~f~e
B e coo
o
~~;~c;~~\e
Aoo o
e~1;o~,
Fig. 6.
O I.O 2.O 3. O 4.O
Descending velocity (cm/min)
Effects of the dust concentr~tion in gas and the
descending rate on the occurrence of hanging obtainedthrough the rectangular model.
dust, hanging occurred whensinter wasused as packedparticle and the gas velocity was lowered. In the case of
slaked lime, hanging otcurred in every condition. In the
cases when hanging occurred, the amounts of dust
recovered at the top were little and manyof dust werefound on the particle surface in front of the tuyere.
Here, both slaked lime andMFdust is apt to stick onmaterial surface. Sinter is apt to be stuck by dust becausethe specific surface of sinter is larger than that of glass
bead. Therefore, it can be conjectured that hanging is
caused by the sticking of dust on the particle surface.
3.2. Effects of the Dust Concentration of Gasand the
DescendingRate of BurdenEffects of the dust concentration of gas and the
descending rate of burden were investigated using slaked
lime as dust and sinter as packed particle. Experimentalresults are summarizedin Fig. 6. Hangingoccurred when
Pressure (kPa)0.5
oe07O.8
0.9
IO
ij
*\~~~*12IS i5
2.0
_t~i ye~e
Fig.
IRmln efter stc{rtin~ pawder injection -* Powder/Air : :50gr/Nm3**
: I Nrr)/sVeiocity of air
Veiac]ty of pclcked bed : 2Smrr{/5_
8. General view and the iso bar lines corresponding to
the case A in Fig, 6.
the dust concentration of gas was increased or the de-
scending rate of burden wasdecreased, which is similar
to the hanging phenomenonobserved in the reductionfurnace pilot plant as shownin Fig. 2.
3.3. Observation of the Hanging Phenomenon
A general view of hanging and iso bar lines cor-responding to the point Bin Fig. 6are shownin Fig. 7.
The photograph in this figure shows that the dust
blockade zone grows in front of tuyere and expands to
the center. Here, the packedbed is divided into two parts
941 C 1991 ISIJ
ISIJ International, Vol. 31
by the arched crack and the shape of the crack agreeswith the shape of the iso bar line of 3OOOPa, whichindicates that the driving force of hanging is the gaspressure to lift the burden up against its load.
Figure 8coincides with the point A in Fig. 6. In this
case, hanging did not occur. The dust brockade zone is
formed from the tuyere side to the discharge hole butdoes not expand to the center. '
Above observed, hanging is caused when the dust
brockadezoneexpandsto the center and the gas pressureincreases beyond the load of burden.
4. Theoretical Study with TwoDimensional Mathemati-cal Simulation Model
Based on the results obtained from the rectangular
model experiment, two dimensional mathematical sim-ulation model was developed to elucidate the hangingphenomenoncaused by dust.
4.1. Development of Two Dimepsional MathematicalSimulation Model
4. I . I .State Variables
State variables of the mathematical simulation modelare summarized in Table 2. Specific volumes of gas,
powder(dust) and packed particles are represented withthe void ratios of packed bed (8p) and powder (8k).
4. I . 2.Equations
Basedon the previous study on the two phase flow of
gas andpowderin packedbed,1) following equations areadopted to represent the movementsof gas and powder.
aek +div(8kug) =O... .... . ..... .at
a 1(8kug) + (grad Pg+Fp,g +Fk,g) =O......,(2)
at 8pPg
a (R - Rd)(1 - 8k) +div((1 - 8k)uk) = *
et 8ppk
a 1 (4)((1 -8k)uk)+ (Fp,k+Fg,k)=0..........et 8pPk
Here, pg and pk are the densities of gas and powder.Fp,g' Fk,g and Fp,k are interaction forces betweengas andpacked particle, between powderand gas and betweenpacked particle and powderand represented as follows:
(1 991 ). No. 9
Table 2. State variables used in two dimensional mathema-tical s;mulation model.
Gas Powder(dust) Packedbed
::=g g g
k}k21-8k I -8Fk'g 150u8kdkc +175p 8kdkipkk Iu -u l
x (ug-uk)........
..........(5)
FkP
3 1+ek,P (1-8P)Pp(1-8k)Pk(dp+dk)21ukluk
' ~ 2 l-ek,P ppdp +pkdk.(6)
2
g Iug
l}ug=: g
1-~p I -8Fg'p 150'lepdpcp +175p 8pdpcPp
.(7)
Here. ,lg is the viscosity of gas. dk and dp are the
diameters of powderand packedparticle. ck and cp are
Velocity ug (m/sec) uk (m/sec) u~ (m/sec)
Void ratio 8k (m3/m3void) ep (m3 void/m3 bed)Pressure pg (Pa)
C 1991 ISIJ 942
the shape factors of powder and packed particle. pp is
the density of packed particle. ek,P is the coefficient ofrestitution of the collision of two particles.
Onthe other hand, Rsand Rddenote the sticking rateof powderon the particle surface and the detaching rateof powder from the particle surface.
The sticking rate Rs is represented as follows;
Rs=(1 -ek)Pk Iuk I(1 -(1 -x y) ...............(8)
Here, x denotes the probability of a piece of powderto stick on the particle surface. f denotes the frequencyof a piece of powderto collide with the packedparticles
and is represented as follows;
f ~(1-8p) (dp+dk)2..........(9)
d; """"'
The kinetic energy of gas flowing near the particles
will affect on the detaching of dust from the particle
surface, the following formula is used to represent the
detaching rate Rd.
-)}
Rd=(e~-8p)yk I pglugl2..
(lO)l - exp2 Ed
Here, Edis the constant with the dimension of energy.yk is the bulk density of powdersticking on the particle
surface. 8~ is the void ratio of packed bed itself.
Next is the representation of the movementof packedbed
.
The void ratio of the packed bed is described as fol-
10ws:
e (Rd- R.)
at(1 - 8P) +div((1 - 8p)us) = """'(1 1)
~k
The kinematic model5) is adopted to represent thedescent of the packed bed as follows;
au*(r)= -B-u*(z) .................(12)
er
divus=0......
..........(13)
Here, Bis the kinematic model constant.
4. I.3. Calculating ProcedureThe calculating procedure is shown in Fig. 9. The
profile of furnace, physical properties of gas, powderandpacked bed and the initial condition of powder andpacked bed are given as input variables.
The calculating procedure is divided into three steps,
the calculation of the velocity of packed bed, the
calculation of the gas pressure and the velocities of gasandpowderand the calculation of void ratios of powderand packed bed. In the calculation of the velocity of
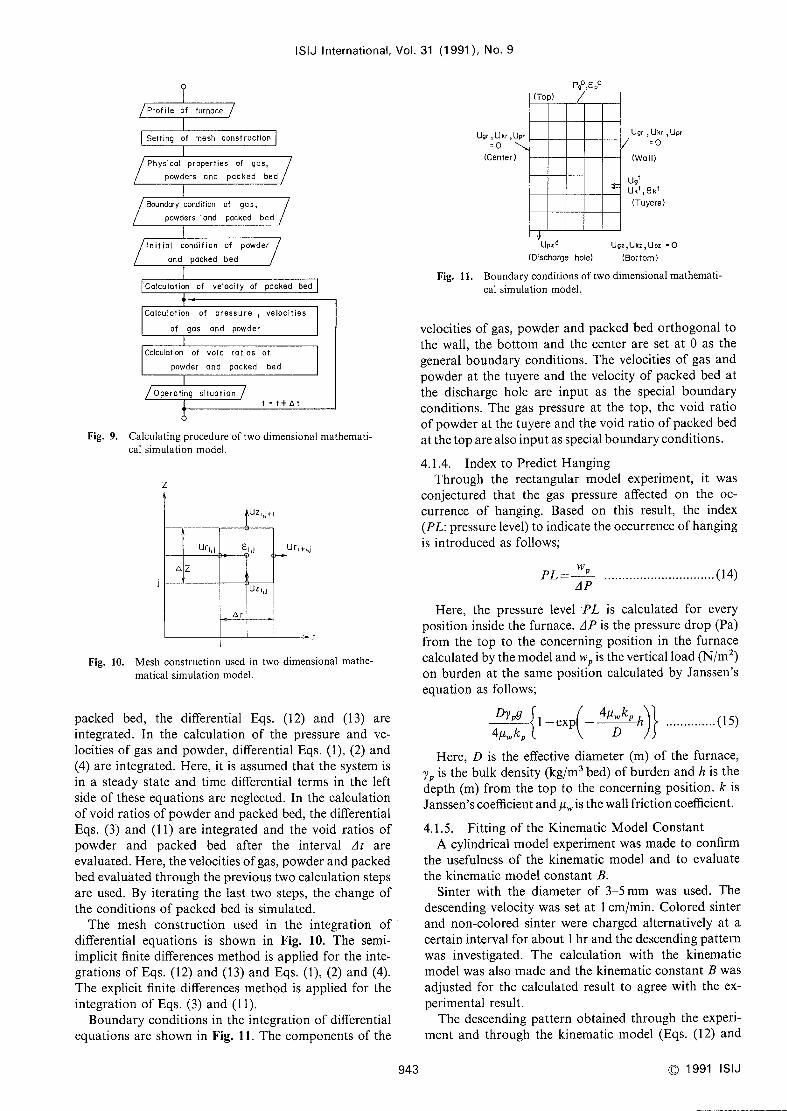
ISIJ International, Vol. 31
Prof i ie of furnace
Setting of mesh construction
Physical proper,ies of gos,
powders and packed bed
Boundary condition
powders and
of gas,paeked bed
Initia condifion
and packed
of
bed
powder
Calcuiation of velocity of pocked bed
Caicuiation of
of gas
pressure ,
and powder
velocities
Calculotion of
powder
void ratos
and packed
of
bed
Operating situation
t 't+LLt
Fig. 9. Calculating procedure oftwo dimensional mathemati-cal simulation model.
Z
(1991 ), No. 9
V9r, ukr
,Upr
(Center)
Pgo,Spo
(Top)
ukr,Upr U9r
, U=0 =0
center) (WaII)UgTUkt
, ek(Tuyer
Uzd
Ukr,Upr
=0
Ukt, ekt
(Tuyere )
Upzd ugz,Uk:,Upl =0(Discharge hole) (Bottorn)
Fig. I l. Boundaryconditions of two dimensional mathemati-cal simulation model.
J
r
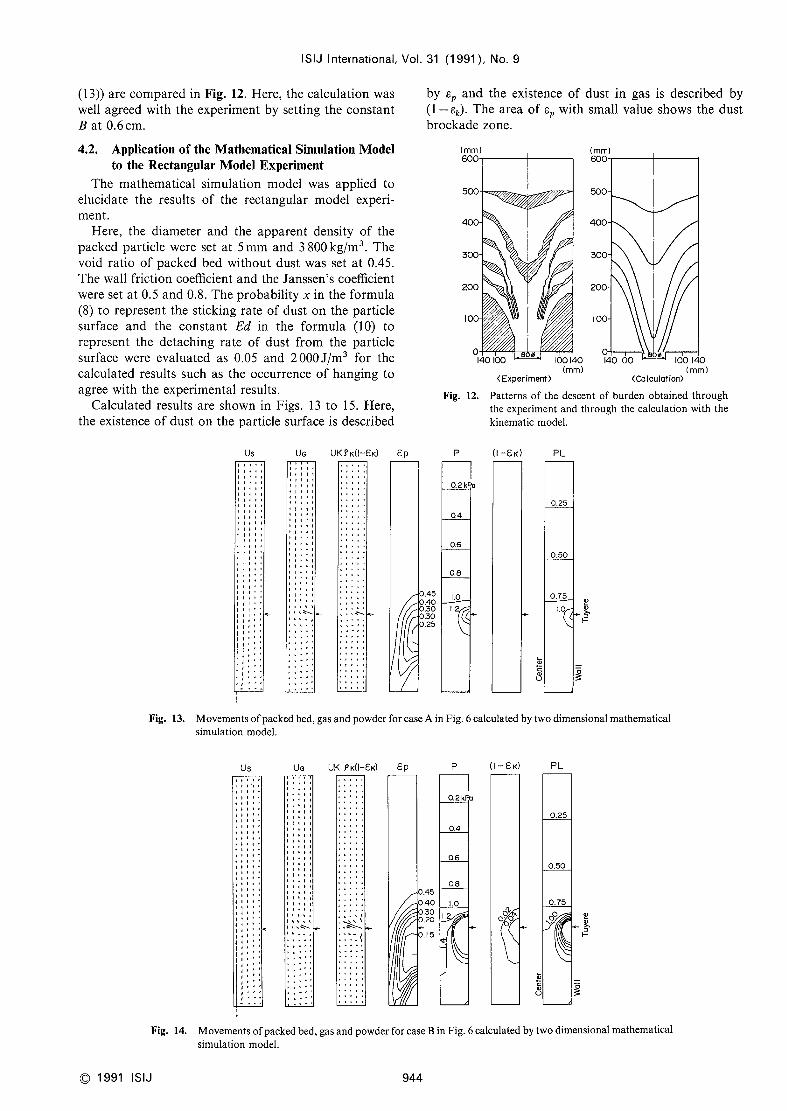
Fig. lO. Meshconstruction used in two dimensional mathe-matical simulation model.
packed bed, the differential Eqs. (12) and (13) areintegrated. In the calculation of the pressure and ve-locities of gas and powder, differential Eqs. (1), (2) and(4) are integrated. Here, it is assumedthat the system is
in a steady state and time differential terms in the left
side of these equations are neglected. In the calculation
of void ratios of powderand packedbed, the differential
Eqs. (3) and (1 l) are integrated and the void ratios ofpowder and packed bed after the interval At areevaluated. Here, the velocities of gas, powderandpackedbedevaluated through the previous two calculation steps
are used. By iterating the last two steps, the change ofthe conditions of packed bed is simulated.
The mesh construction used in the integration ofdifferential equations is shown in Fig. lO. The semi-implicit finite differences methodis applied for the inte-
grations of Eqs. (12) and (13) and Eqs. (1), (2) and (4).
The explicit finite differences method is applied for the
integration of Eqs. (3) and (1 1).
Boundaryconditions in the integration of differential
equations are shownin Fig. Il. The componentsof the
943
velocities of gas, powderand packed bed orthogonal to
the wall, the bottom and the center are set at Oas the
general boundary conditions. The velocities of gas andpowderat the tuyere and the velocity of packed bed at
thc discharge hole are input as the special boundaryconditions. The gas pressure at the top, the void ratio
of powderat the tuyere and the void ratio of packed bedat the top are also input as special boundaryconditions.
4.1.4. Index to Predict HangingThrough the rectangular model experiment, it was
conjectured that the gas pressure affected on the oc-
currence of hanging. Based on this result, the index
(PL: pressure level) to indicate the occurrence of hangingis introduced as follows;
PL wp ..........(14)
AP "'
Here, the pressure level 'PL is calculated for everyposition inside the furnace. APis the pressure drop (Pa)
from the top to the concerning position in the furnacecalculated by the modelandwpis the vertical load (N/m2)
on burden at the sameposition calculated by Janssen's
equation as follows;
p - -)}Dy g I exp
4P~kph ,.
(15)4p*kp D
Here, D is the effective diameter (m) of the furnace,
yp is the bulk density (kg/m3 bed) of burden and his the
depth (m) from the top to the concerning position. k is
Janssen's coefficient and~* is the wall friction coefficient.
4.1.5. Fitting of the Kinematic Model Constant
A cylindrical model experiment wasmadeto confirmthe usefulness of the kinematic model and to evaluate
the kinematic modelconstant B.
Sinter with the diameter of 3-5 mmwas used. Thedescending velocity was set at I cm/min. Colored sinter
and non-colored sinter were charged alternatively at acertain interval for about I hr and the descending pattern
was investigated. The calculation with the kinematic
modelwasalso madeand the kinematic constant Bwasadjusted for the calculated result to agree with the ex-perimental result.
The descending pattern obtained through the experi-
ment and through the kinematic model (Eqs. (12) and
C 1991 ISIJ
ISIJ International, Vol. 31 (1 991 ), No. 9
(13)) are comparedin Fig. 12. Here, the calculation waswell agreed with the experiment by setting the constant
Bat 0.6cm.
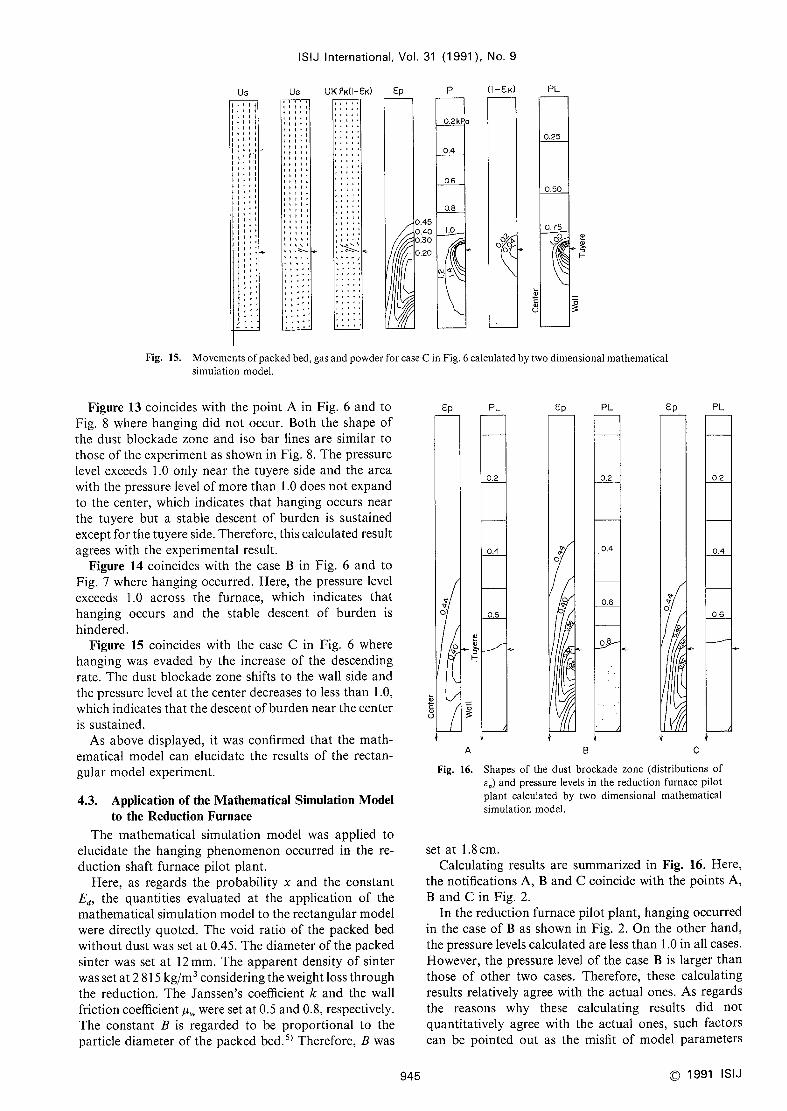
4.2. Application of the Mathematical Simulation Modelto the Rectangular Model Experiment
The mathematical simulation model was applied toeiucidate the results of the rectanguiar model experi-
ment.Here, the diameter and the apparent density of the
packed particle were set at 5mmand 3800kg/m3. Thevoid ratio of packed bed without dust was set at 0.45.
Thewall friction coefficient and the Janssen's coefficient
were set at 0.5 and O.8. Theprobability x in the formula(8) to represent the sticking rate of dust on the particle
surface and the constant Ed in the formula (lO) to
represent the detaching rate of dust from the particle
surface were evaluated as O.05 and 2OOOJ/m3for thecalculated results such as the occurrence of hanging to
agree with the experimental results.
Calculated results are shownin Figs. 13 to 15. Here,the existence of dust on the particle surface is described
by ep and the existence of dust in gas is described by(1 -8k). The area of 8p With small value shows the dustbrockade zone.
(mm) (mm)600 600
500 500
400 400
300 300
200 200
lOO IOO'~
o140 100 lOO140 14o oo ~ IOO140
(mm) (mm
Fig. 12.
(mm)Exper iment )
Patterns of the descent of burden obtained throughthe experiment and through the calculation with the
kinematic model.
Us UG
tllSlft' ,~~~:~ilIII'Itllll'rllllflItlrlllJt
jlrf"ll::i",**
UKSK(1 eK) 8p
0.45o40o~oo;;o
o25
P
0.2 kpa
0.4
0,6
08
ID
l
(1-8X) PL
0.25
o50
o75 ~I~:) w>,
H:,
~2,:s,
u~e
Fig, 13. Movementsof packedbcd, gas andpowderfor caseAin Fig. 6calculated by two dimensional mathematicalsimulation model.
Us UG
fltff ttl,tlitl' ttt,ttlf'l llt~lttttT tb\,~Lt I ' ' I L,~,~~tlflltt'llJtll'ItlltItfl'llfrl
Ul ?K(1-81 ep
\:~~:
0.45O.40O3C0.20
O. i5
P
O, 2kFa
04
0,6
0.8
iO
2
(l-8K)
oo,
o~~.
PL
o25
0.50
o75oo
H
u ~
Fig. 14. Movementsofpacked bed, gas andpowderforcase Bin Fig. 6calculated by two dimensional mathematicalsimulation model.
C 1991 ISIJ 944
ISIJ lnternational, Vol. 31 (1991), No. 9
UsIttttlltltlltilIt,liItlltlltllfllJ'll't'liltlI,tt,jllttjltLlllltlIttiillltllltiiIt~lfll~tt
t~'tlItltl'Ittafitljfl'~t'ltf"tl"jfl
UG
t *::~\
UKf K( I-8K) 8p
::~~T~:~
, .s~
o45o 40o~oo20
P
0.2kP
0.4
0,6
08
lO
QJ
(1 -e K)
op.(iz~
o
V
PL
0,25
o 50
o 75\o.o
:~
~
Fig. 15. Movementsof packedbed, gas andpowderfor case Cin Fig. 6calculated by two dimensional mathematicalsimulation model.
Figure 13 coincides with the point A in Fig. 6and toFig. 8where hanging did not occur. Both the shape ofthe dust blockade zone and iso bar lines are similar to
those of the experiment as shownin Fig. 8. Thepressurelevel exceeds I .O only near the tuyere side and the areawith the pressure level of morethan I .O does not expandto the center, which indicates that hanging occurs nearthe tuyere but a stable descent of burden is sustained
except for the tuyere side. Therefore, this calculated result
agrees with the experimental result.
Figure 14 coincides with the case B in Fig. 6and to
Fig. 7where hanging occurred. Here, the pressure level
exceeds I .O across the furnace, which indicates that
hanging occurs and the stable descent of burden is
hindered.Figure 15 coincides with the case C in Fig. 6where
hanging was evaded by the increase of the descendingrate. The dust blockade zone shifts to the wall side andthe pressure level at the center decreases to less than I .O,
which indicates that the descent of burden near the centeris sustained.
As above displayed, it wasconfirmed that the math-ematical model can elucidate the results of the rectan-gular model experiment.
4.3. Application of the Mathematical Simulation Modelto the Reduction Furnace
The mathematical simulation model was applied toelucidate the hanging phenomenonoccurred in the re-
duction shaft furnace pilot plant.
Here, as regards the probability x and the constantEd, the quantities evaluated at the application of the
mathematical simulation model to the rectangular modelwere directly quoted. The void ratio of the packed bedwithout dust wasset at O.45. Thediameter of the packedsinter was set at 12 mm.The apparent density of sinter
wasset at 2815kg/m3considering the weight loss throughthe reduction. The Janssen's coefficient k and the wallfriction coefficient ~~were set at O.5 and O.8, respectively.
The constant B is regarded to be proportional to the
particle diameter of the packed bed.5) Therefore, Bwas
945
o
ep
1~~1~f
O'
v:o
H.
~
AFig. 16.
PL
02
0.4
o~s
gp
I~~
o
~~,
PL
02
0,4
0.6
o~
8p
~~o
PL
02
04
06
B CShapes of the dust brockade zone (distributions of8p) and pressure levels in the reduction furnace pilot
plant calculated by two dimensional mathematicalsimulation model.
set at 1.8cm.Calculating results are summarizedin Fig. 16. Here,
the notifications A, Band Ccoincide with the points A,
Band Cin Fig. 2.
In the reduction furnace pilot plant, hanging occurredin the case of Bas shownin Fig. 2. Onthe other hand,the pressure levels calculated are less than I .O in all cases.
However, the pressure level of the case B is larger thanthose of other two cases. Therefore, these calculating
results relatively agree with the actual ones. As regards
the reasons why these calculating results did notquantitatively agree with the actual ones, such factors
can be pointed out as the misfit of model parameters
C 1991 ISIJ
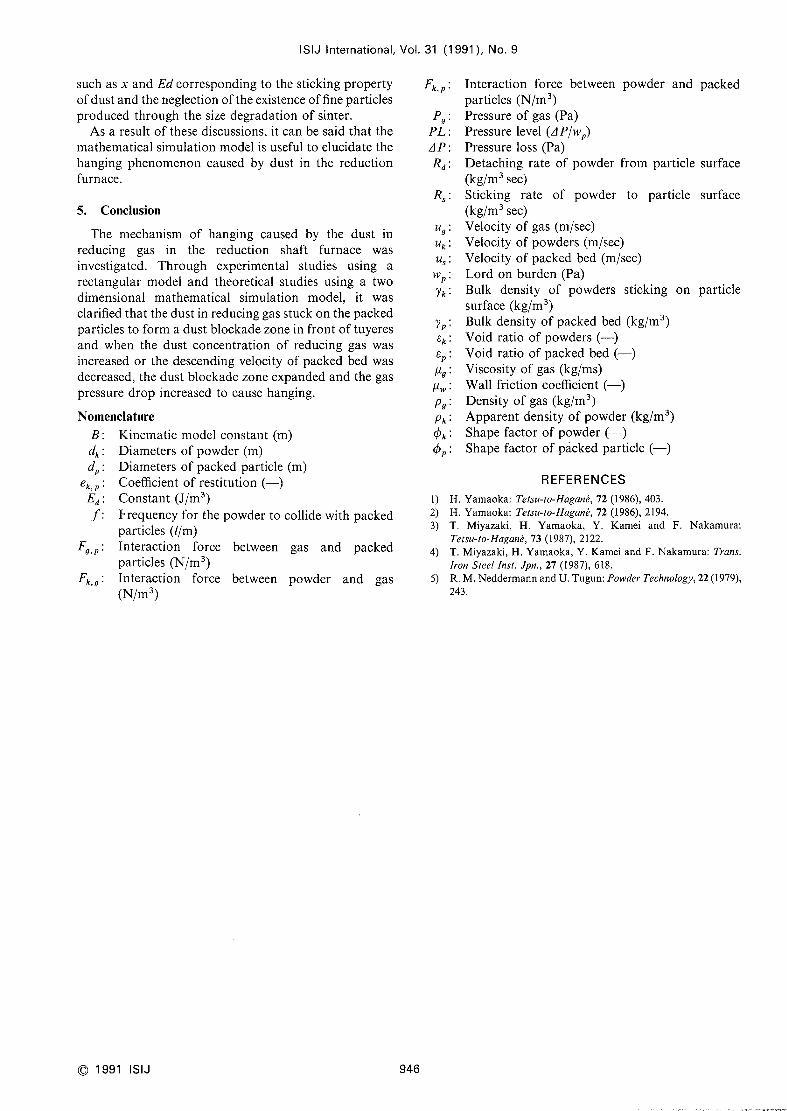
ISIJ International, Vol. 31
such as x and Edcorresponding to the sticking propertyof dust and the neglection of the existence of fine particles
produced through the size degradation of sinter.
As a result of these discussions, it can be said that the
mathematical simulation model is useful to elucidate the
hanging phenomenoncaused by dust in the reductionfurnace.
5. Conclusion
The mechanismof hanging caused by the dust in
reducing gas in the reduction shaft furnace wasinvestigated. Through experimental studies using arectangular model and theoretical studies using a twodimensional mathematical simulation model, it wasclarified that the dust in reducing gas stuck on the packedparticles to form a dust blockade zone in front of tuyeresand when the dust concentration of reducing gas wasincreased or the descending velocity of packed bed wasdecreased, the dust blockade zone expandedand the gaspressure drop increased to cause hanging.
Nomenclature
B: Kinematic model constant (m)dk : Diameters of powder(m)dp : Diameters of packed particle (m)
ek,p: Coefficient of restitution (-)Ed : Constant (J/m3).f : Frequency for the powderto collide with packed
particles (1/m)
Fg,p: Interaction force between gas and packedparticles (N/m3)
Fk,g: Interaction force between powder and gas(N/m3)
(1991 ), No. 9
Fk,P
Pg
PLAPRd
R.
ug
uk
us
Wpyk
yp8k
8p~g
~~PgPkck
cp
l)
2)
3)
4)
5)
Interaction force between powder and packedparticles (N/m3)Pressure of gas (Pa)
Pressure level (AP/wp)Pressure loss (Pa)
Detaching rate of powder from particle surface(kg/m3 sec)
Sticking rate of powder to particle surface(kg/m3 sec)
Velocity of gas (m/sec)
Velocity of powders (m/sec)Velocity of packed bed (m/sec)
Lord on burden (Pa)
Bulk density of powders sticking on particle
surface (kg/m3)Bulk density of packed bed (kg/m3)
Void ratio of powders (-)Void ratio of packed bed (-)Viscosity of gas (kg/ms)Wall friction coefficient (-)Density of gas (kg/m3)
Apparent density of powder(kg/m3)
Shapefactor of powder(-)Shapefactor of phcked particle (-)
REFERENCESH. Yamaoka:Tetsu-to-Hagan~, 72 (1986), 403.
H, Yamaoka:Tetsu-to-Hagan~, 72 (1986), 2194.
T. Miyazaki, H. Yamaoka, Y. Kamei and F. Nakamura:Tetsu-to-Hagan~, 73 (1987), 2122.
T. Miyazaki, H. Yamaoka,Y. Kameiand F. Nakamura:Trans.
hon stee/ Inst. Jpn., 27 (1987), 618.
R. M, NeddermannandU. Tugun: PowderTechno!ogy, 22 (1979),
243.
C 1991 ISIJ 946