mechanization of soil salinity assessment for mapping - usda · paper no. 931557 an asae meeting...
TRANSCRIPT

Paper No. 931557An ASAE Meeting Presentation
MECHANIZATION OF SOIL SALINITYASSESSMENT FOR MAPPING
Lyle M. CarterAgricultural Engineer
USDA, ARSShafter, CA
James D. RhoadesSoil Scientist
USDA, ARSRiverside, CA
Joseph H. ChessonAgricultural Engineer
USDA, ARSShafter, CA
Written for Presentation at the1993 ASAE Winter Meeting
sponsored byASAE
Chicago, IllinoisDecember 12-17, 1993
Summary:
Two salinity assessment machine systems are described: 1) a mobilized fixed-array four-electrodesystem for on-the-go measurement of bulk soil conductivity and 2) a combined soil electricalconductance and electro-magnetic induction automated grid sampling system for rapid sampling ofmultiple field locations at several depths.
Keywords: Electrical conductivity Electromagnetic Instrumentation systems MappingMeasuring systems Salinity Sensors
The authors are solely responsible for the content of this technical presentation. The technical resentation does not necessarilyreflect the official position of ASAE, and its printing and distribution does not constitute an enxorsement of views which may beexpressed.
Technical presentations are not subject to the formal peer review process by ASAE editorial committees; therefore, they are not tobe presented as refereed publications.
Quotation from this work should state that it is from a presentation made by (name or author) at the (listed) ASAE meeting.
EXAMPLE - From Author’s Last Name, Initials. “Title of Presentation.” Presented at the (listed) ASAE meeting.
For information about securing permission to reprint or reproduce a technical presentation, please address inquiries to ASAE.
ASAE, 2950 Niles Rd., St. Joseph, MI 490859659 USAVoice:616.429.0300 F X:616.429.3852A

Mechanization of Soil SalinityAssessment for Mapping
Lyle M. CarterMemberASAE
James D. Rhoades Joseph H. Chesson
ABSTRACT
This paper describes recent developments in equipment for the mechanizationof in-situ soil salinity measurements. Two salinity assessment machinesystems are described: 1) a mobilized fixed-array four-electrode system for on-the-go measurement of bulk soil conductivity and 2) a combined soil electricalconductance and electro-magnetic induction automated grid sampling systemfor rapid sampling of multiple field locations at several depths.
INTRODUCTION
Variability among and within agriculturalsoils is a fact easily observable. Yet manycharacteristics must be measured by labor and cost intensive methods which requireobtaining and transporting a discrete soilsample to a laboratory. For somecharacteristics affecting plant growth thevariability within a defined field may begreater the than average among fields.For some other characteristics the changein the level with time is not only related toproduction practices but has implicationsextending beyond agriculture. A goodexample is soil salinity. It varies indistribution naturally and varies with timedepending upon 1) the salt added inirrigation water or groundwater and 2) thenet movement of water within the soil.Therefore, a change in soil salinity bydepth over time can be used as anindicator for vertical movement of water-
mobile pollutants and a change in total soilsalinity distribution can be used forevaluation of salt-loading withinagricultural landscapes by irrigation andmanagement systems.
Plants have varying tolerance by species,varieties and stage of growth to soilsalinity. A periodically updated 3-dimensional salinity map would aid insubdividing fields by crops, in selection ofa crop with the appropriate salt-tolerancerange and in evaluation of managementsystems.
The direct and labor costs for obtaining aone time map of salinity distribution usingcurrent direct laboratory determinationmethodology within a field on a 10 metergrid, for example, would be prohibitive;and the single map would provide noinformation of shift in salinity and theeffects of changes in management or
weather. This recognition prompted acooperative research program betweenARS groups located at the Riverside andShafter locations to develop rapid, mobile,on-site, salinity mapping equipment andsystems. Progress was enabled by theprior development of: 1) practicalinstrumentation for measuring bulk soilelectrical conductivity (EC3 using four-electrode (Rhoades 199Oa) andelectromagnetic-induction (EM) techniques(Corwin 1990, Lesch 1992), 2) appropriatetheory and practical methods for inferringsoil salinity from EC, for different soiltypes and moisture conditions (Rhoades1989 & 1971), and 3) practicalinstrumentation and methods for locatingspatial coordinates of measurement sitesusing LORAN (Rhoades 1990b) or GPStechnology (Long 1991). Most of theresearch and development involved withitems 1 & 2 and some of item 3 wasperformed at the U.S. Salinity Laboratoryin Riverside California. Theseinstruments, methods, techniques andsystems of salinity measurement andmapping are reviewed by Rhoades(1993a).
With the advent of the instrumentationdescribed above development began in1991 on mobilized and automated fieldequipment for obtaining soil salinity spatialdistribution. This paper describes, briefly,two of these systems: 1) a mobilized fixed-array four-electrode system; 2) anautomated grid sampling system.
DESCRIPTION OF EQUIPMENT
Mobilized Fixed-Array Four-ElectrodeSystem
The goal was to design tractor mountedequipment for continuous measurement of
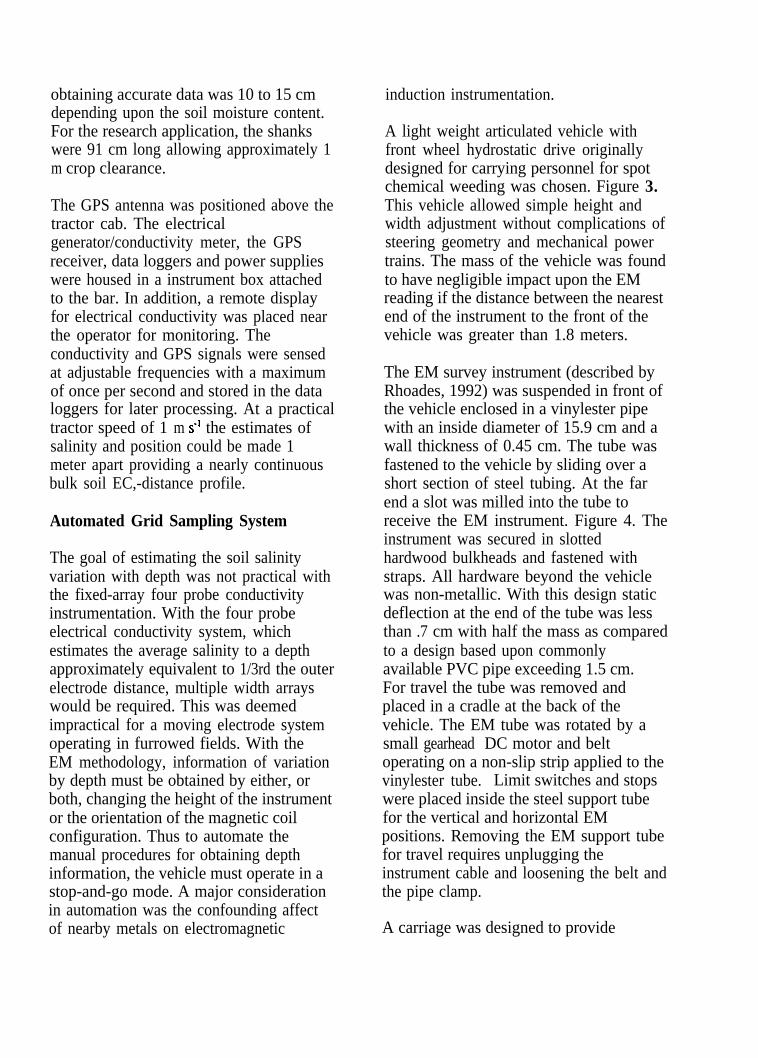
soil conductivity with the electrodes at aconstant soil depth and while moving atnormal speeds (1.0 to 2.5 m s’) in plantedor fallow fields. A non-equidistant four-probe arrangement was required to allowoperation in fields with varying bedspacing from 75 to 100 cm. The outercurrent electrodes then would be spaced 4inter-bed distances apart and the innersignal electrodes would be 2 inter-beddistances apart as shown in Figure 1.
The probes were constructed usingstandard chisels electrically insulated fromthe supporting shank. A small wedgesupport bracket was welded to the trailingedge of the chisel. A replaceable hardenedtool-steel wedge (or runner) was attachedto the bottom of the support to maintainsoil contact. The soil beneath the chiselpoint was compressed by the forwardmotion of the wedge; the amount of soilcompression is dependent upon the depthvariation of the chisel. Figure 2. Theeffective electrode area was the undersideof the wedge since: 1) in a normal fieldcondition the soil moisture increases withdepth near the surface thus the contactresistance is lowest, 2) the wedge scoursthus maintaining a conductive surface and3) the underside of the wedge is the areaof highest sustained soil-contact andpressure. Prior research indicated that achisel type shank performed poorly as anelectrode presumably because the soilcontact area was not constant, the interfaceresistance varied and soil density (andcontact pressure) varied within the soilfailure cycle, and with equipmentvibration. (Carter, 1970).
The shanks were mounted to a foldingrectangular section tool bar. Gage wheelswere attached to the bar to aid inmaintaining constant electrode depth. Inpractice, the depth of operation for
obtaining accurate data was 10 to 15 cmdepending upon the soil moisture content.For the research application, the shankswere 91 cm long allowing approximately 1m crop clearance.
The GPS antenna was positioned above thetractor cab. The electricalgenerator/conductivity meter, the GPSreceiver, data loggers and power supplieswere housed in a instrument box attachedto the bar. In addition, a remote displayfor electrical conductivity was placed nearthe operator for monitoring. Theconductivity and GPS signals were sensedat adjustable frequencies with a maximumof once per second and stored in the dataloggers for later processing. At a practicaltractor speed of 1 m 6’ the estimates ofsalinity and position could be made 1meter apart providing a nearly continuousbulk soil EC,-distance profile.
Automated Grid Sampling System
The goal of estimating the soil salinityvariation with depth was not practical withthe fixed-array four probe conductivityinstrumentation. With the four probeelectrical conductivity system, whichestimates the average salinity to a depthapproximately equivalent to 1/3rd the outerelectrode distance, multiple width arrayswould be required. This was deemedimpractical for a moving electrode systemoperating in furrowed fields. With theEM methodology, information of variationby depth must be obtained by either, orboth, changing the height of the instrumentor the orientation of the magnetic coilconfiguration. Thus to automate themanual procedures for obtaining depthinformation, the vehicle must operate in astop-and-go mode. A major considerationin automation was the confounding affectof nearby metals on electromagnetic
induction instrumentation.
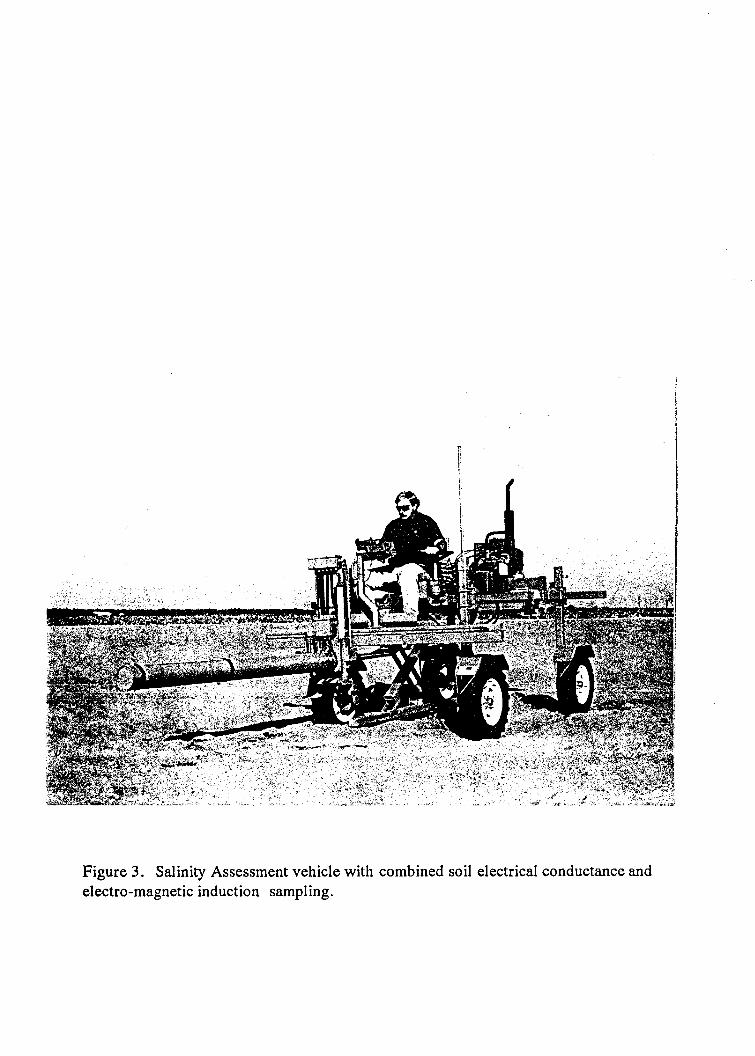
A light weight articulated vehicle withfront wheel hydrostatic drive originallydesigned for carrying personnel for spotchemical weeding was chosen. Figure 3.This vehicle allowed simple height andwidth adjustment without complications ofsteering geometry and mechanical powertrains. The mass of the vehicle was foundto have negligible impact upon the EMreading if the distance between the nearestend of the instrument to the front of thevehicle was greater than 1.8 meters.
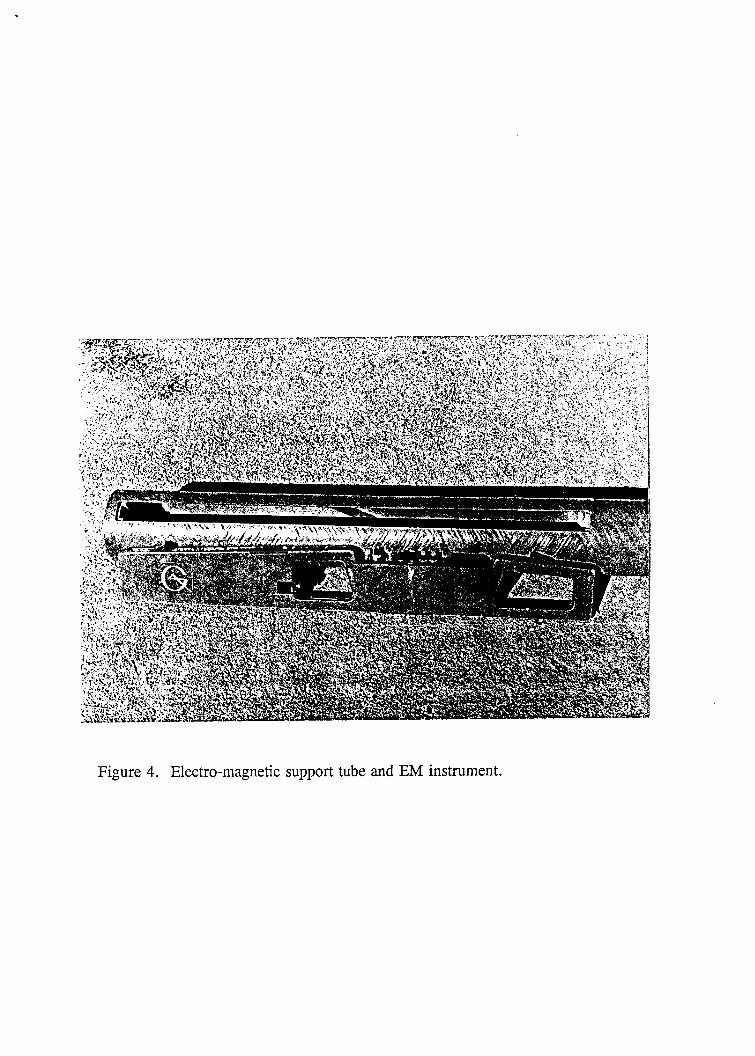
The EM survey instrument (described byRhoades, 1992) was suspended in front ofthe vehicle enclosed in a vinylester pipewith an inside diameter of 15.9 cm and awall thickness of 0.45 cm. The tube wasfastened to the vehicle by sliding over ashort section of steel tubing. At the farend a slot was milled into the tube toreceive the EM instrument. Figure 4. Theinstrument was secured in slottedhardwood bulkheads and fastened withstraps. All hardware beyond the vehiclewas non-metallic. With this design staticdeflection at the end of the tube was lessthan .7 cm with half the mass as comparedto a design based upon commonlyavailable PVC pipe exceeding 1.5 cm.For travel the tube was removed andplaced in a cradle at the back of thevehicle. The EM tube was rotated by asmall gearhead DC motor and beltoperating on a non-slip strip applied to thevinylester tube. Limit switches and stopswere placed inside the steel support tubefor the vertical and horizontal EMpositions. Removing the EM support tubefor travel requires unplugging theinstrument cable and loosening the belt andthe pipe clamp.
A carriage was designed to provide
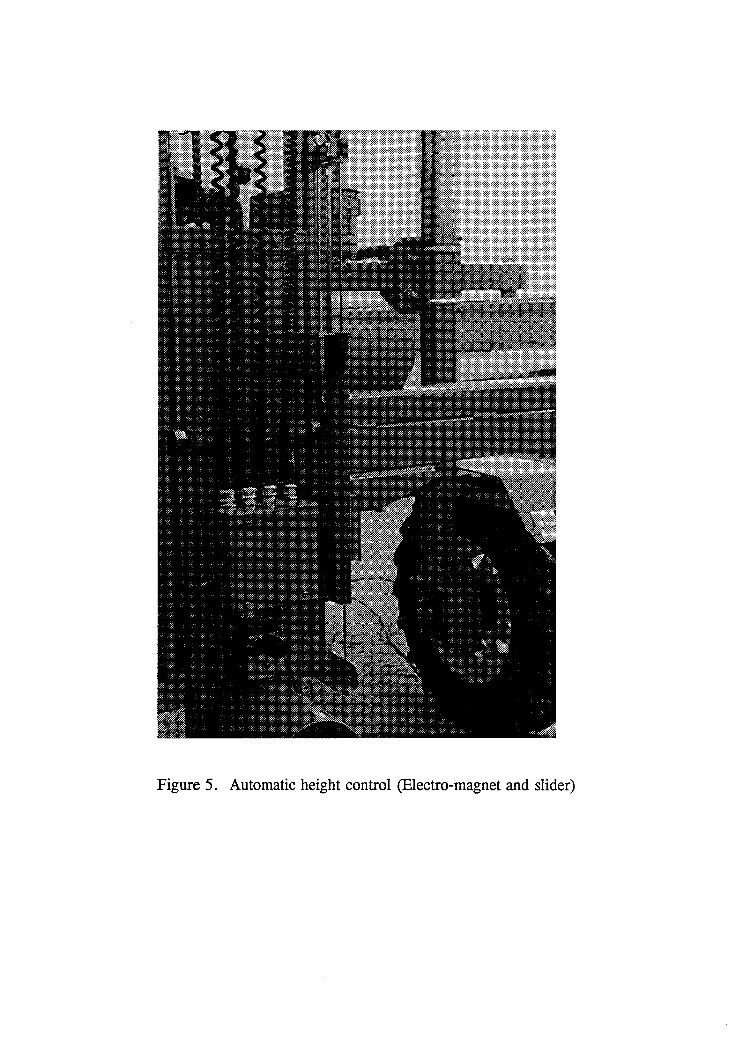
vertical and horizontal translation of theEM support tube. The elevator portion ofthe carriage was fabricated of two railsusing cam followers for linear bearings.Lift was provided by a small hydraulicmotor through a chain with an idler at thetop of the elevator. A limit switch wasplaced under the EM tube to stop thedownward movement when the center lineof the EM instrument was 10 cm aboveground surface. A electromagnet, sliderand limit switch mechanism was designedto allow the EM support tube to raise 40cm. Figure 5. At time of engagement forupward movement, the magnet grasps theslider which has travel limited to 40 cm bythe upper limit switch. For travel withinthe field, the magnet releases the sliderwhich then falls to a stop on the elevator.The elevator then continues upward untilthe slider again activates the switch.During downward travel the slider is alsoreleased and it follows the elevator for 40cm at which time it rests on a stop on theelevator rail while the elevator continuesuntil the foot switch is activated by the soilsurface. Therefore, the two limit switchmechanisms allow 10 and 50 cm positions.above the soil for the EM independent ofthe bed topography. Four salinity depthsamples of 0 to 30, 30 to 60, 60 to 90 and90 to 120 cm can be estimated by thesuccession of EM measurements.
Horizontal translation of the carriage wasaccomplished with sliding door hardware(track and trolleys) mounted on a crossbeam in the front of the vehicle and asingle cam follower in a channel mountednear but in front of the vehicle articulationbearing assembly. Translation wasprovided through a small wire ropeattached at the ends of the cross beam withone wrap around a hydraulically rotateddrum attached to the carriage. One end ofthe wire rope was attached through a
spring, thus the carriage acceleration andshock could be controlled with regulatedslippage on the drum. Adjustable limitswitches were attached to the track toallow selected right and left carriagepositions. Thus EM measurements couldbe obtained at two lateral locations and 4soil depths at any given stop. The lateralpositions allowed measurements in bedand/or furrow, or in two beds or furrowsor two specified locations in unfurrowedfields.
The soil electrical conductivity system wasattached to the carriage under the vehicle.Figure 6. Thus the range of lateral motionwas coincident with the EM system. Both2-meter and l-meter 4-probe arrays wereattached to a common beam. The distancebetween the inner signal electrodes was80% of the outer current electrodes. Theprobes were machined from 1.27 cm(0.5”) stainless steel rod. The diameter ofthe lower 3 inches of the probe wasmachined to 1 cm diameter so the totalforce required for insertion of the 8 probeswould be less than the combined weight ofthe driver and front section of the vehicle.Insulating step washers were used to attachthe probes to the common beam. Thecommon beam was part of a parallel‘scissor-action’ mechanism with amaximum travel of 78 cm allowing 58 cmtravel clearance and a maximum insertionof 20 cm. The actuator was a hydrauliccylinder imbedded within the upper‘scissor-action’ beam. A linear cam witha heavy foot pad was installed in the lowerbeam to sense depth of penetration. Tworoller-plunger snap-action switches sensednotches in the linear cam: a narrow notchwas interpreted as a depth to obtain ameasurement and a wide notch indicatedthe last measurement.
Control System
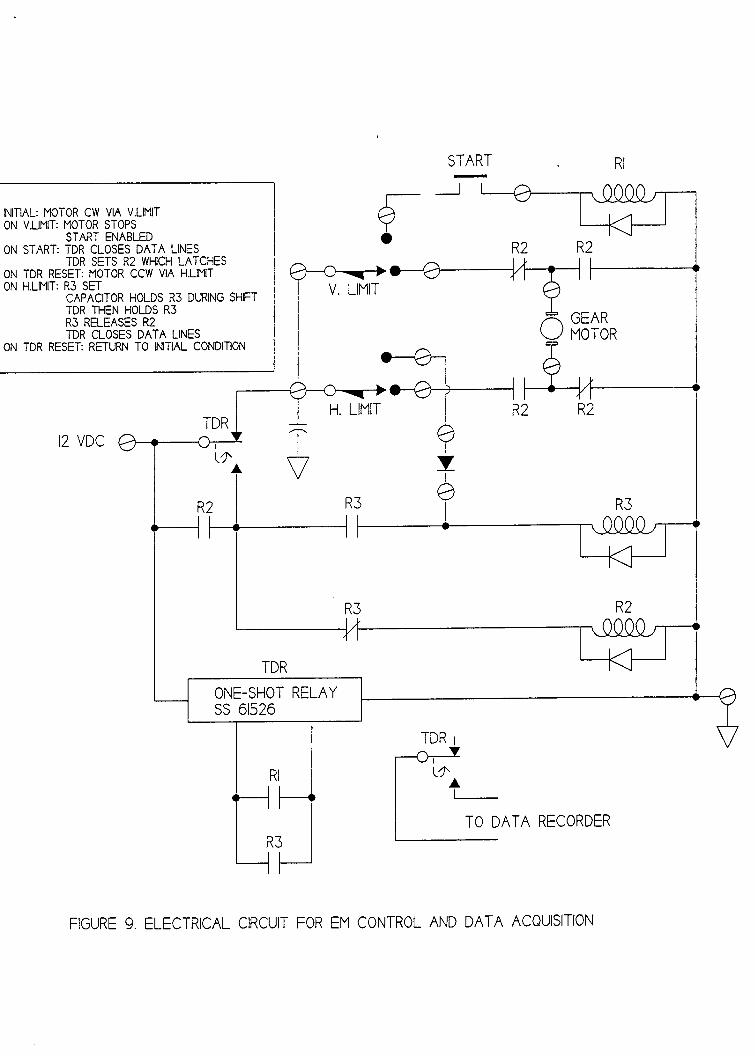
A sequence of 52 operator actions wouldbe required to obtain the full range ofpotential measurements at a single location(more with multiple depth conductivitymeasurements). This was deemedessentially impossible without automationfor the desired rate of 20 or more samplesites per hour. A control system wasdesigned based upon switches and relaylogic with auxiliary electronic timing. Theoperator interface control consisted of asystem enable button and a system defeator panic/safety button, two sampleinitiation buttons for EM and 4-probe anda 6-position selector switch. Figure 7.This switch had one position for each ofthe basic four Y-Z positions for the EMsystem and two for each of the basic Ypositions for the conductivity system. Aone-way interlocked sequence (ladder) wasimposed upon the first four selector switchpositions to prevent damage to the EMinstrument and mast and to maintainsimple data logger management andsynchronization. Figure 8. The datainitiation buttons were grouped with therespective carriage control switch positionsin a way to create a logical flow ofoperator responses. All controls andactuators were disabled each time theengine was started and selectively bydepressing the panic button to preventpersonnel injuries and equipment damage.Depression of a system enable button wasrequired before any automation wasactivated.
After the system is enabled the EM tuberotates to the vertical attitude, the carriagemoves to the right limit and the 4-probemoves to the travel position. The startbutton for the EM data sequence isactivated when the selector is turned toposition ’ 1’ . The EM ‘START’ button
then initiates the following sequence: 1)delay for data acquisition, 2) rotate EMinstrument to horizontal, 3) delay for dataacquisition and 4) rotate back to vertical.This sequence is repeated for each Y-Zposition. Figure 9. The start button forthe 4-probe is enabled in switch positions5 and 6. Depressing the 4-probe ‘START’initiates the following sequence: probemovement down to first soil depth limit, adelay for instrument initiation, a delay fordata acquisition, and probe movementdown to next soil depth. On reaching thelast soil depth, the 4-probe system movesupward to the travel position. Figure 10.A small printed circuit board provides thetime delay functions.
A distance counter, belt driven from theun-powered rear wheel of the vehicle, wasinstalled to: 1) define a sample locationwith accuracy greater than the GPS and 2)permit the conductivity measurement to bemade in the same location as the EM. Thedisplay was incorporated into the operatorscontrol panel. Figure 7.
PERFORMANCE
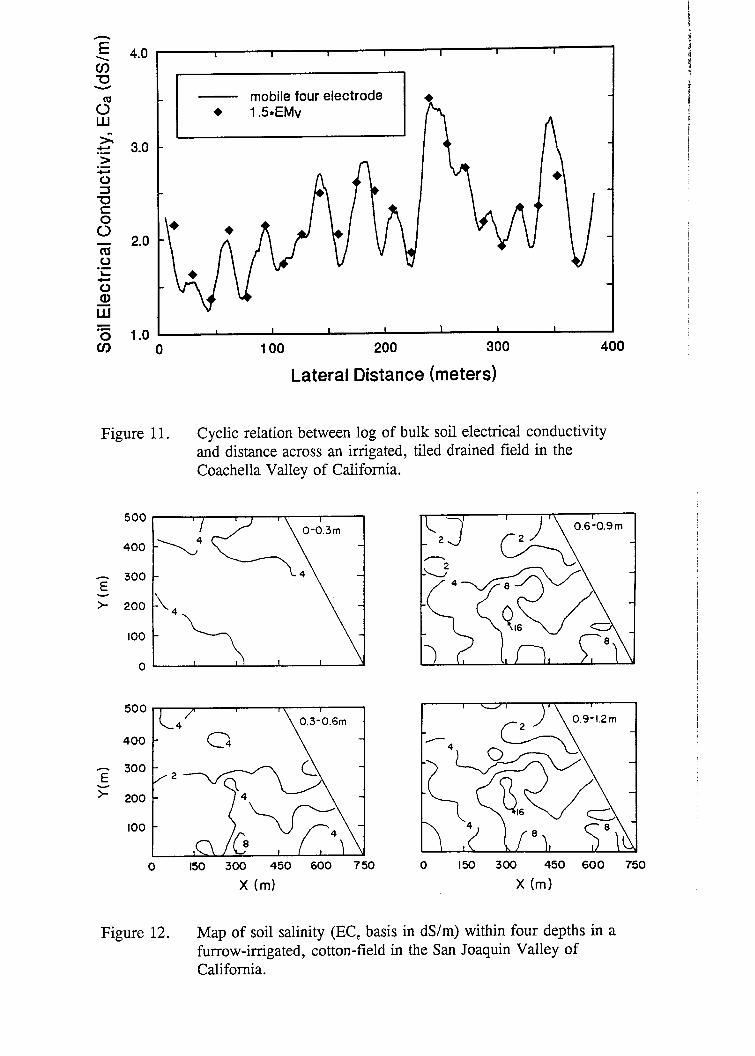
Graphical presentation of the data obtainedwith the mobilized fixed-array four-electrode soil conductance system providesdirect visual information of the averagebulk EC, distribution within a field.Example output data obtained with thissystem are shown in Figure 11 in terms ofEC, versus distance along one pass madethrough a tile-drained field in theCoachella Valley of California. The cyclicresponse suggested twice a many tiledrains as was recorded in the farmer’srecords. Excavation verified that theinstrument system’s response of thesalinity pattern correlated closely with the
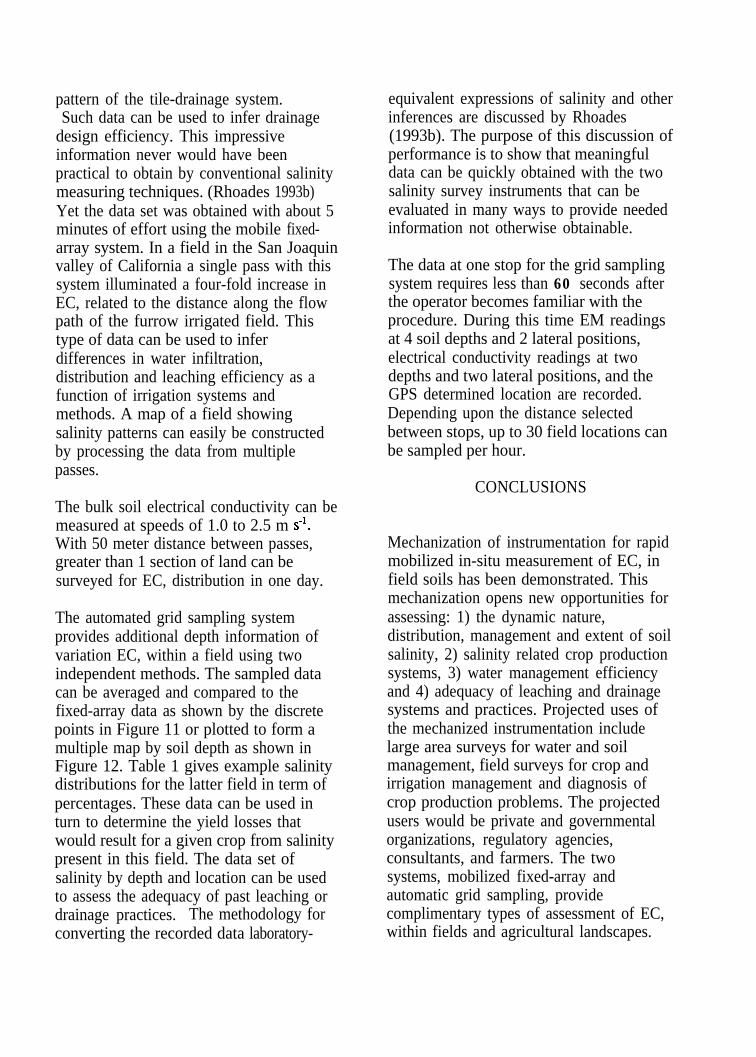
pattern of the tile-drainage system.Such data can be used to infer drainage
design efficiency. This impressiveinformation never would have beenpractical to obtain by conventional salinitymeasuring techniques. (Rhoades 1993b)Yet the data set was obtained with about 5minutes of effort using the mobile fixed-array system. In a field in the San Joaquinvalley of California a single pass with thissystem illuminated a four-fold increase inEC, related to the distance along the flowpath of the furrow irrigated field. Thistype of data can be used to inferdifferences in water infiltration,distribution and leaching efficiency as afunction of irrigation systems andmethods. A map of a field showingsalinity patterns can easily be constructedby processing the data from multiplepasses.
The bulk soil electrical conductivity can bemeasured at speeds of 1.0 to 2.5 m s’.With 50 meter distance between passes,greater than 1 section of land can besurveyed for EC, distribution in one day.
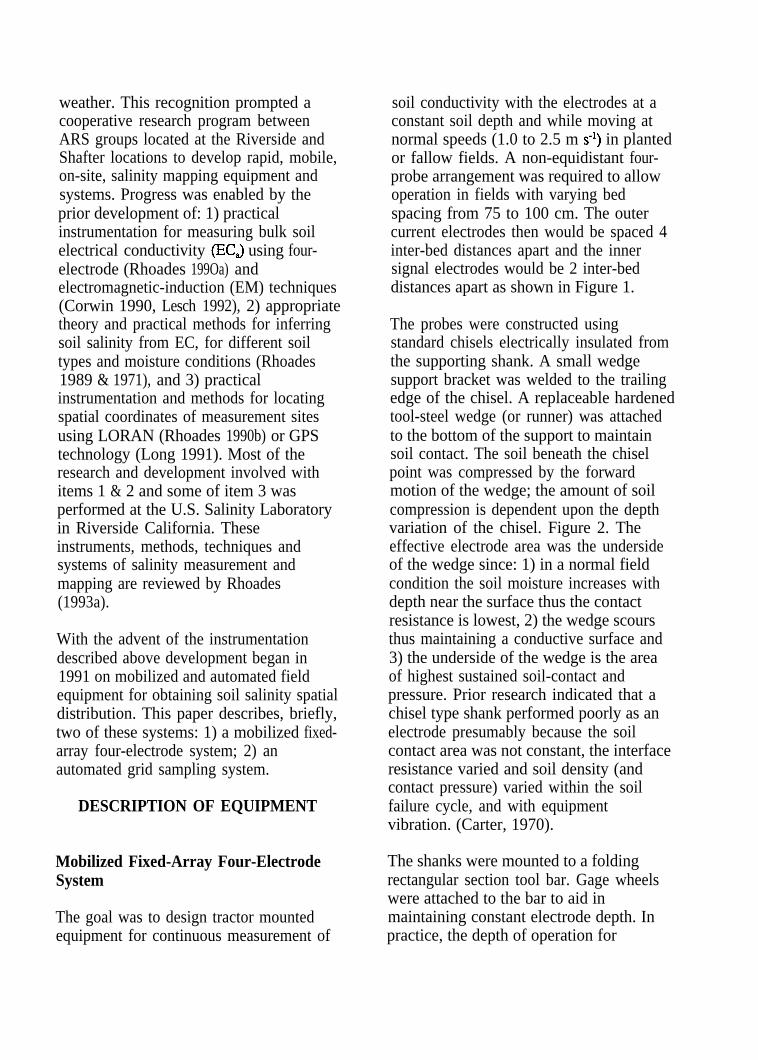
The automated grid sampling systemprovides additional depth information ofvariation EC, within a field using twoindependent methods. The sampled datacan be averaged and compared to thefixed-array data as shown by the discretepoints in Figure 11 or plotted to form amultiple map by soil depth as shown inFigure 12. Table 1 gives example salinitydistributions for the latter field in term ofpercentages. These data can be used inturn to determine the yield losses thatwould result for a given crop from salinitypresent in this field. The data set ofsalinity by depth and location can be usedto assess the adequacy of past leaching ordrainage practices. The methodology forconverting the recorded data laboratory-
equivalent expressions of salinity and otherinferences are discussed by Rhoades(1993b). The purpose of this discussion ofperformance is to show that meaningfuldata can be quickly obtained with the twosalinity survey instruments that can beevaluated in many ways to provide neededinformation not otherwise obtainable.
The data at one stop for the grid samplingsystem requires less than 60 seconds afterthe operator becomes familiar with theprocedure. During this time EM readingsat 4 soil depths and 2 lateral positions,electrical conductivity readings at twodepths and two lateral positions, and theGPS determined location are recorded.Depending upon the distance selectedbetween stops, up to 30 field locations canbe sampled per hour.
CONCLUSIONS
Mechanization of instrumentation for rapidmobilized in-situ measurement of EC, infield soils has been demonstrated. Thismechanization opens new opportunities forassessing: 1) the dynamic nature,distribution, management and extent of soilsalinity, 2) salinity related crop productionsystems, 3) water management efficiencyand 4) adequacy of leaching and drainagesystems and practices. Projected uses ofthe mechanized instrumentation includelarge area surveys for water and soilmanagement, field surveys for crop andirrigation management and diagnosis ofcrop production problems. The projectedusers would be private and governmentalorganizations, regulatory agencies,consultants, and farmers. The twosystems, mobilized fixed-array andautomatic grid sampling, providecomplimentary types of assessment of EC,within fields and agricultural landscapes.

The mobilized fixed-array systems offerfor the first time high speed area survey ofbulk soil salinity. Dependent upon thedetail required, one section of land, ormore, could be surveyed in a singleworking day. The resultant line graphsand maps allow rapid and visual appraisalof salinity distribution and determinationof areas within the survey deserving moredetailed study. The operational advantagesof mobilized fixed-array system areequipment simplicity and speed of
operation.
The automated grid sampling system offersfor the first time a rapid method ofassessing 3-dimensional location andmovement of salt and water within the soilprofile. Locations within a field can bemeasured at a rate of 30 per hour. Withthe addition of a portable or field vancomputer the information can be evaluatedthe same day as sampling.
Table 1. Area-Percentages of 9 furrow-irrigated fieldswithin various ranges of soil salinity (EC, basis)Rhoades (1993)
Range Soil Salinityin dS/m
Soil Depth, m O-2 2-4 4-8 8-16 > 16
o-o.3 14 41 36 9 0
0.3-0.6 44 32 17 6 1
0.6-0.9 17 34 22 16 10
0.9-1.2 15 31 25 17 11
o-1.2 3 49 29 16 2

1.
2.
3.
4.
5.
6.
7.
8.
9.
10.
11.
References
Carter, L.M. 1970. Automatic controls for cotton planter for the irrigated west. ARS42-173.
Corwin, D.L., J.D. Rhoades. 1990. Establishing electrical conductivity-depthrelations from electromagnetic induction measurements. Commun. Soil Sci. PlantAnal. 21:861-901.
Lesch, S.M., J.D. Rhoades, L.J. Lund, D.L. Corwin. 1992. Mapping soil salinityusing calibrated electromagnetic measurements. Soil Sci. Soc. Am. J. 56:540-548.
Long, D.S., S.D. DeGloria, J.M. Galbraith. 1991. Use of global positioning systemin soil survey. J. Soil Sci. Plan Anal. 46:293-297.
Rhoades, J.D. and R. D. Ingvalson. 1971, Determining salinity in field soils withsoil resistance measurements. Soil Sci. Soc. Amer. Proc. 35:54-60.
Rhoades, J.D., N.A. Manteghi, P.J. Shouse, and W.J. Alves. 1989. Soil electricalconductivity and soil salinity: New formulations and calibrations. Soil Sci. Soc.Amer. 53:433-439.
Rhoades, J.D. Shouse, W.J. Alves, N.A. Manteghi, and S.M. Lesch. 1990a.Determining Soil Salinity from soil electrical conductivity using different models andestimates. Soil Sci. Soc. Am. J. 54:46-54.
Rhoades, J.D. S.M. Lesch, P.J. Shouse, W.J. Alves. 1990b. Locating sampling sitesfor salinity mapping. soil Sci. Soc. Am. J. 54:1799-1802/
Rhoades, J.D. 1993a. Electrical conductivity methods for measuring and mappingsoil salinity. Advances in Agronomy, Vol. 49 pp201-251.
Rhoades, J.D., L.M. Carter. 1993b. New soil salinity mapping techniques.Proc Eight Inter. Soil Management Workshop: Utilization of soil SurveyInformation for Sustainable Land Use. pp201-209.
Griffiths, D.H., R.F. Ring. 1965. Applied Geophysics for Engineers and Geologists.Pergamon Press.