media and mobile trends 2015: where and how are consumers tuning in?
TRANSCRIPT
Copyright © 2015 Deloitte Development LLC. All rights reserved.
Digital Democracy Survey
A multi-generational view of consumer
technology, media and telecom trends
Ninth Edition
www.deloitte.com/us/tmttrends

Copyright © 2015 Deloitte Development LLC. All rights reserved.
Agenda
1. About the survey
2. Product and device landscape
3. Mainstreaming of digital
4. Binge watching
5. Multitasking
6. Pay TV
7. The current state of advertising
8. Personalization of gaming
9. Social media

About the survey

Copyright © 2015 Deloitte Development LLC. All rights reserved.
• This is the ninth edition of research commissioned by Deloitte’s Technology,
Media and Telecommunications (TMT) practice.
• Focusing on four generations and five distinct age groups, the survey provides
insight into how consumers ages 14 and above are interacting with media,
products and services, mobile technologies, the Internet, and attitudes and
behaviors toward advertising and social networks—and what their preferences
might be in the future.
• Fielded by an independent research firm from 11/3/2014 to 11/19/2014, the
survey employed an online methodology among 2,076 US consumers.
• All data is weighted back to the most recent census data to give a representative
view of what US consumers are doing.
• For meaningful changes, we look for differences in year-over-year tracking and
generations of at least five percentage points.
About Deloitte’s digital democracy survey

Copyright © 2015 Deloitte Development LLC. All rights reserved.
The survey focuses on four generations,
and five distinct age groups:
Talking about the generations
*2010 US Census Bureau—Population Division
US Interim Projections 2000-2050
Born 1988–1983 Born 1982–1966 Born 1965–1947 Born 1946 and priorBorn 2000–1989
(Millennials Age 10-13 not included in this study)
70M 77M 24M79M2014 US
population*

Product and device
landscape
Copyright © 2015 Deloitte Development LLC. All rights reserved.
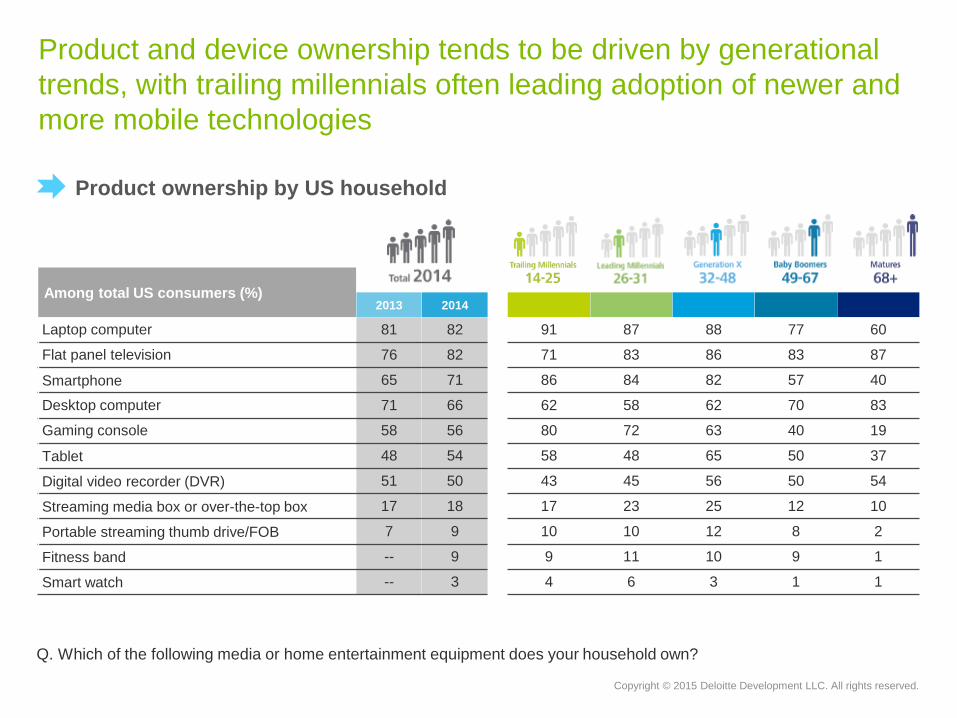
Product and device ownership tends to be driven by generational
trends, with trailing millennials often leading adoption of newer and
more mobile technologies
Q. Which of the following media or home entertainment equipment does your household own?
Among total US consumers (%)2013 2014
Laptop computer 81 82 91 87 88 77 60
Flat panel television 76 82 71 83 86 83 87
Smartphone 65 71 86 84 82 57 40
Desktop computer 71 66 62 58 62 70 83
Gaming console 58 56 80 72 63 40 19
Tablet 48 54 58 48 65 50 37
Digital video recorder (DVR) 51 50 43 45 56 50 54
Streaming media box or over-the-top box 17 18 17 23 25 12 10
Portable streaming thumb drive/FOB 7 9 10 10 12 8 2
Fitness band -- 9 9 11 10 9 1
Smart watch -- 3 4 6 3 1 1
Product ownership by US household

Copyright © 2015 Deloitte Development LLC. All rights reserved.
Device value is mostly stable year-over-year; owners place
relatively high value on new products, such as smart watches
Top 3 ranking among owners (%) 2013 2014
Smartphone 72 76 76 78 79 75 65
Laptop computer 67 71 75 68 68 74 59
Flat panel television 62 62 40 53 62 70 80
Desktop computer 55 55 35 46 48 64 86
Basic mobile phone 39 36 13 22 20 50 52
Tablet 36 31 30 35 32 33 22
Gaming console 31 27 45 30 20 13 7
Digital video recorder (DVR) 20 22 11 15 25 24 29
Smart watch -- 18 ^ ^ ^ ^ ^
Streaming media box or OTT box 18 15 13 24 18 10 2
Fitness band -- 14 ^ ^ ^ ^ ^
Portable video game player 9 10 16 20 1 6 0
Portable streaming thumb drive/FOB 5 6 ^ ^ ^ ^ ^
^ Base too small to show
Top three most valued products among owners
Q. Of the products you indicated you own, which 3 do you value the most?

Copyright © 2015 Deloitte Development LLC. All rights reserved.
Among subscribers top three ranking (%)2014
Home Internet 93 93 93 94 95
Pay TV (cable and/or satellite) 58 75 80 89 92
Mobile data plan 69 65 67 39 22
Streaming video service 72 63 47 43 6
Mobile voice 37 47 52 48 35
Landline telephone 17 23 29 51 65
Gaming 62 41 26 15 -
Streaming music service 42 39 27 16 6
News/Newspaper (print or digital) 13 28 16 32 51
Magazine (print or digital) 14 15 12 16 17
94
80
58
54
46
40
40
30
29
15
Home Internet is overwhelmingly the most valued service across all
generations, with nearly all consumers ranking it in their top three.
Top three most valued services among subscribers
Q. Of the services you indicated your household purchases, which three do you value the most?

Copyright © 2015 Deloitte Development LLC. All rights reserved.
4% 5%23%
68%
Trailing millennials spend more time watching TV shows on non-
traditional devices than on televisions
Q. Of the time you spend watching TV shows (e.g., 30- or 60-minute television programs), what percentage of time do you
watch on the following devices?
8
7
4
1
0
8
8
7
2
1
41
27
19
16
9
43
56
69
80
89
Percentage of time spent watching TV shows by device among US consumers
Smartphone Tablets Desktop/Laptop TV
Copyright © 2015 Deloitte Development LLC. All rights reserved.
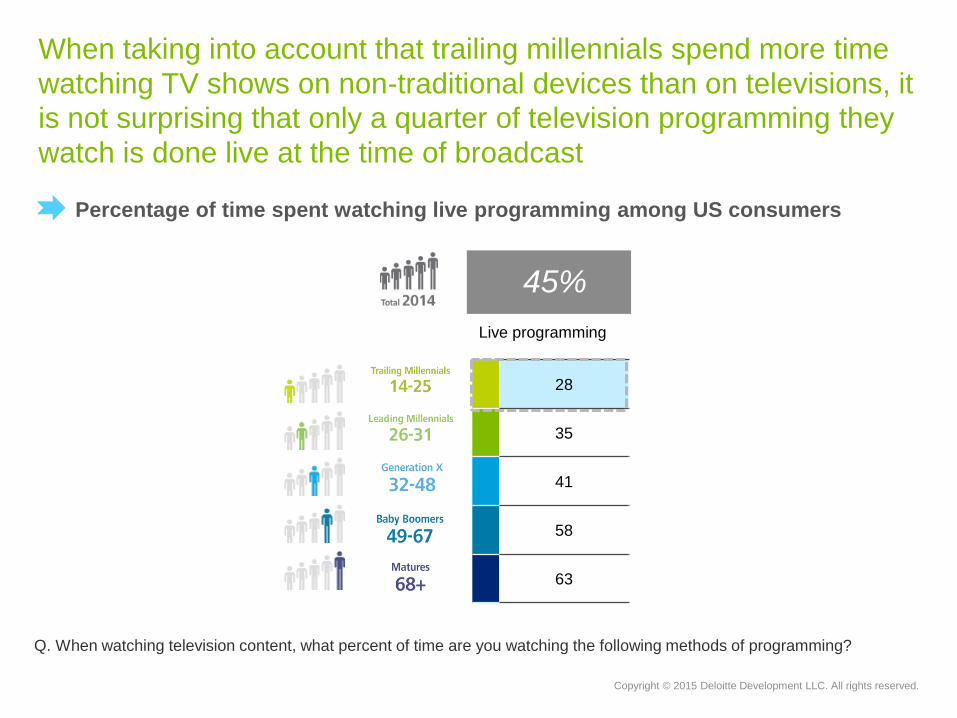
When taking into account that trailing millennials spend more time
watching TV shows on non-traditional devices than on televisions, it
is not surprising that only a quarter of television programming they
watch is done live at the time of broadcast
Live programming
28
35
41
58
63
45%
Percentage of time spent watching live programming among US consumers
Q. When watching television content, what percent of time are you watching the following methods of programming?

Mainstreaming of digital

Copyright © 2015 Deloitte Development LLC. All rights reserved.
More than half of all consumers and three-quarters of millennials
stream movies on a monthly basis
Frequency of streaming, renting and purchasing movies
At least monthly
56 77 71 65 40 23
35 40 47 40 29 17
29 36 40 30 25 14
26 28 34 31 22 12
23 31 36 28 13 6
21 31 32 25 14 4
Among total US consumers (%) Weekly
Online Streaming Service 34
Rent DVD/Blu-ray 10
Purchase DVD/Blu-ray 6
Purchase/Rent via on demand/pay-per view 6
Purchase digital download 5
Rent digital download 5
48%of US consumers
34%of US consumers and
57%of trailing millennials
stream movies on
a weekly basis
rent or buy physical
discs monthly
Q. Thinking about how you watch movies, how frequently do you do each of the following?

Copyright © 2015 Deloitte Development LLC. All rights reserved.
Among consumers with a streaming subscription service
summary of agree strongly (%) 2013 2014
It allows me to watch content when I want to 64
I value that it allows me to watch content without commercials --
It allows me to watch content wherever I want 55
It allows me to watch content on multiple devices 53
The quality (visual and/or audio) is on par with the quality (visual and/or audio)
of the content delivered through my pay TV service (cable and/or satellite)45
I value its extensive library of TV shows 43
I value the ease at which I can discover new content 43
I value its extensive library of movies 42
I value the availability of recent TV show releases 36
I value the availability of recent movie releases 35
74
71
66
56
49
40
40
36
33
32
Xers value mobility of content
The reasons behind why people stream are clear. Consumers
appreciate their streaming services for the ease with which they can
watch commercial-free content anytime, anywhere, and on any device
55%
63%
74%
67%
44%
43% of US
consumers subscribe to a
streaming video service
Consumer perceptions of their streaming services
Q. Please indicate how much you agree or disagree with the following statements about your
streaming video service

Binge watching

Copyright © 2015 Deloitte Development LLC. All rights reserved.
Two-thirds of viewers “binge-watch” TV, watching three or more
episodes of TV in one sitting; millennials overwhelmingly engage in
binge-watching behaviors
Q. How frequently do you “binge-watch” television shows?
Q. Do you ever “binge-watch” television shows, meaning watching three or more episodes of a TV series in one sitting?
Among US consumers (%)
Have
streaming
subscrip-
tion
Do not
have
streaming
subscrip-
tion
Ever Binge 68 84 83 74 56 37 83 57
Among binge watchers (%)
At least once a week 31 42 30 25 29 26
At least once a month 34 35 40 38 28 24
At least every six months 27 19 23 27 35 29
At least once a year 8 4 8 11 8 21
Percentage of US consumers who binge watch TV shows
Frequency of binge watching

Copyright © 2015 Deloitte Development LLC. All rights reserved.
TV drama is the most popular television genre to binge-watch, as a
continuous narrative lends itself well to multi-episode viewing
Among US consumers (%) Male Female
TV drama 54 49 54 58 57 53 51 58
TV comedy 20 25 23 19 16 11 24 16
Reality TV show 7 8 7 8 6 4 5 9
Contest show 3 2 2 2 4 2 3 2
Daytime shows 2 2 3 2 3 5 2 3
Variety/talk shows 1 1 1 1 0 1 1 1
Do it yourself (DIY)/cooking shows 4 2 3 6 6 3 4 4
None of the above 9 11 8 5 8 21 10 7
Most binged genre
Q. When you “binge-watch,” what kind of show are you most often watching?

Multitasking

Copyright © 2015 Deloitte Development LLC. All rights reserved.
Ninety percent of consumers are multitasking while watching TV
Percentage of US consumers who multitask while watching TV
Q. Which are things you typically do while watching your home TV?
Average number of
additional activities
while watching TV
Among U.S. Consumers Summary of
Always/Almost Always (%) 2012 2013
Browse and surf the web 27 35 42 45 35 25 9
Read email 26 30 28 32 32 28 16
Text message 23 26 53 41 30 14 3
Use a social network 23 26 47 38 27 13 3
Browse for products and services online 17 21 28 30 22 12 7
Talk on the phone 17 18 22 19 22 17 8
Write email 19 22 16 22 21 13 10
Purchase products and services online 11 16 22 22 18 11 4
Play video games 16 18 24 23 15 13 8
Read for pleasure 14 14 16 17 15 9 6
Microblogging 9 14 29 20 11 4 0
Read for work and/or school 12 13 20 15 13 6 0
Nothing else - just watch TV 19 14 6 4 9 12 19
32
28
28
26
20
19
17
16
16
13
13
11
10
3 3 3 2 1
Q. Which are things you typically do while watching your home TV?

Copyright © 2015 Deloitte Development LLC. All rights reserved.
Despite the high percentage of consumers who are multitasking
while watching TV, fewer than one-quarter of multitasking activities
are directly related to the programs that consumers are watching
25% 28% 24% 18% 17%2014
Total related
multitasking 22%
Percentage of multitasking directly related to the program
Q. What percentage of your multitasking activities are directly related to the program you are watching?

Copyright © 2015 Deloitte Development LLC. All rights reserved.
When compared to traditional TV advertising, consumers tend to
pay more attention to digital (online) ads. Four out of five millennials
are more distracted during TV ads than digital
Among total US consumers (%)
summary of agree strongly/somewhat 2014
I tend to multitask on another
device or activity more while
watching television ads than digital
(online) ads
81 77 78 65 5373
Intensity of attention related to digital ads
Q. Thinking about advertisements that come on during television or digital (online) programming you watch, please rate the
following statements using the scale below.

Pay TV

68
125 3
12
67
146 3
10
62
157 3
13
No plans to change
provider or cut cord
Fewer Pay TV subscribers have no plans to change providers or cut
the cord this year than in previous years. A quarter of Trailing
Millennials either cancelled their pay TV subscriptions in the last 12
months or haven’t had Pay TV more for more than a year.
Q. Which of the following statements best describes you and/or your household with regard
to pay television service?
Considering changing
Pay TV provider
Considering cutting
Pay TV subscription
in the next year
Cancelled Pay TV in
the last year (cord
cutter)
Haven’t had Pay TV for
more than a year (cord
cutter/cord never)
2012 2013 2014
Pay TV subscription roadmap
54 14 7 7 18
25%Ages 14-18: 21%
Ages 19-25: 28%

Copyright © 2015 Deloitte Development LLC. All rights reserved.
Millennials and Xers are significantly more open to change, with
only about half saying they have no plans to change
68 65 54
61 63 55
67 62 54
70 70 69
78 80 74
Among total US consumers (%)2012 2013 2014
I have paid television service and have
no plans to cancel or change my paid
television service within the next 12
months
68 67 62
Interest in changing or cancelling pay TV service
Q. Which of the following statements best describes you and/or your household with regard to pay television service?
Copyright © 2015 Deloitte Development LLC. All rights reserved.
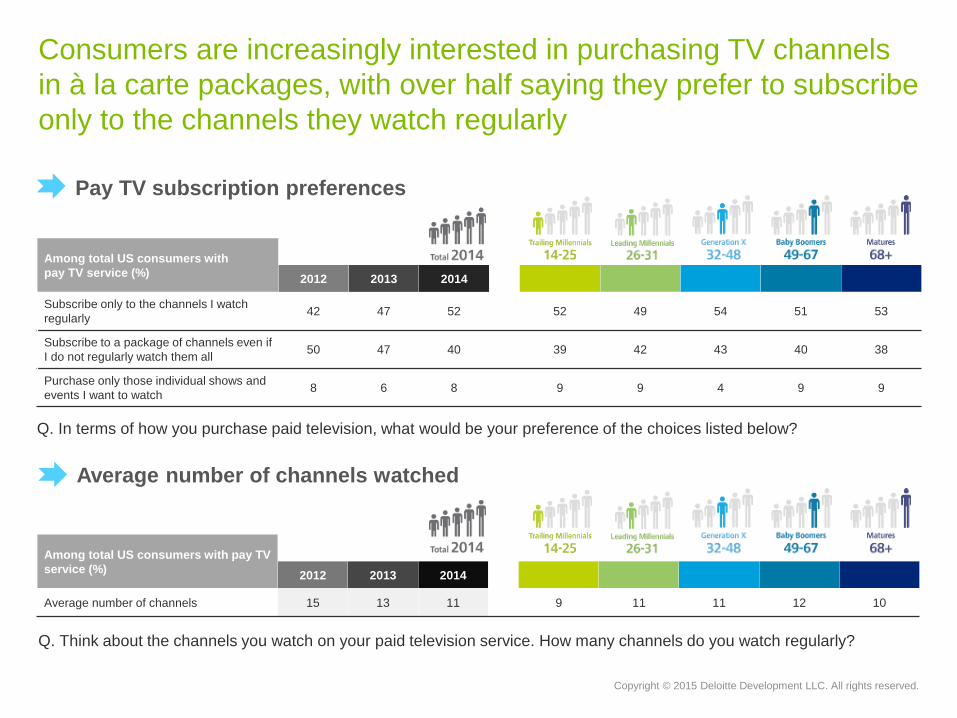
Consumers are increasingly interested in purchasing TV channels
in à la carte packages, with over half saying they prefer to subscribe
only to the channels they watch regularly
Among total US consumers with
pay TV service (%)2012 2013 2014
Subscribe only to the channels I watch
regularly42 47 52 52 49 54 51 53
Subscribe to a package of channels even if
I do not regularly watch them all50 47 40 39 42 43 40 38
Purchase only those individual shows and
events I want to watch8 6 8 9 9 4 9 9
Among total US consumers with pay TV
service (%)2012 2013 2014
Average number of channels 15 13 11 9 11 11 12 10
Pay TV subscription preferences
Q. In terms of how you purchase paid television, what would be your preference of the choices listed below?
Average number of channels watched
Q. Think about the channels you watch on your paid television service. How many channels do you watch regularly?

The current state of
advertising
Copyright © 2015 Deloitte Development LLC. All rights reserved.
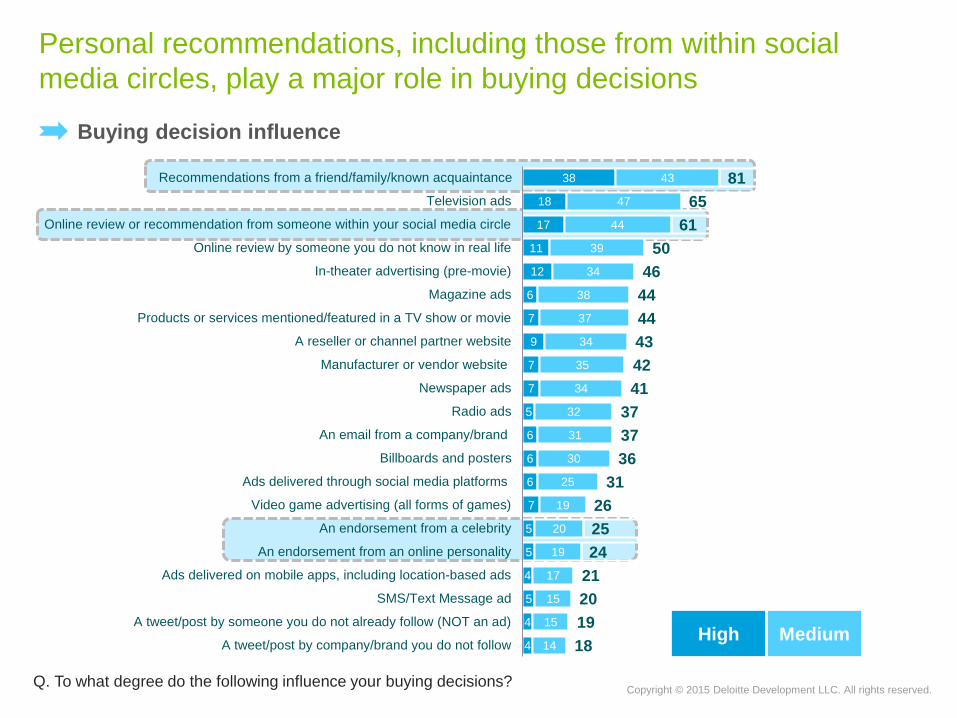
Personal recommendations, including those from within social
media circles, play a major role in buying decisions
Q. To what degree do the following influence your buying decisions?
38
18
17
11
12
6
7
9
7
7
5
6
6
6
7
5
5
4
5
4
4
43
47
44
39
34
38
37
34
35
34
32
31
30
25
19
20
19
17
15
15
14
81
65
61
50
46
44
44
43
42
41
37
37
36
31
26
25
24
21
20
19
18
Recommendations from a friend/family/known acquaintance
Television ads
Online review or recommendation from someone within your social media circle
Online review by someone you do not know in real life
In-theater advertising (pre-movie)
Magazine ads
Products or services mentioned/featured in a TV show or movie
A reseller or channel partner website
Manufacturer or vendor website
Newspaper ads
Radio ads
An email from a company/brand
Billboards and posters
Ads delivered through social media platforms
Video game advertising (all forms of games)
An endorsement from a celebrity
An endorsement from an online personality
Ads delivered on mobile apps, including location-based ads
SMS/Text Message ad
A tweet/post by someone you do not already follow (NOT an ad)
A tweet/post by company/brand you do not followHigh MediumHigh Medium
Buying decision influence

Copyright © 2015 Deloitte Development LLC. All rights reserved.
Consumers show a willingness to endure advertising in exchange
for discounted content
Among US consumers summary of
agree strongly/somewhat (%)
2014 Bingers Non-Bingers
I would be willing to view
advertising with my streaming
video programming if it
significantly reduced the cost of
the subscription
62 69 66 66 57 43 69 57
Advertising in streaming services
Q. Please indicate how much you agree or disagree with the following statements.

Personalization of
gaming

Almost 40% of US consumers and 54% of trailing millennials play
video games on a daily or weekly basis
38%
23%16%
23%
Frequently
(Everyday/Weekly)
Occasionally
(Monthly)
Rarely
(1 to 3 times/year)
Never
54%
45%
37%
27%
32%
27%
25%
25%
20%
15%
10%
14%
19%
20%
10%
8%
16%
19%
34%
43%
2013:
41%2013:
26%
2013:
12%
2013:
22%Total US consumers
Gaming frequency
Q. How often do you play videogames (regardless of type, include mobile, console, phone-based, laptop and/or desktop, and
tablet-based games)?
Copyright © 2015 Deloitte Development LLC. All rights reserved.
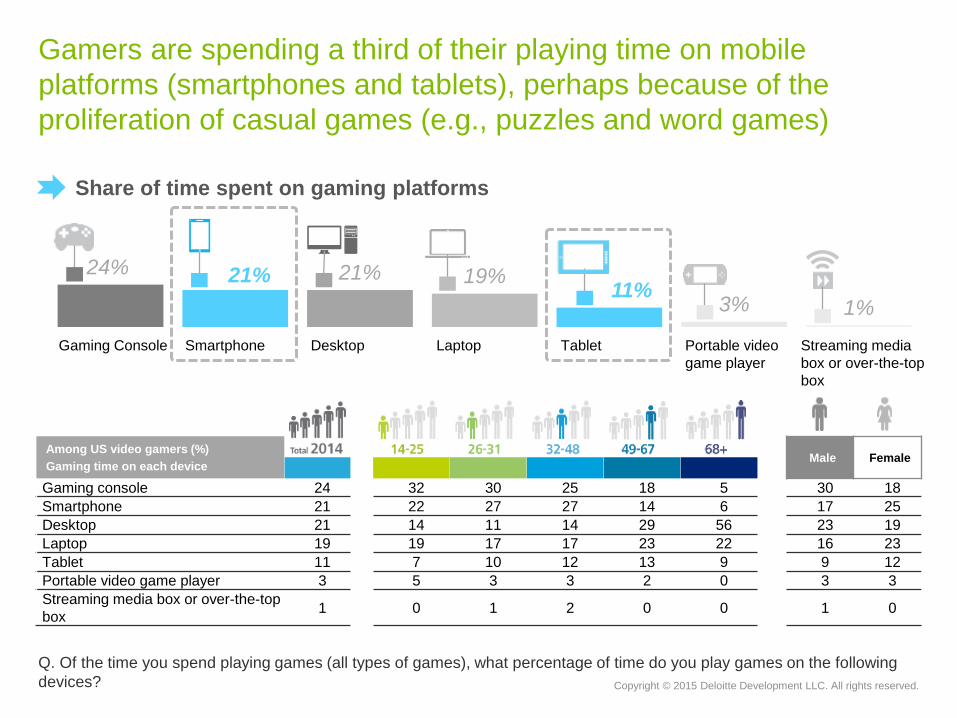
Gamers are spending a third of their playing time on mobile
platforms (smartphones and tablets), perhaps because of the
proliferation of casual games (e.g., puzzles and word games)
24% 21% 21% 19%11%
3% 1%
Gaming Console Smartphone Desktop Laptop Tablet Portable video
game player
Streaming media
box or over-the-top
box
Among US video gamers (%)
Gaming time on each deviceMale Female
Gaming console 24 32 30 25 18 5 30 18
Smartphone 21 22 27 27 14 6 17 25
Desktop 21 14 11 14 29 56 23 19
Laptop 19 19 17 17 23 22 16 23
Tablet 11 7 10 12 13 9 9 12
Portable video game player 3 5 3 3 2 0 3 3
Streaming media box or over-the-top
box1 0 1 2 0 0 1 0
Q. Of the time you spend playing games (all types of games), what percentage of time do you play games on the following
devices?
Share of time spent on gaming platforms

Copyright © 2015 Deloitte Development LLC. All rights reserved.
Gaming consoles are increasingly being used for content
consumption, especially watching/streaming movies
Among those with consoles (%)
activities performed on gaming
console
Male Female2013 2014
Play video games 88 86 89 84 86 86 ^ 92 79
Watch movies (Blu-ray/DVD) 42 48 46 60 50 45 ^ 49 47
Stream TV/Movie content 32 38 42 51 39 26 ^ 39 37
Watch online content 26 29 43 22 24 22 ^ 30 28
Browse the Internet 16 16 15 12 12 23 ^ 16 16
Fitness training/education 16 15 11 11 20 17 ^ 10 22
Stream music 12 15 16 18 17 10 ^ 14 17
View home videos/photos 7 7 4 4 6 10 ^ 6 7
86%
48% 38% 29% 16% 15% 15% 7%
Play video
games
Watch movies
(physical disc)
Stream TV/
movie content
Watch online
content
Browse the
Internet
Education Stream music View home
videos/photos
Q. What top three activities are you doing on your gaming console?
Console usage

Social media
Copyright © 2015 Deloitte Development LLC. All rights reserved.
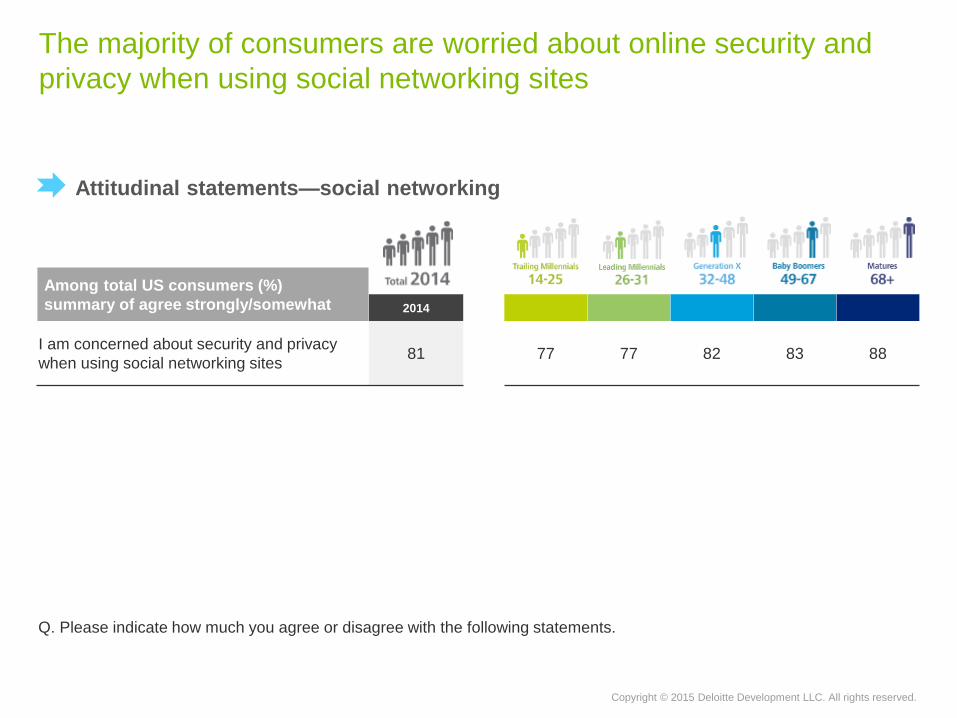
The majority of consumers are worried about online security and
privacy when using social networking sites
Among total US consumers (%)
summary of agree strongly/somewhat 2014
I am concerned about security and privacy
when using social networking sites81 77 77 82 83 88
Q. Please indicate how much you agree or disagree with the following statements.
Attitudinal statements—social networking

Copyright © 2015 Deloitte Development LLC. All rights reserved.
Consumers notice when companies/brands engage in social media
Among total US consumers (%)
summary of agree strongly/somewhat 2013 2014
It enables me to learn more about a
company/brand/product/service than the information I
can get on a company's website58 72 69 59 46 31
It has improved my perception of the company/brand 52 68 60 52 37 23
I am able to more effectively raise/resolve customer
service issues than via the company's website or
calling the company50 62 65 49 41 23
I feel more connected to the company/brand if their
leadership engages on social networks49 68 58 49 32 18
56
49
48
46
Q. How much do you agree or disagree with each of the following statements related to companies’ use of social networking
sites?
Consumer views of company/brand engagement on social networks

Copyright © 2015 Deloitte Development LLC. All rights reserved.
While television is still the top mechanism for getting news, its
importance has been decreasing over the last several years; social
media sites are becoming a primary source of news for trailing
millennials
Among total US consumers (%)2012 2013 2014
Television 57 49 48 28 40 45 61 70
Online news sites not associated
with a newspaper17 19 12 15 10 13 11 4
Social media sites 4 9 11 26 15 10 3 1
Online version of newspapers 9 10 10 7 16 13 8 4
Print newspapers 6 6 7 3 4 5 10 15
Radio 3 4 5 5 3 7 5 2
Variety/talk shows -- -- 2 4 5 1 0 0
News aggregators -- -- 2 3 3 3 1 0
I do not follow the news 3 4 4 8 5 3 2 3
Most popular news platforms
Q. Which of the following is your most frequently used mechanism to get news?

Copyright © 2015 Deloitte Development LLC. All rights reserved.
To learn more about Deloitte’s Digital Democracy Survey visit
www.deloitte.com/us/tmttrends
Follow us @Deloitte TMT
Questions? Contact us at [email protected].
Learn more

Copyright © 2015 Deloitte Development LLC. All rights reserved.
This presentation contains general information only and Deloitte is not, by means of this presentation,
rendering accounting, business, financial, investment, legal, tax, or other professional advice or
services. This presentation is not a substitute for such professional advice or services, nor should it be
used as a basis for any decision or action that may affect your business. Before making any decision
or taking any action that may affect your business, you should consult a qualified professional advisor.
Deloitte shall not be responsible for any loss sustained by any person who relies on this presentation.

About Deloitte
Deloitte refers to one or more of Deloitte Touche Tohmatsu Limited, a UK private company limited by guarantee (“DTTL”), its network of member firms, and their related entities.
DTTL and each of its member firms are legally separate and independent entities. DTTL (also referred to as “Deloitte Global”) does not provide services to clients. Please see
www.deloitte.com/about for a detailed description of DTTL and its member firms. Please see www.deloitte.com/us/about for a detailed description of the legal structure of Deloitte
LLP and its subsidiaries. Certain services may not be available to attest clients under the rules and regulations of public accounting.
Copyright © 2015 Deloitte Development LLC. All rights reserved.
36 USC 220506
Member of Deloitte Touche Tohmatsu Limited