media and water testing. services provided by: uk soils laboratory division of regulatory services...
TRANSCRIPT

Media and Water Testing

Services provided by:
UK Soils Laboratory Division of Regulatory Services
Cooperative Extension ServiceCollege of Agriculture, Food and Environment
Assistance with interpretation provided by departmental Extension faculty

GoalSupport County Extension Agents in effectively and efficiently providing
soilless media and water testing services to help clientele diagnosis problems and manage agricultural
enterprises

AgendaIntroduction of topic and background information Water testing form, bottle and sample handling and proceduresWater test results and interpretation
Questions
Soilless Media testing form and sample handling and proceduresMedia test results and interpretation
Questions
Pour-through method for a quick assessmentPortable EC and pH meter

Materials in your hand for this training
• Water Testing submission form with instructions
• Soilless Media Testing submission form with instructions
• HO 111, Understanding Irrigation Water Test Results and Their Implications
• HO 112, Understanding Soilless Media Test Results and Their Implications on Nursery and Greenhouse Crop Management

Why? When?
… test water or soilless media

Steps in the Process• Sample is taken and form completed• County sends completed form and sample to
Regulatory Services, Soils Laboratory• Soils Laboratory analyzes the sample• Emails results back to county and to a
Horticulture and/or tobacco specialist• Specialist adds comments/recommendations
and emails back to county and Soils Lab

Irrigation Water TestingChemical Properties Only

Sampling and Handling
• From the source, not through irrigation system• Run briefly before sampling• Fill sample bottle and the pour down to ½-inch
from top• Tighten cap• Store in refrigerator (briefly if necessary)• Do not freeze• Submit as soon as possible

Sampling and Handling
• From the source, not through irrigation system• Run briefly before sampling• Fill sample bottle and the pour down to ½-inch
from top• Tighten cap• Store in refrigerator (briefly if necessary)• Do not freeze• Submit as soon as possible

Sample Submission Form

University of Kentucky Water Test Report Division of Regulatory Services
XXXXX County Extension Office
Owner Sample Identification UK Lab No County Code xxxxx xx County ID Owner ID xxx none
Received Reported 8/22/2014 8/29/2014
Sample Information Irrigation method: none given Water source: Pond Crop: Vegetable Nutrient Solution: none given Condition: Field
Laboratory Results
pH 7.2 Phosphorus 0.5 ppm Zinc 0.0 ppm Conductivity 0.33 mS/cm* Potassium 16.8 ppm Copper 0.0 ppm Alkalinity 160 ppm Calcium 34.7 ppm Iron 0.8 ppm Nitrate-N 2 ppm Magnesium 12.7 ppm Manganese 0.9 ppm Boron 0.0 ppm *mS/cm = dS/m Sodium 4.1 ppm

Report of Results
Just laboratory results are reported. The horticulture department has been provided the report for recommendations. I see nothing in this analysis that should cause problems for field vegetable production. I have attached an interpretative publication on water analysis. Dewayne Ingram
Extension Agent
For recommendations for horticultural plants contact Dewayne Ingram ([email protected]).
For recommendations for tobacco float beds contact Dr. Robert C. Pearce ([email protected]).
Irrigation Water Test Interpretation

Interpretative Publication
HO-111Understanding Irrigation Water Test Results
and Their Implications on Nursery and Greenhouse Crop Management
Dewayne L. Ingram, Professor Department of Horticulture

pH
• 5.5 to 7.0 - generally acceptable• Less than 5.5 - potential problem and the
elemental constituents of the water should be examined closely
• Greater than 7.0 - a possible problem, especially if there is high alkalinity; may interfere with the effectiveness of some pesticides and growth regulators when used as spray water

Electrical Conductivity (EC)
• Gage of the free ions in a solution• Also referred to as dissolved/soluble salts• Units of Measure:
– milli-siemens/cm (mS/cm) = mmhos/cm– Reciprocal of resistance (ohms)
• 1 dS/m = 1 mmhos/cm = 1 mS/cm

Source: Cavins, et al.
Electrical Conductivity (EC)

Electrical Conductivity (EC)
• Measure of soluble salts• Less than 0.75 - no problem expected• 0.75 to 3.0 - increasing concern of excessive
accumulation of soluble salts over time• Greater than 3.0 - expect severe problems

• Measure of the buffering capacity of water• Mostly CO3
−2 and HCO3−
• Associated with Ca2+ and Mg2+ • High alkalinity - same effect as limestone addition • May cause rise in substrate pH over time•Notice the term alkaline (pH > 7) is entirely different from the term alkalinity (capacity to resist a change in pH)
Alkalinity

Alkalinity
• Less than 150 ppm – no problem expected; 100 ppm is high for plug production
• 150 to 300 ppm – increasing concern if the water pH is greater than 7.5. Expect the pH of the growing substrate to increase throughout production of the crop; use acidifying fertilizers regularly, use more acid growing substrate.
• Greater than 300 ppm – significant problems if the water pH is greater than 7.5. The substrate pH will rise rapidly throughout the production of the crop and cause many nutrient problems. Acid injection into the water may be the only remedy if this water source must be used for irrigation.

Nitrate Nitrogen
• Less than 5 ppm – no problem expected• Greater than 5 ppm – no cultural problems for
plant production, however, a nitrate level greater than 5 is a good indication that your water source is polluted. There can be greater variability in this laboratory measurement compared to other measurements.

Phosphorus
• 0 to 3 ppm – no problem expected• Greater than 5 ppm - could interfere with the
uptake of other nutrients; addition of P in the fertilization program may not be necessary; could be signal of potential water source contamination by applied fertilizer, detergents, etc.

Potassium
• 0 to 10 ppm – no problem expected• Greater than 10 ppm - no cultural problems
for plant production expected. Potassium levels this high in Kentucky water samples are rare and could be potential sign that the potential water source is contaminated with fertilizer.

Calcium
• Less than 60 ppm – expect calcium deficiencies in plant production unless calcium is added in the fertilizer program.
• Greater than 60 ppm – no cultural problems for plant production expected. Hydroponic nutrient solutions for plant production use rates of 80 to 130 ppm Ca. Irrigation water with high calcium may need no additional Ca additions through fertilization. Higher amounts of Ca will compete with P and Mg and reduce their availability to plants.

Magnesium
• Less than 25 ppm – expect Mg deficiencies in plant production unless magnesium is added in the fertilization program.
• 25 to 50 ppm – should be adequate for production of most plants; hydroponic nutrient solutions use rates of 30 to 50 ppm Mg
• Greater than 50 ppm – no cultural problems for plant production. Mg levels this high in Kentucky water samples are rare and could be a sign that the potential water source is contaminated with fertilizer.

Zinc
• 0 to 0.3 ppm – no problem expected
• Greater than 0.3 ppm - could cause toxicity in sensitive plants, especially at low substrate pH; high Zn in Kentucky water sources is rare and could be a sign that the potential water source is contaminated from old galvanized pipe.

Copper
• 0 to 0.2 ppm – no problem expected• Greater than 0.2 ppm - could cause toxicity in
sensitive plants, especially at low substrate pH; high Cu levels in Kentucky water sources are rare

Iron
• 0 to 1 ppm – no problem expected• Greater than 1 ppm – could cause foliar
spotting in sensitive plants and clog some micro-irrigation emitters
• Greater than 5 ppm – can cause toxicity symptoms in some plants, particularly at a substrate pH below 5.5
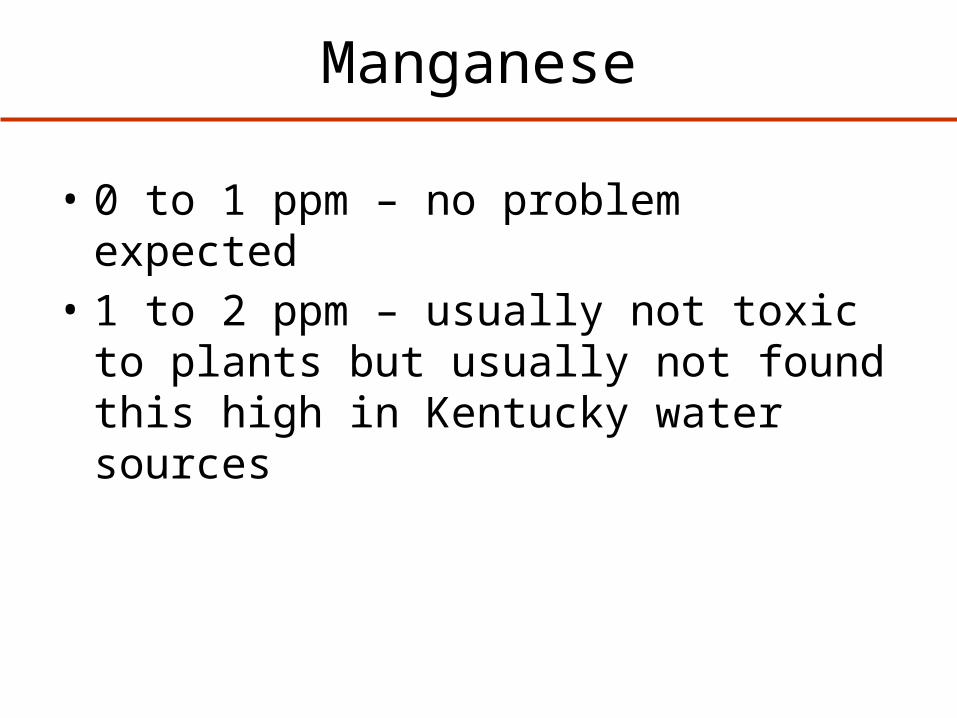
Manganese
• 0 to 1 ppm – no problem expected• 1 to 2 ppm – usually not toxic to plants but
usually not found this high in Kentucky water sources

Boron
• Less than 1.0 ppm – no problem expected. However, poinsettia is particularly sensitive to boron toxicity from B levels as low as 0.5 ppm.
• 1.0 to 2.0 ppm – toxicity may be a problem on some plants
• Greater than 2.0 ppm – expect toxicity symptoms at low substrate pH

Sodium
• Less than 50 ppm – no problem expected • Greater than 50 ppm – expect salt
concentration in the growing substrate to increase over time

Recommendations
More information = better targeted interpretation and recommendations

University of Kentucky Water Test Report Division of Regulatory Services
XXXXX County Extension Office
Owner Sample Identification UK Lab No County Code xxxxx xx County ID Owner ID xxx none
Received Reported 8/22/2014 8/29/2014
Sample Information Irrigation method: none given Water source: Pond Crop: Vegetable Nutrient Solution: none given Condition: Field
Laboratory Results
pH 7.2 Phosphorus 0.5 ppm Zinc 0.0 ppm Conductivity 0.33 mS/cm* Potassium 16.8 ppm Copper 0.0 ppm Alkalinity 160 ppm Calcium 34.7 ppm Iron 0.8 ppm Nitrate-N 2 ppm Magnesium 12.7 ppm Manganese 0.9 ppm Boron 0.0 ppm *mS/cm = dS/m Sodium 4.1 ppm

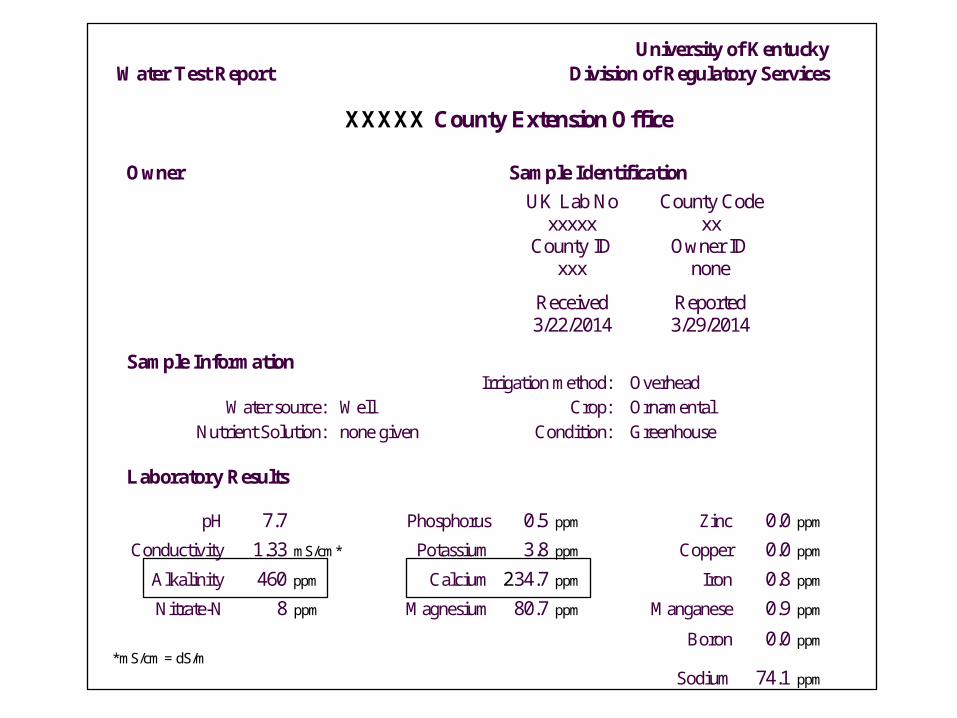
University of Kentucky Water Test Report Division of Regulatory Services
XXXXX County Extension Office
Owner Sample Identification UK Lab No County Code xxxxx xx County ID Owner ID xxx none
Received Reported 3/22/2014 3/29/2014
Sample Information Irrigation method: Overhead Water source: Well Crop: Ornamental Nutrient Solution: none given Condition: Greenhouse
Laboratory Results
pH 7.7 Phosphorus 0.5 ppm Zinc 0.0 ppm Conductivity 1.33 mS/cm* Potassium 3.8 ppm Copper 0.0 ppm Alkalinity 460 ppm Calcium 234.7 ppm Iron 0.8 ppm Nitrate-N 8 ppm Magnesium 80.7 ppm Manganese 0.9 ppm Boron 0.0 ppm *mS/cm = dS/m Sodium 74.1 ppm

High Alkalinity Water
Low Alkalinity Water
Target pH
pH Drift
Source: Bailey, 1996
pH = 9Alkalinity = 50
pH = 7Alkalinity = 300
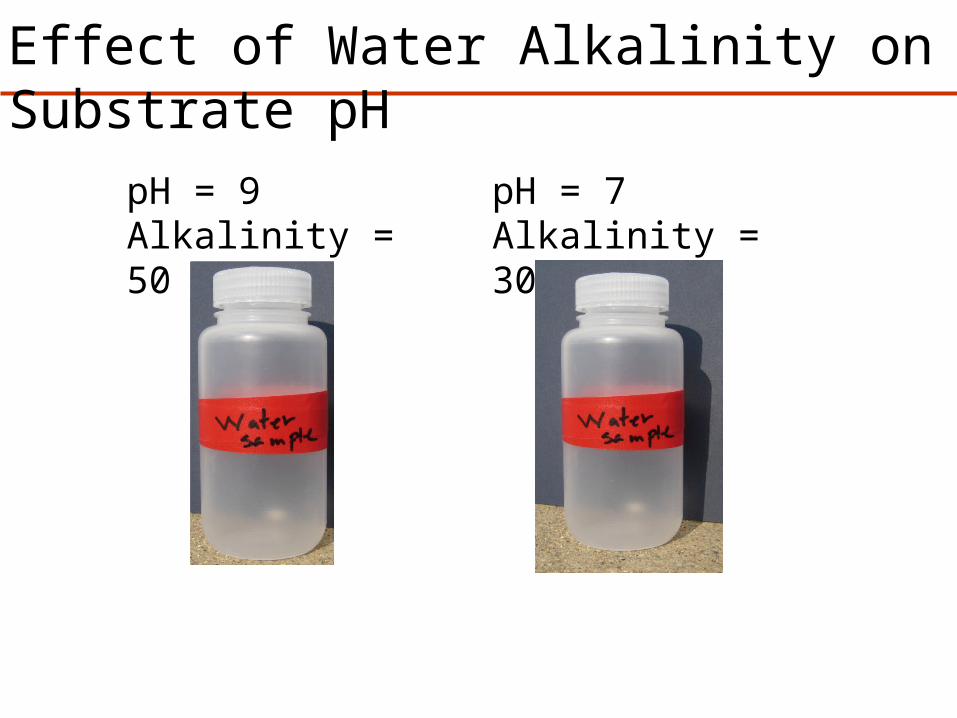
Effect of Water Alkalinity on Substrate pH

pH = 9Alkalinity = 50
Little or no effect on substrate pH
pH = 7Alkalinity = 300
Substantial increase in substrate pH
Effect of Water Alkalinity on Substrate pH

Water Quality Treatment Options
Total Alkalinity (ppm)
reverse osmosis
acid injection
acid reaction fertilizer
no treatment
> 450
200-450
100-200
< 75-100

Well Municipal Creek
pH 7.6 7.8 7.7Conductivity 0.7 0.2 9.8Alkalinity 278.0 63.0 90.0
Calcium 82.8 36.2 31.5Magnesium 0.5 12.6 10.5
Sodium 65.2 8.1 9.4

Water Test Report for Teaching Greenhouse Tap Water
Laboratory Results
pH 8.2 Phosphorus 0.5ppm Zinc 0.1ppmConductivity 0.34mmho/cm Potassium 2.5ppm Copper 0.0ppmAlkalinity 102ppm Calcium 49.4ppm Iron 0.0ppmNitrate-N 1ppm Magnesium 6.6ppm Manganese 0.0ppm
Boron 0.0ppm Sodium 13.4ppm

Questions?

Soilless Media Testing

Medium = SubstrateMedia = Substrates

Sample Submission Form

Sampling and Handling
• Variables– Crop species– Planting time– Container size– Environment
• Limited by block management
• Timing relative to activities & events
• Several locations in representative block
• 6-8 subsamples– Thoroughly mix
• Submit a 2-pint sample; two sample bags

Submit a Large Sample
+

Report of Results University of Kentucky Soilless Media Test Report Division of Regulatory Services
XXXX County Extension Office
Owner Sample Identification UK Lab No County Code xxxxx xx County ID Owner ID none Received Reported 5/13/2013 5/20/2013
Sample Information Stage of plant development: none given
Crop: Bedding Plants: Vegetables Description of plants: none given Type of media: Mixture: peast, vermiculite, copmost Fertilizer applied: none given Size of container: none given Lime applied: none given
Laboratory Results* * Sample is saturated with water. After 1 hour, pH is determined in the sample. After another hour,
pH: 7.4 Boron: 0.1 ppm water is removed from the sample. Results represent concentrations in
Conductivity: 0.61 mS/cm** Sodium: 32.7 ppm the removed water. Nitrate-N: 2 ppm Copper: 1.7 ppm ** mmho/cm = dS/m = mS/cm Phosphorus: 8.4 ppm Iron: 21.3 ppm Potassium: 25.5 ppm Manganese: 3.9 ppm Calcium: 154.5 ppm Zinc: 8.7 ppm Magnesium: 25.8 ppm

Soilless Media Test Interpretation

Nutrient Concentration Ranges
Low Acceptable Optimal High Very High
pH < 5.0
5.0-5.6
5.7- 6.5
6.6-7.0
>7.0
Soluble Salts – dS/m; mS/cm
< 1.5
1.5-2.4
2.5-3.4
3.5-4.5
>4.5
Nitrate Nitrogen (NO3N) – ppm
< 40
40-99
100-199
200-300
>300
Phosphorus (P) – ppm < 3
3-5
6-10
11-18
>18
Potassium (K) – ppm < 60
60-149
150-249
250-350
>350
Calcium (Ca) – ppm < 80
80-139
140-219
> 220
Magnesium (Mg) – ppm < 30
30-59
60-99
100-150
>150

Nutrient Concentration Ranges
Low Acceptable Optimal High Very High
Sodium (Na) – ppm
<70
> 70
Iron (Fe) – ppm< 5 5 - 10 11 -30 > 30
Manganese (Mn) - ppm< 5 5 - 10 11 - 30 > 30
Zinc (Zn) - ppm< 5 5 - 10 11 - 30 > 30
Boron (B) – ppm< 0.05 0.05 - 0.5 0.6 – 1.0 1.0 – 2.0 > 2.0
Copper (Cu) – ppm< 0.5 0.5 – 1.0 1.1 – 1.5 > 1.5

• Substrate / Medium• Composition• ‘Starter Charge’ of fertilizer• Lime (Ca and Mg Carbonates)
•Irrigation Water
• Fertilizer
Factors Influencing Media EC

Ammonium vs Nitrates
• Ammonium and urea behave the same way in soil reactions and plant utilization
• Ammonium application reduces pH• Nitrate application increases pH• NH4 < 40% of total N• Ammonium toxicity

Adjusting Substrate pH
NH4+
H+
Acidic reaction
NO3-
OH-
Basic reaction
NH4 NO3 + 2H+ + H2O
Nitrification (acidic reaction)
Root

Ammonium Toxicity
• Can occur when ammonium provides more than 50% of total N
• Occurs at higher levels of fertility… luxury consumption
• More prevalent in herbaceous plants than woody plants
• Yellowing, necrosis, rolling of leaf margins… differs with crop
• Related to the capacity of the plant to store NH4

Controlled-Release Fertilizers
Osmocote
• 70*F• Osmosis (swelling and
cracking)• PRO or PLUS formulations• “Old Staple”
Nutricote• 77*F• Polyolefin membrane
(single thickness)• Florikote or Plus formulas• Japanese product

Recommendations
More information = better targeted interpretation and recommendations

Report of Results University of Kentucky Soilless Media Test Report Division of Regulatory Services
XXXX County Extension Office
Owner Sample Identification UK Lab No County Code xxxxx xx County ID Owner ID none Received Reported 5/13/2013 5/20/2013
Sample Information Stage of plant development: none given
Crop: Bedding Plants: Vegetables Description of plants: none given Type of media: Mixture: peast, vermiculite, copmost Fertilizer applied: none given Size of container: none given Lime applied: none given
Laboratory Results* * Sample is saturated with water. After 1 hour, pH is determined in the sample. After another hour,
pH: 7.4 Boron: 0.1 ppm water is removed from the sample. Results represent concentrations in
Conductivity: 0.61 mS/cm** Sodium: 32.7 ppm the removed water. Nitrate-N: 2 ppm Copper: 1.7 ppm ** mmho/cm = dS/m = mS/cm Phosphorus: 8.4 ppm Iron: 21.3 ppm Potassium: 25.5 ppm Manganese: 3.9 ppm Calcium: 154.5 ppm Zinc: 8.7 ppm Magnesium: 25.8 ppm

Soilless Media Test University of Kentucky Soilless Media Test Report Division of Regulatory Services
XXXX County Extension Office
Owner Sample Identification UK Lab No County Code xxxxx xx County ID Owner ID none Received Reported 5/13/2013 5/20/2013
Sample Information Stage of plant development: none given
Crop: none given Description of plants: none given Type of media: none given Fertilizer applied: none given Size of container: none given Lime applied: none given
Laboratory Results* * Sample is saturated with water. After 1 hour, pH is determined in the sample. After another hour,
pH: 6.7 Boron: 0.1 ppm water is removed from the sample. Results represent concentrations in
Conductivity: 1.61 mS/cm** Sodium: 42.7 ppm the removed water. Nitrate-N: 2 ppm Copper: 1.7 ppm ** mmho/cm = dS/m = mS/cm Phosphorus: 38.4 ppm Iron: 12.3 ppm Potassium: 25.5 ppm Manganese: 4.9 ppm Calcium: 284.5 ppm Zinc: 4.7 ppm Magnesium: 205.8 ppm

Soilless Media Test University of Kentucky Soilless Media Test Report Division of Regulatory Services
XXXX County Extension Office
Owner Sample Identification UK Lab No County Code xxxxx xx County ID Owner ID none Received Reported 6/13/2012 6/20/2012
Sample Information Stage of plant development: none given
Crop: Bedding Plants: none given Description of plants: none given Type of media: Mixture: none given Fertilizer applied: none given Size of container: none given Lime applied: none given
Laboratory Results* * Sample is saturated with water. After 1 hour, pH is determined in the sample. After another hour,
pH: 5.9 Boron: 0.3 ppm water is removed from the sample. Results represent concentrations in
Conductivity: 1.61 mS/cm** Sodium: 22.7 ppm the removed water. Nitrate-N: 2 ppm Copper: 0.7 ppm ** mmho/cm = dS/m = mS/cm Phosphorus: 48.4 ppm Iron: 0.3 ppm Potassium: 25.5 ppm Manganese: 4.9 ppm Calcium: 384.5 ppm Zinc: 7.7 ppm Magnesium: 55.8 ppm

• Plant• Substrate• Limestone• Irrigation water alkalinity• Fertilizer reaction
Factors Influencing Substrate pH

Raise pH
Adjusting Substrate pH
• Change water source• Use nitrate (NO3
-) fertilizer• Apply flowable lime drench• Top dress with dolomitic lime• Apply potassium bicarbonate drench
• Change water source• Use ammonium (NH4
+) fertilizer• Acidify irrigation water• Iron sulfate drench
Lower pH

Formulation
Acidity Potential of Common Fertilizers
21-7-725-10-1020-20-2020-10-2021-5-2015-15-1520-0-20-6 Ca15-5-15-5 Ca-1 Mg15-0-15-11 Ca15.5-0-0-19 Ca
A 1556A 1040A 680A 429A 389A 260A 40B 141B 420 B 400
Fertilizer reaction

Water Test Report for Teaching Greenhouse Tap Water
Laboratory Results
pH 8.2 Phosphorus 0.5ppm Zinc 0.1ppmConductivity 0.34mmho/cm Potassium 2.5ppm Copper 0.0ppmAlkalinity 102ppm Calcium 49.4ppm Iron 0.0ppmNitrate-N 1ppm Magnesium 6.6ppm Manganese 0.0ppm
Boron 0.0ppm Sodium 13.4ppm

Formulation
Acidity Potential of Common Fertilizers
21-7-725-10-1020-20-2020-10-2021-5-2015-15-1520-0-20-6 Ca15-5-15-5 Ca-1 Mg15-0-15-11 Ca15.5-0-0-19 Ca
A 1556A 1040A 680A 429A 389A 260A 40B 141B 420 B 400
Fertilizer reaction
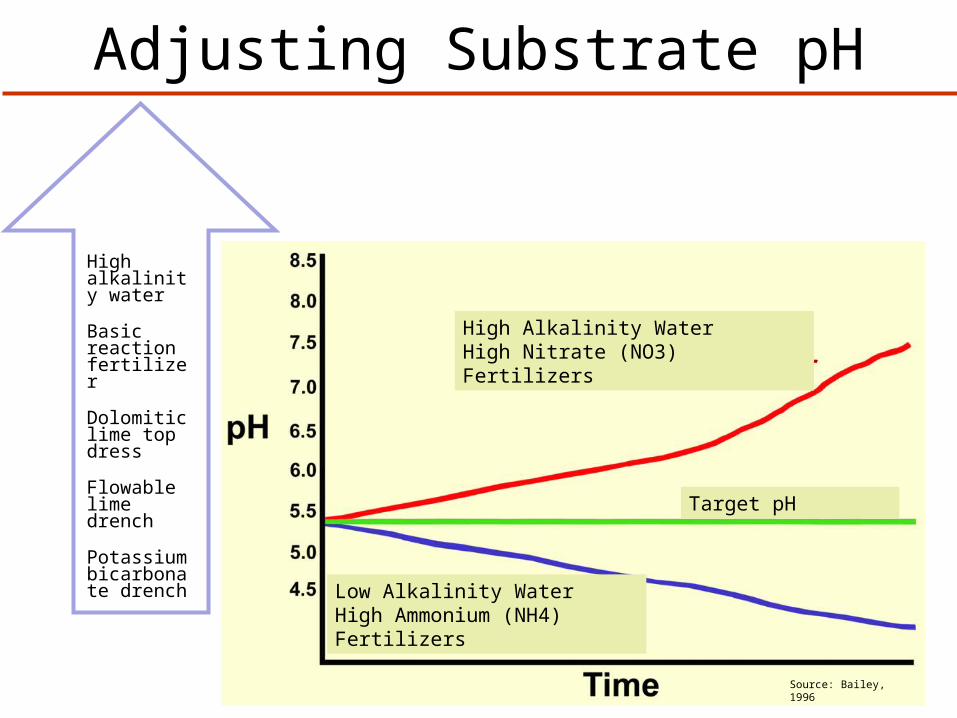
High Alkalinity WaterHigh Nitrate (NO3) Fertilizers
Low Alkalinity WaterHigh Ammonium (NH4) Fertilizers
Target pH
High alkalinity water
Basic reaction fertilizer
Dolomitic lime top dress
Flowable lime drench
Potassium bicarbonate drench
Adjusting Substrate pH
Source: Bailey, 1996
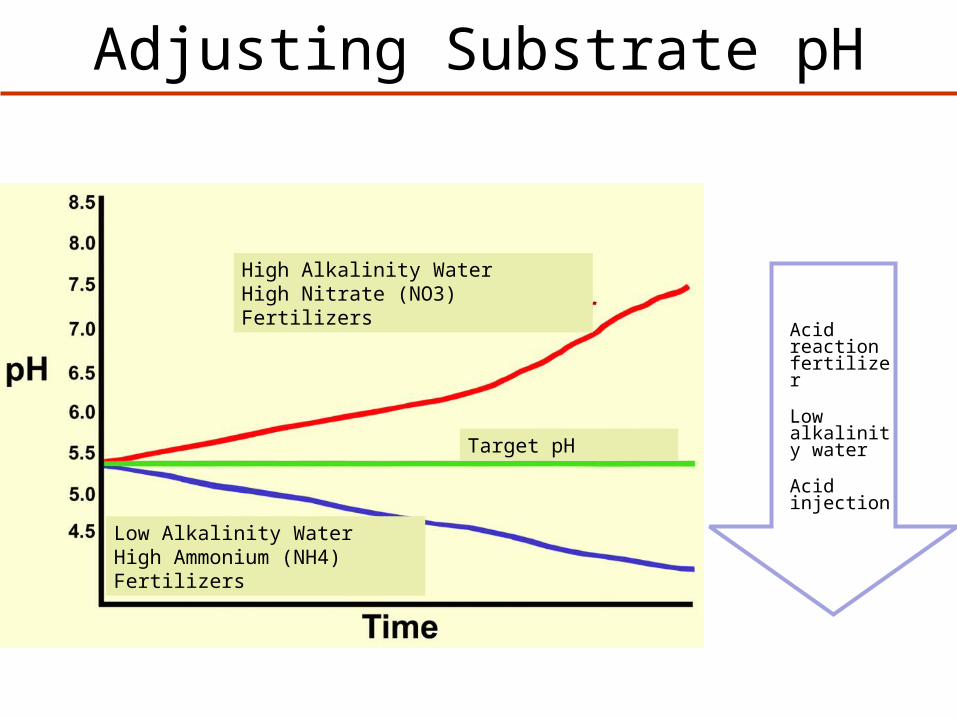
Acid reaction fertilizer
Low alkalinity water
Acid injection
Adjusting Substrate pH
Source: Bailey, 1996
High Alkalinity WaterHigh Nitrate (NO3) Fertilizers
Low Alkalinity WaterHigh Ammonium (NH4) Fertilizers
Target pH

Questions?

Pour-through Monitoring
• Non-destructive sampling–Developed by Dr. Robert Wright at VPI
• Fast and fairly accurate pH and EC status–EC in the 0.5 to 1.5 range during active
growth• Monitoring and recording over time!

3-minute videoUKREC YouTube
http://www.youtube.com/watch?v=uGIOAaiZ0s4&list=PLBB4CD63DB2B55BB1

Testing EC
• Different Procedure = Different Results• The same medium would show:
1:2 SME Pour Through0.25 0.75 1.0
mS/cm

pH and EC Meters
Hanna Instruments HI 98129pH / EC in mS/cm
HI 9811-5Portable pH/EC/TDS/Temperature

Plant Nutrient Status
• Foliar analysis– Foliar analysis provides measure of
actual nutrient concentration of plant tissue
– Problem: Often only very general guidelines are available for “optimal” nutrients concentrations
– Concentrations can vary by: age of plant, leaf position, time of year

Tissue Analysis
• Commercial Laboratory, such as:
Waters Agricultural Laboratories, Inc.Owensboro, KYwww.watersag.com/Owensboro.htm

Questions?