media impact on natives’ attitudes towards immigration · media impact on natives’ attitudes...
TRANSCRIPT
Universita Commerciale Luigi Bocconi
Faculty of Economics
Master of Science in Economics and Social Sciences
Media impact on natives’
attitudes towards immigration
Supervisor: Prof. Tito Boeri
Discussant: Prof. Michele Pellizzari
Master of Science Thesis by:
Marta De Philippis (Stud. ID: 1272772)
Academic Year 2008-2009

1

Alla mia famiglia,
A tutte gli amici che mi hanno reso la persona che sono oggi,
Grazie di tutto. Grazie per farmi credere di riuscire a realizzare tutto quello che desidero.
2

3

Abstract
The raise of negative attitudes towards immigration in the last few years is an undis-
cussed truth. Several theories on the determinants of sentiments towards immigrants
exist and have been empirically tested. A first explanation states that natives oppose
immigration because they perceive immigrants as potential competitors in the labour
market; a second theory states that anti-immigration attitudes are based on the belief
that immigrants represent a net welfare burden for the country. Other theories focus
more on cultural and ideological explanations, such as the diffusion of cosmopolitan
outlooks or the deepness of traditional values. However, although it is widely believed
that media influences individuals’ attitudes towards migration, little conclusive evi-
dence has been produced to this effect. Based on data from the ESS, the Standard
Eurobarometer survey and the Dow Jones Factiva database, this study provides evi-
dence that media has a strong power in shaping people attitudes: both individual level
and country level analyses show that the amount of time spent in news reading about
political and current affairs and the overall amount and content of news on immigration
published by national media in each country are significantly related to immigration
attitudes. However, the relationship between natives’ attitudes and news on immigra-
tion involves some endogeneity problems, since the direction of the causality is unclear.
This study shows that natives’ perceptions depend significantly on the presence of other
newsworthy events, which are clearly unrelated to sentiments towards immigration such
as the Olympic Games or natural and technological disasters, but crowd out news on
immigration. I argue that this is evidence of the persuasive power of media in shaping
natives’ perceptions.
4

Contents
1 Introduction 6
2 Related literature 9
3 Theoretical expectations 19
4 Data and variables 31
4.1 European Social Survey . . . . . . . . . . . . . . . . . . . . . . . . . . . . . 31
4.2 Country characteristics . . . . . . . . . . . . . . . . . . . . . . . . . . . . . . 32
4.3 Eurobarometer surveys . . . . . . . . . . . . . . . . . . . . . . . . . . . . . . 33
4.4 News Coverage . . . . . . . . . . . . . . . . . . . . . . . . . . . . . . . . . . 33
4.5 Instrumental variables: Disasters . . . . . . . . . . . . . . . . . . . . . . . . 36
4.6 Instrumental variables: Olympic Games . . . . . . . . . . . . . . . . . . . . . 37
5 Results 37
5.1 Individual level analysis . . . . . . . . . . . . . . . . . . . . . . . . . . . . . 37
5.2 Country level analysis . . . . . . . . . . . . . . . . . . . . . . . . . . . . . . 40
5.2.1 Section 1 . . . . . . . . . . . . . . . . . . . . . . . . . . . . . . . . . . 40
5.2.2 Section 2 . . . . . . . . . . . . . . . . . . . . . . . . . . . . . . . . . . 43
5.2.3 Section 3 . . . . . . . . . . . . . . . . . . . . . . . . . . . . . . . . . . 47
6 Concluding remarks 51
A Appendix 1: Procedure for identifying news stories on immigration 55
5

1 Introduction
Migration is a phenomenon of all periods and all continents. However it has recently become
a growing public concern, given the recent changes in the scale and speed of migration in
Europe. The last Eurobarometer, issued in September 2009 and referring to the first half
of 2009, reports that 9% of people in EU 27 mentions immigration as one of the two main
concerns in their country, 2% more than a year ago. This is a relevant result, given that
the crisis has generated concerns of primary importance on the economic and employment
situation.
In an historical perspective, migration was mostly perceived as a factor favoring economic
growth and as a solution to the problem of labour shortage in the 50s. The status of migrants,
whether legal or not, was generally not an issue of public concern. Starting from the 70s
more and more foreigners turned out to become permanent residents and the changing nature
of migration has increased public distrust, hostility and lack of confidence in the political
leaders’ ability to address the issue effectively. Restrictive migration policies were introduced
and illegal immigration became a prominent phenomenon in the 90s.
Migration tends more and more to be perceived as a process out of political control
and the connection between migration and criminality is reinforced, leading to a generalized
increase of anti-immigration sentiments and hostility towards immigrants. The scale of this
phenomenon is increasing: many political parties are exploiting the situation and propose
restrictive policies to reassure electoral worries1, instead of tackling the roots of the problem
and promoting policies that are able to attract immigrants in a beneficial and controlled
way. In the current context of economic downturn the situation is likely to worsen: historical
research indicates that surges in anti-immigration sentiment in the US have followed sharp
economic downturns. Indeed public surveys show a general pattern of increasingly negative
attitudes towards immigration.
The increasing importance of exclusionist attitudes in native population contradicts the
European countries need of migration: according to the BEPA 2 of the European Commission
1The total strictness index by the frDB (available at http://www.frdb.org/documentazione/scheda.php)
reports that all EU15 countries except Greece have been tightening migration policies from 1994 to 20052Bureau of Policies Advisers
6

(2006), Member States’ labour markets will need to attract migrants in the next years to
achieve the ambitious goals designed by the Lisbon and the future post 2010 agendas and
full economic development. A main challenge is therefore to design policies able to manage
immigration flows effectively, to keep under control citizens’ concerns on problems caused by
migration and to promote a multicultural and cohesive society, able to attract and integrate
newcomers and to fully exploit the opportunities that they could provide to each country.
The study of the determinants of individuals’ perceptions is crucial because voters’ atti-
tudes represent a key driver of policy outcomes and Government activities. The process of
integration of migrants will not be feasible if individuals perceive immigrants as enemies and
criminals, since they will never support the policies previously mentioned.
Even if there exists a generalized worsening of attitudes towards immigration, percep-
tions vary significantly from one country to another. This reflects, among other factors,
differences in immigration experience, level of economic dependency on immigrants and type
of immigration across Europe. In general, four different historical paths of immigration can
be identified in Europe. In the 1960s and 1970s, the temporary work model (Switzerland,
Germany, Austria, and Luxembourg) attracted mostly un- and semi-skilled migrants from
Southern Europe, former Yugoslavia and Turkey. The inflow of migrants was then perpetu-
ated to ensure family reunification and chain migration and, therefore, the share of foreign
born is relatively high in these countries. However, afterward, the integration of first, but
mostly second generation migrants has become a challenge in view of changing demands of
migrant skills combined to a failure to promote immigrants education adequately. In contrast,
the Nordic model originated with free labour movement within the Nordic countries. Only
from the 1980s onwards a significant number of migrants, especially with refugee background,
from third countries settled in the Nordic region. The third type of immigration model is the
result of colonial ties, as in the case of United Kingdom, France, The Netherlands, Belgium
and Portugal. These immigrants are usually able to speak the host country language but
face marginalization often due to their ethnic minority background and low education level.
Finally, the new immigration countries, especially located in Southern Europe, are countries
that traditionally have been regions of emigration and do not have a long experience with
the inflow of foreign workers and have just started attracting immigrants and developing
7

immigration policies.
The contribution of this study is to analyze determinants and patterns of attitudes towards
immigration, exploiting information other than just individual characteristics. Particular
focus is placed on country level characteristics to shed light on the ways Governments can
intervene in the formation of attitudes at national level.
Both economic and non economic drivers are investigated. Many different explanations
have been given by the current literature on the nature of natives’ attitudes towards migra-
tion: some theories focus on the increased degree of labour market competition due to the
inflows of migrants with similar skill level of natives. Other studies focus on the increased
welfare burden caused by the arrival of new migrants. Moreover there are studies concen-
trated more on cultural and ideological explanations of natives’ attitudes. It is, finally, widely
believed that media can significantly influence people opinions, also on the immigration issue.
The aim of this study is to investigate both at country and at individual level the relevance
and the relative importance of the previously mentioned explanations of natives’ attitudes
towards immigration. The individual level analysis is based on data from the four available
waves3 of the ESS. The country-based analyses make use of different datasets. First, data
from the ESS are averaged across countries and years and are combined with other country
level variables, taken from Eurostat or the Dow Jones Factiva Database. Second, a new
dataset is built that covers the time span between 2003 and 2008, with a six month frequency,
and includes country level data from various sources (Standard Eurobarometer survey, Dow
Jones Factiva database, Eurostat).
Special attention is given to media impact on perceptions. The way immigration is covered
as well as the way it is framed in the national media are important determinants of natives’
perceptions towards immigration. However, little conclusive evidence has been produced to
this effect. Notice that recent studies have, instead, investigated how media penetration
influences redistributive spending (Stromberg 2004), voter turnout (Gentzkow 2006), voting
pattern (Della Vigna and Kaplan 2005) and the amount of State aids given by US government
in response to natural disasters (Eisensee and Stromberg, 2007).
32002, 2004, 2006, and 2008
8

To my knowledge in the literature there is no systematic attempt to relate country specific
media coverage of immigration to natives’ perceptions. The main methodological challenges
are (i) a scarcity of available data. I address this problem by using data from the Dow Jones
Factiva database, which collects news from all over the world, during the time span from
2001 till present. (ii) The direction of the causality is not clear and the problem of omitted
variables is an issue: from a theoretical point of view, the exposure to certain news can be
both the cause and the consequence of attitudes towards immigration. According to a first
hypothesis, news have a direct impact on public believes. However, an alternative theory
states that people choose to expose themselves to news that are consistent with their priors
opinions. In this second case controversial news on immigration are consequences of natives’
ex ante opinions: media will publish this type of news to boost sales and profits. Moreover,
news coverage depends on some unobservable characteristics such as salience of the news
and political and social context that might influence perceptions independently of the way
and the amount of time spent by media in reporting news on immigration. I overcome these
problems by using instrumental variables and country and year fixed effects. Finally, (iii) the
structure and the nature of national newspaper system are different across countries and a
completely exhaustive cross country comparison of media coverage is a rather ambitious task.
I partially overcome this problem by using fixed effects estimation and relative measures of
media coverage instead of absolute ones.
The outline of the study is as follows: section 1 reviews the related literature, section 2
presents the empirical strategy as well as the theoretical expectations, section 3 describes the
data used, section 4 presents the empirical results and the robustness checks, finally, section
5 presents my conclusions.
2 Related literature
This study draws mainly from two streams of literature: the first is the literature concerning
determinants of attitudes towards migration and the second one is the literature in political
and social sciences and communication studies on the persuasion effects of media.
9
The analysis of the determinants of individual attitudes is a relatively recent branch of
the economic literature and draws his origin from the study of changes in attitudes towards
black minorities in the US. However, the tendencies observed in the US cannot be straightly
generalized for the European context: in Europe the presence of ethnic minorities is a rela-
tively recent phenomenon and European surveys have only recently started to ask questions
on attitudes towards migration. Moreover, the culture and the ability to assimilate foreigners
are very different between the two continents both for historical and cultural reasons.
A first set of papers explores the economic determinants of individuals’ attitudes, basing
the analysis on individual socio-economic data. The underlying hypothesis, according to the
group conflict theory, is that negative perceptions towards migration are caused by competi-
tion for scarce goods: by the fear of losing material goods such as affordable housing, well-paid
jobs or the welfare benefits but also by the fear of losing power and status, due to entrance
of migrants in the country. Ample evidence has been provided that attitudes are connected
to individual characteristics, such as educational level (Mayda 2006, Scheve and Slaughter
2001) and income level (i.e. Boeri, 2009). The conclusions of the group conflict theory are
confirmed: individuals who are more socially and economically vulnerable and more threat-
ened by the presence of minorities are more likely to express discriminatory and negative
attitudes. This suggests that economics and competition are determinants more important
than ideology in shaping attitudes towards immigrants. Still, this economical explanation
has been criticized. Hainmueller and Hiscox (2007) provide evidence to the hypothesis that
what drives people attitudes is more a matter of culture and ideology: people with higher
education and skills are more likely to favor immigration regardless of the skill attributes
of the immigrants, which is independently of the level of competition in the labour market.
”More educated respondents are less racist and place greater value on cultural diversity [...]
higher level of education leads to greater ethnic and racial tolerance among individuals and
more cosmopolitan outlooks” (Hainmueller and Hiscox, 2007).
A smaller amount of research explores the economic relationship between perceptions
and country level characteristics. These are comparative studies that focus on structural
sources of cross-national variations in discriminatory attitudes but still not specifically on
the explanatory power of cultural variables. Mayda (2006), even acknowledging the strong
10

role of cultural factors, shows, with a multi country comparison, that individuals are more
favorable towards immigration the more their skill characteristics are different from those of
immigrants, because they feel less competition from them. Mayda (2006) finds that ”indi-
viduals with higher levels of skill are more likely to be pro-immigration in high per capita
GDP countries and less likely in low per capita GDP countries”. High per capita GDP coun-
tries tend to attract low skilled immigrants4, who are competitors in the labour market with
(higher skilled) natives.
Some papers show that also welfare-state considerations shape natives’ attitudes: immigrants
may represent a net benefit or a net cost for the welfare system but, in any case, they affect
the redistribution of welfare resources across the population. This may determine negative
attitudes on those natives that are negatively affected. Following Facchini and Mayda (2007),
it is possible to identify two adjustment mechanisms of the welfare systems, depending on
each country welfare structure. Immigrants can affect the post-tax income of natives by in-
creasing the tax burden, and therefore impacting particularly the individuals in the top of the
income distribution. Alternatively, they can affect the level of benefits received by natives,
impacting particularly those at the bottom of the income distribution. Facchini and Mayda
(2007) conclude that the first welfare effect prevails: assuming that low skilled individuals
are a welfare burden for the society, the deeper is the skill gap between (skilled) natives and
(unskilled) immigrants, the more high income natives are negative towards migration. Other
papers (Boeri, 2009) find, exploiting time-series and cross country variation, that individuals
who receive social transfers (unemployment benefits or any other benefit or social transfers)
tend to be more negatively oriented towards immigrants, suggesting that the second welfare
effect prevails. Moreover, Boeri and Brucker (2005), with a cross country analysis, find that
countries with more generous social welfare systems and more rigid wage setting institutions
tend to be more negative towards immigration.
A second set of papers investigates the importance of non economic determinants of
natives’ attitudes, exploring the role of preferences for cultural and ethnic homogeneity.
At the individual level, evidence has been provided that religiosity, human values (Davidov
et al., 2008), right-wing voting (Semyonov et al., 2006) determine attitudes.
4economic reason behind this statement will be given below
11

Moreover, considering structural sources of cross country variations, Card, Dustmann and
Preston (2005) analyze, through a structural multiple factor model, the relative importance
of three sets of considerations in the formation of attitudes: labour market competition,
burden on the public finance and cultural factors. They find that the cultural dimension has
by far the strongest effect on immigration attitudes.
Understanding whether economic or cultural factors mainly drive attitudes is crucial
for Governments when they have to design immigration policies and management of ethnic
minorities. In the first case policies such as targeted assistance or job creation programs can
work while in the second case they will hardly work.
Other possible non economic explanations are found in the literature.
One stresses the role of natives’ direct interactions with immigrants in their daily lives.
This hypothesis was first posed by Williams (1947) and was revised later by many others
with the main focus on the U.S., where it was used in an attempt to explain hostility and
prejudice towards blacks. Recently evidence has appeared for some European cases. Two
types of interaction can be distinguished: active or passive contact. Active contact is defined
as contact in which the native plays a definitive role for it to take place, while in the passive
case, the interaction is accidental. In general, the former is more likely to generate a positive
attitude towards immigrants than the latter. Escandell and Ceobanu (2009) find evidence,
using different contact measures and controls, that close and occasional forms of contact are
associated with reduced foreigner exclusionism is Spain.
Another key determinant of attitudes towards immigration consists in the widespread
concerns among natives that immigrants increase crime rates. Mayda (2006) and the studies
find that a key determinant of negative attitudes towards migration is the perception that
immigrants are more likely than natives to be involved in crimes. Standard economic theories
of crime provide reasons why immigration could be possibly related to crime, such as different
legitimate earnings opportunities, different probabilities to be convicted and different costs
of conviction between natives and immigrants. However Bianchi at al. (2008) estimated
the causal effect of immigration on crime rates across Italian provinces during the period
1990-2003 and found that, once the endogeneity of immigrants’ distribution across provinces
is taken into account, the estimated effect of immigration both on total and on property
12

crime rates is not significantly different from zero. This indicates that perceptions more than
actual and real facts drive natives’ believe that immigrants increase crime rate. As a matter
of fact, a research5 recently carried out by the ”Osservatorio di Pavia” on the relationship
between crime rates and news on criminality on evening TV news in Italian media between
January 2005 and June 2009 provides evidence that the amount of news on criminality is
not positively related with the number of crimes actually occurred in the same period, as
one would expect. The relationship, reported in figure 1, is instead negative. If evidence is
provided that media can actually shape natives’ perceptions towards immigrants, then the
results of the research of the Osservatorio di Pavia could help to explain the contradiction
found in the study by Bianchi et al. (2008). This would be a very relevant result, given the
recent discussion on the importance of free and pluralist media and the sharp increase of
controversial news on immigration in Italian media.
There are also some papers (Bauer et al.,2000) that explore the relationship between
attitudes towards immigrants and the type of immigrants that are attracted in each country,
especially focusing on the role of public policies on immigration. They find that in countries
that receive predominantly refugee migrants, natives are more concerned with the impact of
migrants on social issues (crime), while in countries with mostly economic migrants natives
are more concerned about losing jobs. Moreover they find that if immigrants are selected
according to the needs of the labor market, natives’ attitudes are more favorable. However the
problem of this literature is that the direction of the causality is not clear: lenient policies
can attract ”good” migrants and originate tolerant attitudes but it can also be the other
way around, tolerant attitudes of the voters can be at the basis of the creation of lenient
immigration policies.
Finally, research that focuses on the evolution of attitudes toward migration is far scarcer:
very few papers examine the dynamic of out-group attitudes. Theoretically changes in out-
group attitudes can be driven by changes in the level of threat and competition on scarce
resources as well as on other explanations such as cohort replacement, that consists in the
fact that older, more prejudiced cohorts die and are replaced by younger and more educated
and open-minded cohorts, leading to a relaxation of prejudices. Meuleman and Davidov
5http://www.osservatorio.it/download/Criminalita2009.pdf
13

(2008) use a multiple-group multiple-indicator structural equation modeling to explain the
observed trend in attitudes and concluded that perceptions evolve in coincidence with evolu-
tion in national context factors, such as immigrant group size (positive but moderate relation
with negative attitudes towards immigration), economic growth (declining economic growth
coincides with a rise of anti-immigration attitudes) and unemployment (attitudes toward
immigration are more restrictive in countries with growing unemployment). Semyonov et
al. (2006) use a series of multilevel hierarchical linear models to examine changes in the
effects of individual and country level characteristics on discriminatory sentiments over time.
They analyze 12 European countries at four points in time from 1988 to 2000 and observe
an increasing trend of anti-foreigner sentiment in all countries. The impact of individual
level characteristics remains generally constant over time, while negative attitudes towards
out-group population increase with the size of minority population and decrease with good
economic conditions.
The second stream of literature that gives theoretical foundation to this work focuses
on the persuasion role of mass media in shaping ideological positions. Mass media has a
very important role in the society; its function has been firstly studied by Lippman at the
beginning of the twentieth century. He analyzes propaganda techniques after the First World
War and notices that, acting on the unconscious level, media is able to influence behaviors and
believes. My survey on this very wide issue is far from being totally exhaustive, I will focus
on more quantitative and economic-oriented works, leaving aside more sociological studies.
The theory of ”issue priming” states that individuals have an agenda of salient attributes
in their minds and this agenda is shaped considerably by the mass media. As stated in
Krosnick and Miller (1996) ”when people shape their believes they rarely consider the com-
plete set of the relevant information that might be used to reach an optimal conclusion, they
usually rely on the set of available evidence”. The news that media decide to publish exerts
a big influence in determining the issues used by individuals in making evaluations. Recently
media paid a lot of attention on illegal immigration and criminality associated to immigrants.
This probably led many individuals to think frequently about this issue, to discuss it with
friends and relatives and to build, on the basis of this information, a certain believe on im-
14
migration. ”The issues the media chooses to cover most end up being primed, meaning that
they become the predominant bases for publics evaluations” (Krosnik and Miller 1996, pag
260). Evidence of this effect has been provided through experiments and analyses.
The literature on the agenda setting role of media is wide: comparisons of the media
agenda and the outcomes of opinion polls, such as the Eurobarometer, that ask opinion on
the most important problems each country is facing, yield evidence of the agenda setting
role of mass media. The first study (McCombs and Shaw, 1972) on the agenda setting
role of media took place in North Carolina (Chapel Hill) for the US presidential elections
of 1968: when voters were asked about the most important issues in the electoral debate
they responded mentioning exactly the subjects most followed by media during the previous
month. Subsequent studies have examined much longer periods of time and much wider set
of countries. The correlation between how issues are ranked in terms of importance by the
public and the degree of media coverage on those issues is of 0.5 or better in most of the
studies analyzed 6. This provides evidence of the very powerful agenda setting role of media.
The ample literature about media provides also evidence of the role of media in shaping
political ideology and voting choices and in influencing governments’ choices by giving direct
evidence of their political work. Eisensee and Stromberg (2007) analyze the influence of mass
media on the aids allocated by US government for approximately 5000 disasters between 1968
and 2002. They find that the effect is significant: US relief depends on the amount of time
the disaster considered was discussed by media. They find a negative correlation between
whether the disaster occurred at the same time of other newsworthy events not correlated
with the need of aids (such as the Olympic Games) and the amount of aids allocated by
the US government. Since Olympic Games are not linked to the gravity of the considered
disasters, the only possible explanation is that, in deciding about the amount of relief to
assign to a natural disaster, the US government takes into account the news coverage it
received by national media.
Other studies show the strong persuasive power of media: for instance, Kaplan and Della
Vigna (2007) identify the effect of watching Fox News on voting behavior by looking at
the introduction of Fox News Channel in a town-level analysis. They find that Fox News
6See McCombs (2002) for a review of this literature
15

convinced 3 to 28 percent of its viewers to vote Republican. The persuasive role of media is
not only limited to the political topics: for example Mikami et al. (1994) show the impressive
correspondence between the way Japanese newspapers present global environmental problems
and the believes of Tokyo residents on this issue.
Therefore, if media bias exists, it can generate manipulation of people opinions.
Literature provides evidence of the existence of media bias. For example Lott and Hassett
(2004) test for political bias in news reports to understand whether republicans and democrats
are covered differently in US media. The authors objectively categorize newspaper headlines
as positive, negative, neutral or mixed and then compare them with the characteristic of
the reported economic news itself, which consists in objective numbers such as the quarterly
variation of GDP or of unemployment. They find that American newspapers tend to give
more positive news coverage when Democrats are in presidency than for Republicans, and
that this influences readers’ opinions.
Several explanations of media bias have been proposed.
The most common one is that media bias reflects preferences and career concerns of journal-
ists, editors, or owners, who have ideological preferences and believes that want to communi-
cate to society. Moreover, on the other side, if media plays a role in monitoring the behavior
of incumbents, it is possible that government capture of the media sector leads to distortions
and manipulation of news contents.
According to the demand-side explanation, media outlets are primarily driven by profit
motives, as opposed to political motives. In this case, bias arises from the ex ante prefer-
ences of consumers, who are assumed to prefer to read news that confirm their prior believes.
Moreover, due to the increasing-return-to-scale technology and media dependence on adver-
tising revenue, media outlets may deliver more news to large groups or groups valuable to
advertisers (Stromberg, 2004).
Mullainathan and Shleifer (2002) combine these two types of explanations (demand and
supply driven) and identify in their model two types of media bias: the first one, which
they call ”ideology”, is based on the media’s desire of influencing the opinion of the readers
on a particular issue. It can be eliminated through competition across media outlets, since
probably different media outlets will have different ideologies and the presence of many
16

media ensures by itself a big variety of opinions. The second one, which they call ”spin”,
is based on the media attempts of creating a memorable story. Mullainathan and Shleifer
assume (categorical readers case) that readers forget those stories that are inconsistent with
their prior believes. Their model shows that, in this case, media bias is exaggerated by
competition: media outlets want to maximize sales and, if there is high competition, they
will publish stories more and more consistent with people priors, creating a vicious cycle.
This bias can only be eliminated by the presence of different ideological pressures, which lead
media to frame and present issues accordingly to their different ideologies, ensuring a variety
of points of views. It is by keeping this in mind that the structure of media ownership and
the degree of freedom of press are important factors to be considered.
Concerning the ways media affects individuals’ perceptions on migration and ethnic mi-
norities, Wilson and Gutierrez (1985) identify different modalities through which media rep-
resents immigrants:
1. Exclusion: ethnic minorities are not represented in the media.
2. Threat: ethnic minorities are present in the news but they are perceived as a threat to
security and social order. They are mainly represented when talking about murders,
thefts, unemployment, hidden economy and illegal immigration.
3. Opposition: minorities are represented as enemies, instead of encouraging conciliations,
media encourages conflict, always talking of ”us” against ”them” and showing how the
arrival of new immigrants is a serious issue. The natural consequence of this approach
is the origin of laws against immigration and on racial segregation
4. Stereotyped selection: minorities are represented in positive stories to reassure popula-
tion and to show that the society is able to include minorities. Immigrants are usually
victimized.
5. Total coverage: this is the modality that implies maximum integration, any prejudice
and unjustified fear is removed and social comprehension is promoted. Minorities are
17

the subjects of any type of news, not necessarily only positive: they are treated as any
other member of the majority.
There have been many reports monitoring the way ethnic minorities are represented by
media, but few of them extended their scope across national borders. A research, made in
the framework of Online/More Colour in the Media project ”European Media Monitoring”
in 2004, provides a picture of the way news on migrants are reported by media in 15 Member
States. The EUMC-RAXEN national focal points monitored, on the 13th of November 2003,
the representation of minority groups in the main European newspapers and televisions. They
select 10 newspapers7 in each of the considered countries, both quality newspapers, popular
or tabloid newspapers and free daily newspapers, and categorize news according to several
criteria. In general, they find that minority ethnic groups are overrepresented in crime news
and underrepresented in political news. Moreover, the percentage of articles with ethnic
dimension (concerning issues related to ethnicity) is higher in left-wing newspapers than
in right-wing newspapers. Overall, controversial issues (integration/segregation, asylum,
immigration policies, crime and racial violence) account for 60% of all newspapers stories
with an ethnic dimension. Moreover they signal that there are few direct quotation of the
opinion of representatives of ethnic minorities. On the other side, they observe a increasing
presence in some countries of minority groups in total news stories, not necessarily related to
ethnic issues. This is an important indicator of normalization and acceptance of minorities.
Linking these findings with the classification previously described, migrants in Europe are
mainly described in the frame of threat and opposition.
The paper more conceptually related to mine is Mayda, Facchini, Puglisi (2009). It
analyzes the relationship between individuals’ exposure to mass media and opinion on im-
migration policies. Their work focuses on the percentage of people in favor of the US Senate
plan on illegal immigration (the Kennedy-McCain plan in 2007), that explicitly introduces a
path to citizenship for illegal immigrants. They analyze how the opinions change according
to the specific TV channel generally used by each individual to watch national evening news.
7For a detailed description of the methodology and the list of the selected newspapers see the report, avail-
able at http : //www.mugak.eu/ef etp files/view/informe 2004 European Day of Media Monitoring.pdf
18

However this study is different in several ways: (i) it is a cross country analysis based
on different European countries, while the work by Mayda, Facchini and Puglisi is based on
one single country, the US. (ii) My work is mostly based on country level analyses, while
the units of analysis of Mayda, Facchini and Puglisi are individuals. Finally, (iii) my work
focuses on immigration in general while their study focuses on illegal immigration and (iv)
my study considers bias generated by overall news coverage in the countries not by the single
news sources used by individuals.
3 Theoretical expectations
Which individuals are more likely to oppose immigration?
Grounding on the results obtained by previous studies on anti-immigrant attitudes, sev-
eral common conclusions can be reached: negative attitudes are more frequent among so-
cioeconomically vulnerable people (low education, low income, unemployed, low position in
social scale) and among people with conservative and nationalistic political ideologies. At
country level, the phase of the immigration cycle is relevant: concerns on immigration will
probably be higher in countries where the immigration phenomenon is new and where the
right institutions, policies and cultural background have not been completely developed yet.
I take into account these structural differences between European countries in immigration
cycles and histories by using country and year fixed effects in all specifications.
My analysis is developed in two levels: (i) the individual level, where I carry on a basic
analysis meant to understand the main individual characteristics that shape perceptions
on immigration and (ii) the country level, which is the phase where I go deeper in my
investigation and is meant to understand the factors that cause generalized changes in believes
and attitudes at country level, focusing particularly on the effect of media.
In particular, at the individual level I want to see how much cultural and ideological
variables are able to explain perceptions on immigration, because, if perceptions are largely
explained by the cultural dimension, then the media ability of affecting and shaping attitudes
is expected to be much stronger. The analytical strategy for the first part of the analysis is
to sequentially introduce distinct groups of explanatory variables and to see how much the
19

goodness of the model and the coefficients change according to the different specifications.
My econometric specification is of the following form:
Pr(proimmit = 1|xit) = Φ(αj + αt + β1θit + β2ζit) (1)
Where proimmit is a dummy variable that indicates whether an individual has positive
attitudes toward immigrants, in the sense that she thinks that her country should allow
more immigrants to come and live there (proimmit = 1), or not (proimmit = 0); αj stands
for country fixed effects; αt for year fixed effects, θit for socio-demographic control variables
and ζi for cultural control variables. To have further insights, I run the same regressions
using as dependent variable a dummy, named proimm2, that indicates whether an individual
has positive attitudes specifically towards immigrants coming from poorer countries outside
Europe8. Moreover I use other three dependent variables, based on natives opinions on
the effects of immigration (”multiculturalism”, ”immgoodsoc” and ”immgoodeco” explained
later9). My analysis is based on the estimation of probit models. All specifications have
robust standard errors adjusted for clustering on countries.
Previous literature shows that it is important to include structural country variables in the
analysis of individual attitudes because the effects of individual characteristics are different
in each country and a more accurate analysis of the determinants of these differences is a
useful tool for policy prescriptions. This is the main motivation that leads me, in the second
part of this study, to analyze perceptions at country level.
My country level analysis is articulated into three main sections, the first two use data
from ESS while the third one exploits a different dataset, that I built in order to overcome
some of the problem of the previous analyses and uses data on perception towards migration
taken from the Standard Eurobarometer survey.
Grounding on the existing literature, I can identify three main channels that affect atti-
tudes and concerns of natives on immigration:
8the way it is constructed is similar to that of the dummy proimm but it is based on a question specifically
related to poorer immigrants from outside Europe, ”to what extent do you think [country] should allow
immigrants from poorer countries outside Europe to come and live here?”.9the values of these variables range from0 to 10, I do not use probit models for these specifications.
20

• Labour market competition: the situation of the labour market, given by the level
of unemployment, the type of occupation, the anxiety of losing one’s job, is a determi-
nant of the opposition to newcomers. Among natives, the most adverse to immigration
will be the individuals whose skills are more similar to those of immigrants. I follow
Mayda (2006) in the construction of the measure of natives to immigrants relative skill
mix. In particular, using data from the European LFS (Eurostat), I compute the ratio
of skilled to unskilled labor in the native relative to the immigrant populations. I name
this variable skillgap10, see table 6. The idea is that the higher is the skill gap between
natives and immigrants, the less natives will fear immigration, because they feel no
labour market competition. Mayda (2006), in order to check the robustness of her
estimates and to use a higher number of observations, uses as proxy of the natives to
immigrants skill mix the (log) per capita gdp (PPP-adjusted) of the destination country
in the considered period. She justifies it by stating that, theoretically, in a standard
international migration model with no productivity and technological differences across
countries the relationship between host countries’ per capita GDP and natives to im-
migrants relative skill mix is unambiguous and positive (more unskilled migrants flow
mostly into higher per capita GDP countries). In fact, natives in high per capita gdp
countries will be on average more skilled and therefore these countries will have shortage
of unskilled work and higher unskilled wages. This represents an incentive for unskilled
migrants to move to these countries, which will therefore attract mostly unskilled immi-
grants. However, when dropping the simplistic assumption of equal technological levels
across economies, it can be that technologically advanced economies offer higher wages
both for skilled and unskilled workers; therefore the pattern of skilled and unskilled
migration is ambiguous. Mayda (2006) explores the link between per capita GDP and
the direct measure of skill mix of natives relative to immigrants, to test whether gdp is
10In particular it is computed as one plus the log of the relative skill composition of natives to immigrants.
For both natives and immigrants, the ratio of skilled to unskilled labor is measured as the ratio of the number
of individuals with high level of education (ISCED 03 and over) to the number of individuals with low level
of education (ISCED 00, 01, 02). Data used to construct this variable represent the stock of immigrants and
natives and come from the LFS (Eurostat).
21

a good proxy. Using data from the IMS-OECD statistics for fifteen countries11 in 1995,
she obtains that the correlation between the two is positive (0.6120) and significant at
1.53% level. However, checking the reliability of this proxy with the data available for
this study 12, I obtain that the correlation is positive (0.125) but not significant at 10%
level. I will therefore be careful in using per capita GDP as proxy for the native to
immigrants relative skill mix.
• Burden on welfare state: the presence of immigrants will definitively modify the
distribution of net welfare benefits of the population. Migration might impose a higher
fiscal burden to high income natives or subtract welfare benefits to low income ones.
I will mostly base my analysis on the work of Boeri (2009) and Facchini and Mayda
(2007), who explicitly consider two adjustment mechanisms through which the coun-
tries’ welfare states include immigrants. The underlying assumption is that unskilled
migrants are net negative contributors to the host country welfare system while the
opposite holds true for skilled migrants. Under a first scenario, the value of per capita
benefits is unaffected and what adjusts in order to balance government budget is the
tax rate. Therefore, assuming a redistributive welfare state, high income individuals
are more negatively affected by unskilled migration than low-income individuals, be-
cause richer individuals will be forced to pay more taxes. Under a second welfare state
scenario, the adjustment introduced by migration occurs through changes in welfare
benefits, keeping constant the tax rate. In this case the burden falls more on low in-
come individuals, who see their benefits reduced due to increases in competition for
access to public services caused by unskilled migration. The conclusion reached by
Mayda and Facchini (2007) is that, according to data, the first welfare state scenario
holds true. A measure of the welfare burden generated by immigration in the destina-
tion country is computed by Boeri (2009), who presents the share of net contributors to
11West Germany, East Germany, Great Britain, Austria, Italy, Ireland, Netherlands, Sweden, Canada,
Spain, Portugal, France, Denmark, Belgium, Finland12I compute the correlation between the (log) per capita GDP PPP adjusted and the relative skill compo-
sition for the 25 countries for which it is available (AT, BE, BG, CH, CY, CZ, DK, EE, ES, FI, FR, GR,
HU, IE, IS, IT, LU, NL, NO, PL, PT, SE, SI, SK, UK) in the 4 years of my analysis.
22
the welfare system among immigrants and among natives. Table 1 shows these figures.
Since this source does not refer to the same years of my analysis, I cannot use the direct
measure of migrants’ fiscal burden. A possible proxy for the welfare burden brought by
immigrants is per capita government social expenditure. I check the reliability of the
proxy by comparing data on benefits with those obtained by Boeri (2009) on the net
contribution of migrants in the welfare system. The correlation between the share of
positive net contributors among immigrants (that are those who pay more taxes than
the benefits they receive) and the level of per capita government social expenditure,
for the years and the countries when data are available13, is negative (-0.2331) but not
significant at 10% level: in more generous welfare systems (higher benefits), the share
of positive net contributors (snc) among migrants is lower, however this correlation is
not strongly significant. Therefore, caution must be used when using this proxy.
• Assimilation: immigrants may be more or less integrated and assimilated in a society,
depending on natives and foreigners cultural characteristics such as traditions, educa-
tion, cultural openness and historical background as well as on their mutual behaviors:
immigrants degree of criminality and natives xenophobic conduct. The assimilation
channel is not an objective and easily measurable one. Previous research has often used
as a proxy for this dimension answers to survey questions on the subjective importance
given by individuals to traditions, exchange of different ideas, or their openness to new
cultures and experiences. In my empirical analysis I measure the significance and the
direction of this channel looking at the average across countries of natives’ answers to
some of these questions in the European Social Survey.
The effects produced by these three channels may be amplified and modified by the type
and extent of media coverage of the immigration issue: the exposure to a large amount
of news on immigrants as well as to certain types of news (criminality among immigrants,
terrorism, illegal immigration, racist behaviors) shapes believes of the public, both regarding
the urgency of the topic and regarding the effects of immigration. As mentioned in the
13data on snc from Boeri (2009) are available for the years 2004 (AT, BE, DK, FI, FR, IE, IS, LU, NO,
SE), 2005 (AT, BE, CZ, DE, DK, FI, FR, HU, IE,IS, LU, NL, NO, PL, SE, SK, UK) and 2006 (AT, BE,
CZ, DE, DK, ES, FI, FR, HU, IE, IS, LU, NO, PL, SE, SK, US)
23
theoretical section, there are at least three explanations behind the relationship between
media coverage of immigration and pro-immigration attitudes. According to the first one,
the self selection one, are individuals who determine the type of news published, by choosing
media outlets as a function of their ex-ante preferences. Media outlets therefore select news
consistent with the most widespread views, to increase sales. According to the other two
explanations, media has a causal impact on natives’ attitudes. First, because media helps
readers better understanding the economic and social consequences of immigration. Second,
because mass media can directly shape individuals’ opinions on the salience of the issues and
on the consequences of immigration.
Since the innovative contribution of this study consists in providing empirical evidence of
the effect of media, my third section will investigate more deeply only this last effect.
In the first section of the country level analysis I explore how the effect of individual
characteristics on immigration preferences varies according to some country level characteris-
tics. Through the use of interactions and country specific regressions I look, first, at the way
the marginal effects of education and income on natives’ attitudes towards immigration vary
with host country natives to immigrants relative skill composition. Second, I investigate if
average time spent in news reading affects the impact of education and income.
I introduce in my original individual-level specification the interaction of the previously
mentioned individual-level and country-level variables.
My econometric specification becomes the following:
Pr(proimmit = 1|xit) = Φ(αj + αt + β1edu skillgapit + β2income skillgapit + ... (2)
...+ β3edu skillgap nwsppolit + β4income skillgap nwsppolit + β5immnewsjt + β6ξit)
Where edu skillgapit, income skillgapit, edu skillgap nwsppolit and income skillgap nwsppolit
are interaction terms, immnewsjt indicates the average amount of news on immigration in
each country media outlet and ξit are socio demographic and cultural control variables. Fol-
lowing what I did in the previous section, as robustness check, I run another regression using
as dependent variable the dummy variable ”proimm2it”.
The following hypotheses are considered:
24

hypothesis 1 (Labour market channel) β1 > 0: the impact of education on immigration
attitudes should be positively related with natives to immigrant relative skill mix. The more
immigrants are unskilled with respect to natives, the less more educated (high skilled) natives
will feel labour market competition.
hypothesis 2 (Burden on welfare state channel) β2 is an empirical question: the un-
derlying assumption is that high skilled immigrants are positive net contributors to the welfare
system while low skilled immigrants are a welfare burden. If (β2 < 0), the first welfare state
scenario holds. Richer people will pay more taxes to sustain the extra fiscal burden brought
by low skilled immigrants and are therefore more hostile to immigration. If β2 > 0, the sec-
ond scenario prevails. Poor people will see their benefits reduced by the entry of low skilled
immigrants. The sign of the coefficient of the income skillgap benefitit term is expected to
amplify the effect of β2: in more generous welfare systems the burden brought by immigrants
is larger.
hypothesis 3 (Media effect) According to the theory that states that news reading makes
individuals more aware and conscious of the effects of immigration and of the type of immi-
grants attracted in their country, the effects of income and education should increase with the
time spent reading news. Therefore the coefficients of the interaction terms of ”newsppol”
with edu skillgapit and income skillgapit should be significant and go in the same direction
of, respectively, β1 and β2.
Moreover, I test whether the coefficient β5 is significant: this indicates that the relationship
between country media coverage of immigration and natives’ perceptions is significant. This
tests the statement that news are related to people opinions.
Then, I run separate regressions for each country to examine how much the country
specific marginal effects of different explanatory variables on preferences towards migration
vary across countries, according to their specific characteristics.
In the second section I study more specifically what underlies the cross country variation
in attitudes towards migration, directly using country level data, obtained taking country
25

and year averages (among natives) of the variables of interest in the ESS dataset. Moreover,
I integrate my dataset with country variables obtained from Eurostat, World bank and Dow
Jones Factiva databases.
The econometric specification is the following:
proimmjt = αj + αt + β1skillgapjt + β2(incomejt ∗ skillgapjt) + β3(benefitjt) + ... (3)
...+ β4immcontrnewsjt + β5ζjt + β6θjt + ηjt
where proimmjt is the average by country and year of the dummy variable ”proimmit” and
indicates the share of natives with positive attitudes towards immigration (proimmjt = 100
if all individuals have positive attitudes and proimmjt = 0 in the opposite case); αj are
country fixed effects; αt are year fixed effects; benefitjt is the per capita government social
expenditure; immcontrnewsjt is the average number of immigration news on controversial
issues14 by country specific media outlets (also the average amount of overall news on immi-
gration immnewsjt is used in alternative specifications); θjt are socio demographic control
variables and ζjt are cultural control variables. My analysis is based on the estimation of
simple OLS regressions.
The following hypotheses are verified:
hypothesis 4 (labour market channel) β1 > 0: (1) Pro-immigration attitudes are more
common in countries where the skill gap between natives and immigrants is higher. This
is because labour market competition is lower. (2) This effect in the regression that use
the dummy proimm2 as dependent variable is expected to be even stronger, because European
natives (on average high-skilled) are even less concerned about labour market competition from
immigrants coming from poorer countries outside Europe, that are expected to be particularly
unskilled.
hypothesis 5 (burden on welfare state channel,1) β2 = empirical question: the sign
of the β2 coefficient depends on which of the two welfare channels prevails. According to the
first one, the coefficient β2 is negative. According to the second welfare channel, the coefficient
is positive.
14Controversial news on immigration are defined as those news that mention immigration and concern
issues such as criminality, terrorism, asylum, illegal immigration, general safety etc
26

hypothesis 6 (burden on welfare state channel,2) β3 amplifies the effect of β2 : the
higher is the degree of redistributiveness and generosity of the system, the stronger will be the
effect of the welfare burden channel, especially when the dependent variable refers to poorer
immigrants (proimm2). However remember that the use of the variable ”benefit” as a proxy
of immigrants’ burden has to be taken with caution.
hypothesis 7 (Assimilation channel) β5 significant: cultural variables are key drivers of
attitudes toward migration. They facilitate (or impede) assimilation and inclusion of immi-
grants.
hypothesis 8 (Media effect, l) β4 < 0: the more controversial news associated to immi-
gration are available on national newspapers and televisions, the more individuals will have
negative attitudes towards immigration.
When analyzing the effects of media on individual perceptions, researchers generally en-
counter two main problems.
The first one is to disentangle the direction of the causality: as stated above there is
widespread evidence of the existence of a strong correlation between news coverage and
perceptions. However, it might be due either to the direct effect of media in shaping public’s
opinions, which is what explained in the theory of issue priming, or to the fact that individuals
likely choose to expose themselves to the media outlets whose ideological position is closer to
their prior believes, that is what claims the self selection theory. The direction of the causal
relation in the two theories is opposite.
The second big methodological problem is that of omitted variables: news coverage can be
correlated with people perceptions not because it exerts a direct effect on them but because
news are actually reporting unobservable factors that directly shape individuals’ attitudes
(issue salience, political and social context).
I tackle these problems by using instrumental variables and fixed effects. In particular,
the instruments I use are related to the availability of other newsworthy material. I am
asking whether perceptions of individuals are more likely to become positive if, for instance,
a natural disaster occurred that diverted attention of media from the immigration issue, by
crowding out (controversial) news.
27

There is no reason to believe that the presence of natural or technological disasters15
or of Olympic games is related to natives’ perceptions of immigrants. If it is so, the only
plausible explanation is that these events, by crowding out news, divert media attention on
immigration and, given the strong persuasive power of media, reduce negative attitudes.
I use as instruments three variables: (i) a variable that indicates the total number of
persons killed (or affected) during natural or technological disasters in the destination country
in the considered time span; (ii) a dummy that indicates whether a natural or technological
disaster has occurred in the considered country and year and (iii) the number of medals won
by the country during Olympics Games. More detailed description of the way these variables
are constructed is presented in the next section.
The use of instrumental variables helps me testing whether media are able to shape
individuals’ attitudes regardless of unobserved characteristics of the countries, of the type of
immigration and of ex-ante believes of the public, but just by publishing a news story itself.
The econometric specification of the first stage regression in this section is the following:
immcontrnewsjt = αj + αt + γ1f(disasterjt, totalolympsummerjt) + γ2ξjt + ... (4)
...+ γ3θjt + γ4ζjt + ωjt
Where immcontrnewsjt is a variable that considers the total number of immigration news
on controversial subjects in country j and year t. Again, I use country and year fixed effects
to clean the results from any possible bias given by structural differences (i.e. in the media
system, in the probability of occurrence of disasters); ξjt are country characteristics (skillgap,
benefits...); θjt stands for socio-demographic control variables and ζjt for cultural control
variables. My analysis is based on the estimation of Two Stage Least Square regressions. I
run the same regression using as endogenous variables both the amount of controversial news
on immigration and the average amount of news on immigration per media outlet.
The following hypotheses are evaluated:
hypothesis 9 (Media effect, 2) β4 < 0 and significant also in the second stage regres-
sion of the IV analysis: the effect previously found without instrumentalization holds true.
15terroristic attacks and wars are not included
28

In principle, this should indicate that media has a significant power of shaping individuals’
attitudes. Having free, pluralist and not biased media is of maximum importance.
hypothesis 10 (Media effect, crowding-out) γ1 < 0: the occurrence of a natural or
technological disaster or of the Olympic Games crowds out news on immigration.
The main weakness of this section is that the number of observation is very small. More-
over, data are observed with a 2-year frequency, which is too low to be able to clearly
distinguish how perceptions vary with the number and the type of news on a particular issue
and to fully capture the crowding-out effect.
To overcome these problems, the third section of the country level analysis uses as de-
pendent variable the percentage of people answering ”immigration” to the Eurobarometer
survey question ”What do you think are the two most important issues facing (OUR COUN-
TRY) at the moment?” . I name this variable ”immig”. This analysis is carried on for the
time span that goes from 2003 till 2008, with a six-month frequency, much higher than that
of the previous section. Notice that the dependent variable does not mean exactly the same
thing as ”proimm”. In this case the focus shifts more on the agenda setting role of mass
media, while in the previous ones was more on the nature of attitudes towards immigrants.
Still, the results of this third section are useful evidence, on one side, to confirm previous
results and, on the other side, to shed more light on the dynamics that drive the formation
of natives’ opinions.
Notice that the set of countries in section 2 and 3 is slightly different.
My empirical specification is of the following form:
immigjt = αj + αq + β1newsjt + ηjt (5)
Where αj are country fixed effects, αq are semester fixed effects, newsjt is the number for news
on immigration. Specifically, I consider three types of news: total news (immnews), contro-
versial news (immcontrnews) and positive16 news (immposnews). The following hypothesis
is verified:16positive news are defined as those news that do not mention immigrants because of their different ethnicity
but frame them as any other member of the society, in the context of everyday activities, such as culture,
29

hypothesis 11 (Media effect, 1) β1 > 0: (1, with ”immcontrnews” as independent vari-
able) the more media talks about immigration, the more people think immigration is an urgent
and serious issue to tackle.(2, putting as dependent variable ”immcontrnews”) The higher the
number of controversial news on immigration the more natives think immigration is an urgent
issue to address. (3, putting as dependent variable ”immposnews”) The higher the number of
positive news on immigrants, the less natives feel immigrants as dangerous for the society.
This hypothesis, if true, confirms results obtained in the project ”European Media Moni-
toring”: the presence of minority groups in total news stories, not necessarily related to ethnic
and controversial issues, such as cultural and free time activities, is an important indicator
of normalization and acceptance of minorities. Instead, the representation of immigrants
just in ethnic related and controversial news provides natives with a feeling of unsafety and
generates negative attitudes.
Again, to overcome the difficulty of identifying the direction of the causal effect and the
problems of omitted variables, I use the already described instrumental variables.
The econometric specification of the first stage regression has the form:
newsjt = αj + αq + γ1f(disasterjt, olympicmedalsjt) + ωjt (6)
Where αj are country fixed effects, αq are semester fixed effects and f is a continuous function.
The hypothesis related to this specification is:
hypothesis 12 (Media effect, crowding-out) γ1 < 0 : immigration is less likely to be
covered when there are many other interesting news available, as measured by the number of
Olympic medals won and by the occurrence of disasters and people affected by them.
Moreover, as in the previous section, the crucial hypothesis is the one that confirms
that the relationship between immigration news and people’s perceptions is significant and
consistent with the contents of news, even after the instrumentalization:
sports. This type of news is expected to improve natives’ attitudes towards migration. They represent the
maximum level of integration of immigrants
30

hypothesis 13 (Media effect, 2) β1 significant and with the same direction, even after IV
analysis: media outlets are able to shape individuals’ attitudes by themselves, not because they
exploit previously built believes.
For this analysis to work the underlying assumption is that disasters and medals won in
the Olympic games are uncorrelated with ηjt and ωjt conditional on the control variables.
4 Data and variables
4.1 European Social Survey
To empirically investigate the theoretical expectations previously stated, I use individual level
data taken from the four available rounds (2002, 2004, 2006, 2008) of the European Social
Survey 17 (ESS) combined with aggregate characteristics of the destination countries. The
ESS is a Europe-wide survey that was designed to make cross-cultural comparisons and it is
run in over 30 countries, with an average country sample between 1000 and 3000 individuals.
Since the ESS dataset has been explicitly designed for cross country comparisons of at-
titudes, it is well-suited for the scope of my analysis. The questions have been designed
in such a way to ensure they are understood in the same way across countries. Attention
has been put to ensure methodological quality of the surveys: questionnaires are translated
into all the languages, strict random probability sampling is imposed as well as a minimum
target response of 70%. The data are collected during an hour-long face-to-face interview
to individuals older than 15 years and the sample is designed to be representative of the
population.
I exclude from the analysis respondents born outside the country considered18. Table
2 gives a description of the countries included in the study for the three waves and of the
number of individuals interviewed in each of them.
My dependent variable is a dummy, named ”proimm”, based on the answer to two ques-
tions: ”to what extent do you think [country] should allow people of the same race or ethnic
17Data were taken from the website http://ess.nsd.uib.no/18Throughout the paper I define immigrants as individuals born outside the country considered.
31

group as most [country] people to come and live here?” and ”How about people of a different
race or ethnic group from most [country] people?”. Respondents answer in a 4-point scale (1
allow many, 2 allow some, 3 allow few, 4 allow none). The dummy ”proimm” is equal to 0
if natives answer ”allow a few” or ”allow none” to at least one of these two questions and
1 otherwise19 . Moreover I construct an alternative specification of my dependent variable,
named ”proimm2”, which is equal to 0 if natives answer ”allow few” or ”allow none” to the
question ”to what extent do you think [country] should allow people from poorer countries
outside Europe to come and live here ?” and 1 otherwise.
Table 3 displays the averages by country and year of the proimm variable.
ESS dataset also includes information on a number of individual characteristics: age, sex,
education, household income, main activity, political affiliation, average daily time spent in
newspaper reading during weekdays. Moreover individuals are asked some questions specifi-
cally related to immigration: whether they think that their country’s cultural life is enriched
by immigrants, whether immigrants make the country a worse or better place to live, and
whether immigration is good or bad for the economy. Finally, it contains questions on the
importance given to traditions and to the fact of doing and seeing new things in life and on
the trust generally given to other people. Table 4 and 5 display the main descriptive statistics
for the ESS variables used and describes how they are constructed.
4.2 Country characteristics
Data from ESS are combined with aggregate statistics on the destination countries. Data
on per capita gdp (PPP adjusted) are taken from the World bank development indicators
dataset data on per capita level of social government expenditure are taken from Eurostat.
Moreover, I take data from the LFS of Eurostat to compute the direct measure of the native
to immigrant relative skill mix (see table 6). These data are available for all the countries of
my analysis a part from DE, IL, RU, TK and UA.
19I followed Malchow-Møller et al (2006) in the construction of my dependent variable.
32
4.3 Eurobarometer surveys
As stated above, given that the aim of this study is to understand how structural coun-
try variables influence on average citizens’ perceptions, I need data with great variation at
country level. The use of averages (by country and years) computed from the ESS dataset,
leaves me with environ 80 observations with two year frequency. The sample size is small
and the frequency of the data low. These problems are tackled using (country level) data
from the Standard Eurobarometer report, published with higher frequency (twice a year)
by the European Commission. It consists of approximately 1000 face-to-face interviews per
country20 and it mainly asks questions about the major concerns of the European Union such
as trustiness in European institutions, opinions on future main difficulties or activities that
should be taken by the EU. The dependent variable used in the regressions corresponds to
the percentage of people answering ”immigration” to the question ”What do you think are
the two most important issues facing (OUR COUNTRY) at the moment?”. Figure 2 displays
the results.
Spain, UK and Denmark are the countries where the share of people answering immi-
gration is higher, followed by Italy, France, Austria, Belgium, Ireland, Luxembourg and the
Netherlands. In less developed countries, mainly from Central Eastern Europe (CEE), the
share of people concerned about immigration is the smallest. In the last three years concerns
over immigration were particularly high, especially in 2006 and 2007. In 2008 it is likely that
the major concern became the economic and labour markets situation, given the global crisis.
4.4 News Coverage
For all the analyses, the key independent variables are those related to media coverage and
the type of news on immigration.
To my knowledge, comprehensive datasets on news coverage and contents at European
level are not available. I therefore construct a dataset on the amount of news, divided by
broad topics, thought key word research on the Dow Jones Factiva database.
The Dow Jones Factiva database brings together more than 14000 leading news sources
20Except from Germany (2000), Luxembourg (600), UK (1300).
33

from more than 159 countries in 22 languages. It includes news from newspapers (i.e. Wall
Street Journal, New York Times, Les Echos, The Irish Times), newswires (i.e. Dow Jones,
Reuters, Agence France Press), magazines (i.e. Fortune, Focus, L’Express, The Economist)
and radio and television transcripts (i.e. BBC, ABC, Fox, CNN). The database has a search
engine that allows to make researches for given countries21 of seat of the publishers, dates
and subjects. The number of sources available by country is shown in table 7. For my
researches, I look for news with the words ”immigrant” and ”immigration” in English and
in the most spoken languages of each country, I select the time span of interest22 and the
countries included in the analysis. In this way I obtain around 300 observations for each
variable related to media coverage and news content. For a more detailed description of the
search criterion used, see appendix 1.
I construct three variables from this dataset, the first one gives an indication of overall
news coverage of immigrants and immigration: it is the number of news from all country
publishers available in the database which contain the words ”immigrant” and ”immigration”
both in English and in all most spoken languages of the country considered. Moreover, since
the number of sources contained in the Factiva database for each country is not always
the same and therefore data are not totally comparable across countries, I divide the total
number of news found in each country by the number of sources available in the Factiva
database for the country. Therefore, the variable used in the analysis represents the number
of immigration news reported on average per the media outlet (available) in the country and
time span considered. I call this variable ”immnews”.
The other two variables consider the content of the news on immigration. One is the
average number per media outlet of controversial news (on safety, crime, asylum), that con-
tain the words ”immigrant” or ”immigration” in English and in all country most spoken
languages23. I call this variable ”immcontrnews”. This should be related to the presence of
negative attitudes toward immigration. The other variable corresponds to the average num-
21look www.factiva.com/sources/results.asp for a detailed description of all the sources available, divided
by country22the years 2002, 2004, 2006 and 2008 for the analysis of section one and two and the 12 semesters from
2003 to 2008 for the analysis of section 3.23look appendix A for a detailed description of all languages used
34

ber per media outlet of news containing the words ”immigration” and ”immigrant” that treat
issues related to culture (arts, books, and movies), everyday life activities and sports. I name
this variable ”immposnews” and I assume it to be related with positive attitudes towards
immigration, because immigrants are presented as citizens similar to native citizens without
an ethnic-specific context. This corresponds to the ”total coverage” modality of representing
immigrants described by Wilson and Gutierrez (1985).
Figure 3 shows the average number of total news on immigration for the period 2003-2008,
with a six-month frequency. Notice that, given the way the database Factiva is constructed,
it is not possible to distinguish whether the news were on the front-page or in a small and
less visible part of the newspaper and also I decide not to distinguish articles on the basis of
the number of readers of the media outlets that contain them.
Figure 4 represents the average share of news on controversial (divided between asylum
related news and news on general public safety and criminality) and on cultural and free time
subjects containing the word ”immigrant” and ”immigration” over the total number of news
on immigration for the time span 2003-2008. Notice that the variables ”immcontrnews” and
”immposnews” represent the absolute number of news on this topics and not just the share.
The countries where the share of controversial news is lower are Luxembourg and Sweden,
which are also the countries where positive news are more frequent. In general, the correlation
between the share of positive and negative news on immigration is negative (-0.798) and
significant at 1% level. CEE (Central Eastern European) countries are those where the share
of controversial issues is on average higher, but this is mainly driven by the big share of
news on asylum. In Spain the share of news on criminality is very low because of strict
privacy laws on the rights of mentioning the nationality of people involved in the news
stories, in order to avoid discriminations and monopolizations. The countries where news on
criminality represent the highest share of total news on immigration are mainly countries of
new immigration, such as Italy, Greece and Ireland and countries with colonialist background,
such as France and UK.
Some observations can be made looking at simple correlations and descriptive statistics
on these variables. Figures 5 and 6 show the relationship between the ratio of the share
of foreigners among prisoners and the share of foreigners among total population in the
35

period considered24 and (1) the number of controversial news on immigration and (2) pro-
immigration attitudes .
It results that in both cases the correlation is not significant. The number of news stories
on crime related to immigrants is not significantly correlated with the share of foreigners in
prison and, indeed, the relation results to be negative. Simple correlations by themselves are
not able to capture the whole story, but still this is an important result.
4.5 Instrumental variables: Disasters
I take data on natural and technological disasters from the Emergency Disaster Database
(EM-DAT) as provided by the Center for Research on the Epidemiology of Disasters (CRED)
of the Universite Catholique de Louven (Brussels). In this database an event qualifies as dis-
aster if at least one of the following criteria is fulfilled: 10 or more people are reported
killed; 100 or more people are reported affected, injured and/or homeless; there has been a
declaration of state of emergency; or a call for international assistance. The data provided
in EM-DAT are based on official figures when available (UN, national or US governments,
International Federation of Red Cross and Red Crescent Societies, World Bank, Reinsurance
companies, AFP and others). The database covers over 15700 disasters from 1900 to nowa-
days: 63% are natural disasters and 37% are technological disasters. Only disasters occurred
in the time span of my interest (2002-2008), that caused more than 50 killed or more than
100 affected, injured or homeless individuals, are considered in this analysis. The majority
of disasters was caused by flood, earthquake, storm or extreme temperatures.
I measure the ”newsworthiness25” of a disaster for each country by using three variables.
Firstly, I consider whether a disaster occurred in the country and period considered and I
name this dummy variable ”disaster2”. Then, the second measure, named ”disastertot”, takes
into consideration the gravity of the disasters considered and consists in the total number of
24data are taken from International Centre for Prison Studies (Kings college London), Council of Europe
(ECRI). Notice that this ratio is only an approximation of the degree of criminality among immigrants because
it might be that the higher number of foreigners among prisoners is also the outcome of measurement errors,
biased behaviors of judges and police and heterogeneous law enforcement, moreover the political orientation
of the local government may affect the amount of resources devoted to crime deterrence.25I use the term newsworthy to mean the audience appeal of a news.
36

injured, affected, homeless, killed individuals in the disasters included in the first variable.
Table 8 reports the sum of this variable by country for the years considered (2002-2008).
Alternatively I use the variable ”disasterkill” which represents the number of total persons
killed during the selected disasters26.
4.6 Instrumental variables: Olympic Games
The other variable used as instrument for news coverage of immigration is the total number
of medals won by each country in the summer Olympics Games (Table 9 describes these
numbers). Olympics Games occurred twice in the time period considered: in Athens (2004)
and in Beijing (2008).
Figure 7 displays the yearly distribution of the number of news containing the word
”Olympic” published in all the countries considered from 2003 to 2008 and the monthly
distribution for the years 2004 and 2008. News on Olympic Games concentrate in the years
when the games take place and we observe a peak in the distribution corresponding to
August, when the games are played. I test whether in the second quarter of the years 2004
and 2008 news on Olympic Games partially crowded-out news on immigration, according to
the number of successes obtained by the country.
5 Results
5.1 Individual level analysis
I start by analyzing the basic pattern of perceptions towards immigration. Results are shown
in table 10. In line with previous studies, I find significant variation of attitudes across
countries: most of the country fixed effects are significant. Furthermore, I find that attitudes
also vary substantially with socioeconomic characteristics. Poor individuals and people with
26I also construct a measure of disasters, that takes into account that national media might report also
disasters that occurred in other countries, weighting it by the distance of the nation considered to the country
of occurrence of the disaster. However I exclude it from the instruments, because it does not add significance
to the first stage regressions. Further information on the variable and the way it was constructed are available
upon request.
37

lower level of education tend to be more negative towards immigration whereas people living
in urban areas, with higher level of education and income27 tend to be more positive. In
particular, the probability of having favorable attitudes towards the arrival of new immigrants
is about 28% higher if the person considered has reached the highest level of education
(second stage tertiary), keeping all the other characteristics at their mean value. Income has
a positive and significant at 1% level effect on the probability of having positive attitudes on
immigration.
When political affiliation to the right (”politicalaffilright”) is added, it results having a
significant effect on attitudes towards immigrants: people that feel themselves more oriented
to right wing political ideas are on average more negative towards immigration (the proba-
bility of being pro immigration decreases by 2.8% for every step in the 10-points subjective
scale of right wing political affiliation (0 means left, 10 right) of the interviewed individual).
Adding a variable (nwsppol) that represents the average time spent reading political and
current affairs news during weekdays, it results that the probability of being pro-immigration
increases with the average time spent reading news28. We can apply to the average time spent
reading these news, an indicator of the interest in current affairs and political events, the same
argument Hainmueller and Hiscox (2007) applied to education: more interested people are
more favorable towards immigrants because they have developed more cosmopolitan outlooks
and more tolerant attitudes. It can also be that more interested people are more aware of
the consequences of an increasing inflow of immigrants: they do not misjudge the effects of
foreigners coming into their country. Finally, an alternative explanation is that they are more
influenced by media opinion on the issue. These possibilities will be explored later.
Notice that the correlation between education level and time spent in reading news is
positive and significant but not particularly high (0.122). Among people declaring they do
not read political news at all during average weekdays, almost half (48.8%) has a level of
27Notice that the variable income used is the ratio of a categorical variable that ranges from 1 (if the
interviewed person states that its annual household net income is less that 1800 euro) to 12 (annual household
net income more than 120000 euro) and the number of members in the household.28More specifically, decomposing the variable nwsppol in dummy variables for each category, we see it
increases by around 12% if the individual reads news for more than 3 hours per day with respect to an
individual who declares not to read news at all.
38

education higher than secondary education; while among those answering they read more
than 3 hours of political news during average weekday, 34% has a level of education lower
or equal to secondary level. This indicates that the two groups of people are composed by
different individuals and that they do not totally overlap.
In the third specification cultural variables are added: natural trust for other people
(ppltrst) and the inverse of the importance given to traditions (imptrad) and to doing and
seeing always new things in life (impdiff). For a more detailed description of the way these
variables are constructed see table 4. The direction of the effects of cultural variables follows
what expected: individuals that generally trust other people and that give less importance
to customs and traditions are more positive toward immigrants. All the coefficients are
significant at 1% level, a part from that of the variable ”impdiff”. Moreover, the estimated
marginal effects of the socio-demographic variables are rather robust with respect to the
inclusion of cultural variables.
How much the explanatory power of the model with cultural variables is higher than that
of the model with only socio-demographic variables?
The pseudo R-squared of the regressions increases with the introduction of these variables.
In particular, the difference between the pseudo R squared of the model in specification
(3)and a model with only economic variables29 (and fixed effects) is (0.1235-0.0857= 0.0378).
It represents the fraction of total variance explained by noneconomic factors. Repeating the
same exercise, but including first only cultural variables (and fixed effects) and next adding
economic regressors, the pseudo R squared increases by 0.0172. Therefore, even recognizing
that economic factors are important determinants, in terms of variance explained, this study
finds that noneconomic determinants are more powerful in explaining the variance. This is
in line with other results in the literature.
As robustness checks I run the same regressions, using other dependent variables. In
particular, in table 11 are displayed the results using ”proimm2” as dependent variable: the
coefficients are in line with the results obtained in table 10. However, the coefficient of the
variable income in the case of attitudes towards poor immigrants coming from outside Europe
29economic variables are considered education, income, unemployed status and news reading; cultural
variables are considered age, rural, male, political affiliation to the right, ppltrst, imptrad, impdiff
39

is still positive but lower and less significant: rich individuals tend to be less positive towards
poor immigrants from outside Europe than towards immigrants in general. The explanation
being that they are more afraid that fiscal burden will be higher after the entry of poor
immigrants, who are supposed to be negative net contributors.
In table 12 three other dependent variables are used: the first one, called ”multicultural-
ism”, is the answer to the question ”would you say that [country]’s cultural life is generally
undermined or enriched by people coming to live here from other countries? answer in a
scale from 0 (cultural life undermined) to 10 (cultural life enriched)”; the second one, named
”immgoodeco”, is the answer to the question ”Would you say it is generally bad or good for
[country]’s economy that people come to live here from other countries?” answer in a scale
from 0 (bad for economy) to 10 (good for economy)” and, finally, the third one, named ”im-
mgoodsoc”, is the answer to the question ”Is [country] made a worse or a better place to live
by people coming to live here from other countries?” answer in a scale from 0 (worse place
to live) to 10 (better place to live)”. These variables give an indication of the openness of
the individuals to new cultures and to different people and of the perceived importance of
the economic dimension in attitudes toward migration. The direction of the coefficients in
the regressions that use these three dependent variables is similar to what obtained in the
previous cases30.
5.2 Country level analysis
5.2.1 Section 1
As explained before, with the aim of analyzing how the effect of individual level characteristics
changes according to country level variables, I introduce interaction terms:
• the interaction between the level of education and the relative skill mix of natives to
immigrants, using the direct measure taken form data coming from the European LFS
from Eurostat (named edu skillgap). This should capture labour market competition
effect (hypothesis 1).
30Note that I run simple OLS models, not probit analysis for sake of simplicity. Therefore coefficients are
not totally comparable.
40

• The interaction between income and the relative skill mix of natives to immigrants
(named income skillgap) and the interaction of this last term with the per capita gov-
ernment social expenditure (named income skillgap benefit). This should capture the
welfare burden effect (hypothesis 2).
• The interaction between the average amounts of time spent reading political or current
affairs news with the two interaction terms described above (named edu skillgap and
income skillgap). This should capture the media effect (hypothesis 3), in the attempt
to explain whether media influences people perceptions because they increase natives’
awareness on the effects of immigration.
Results are shown in table 13. The effect of the socio-demographic and cultural variables
at country level is consistent with what found in the individual level analysis. The coefficient
of the interaction edu skillgap is positive: if the skill gap between natives and immigrants
is deep, then on average natives feel less competition in the labour market and are more
favorable towards immigration. If the natives to immigrants relative skill mix increases
by 1% then the positive effect of an extra level of education on pro-immigration attitudes
increases by 3.8%.
Concerning the welfare state effect, none of the coefficients is significant at 10% level.
Possible explanations are the inaccuracy of the variable representing income, which is a
subjective estimate and derives from a categorical variable, see note 28, or the fact that
the effect is different across countries (the prevailing welfare channel may be different across
different people in different countries). A country specific analysis, which enables income
coefficients to vary across countries, is useful and is performed in the last part of this section.
Notice that as far as concerns the variable ”proimm2” the effect of income is more significant:
income considerations are more relevant when considering poorer immigrants from countries
outside Europe.
Finally, the effect of time spent reading news is positive and significant. However, the
interactions of it with the two interaction terms that represent the labour market competition
and the burden on welfare state channels are not significant at 10% level. This rejects
41

hypothesis 8 and suggests that news reading does not act significantly31 as a mechanism that
makes individuals more aware of economic consequences of immigration. Notice, instead,
that when including total news on immigration by media outlet in the country, its effect on
pro-immigration sentiments is significant (and negative). This tells that media coverage is
significantly correlated with attitudes.
In the models above I constrain the coefficient to be equal for all countries. However
this assumption is likely to be wrong. I now run separate country-specific regressions, taking
advantage of the panel data structure of the ESS survey.
My country-specific regressions reveal a great deal of cross country variation.
The analysis of country specific effects of skills (education) and income on perceptions
on immigration has already been carried on in the previous literature (Mayda, 2006; Mayda
Facchini, 2007): Mayda (2006) finds that the relationship between per capita GDP (PPP-
adjusted) of the host economy and the size of the marginal effect of education on immigration
preferences is positive and significant; Mayda and Facchini (2007) obtain the opposite rela-
tionship (negative and significant at 5% level) between per capita gdp (PPP-adjusted) of the
destination country and marginal effect of income. When making the same analysis with my
data, I obtain results pretty much consistent with these findings32. Looking at the direct
measure of native to immigrants relative skill mix, these results are confirmed33.
The result for the welfare channel appears now more significant than in the previous
section. Giving the possibility to all coefficients to vary across countries, the average marginal
effect of income is negatively related to the skill gap between natives and immigrants. The
first welfare channel prevails. Still, caution must be used in judging these results, because
31Notice that the direction of the coefficient is, most of the times, what expected, but the coefficients are
significant only in one out of four specifications.32The correlation between country specific marginal effect of education and per capita gdp is positive
(+0.19) but not significant at 10% level and that of the marginal effect of income and (log) per capita gdp
is negative (-0.39) and significant at 5% level.33The correlation of the skill gap between natives and immigrants with the marginal effect of education is
positive (0.66) and significant at 1% level and the correlation between income and skillgap is negative (-0.31)
but significant only at 15% level.
42

the correlations of this section are based on a very small number of observations.
The innovative contribution of this section, however, is to focus on how country spe-
cific effects on attitudes towards migration of news reading during average weekdays vary
according to the type and coverage of news on immigration.
Figure 8 presents the country specific marginal effect34 of hours of news reading on pro-
immigration preferences (x axis) as a function of total number of controversial news on
immigration (y axis).
The correlation of figure 8 is an indicator of the power of media in modifying the effect
of newspaper reading on natives’ pro-immigration sentiments. If, controlling for different
levels of education and income, the correlation results significant and negative (in the case of
controversial news) then it tells that controversial news on immigration are associated with
negative effect of news reading on immigration attitudes. The issues of omitted variables and
of the direction of the causality will be discussed later.
The correlation results to be negative. However, the degree of significance is not always
completely satisfactory (-0.48, significant at 1% level and, excluding the outliers Spain and
Luxembourg, -0.24, not significant at 10% level). This results is valid even when using total
news on immigration instead of just controversial news (-0.49, significant at 1% level): the
coverage of the issue per se tends to generate negative attitudes.
Figure 9 is similarly constructed but uses proimm2 as dependent variable of the regres-
sions. The correlation is again negative35.
5.2.2 Section 2
In the second part of the country-level analysis, I analyze the relevance of the three channels
previously identified in the theoretical section and of the media effect, exploiting cross-country
34Marginal effects are obtained by running country specific probit models: the beta represents the marginal
effect of the variable ”nwsppol”, holding the other regressors at their mean value. The regressors of each
probit model, as in the previous analysis, are: age, sex, maximum education level, average amount of hours
spent in news reading during average weekdays, income, whether living in rural or urban context, degree
of subjective right-wing political affiliation and a dummy variable indicating unemployed status. I use year
fixed effects and design weights as recommended in the ESS website.35-0.30 (with significance level of 0.17) and, discarding the outliers -0.36 (with a significance level of 0.12)
43

and time-series variation of data from the ESS. I compute averages by years and countries of
the variables of the ESS. ”Proimm” and ”proimm2” are now not dummy variables anymore:
they range from 100 (if all natives interviewed in the ESS answer agree in allowing more im-
migrants coming in their country) to 0 (if all natives interviewed disagree). I run simple OLS
regressions using country averages of ESS variables for the four ESS panels available and I
add other regressors having only cross-country and time-series variation, such as the natives
to immigrants relative skill mix, the annual total amount of news on immigration (”imm-
news”) and of controversial news on immigration (”immcontrnews”). Descriptive statistics
of the variables used are presented in table 14 and 15.
More specifically, the econometric specification I use is given by equation (3) and results
refer to hypothesis 4, 5, 6, 7 and 8.
Data, displayed in table 16 and 17, confirm hypothesis 4: more educated (skilled) natives
are more positive to immigration the more their country attracts low skilled immigrants.
In both the regressions made using proimm and proimm2 as dependent variables, the effect
of natives to immigrants relative skill mix on pro-immigration attitudes is significant and
positive. This suggests labour market competition is a key determinant of natives’ attitudes
towards immigration.
Let’s now consider the second channel of impact on natives’ preferences: the welfare state
channel. In this case the assumption is that people preferences on immigration are a function
of income and skill mix of immigrants. I refer to hypotheses 5 and 6.
Looking at the results, I see that the Mayda and Facchini (2007) first welfare state scenario
is again confirmed: the coefficient of (incomejt ∗ skillgapjt) in both the specification with
proimm and proimm2 as dependent variable is negative and significant. The higher is the
average level of income in a country, the more natives will be unfavorable towards unskilled
immigration: they perceive those immigrants as a welfare burden, which results in higher
fiscal pressure. Again, the effect is stronger when referring to poorer immigrants from outside
Europe (proimm2 dummy, table 17).
The coefficient of the variable ”benefits”, that is a indicator of the generosity of the welfare
state, is negative (this confirms hypothesis 6), but is not significant at 10% level36.
36Notice moreover that the variable ”benefit” is not available for 2008, therefore the number of observation
44
Considering the third channel, the assimilation one, I look at the coefficients of the coun-
try averages of cultural variables. As in the previous analyses the coefficients are generally
significant. Comparing the results of the two specifications (one with proimm and one with
proimm2 as dependent variables), cultural variables have a slightly higher impact on atti-
tudes towards immigrants coming from poorer countries outside the European Union (second
specification). Hypothesis 7 is verified.
As far as concerns media coverage of controversial issues on immigration, data show that
the relationship, as expected, is negative and significant at 1% level for the dependent vari-
able proimm and negative but not significant for the dependent variable proimm2. One extra
controversial news on immigration per media outlet decreases the share of people favorable
towards immigrants by around 0.06 percentage points. Notice that the relationship between
media news on immigration and natives’ attitudes towards migration is negative and sig-
nificant also when considering just total news on immigration (and not only controversial
news)37.
The low level of significance of media effect with respect to natives’ attitudes towards
poorer immigrants from outside Europe is of delicate interpretation. An explanation is
that natives’ attitudes, which usually are more negative towards these immigrants, are more
embedded and do not change easily according to the amount of news on immigration. Other
factors tend to matter more, such as cultural and ideological factors and income related
explanations.
Finally, in specifications 7 and 8, I combine all possible explanations. The signs of the
coefficients, as well as the level of significance do not vary. The explanatory power of the
model, instead, increases.
The negative effect of media coverage of the immigration issue may be biased: as stated
in the theoretical section, there could be problems of omitted variables as well as problems
for this specification is smaller.37I also controlled for the presence of outliers. I run the same regressions excluding observations with values
of immnews higher than 150 and values of immcontrnews higher than 100, it results that the coefficients of
immnews and immcontrnews are still negative and significant but only at 10% level.
45

in identifying the direction of the causal relation. Are individuals more negative towards
immigration because they are surrounded by controversial news on this issue or is media
broadcasting much controversial news on immigration because it wants to sell more, by
following negative priors of natives? Both these arguments are plausible explanations of the
negative correlation between media news and pro-immigration attitudes. To understand the
direction of the causality deeper analysis is required.
To answer these questions I use instrumental variables for ”immcontrnews” and ”imm-
news”38.
In conclusion, the econometric specification of the first stage regression is the following:
newsjt = αj + αt + δ1disasterkilljt + δ2disaster2jt + δ3totalolympsummerjt + ... (7)
...+ δ4skillgapjt + +δ5(incomejt ∗ skillgapjt) + δ6ξjt + ωjt
Where ξjt are cultural and socio-demographic control variables; αj are country fixed effects
and αt are year fixed effects. I use both total news and controversial news on immigration.
Results are shown in table 18, the crowding-out effect of news does not emerge clearly.
The F statistics of the instruments are low (2.54 for the regression with ”immnews” as
endogenous variable and 2.67 for the one with ”immcontrnews” as endogenous). Moreover
the direction of the coefficient is not always what expected: the crowding-out hypothesis is
not always fulfilled in this case. The reason of the weakness of the instruments selected in this
specification can be that a time span of two years is too big to fully capture the crowding-out
effect of disasters on immigration news. If a disaster occurred it would crowd-out news in the
following weeks but in a time span of two years the crowding-out effect does not last enough
to have a clear and significant impact on total news on immigration.
I will check the validity of this explanation and of the instruments selected later, when
using data with higher frequency.
Still, the effect of immigration news on natives’ attitudes, as displayed in the second
38As previously explained, I use three instruments: (i) the total number of individuals killed or affected
in the selected disasters occurred in the destination country (”disastertot”); (ii) the dummy variable that
indicates whether there has been a disaster in the country in the period considered (”disaster2”) and (iii)
the total number of medals won during Olympics Games (totalolympsummer).
46
stage regression, is significant at 1% level and negative in both specifications. The size of the
coefficient is a little smaller, since it has been cleaned from the other effects39.
5.2.3 Section 3
In the previous sections I explored the different channels that theoretically influence natives’
attitudes, mainly using averages across countries and years of the ESS variables. However I
encounter two main problems with the data: the small number of observations and the low
frequency. The low frequency of data is a problem particularly in the analysis of media effect
on natives’ opinions towards immigration, which is the main focus of this study. To analyze
how perceptions on immigration vary according to the number of news, a two year frequency
is too low: news coverage changes very frequently and capturing the relationship using only
four points in time is difficult.
In this third section I will just focus on the relationship between perceptions and news
coverage, that has been much less empirically explored and it is the main focus of this study.
To overcome the previous problems I use data from the standard Eurobarometer survey
that is carried on with a six-month frequency and I use as dependent variable in my analysis
the share of people answering that immigration is one of the two most important issues faced
by the country at that moment. Descriptive statistics of the variables used are displayed in
tables 19 and 20.
Notice that now I am not analyzing anymore the type of natives’ attitudes towards immi-
gration, I am instead analyzing perceptions on the urgency of the issue, focusing more on the
agenda setting role of media. People might answer ”immigration” to the above mentioned
question regardless of their positive or negative preferences toward immigrants, just because
they feel that the issue needs to be urgently solved and addressed by the Government.
Using this variable as dependent variable I am able to relate citizens’ perceptions on
immigration with data on immigration-related news with a higher frequency.
First, I briefly analyze how the number of news on immigration varies over time. Figure
39This result is cleaned from the other possible explanations of the correlation between news contents and
natives’ attitudes, such as the one stating that media outlets will publish news consistent with people prior
believes in order to increase their audience.
47
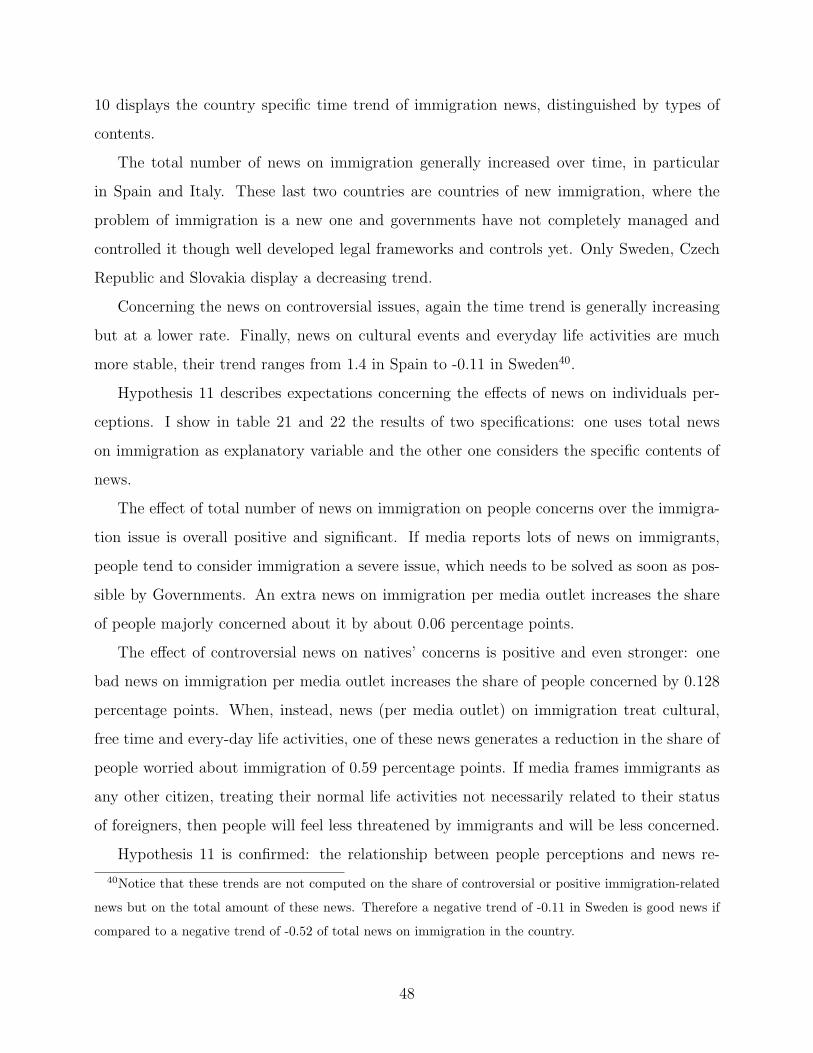
10 displays the country specific time trend of immigration news, distinguished by types of
contents.
The total number of news on immigration generally increased over time, in particular
in Spain and Italy. These last two countries are countries of new immigration, where the
problem of immigration is a new one and governments have not completely managed and
controlled it though well developed legal frameworks and controls yet. Only Sweden, Czech
Republic and Slovakia display a decreasing trend.
Concerning the news on controversial issues, again the time trend is generally increasing
but at a lower rate. Finally, news on cultural events and everyday life activities are much
more stable, their trend ranges from 1.4 in Spain to -0.11 in Sweden40.
Hypothesis 11 describes expectations concerning the effects of news on individuals per-
ceptions. I show in table 21 and 22 the results of two specifications: one uses total news
on immigration as explanatory variable and the other one considers the specific contents of
news.
The effect of total number of news on immigration on people concerns over the immigra-
tion issue is overall positive and significant. If media reports lots of news on immigrants,
people tend to consider immigration a severe issue, which needs to be solved as soon as pos-
sible by Governments. An extra news on immigration per media outlet increases the share
of people majorly concerned about it by about 0.06 percentage points.
The effect of controversial news on natives’ concerns is positive and even stronger: one
bad news on immigration per media outlet increases the share of people concerned by 0.128
percentage points. When, instead, news (per media outlet) on immigration treat cultural,
free time and every-day life activities, one of these news generates a reduction in the share of
people worried about immigration of 0.59 percentage points. If media frames immigrants as
any other citizen, treating their normal life activities not necessarily related to their status
of foreigners, then people will feel less threatened by immigrants and will be less concerned.
Hypothesis 11 is confirmed: the relationship between people perceptions and news re-
40Notice that these trends are not computed on the share of controversial or positive immigration-related
news but on the total amount of these news. Therefore a negative trend of -0.11 in Sweden is good news if
compared to a negative trend of -0.52 of total news on immigration in the country.
48

ported by media is strong and significant and goes in the expected sense41. However, the
exact direction of the causality is not obvious until I run a instrumental variable analysis.
Instruments must be correlated with the number of news on immigration but not directly
with the error term of the original equation. I focus on events that attract media attention
and crowd-out news on immigration. As in the previous part, the occurrence of natural
or technological disasters as well as their seriousness, and the number of successes during
Olympics Games are likely to satisfy the above requirements.
To deepen my analysis, before running the instrumental variable specifications, I run
separate regressions to examine how the presence of disasters (according to their severity) and
Olympics games (according to the number of successes obtained by the considered country)
affect directly (i) the number of media news on immigration and (ii) natives’ concerns on
immigration. All regressions include country and semester fixed effects.
The econometric specification for the analysis of the direct effect of disasters and Olympic
Games on immigration news and attitudes is the following:
newsjt = αj + αt + β1olympicmedalsjt + β2disaster2jt + β4disasterkilljt + ηjt (8)
Where αj are country fixed effects; αt are semester fixed effects. disaster2jt is a dummy
variable indicating whether a disaster has occurred in the country during the semester con-
sidered or not and disasterkilljt is the number of people killed during the disaster. For
attitudes towards migration, the specification is the same, but with the variable ”immig” as
dependent variable.
Results are shown in tables 23 and 24. The occurrence of a disaster and the number of
people killed during disasters significantly reduce the amount of news on immigration. In
particular, on average, the occurrence of a disaster reduces the average number of news on
immigration per media outlet in the country and the semester considered by 6. Moreover,
the more medals a country wins during summer Olympic Games, the smaller the number of
news on immigration.
41Again, I controlled for the presence of outliers. I run the same regressions excluding observations with
values of immnews higher than 150 and values of immcontrnews higher than 100, it results that the coefficients
of immnews and immcontrnews are still positive and significant at 1% level
49
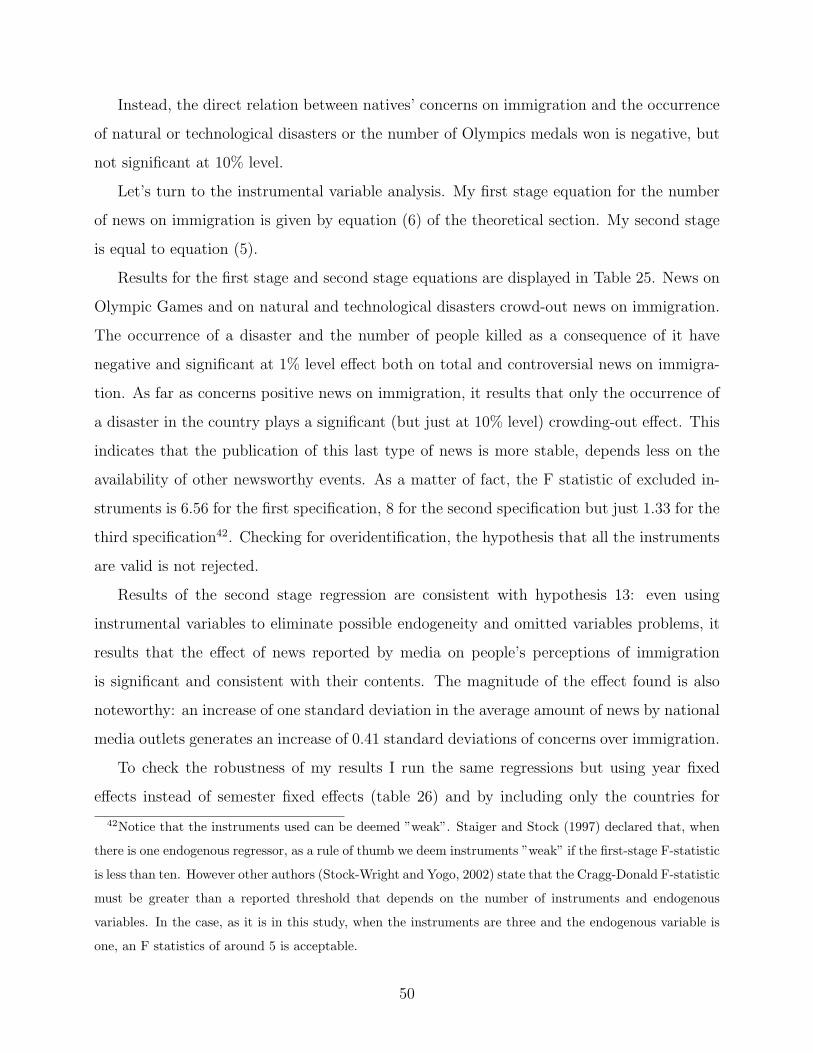
Instead, the direct relation between natives’ concerns on immigration and the occurrence
of natural or technological disasters or the number of Olympics medals won is negative, but
not significant at 10% level.
Let’s turn to the instrumental variable analysis. My first stage equation for the number
of news on immigration is given by equation (6) of the theoretical section. My second stage
is equal to equation (5).
Results for the first stage and second stage equations are displayed in Table 25. News on
Olympic Games and on natural and technological disasters crowd-out news on immigration.
The occurrence of a disaster and the number of people killed as a consequence of it have
negative and significant at 1% level effect both on total and controversial news on immigra-
tion. As far as concerns positive news on immigration, it results that only the occurrence of
a disaster in the country plays a significant (but just at 10% level) crowding-out effect. This
indicates that the publication of this last type of news is more stable, depends less on the
availability of other newsworthy events. As a matter of fact, the F statistic of excluded in-
struments is 6.56 for the first specification, 8 for the second specification but just 1.33 for the
third specification42. Checking for overidentification, the hypothesis that all the instruments
are valid is not rejected.
Results of the second stage regression are consistent with hypothesis 13: even using
instrumental variables to eliminate possible endogeneity and omitted variables problems, it
results that the effect of news reported by media on people’s perceptions of immigration
is significant and consistent with their contents. The magnitude of the effect found is also
noteworthy: an increase of one standard deviation in the average amount of news by national
media outlets generates an increase of 0.41 standard deviations of concerns over immigration.
To check the robustness of my results I run the same regressions but using year fixed
effects instead of semester fixed effects (table 26) and by including only the countries for
42Notice that the instruments used can be deemed ”weak”. Staiger and Stock (1997) declared that, when
there is one endogenous regressor, as a rule of thumb we deem instruments ”weak” if the first-stage F-statistic
is less than ten. However other authors (Stock-Wright and Yogo, 2002) state that the Cragg-Donald F-statistic
must be greater than a reported threshold that depends on the number of instruments and endogenous
variables. In the case, as it is in this study, when the instruments are three and the endogenous variable is
one, an F statistics of around 5 is acceptable.
50

which the Factiva database has more than 20 sources available (see table 7)43. Results are
consistent with what found in the regressions of table 25. In conclusion, hypotheses 12 and
13 are verified: media outlets are able to directly shape opinions of their audience.
The significant effect found in this regression is a signal of the persuasive power of me-
dia. During periods with many other newsworthy material media diverts attention from the
immigration issue and individuals are less worried about immigration.
On the light of the results obtained, we see how a free and rich of different viewpoints
press is crucial for every country, because it limits risks of manipulation of news and public
opinion.
6 Concluding remarks
Immigration has become a central theme in political discussion. Understanding what shapes
individuals’ attitudes is of crucial importance, since voters’ opinions are key input in policy
outcomes. This study contributes to a better understanding of what shapes natives’ attitudes
towards migration, exploring both economic and not economic factors.
My first set of results is based on individual level analysis and indicates that both economic
and non economic factors are important in explaining immigration attitudes. Respondents
are more likely to be favorable towards immigration if they are more educated, less politically
conservative, richer and if they live in urban contexts. Moreover, cultural variables such as
the level of importance given to traditions and the natural trust towards other people are
important determinants. These findings are consistent with the existing literature and with
the group conflict theory, according to which negative perceptions towards immigrants are
given by competition for scarce goods (affordable housing, well paid jobs, welfare benefits).
Successively, I conduct country level analyses and I give evidence of a high degree of
country heterogeneity in natives’ perceptions.
In particular, three datasets have been used. The first simply includes country level
characteristics in the individual-based ESS dataset and allows the study of the interactions
43These results are available upon request. In this case it appears that the impact of news on immigration
is still significant, but at lower level (10%).
51

of individual and country variables. The second one directly uses countries as units of analysis
and includes the averages by countries and years of the ESS variables as well as other country
variables taken from different sources (such as Eurostat or Dow Jones Factiva database). The
third is based on data with a six-month frequency from 2003 to 2008 from the Eurobarometer
Standard survey and on other country level datasets.
I consider four main explanations of attitudes towards migration.
In a wide range of countries attitudes appear to be related to labour market concerns. In
particular, natives fear labour market competition from immigrants with similar skill level.
Pro-immigration attitudes are more likely to appear in countries where the gap in the skill
composition between natives and immigrants is high. This result is robust to various changes
in empirical specifications and dependent variables.
Concerns on the extra welfare burden brought by immigrants are also important deter-
minants of natives’ attitudes. High income individuals are usually more favorable to immi-
gration. However, my results show that this effect is reduced the higher is the number of low
skilled immigrants attracted in the country (the deeper is the skill gap between natives and
immigrants). Under the assumption that low skilled immigrants represent a welfare burden
for the society, the positive effect of high income is offset by the fear of bearing the extra
fiscal burden brought by unskilled immigrants.
Noneconomic variables are found to have significant correlation with immigration prefer-
ences: ideology and culture are important elements to be considered when trying to select
policies to improve immigrants’ integration. Still, the view in which only noneconomic is-
sues explain sentiments towards migration is rejected, because their introduction does not
alter significantly the magnitude and the explanatory power of variables linked to economic
explanations.
Finally, the main focus of this study, especially in its last part, is media impact on natives’
attitudes. I explore three possible explanations of the observed relationship between media
coverage of the immigration issue and pro-immigration attitudes. According to the first
one, the self selection one, individuals choose specific media as a function of their ex-ante
preferences. Media outlets therefore select news consistent with the most widespread views,
to increase profits. Media does not directly affect readers’ opinions. What actually drives the
52
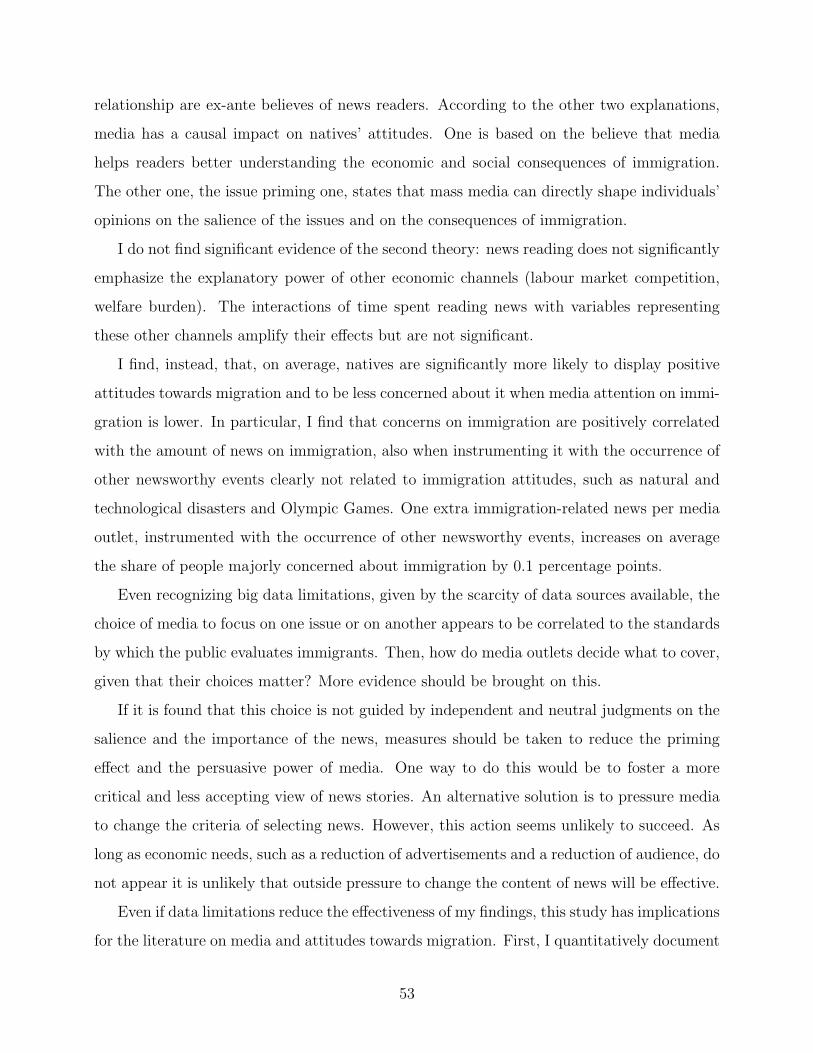
relationship are ex-ante believes of news readers. According to the other two explanations,
media has a causal impact on natives’ attitudes. One is based on the believe that media
helps readers better understanding the economic and social consequences of immigration.
The other one, the issue priming one, states that mass media can directly shape individuals’
opinions on the salience of the issues and on the consequences of immigration.
I do not find significant evidence of the second theory: news reading does not significantly
emphasize the explanatory power of other economic channels (labour market competition,
welfare burden). The interactions of time spent reading news with variables representing
these other channels amplify their effects but are not significant.
I find, instead, that, on average, natives are significantly more likely to display positive
attitudes towards migration and to be less concerned about it when media attention on immi-
gration is lower. In particular, I find that concerns on immigration are positively correlated
with the amount of news on immigration, also when instrumenting it with the occurrence of
other newsworthy events clearly not related to immigration attitudes, such as natural and
technological disasters and Olympic Games. One extra immigration-related news per media
outlet, instrumented with the occurrence of other newsworthy events, increases on average
the share of people majorly concerned about immigration by 0.1 percentage points.
Even recognizing big data limitations, given by the scarcity of data sources available, the
choice of media to focus on one issue or on another appears to be correlated to the standards
by which the public evaluates immigrants. Then, how do media outlets decide what to cover,
given that their choices matter? More evidence should be brought on this.
If it is found that this choice is not guided by independent and neutral judgments on the
salience and the importance of the news, measures should be taken to reduce the priming
effect and the persuasive power of media. One way to do this would be to foster a more
critical and less accepting view of news stories. An alternative solution is to pressure media
to change the criteria of selecting news. However, this action seems unlikely to succeed. As
long as economic needs, such as a reduction of advertisements and a reduction of audience, do
not appear it is unlikely that outside pressure to change the content of news will be effective.
Even if data limitations reduce the effectiveness of my findings, this study has implications
for the literature on media and attitudes towards migration. First, I quantitatively document
53

the relationship between attitudes and publication of news stories in Europe and, second, I
try to disentangle two issues: the hypothesis according to which media has a causal impact
on individuals’ perceptions and the alternative one, according to which individuals choose
specific media outlets as a function of their prior believes. Which one of the two prevails is
still an open issue. My results are consistent with an effect of media on natives’opinions.
54

A Appendix 1: Procedure for identifying news stories
on immigration
This appendix describes the procedure used to identify news stories on immigration and to
divide them into categories related to their contents.
A story is considered to treat the immigration issue if it contains the words ”immigration”
or ”immigrant” in English or in the other most spoken languages of the destination country.
Table 27 presents the words used for the research.
Moreover I used the division by article subjects already built in in the Dow Jones Factiva
database: articles are divided in several categories according to their content.
I used the following criteria:
• articles are considered on controversial issues if Dow Jones Factiva inserted them in the
categories: crimes, safety, terrorism, security forces, civil disorders, racism and asylum.
• articles are considered on cultural and free time if they were inserted in the following
categories: religion, arts, books, school, social affairs, sports, travels, environment, and
society.
55

References
[1] Bauer, T., Lofstrom, M. and Zimmermann, K. F. (2000), ”Immigration policy, assim-
ilation of immigrants and natives’ sentiments towards immigrants: evidence from 12
OECD-countries”, Swedish Economic Policy Review, 7, pp. 11-53.
[2] Beutin, R., Canoy, M., Horvath, A., Hubert, A., Lerais, F., Smith, P. and Sochacki,
M. (2006), ”Migration and public perception”, Bureau of European Policy Advisers
(BEPA).
[3] Bianchi, M., Pinotti , P. and Buonanno, P.(2008), ”Immigration and crime: an empir-
ical analysis”, Economic working paper 698, Economic Research Department Bank of
Italy.
[4] Boeri, T. and Bruecker, H. (2005) ”Why are Europeans so tough on Migrants?”, Eco-
nomic Policy, 44, pp. 629-704.
[5] Boeri T. (2009), ”Immigration to the land of redistribution”, IZA Discussion Paper
No.4273.
[6] Card D., Dustmann, C. and Preston, I. (2005), ”Immigration, economy and culture:
analysis of attitudinal responses”. In: EASR Conference on Survey Research, 18 - 22
July 2005, Barcelona, Spain.
[7] Ceobanu, A. M. and Escandell, X. (2009), ”When Contact with Immigrants Mat-
ters: Threat, Interethnic Attitudes and Foreigner Exclusionism, Spain’s Comunidades
Autonomas”, Ethnic and Racial Studies, 32(1), pp. 4-69.
[8] Citrin, J., Green, D., Muste, C. and Wong, C. (1997), ”Public Opinion toward Immi-
gration Reform: The Role of Economic Motivation”, The Journal of Politics, 59(3),
pp. 858-881.
[9] Davidov, E., Meuleman, B., Billiet, J. and Schmidt,P. (2008) ”Values and Support for
Immigration: A Cross-Country Comparison”, European Sociological Review, 24(5), pp.
583-599
56

[10] DellaVigna, S. and Kaplan, E. (2007) ”The Fox News Effect: Media Bias and Voting”,
Quarterly Journal of Economics, 122, pp. 1187-1234.
[11] Dustmann, C. and Preston, I. (2004) ”Racial and Economic Factors in Attitudes to-
wards Immigration”, CReAM discussion paper No. 1/04
[12] ESS Round 1: European Social Survey Round 1 Data (2002). Data file edition 6.1.
Norwegian Social Science Data Services, Norway, Data Archive and distributor of ESS
data.
[13] ESS Round 2: European Social Survey Round 2 Data (2004). Data file edition 3.1.
Norwegian Social Science Data Services, Norway, Data Archive and distributor of ESS
data.
[14] ESS Round 3: European Social Survey Round 3 Data (2006). Data file edition 3.2.
Norwegian Social Science Data Services, Norway, Data Archive and distributor of ESS
data.
[15] ESS Round 4: European Social Survey Round 4 Data (2008). Data file edition 1.0.
Norwegian Social Science Data Services, Norway, Data Archive and distributor of ESS
data.
[16] Facchini, G. and Mayda,A. M. (2009) ”Does the Welfare State Affect Individual Atti-
tudes toward Immigrants? Evidence across Countries”, The Review of Economics and
Statistics, MIT Press, 91(2), pp. 295-314.
[17] Gentzkow, M. (2006), ”Television and Voter Turnout”, The Quarterly Journal of Eco-
nomics, MIT Press, 121(3), pp. 931-972.
[18] Hainmueller, J. and Hiscox, M. J. (2007) ”Educated preferences: explaining attitudes
toward immigration in Europe”, International Organization, 61, pp. 399-442.
[19] Lott, J. R. and Jr. and Hassett, K. A. [2004], ”Is Newspaper Coverage of Economic
Events Politically Biased?”, Working Paper, American Enterprise Institute, Washing-
ton, DC.
57

[20] Malchow-Møller, N., Munch, J.R., Schroll, S. and Skaksen, J.R. (2006), ”Attitudes
Towards Immigration: Does Economic Self-Interest Matter?”, Working Papers 11-2006,
Copenhagen Business School, Department of Economics.
[21] Mayda, A.M. (2006), ”Who is against immigration? A cross-country investigation of
individual attitudes toward immigrants”, The Review of Economics and Statistics, MIT
Press, 88(3), pp. 510-530.
[22] McCombs, M.E., and Shaw, D.L. (1972), ”The Agenda-Setting Function of Mass Me-
dia”, Public Opinion Quarterly, 36, pp.176-187.
[23] McCombs, M. E. and Reynolds, A. (2002), ”News Influence on Our Pictures of the
World,” in J. Bryant and D. Zillmann (Eds.) ”Media effects: Advances in theory and
research” (2nd Ed.), Mahwah, NJ: Lawrence Erlbaum, pp. 1-18.
[24] Mikami, S., Takeshita, T., Nakada, M.a and Kawabata,M. (1994), ”The media cover-
age and public awareness of environmental issues in Japan”. Paper presented to the
International Association for Mass Communication Research in Seoul.
[25] Miller, M. and Krosnick, A. (1997), ”Anatomy of news media priming”, in Iyengar,
S. and Reeves, R. (Eds.) ”Do the media govern?: politicians, voters, and reporters in
America”, SAGE publications, chapter 31.
[26] Mullainathan, S. and Shleifer, A. (2002), ”Media Bias”, Working Papers No.1981,
Harvard Institute of Economic Research.
[27] Puglisi, R,, Facchini, G. and Mayda, A.M. (2009), ”Illegal Immigration and Media
Exposure: Evidence on Individual Attitudes”. Working paper. APSA 2009 Toronto
Meeting Paper.
[28] Scheve, K. F. and Slaughter, M. J. (2001), ”Labour market competition and individual
preferences over immigration policy”, The Review of Economics and Statistics, 83, pp.
133-145.
58

[29] Semyonov, M., Raijman, R. and Gorodzeisky, A. (2000) ”The rise of anti-foreigner
sentiment in European societies, 1988-2000”, American Sociological Review, 71, pp.
426-449.
[30] Stromberg, D. (2004), ”Radio’s Impact on Public Spending”, Quarterly Journal of
Economics, 119, pp. 189-221.
[31] Stromberg, D. and Eisensee, T. (2007), ”News Droughts, News Floods, and U.S. Dis-
aster Relief”, The Quarterly Journal of Economics, MIT Press, 122(2), pp. 693-728.
[32] Williams, R. (1947) ”The Reduction of Intergroup Tensions”, New York: Social Science
Research Council.
[33] Wilson, C. and Gutierrez F. (1985), ”Minorities and the media. Diversity and the end
of Mass Communication”, Sage Publications.
[34] Yogo, M. and Stock-Wright, J.H. (2002), ”A Survey of Weak Instruments and Weak
Identification in Generalized Method of Moments”, Journal of Business and Economic
Statistics, 20(4).
59

60
Table 1: Average (2004-2006) of % social net contribution by population groups
% percentage of net contributory among…
Country overall natives migrants EU25 extra EU25 mixed
AT 60.63% 59.70% 75.91% 67.79% 79.59% 76.47%
BE 92.45% 92.62% 89.91% 88.14% 87.21% 91.45%
CZ 62.15% 61.90% 87.04% 81.96% 83.38% 73.69%
DE 53.03% 53.12% 44.75% 67.94% 60.86%
DK 62.12% 62.67% 45.14% 42.79% 55.51% 63.22%
ES 60.30% 59.48% 86.41% 58.81% 91.21% 84.68%
FI 59.71% 59.91% 40.55% 47.26% 49.62% 69.58%
FR 55.71% 56.10% 47.91% 52.06% 47.18% 64.33%
HU 55.47% 55.37% 81.63% 83.33% 75.17%
IE 49.61% 49.16% 58.96% 55.37% 55.41% 68.64%
IS 74.67% 73.95% 91.67% 91.33% 89.54% 83.48%
LU 61.09% 56.32% 70.41% 59.52% 57.40% 74.29%
NL 59.66% 59.64% 63.84% 76.99% 79.45% 54.38%
NO 61.03% 61.19% 55.10% 57.79% 56.44% 82.94%
PL 55.61% 55.61% 62.17% 62.44% 81.53% 49.34%
SE 63.75% 64.09% 51.76% 54.44% 50.05% 73.25%
SK 59.32% 59.38% 25.39% 51.84% 61.69% 27.35%
UK 57.40% 57.03% 67.17% 58.80% 69.66% 61.27%
Total 57.50% 57.50% 57.94% 59.58% 58.74% 68.69%
Source: Boeri (2009)

61
Table 2: Number and availability of observations for natives, by country and year (ESS data set)
Country 2002 2004 2006 2008 Total
AT 2,055 2,080 2,241 - 6,376
BE 1,741 1,619 1,645 1,586 6,591
BG - - 1,387 2,210 3,597
CH 1,696 1,748 1,464 1,392 6,300
CY - - 945 1,119 2,064
CZ 1,301 2,924 - - 4,225
DE 2,705 2,625 2,685 2,520 10,535
DK 1,427 1,416 1,414 1,510 5,767
EE - 1,616 1,199 1,342 4,157
ES 1,650 1,545 1,730 2,341 7,266
FI 1,937 1,983 1,838 2,139 7,897
FR 1,353 1,670 1,791 1,911 6,725
GB 1,861 1,726 2,158 2,107 7,852
GR 2,315 2,170 - - 4,485
HU 1,645 1,465 1,485 - 4,595
IE 1,896 2,142 1,564 - 5,602
IL 1,659 - - - 1,659
IS - 562 - - 562
IT 1,181 - - - 1,181
LU 1,071 1,147 - - 2,218
NL 2,208 1,717 1,711 - 5,636
NO 1,903 1,632 1,626 1,419 6,580
PL 2,079 1,697 1,697 1,600 7,073
PT 1,421 1,943 2,083 2,229 7,676
RU - - 2,280 2,376 4,656
SE 1,786 1,763 1,710 1,617 6,876
SI 1,384 1,333 1,371 1,179 5,267
SK - 1,469 1,709 - 3,178
TR - 1,832 - - 1,832
UA - 1,765 1,761 - 3,526
Total 38,274 43,589 39,494 30,597 151,954
Source: ESS
Table 3: Natives’ pro-immigration attitudes, by country and year (proimm)
at be bg ch cy cz de dk ee es fi fr gr hu ie il is it lu nl no pl pt ru se si sk tk ua uk
2002 33 51 . 61 . 44 54 48 . 52 36 49 46 13 18 61 31 . 63 38 55 52 57 40 . 81 52 . . .
2004 46 49 . 58 . 40 46 45 30 51 37 48 48 16 22 61 . 66 . 38 51 54 59 30 . 82 52 59 31 59
2006 41 52 62 54 12 . 47 52 29 44 39 46 43 . 18 63 . . . . 46 56 68 34 39 82 52 57 . 54
2008 . 55 67 57 10 . 59 54 33 38 44 52 46 . . . . . . . . 60 70 37 40 85 56 . . .
Source: ESS
Note: see table 4 for a description of proimm variable
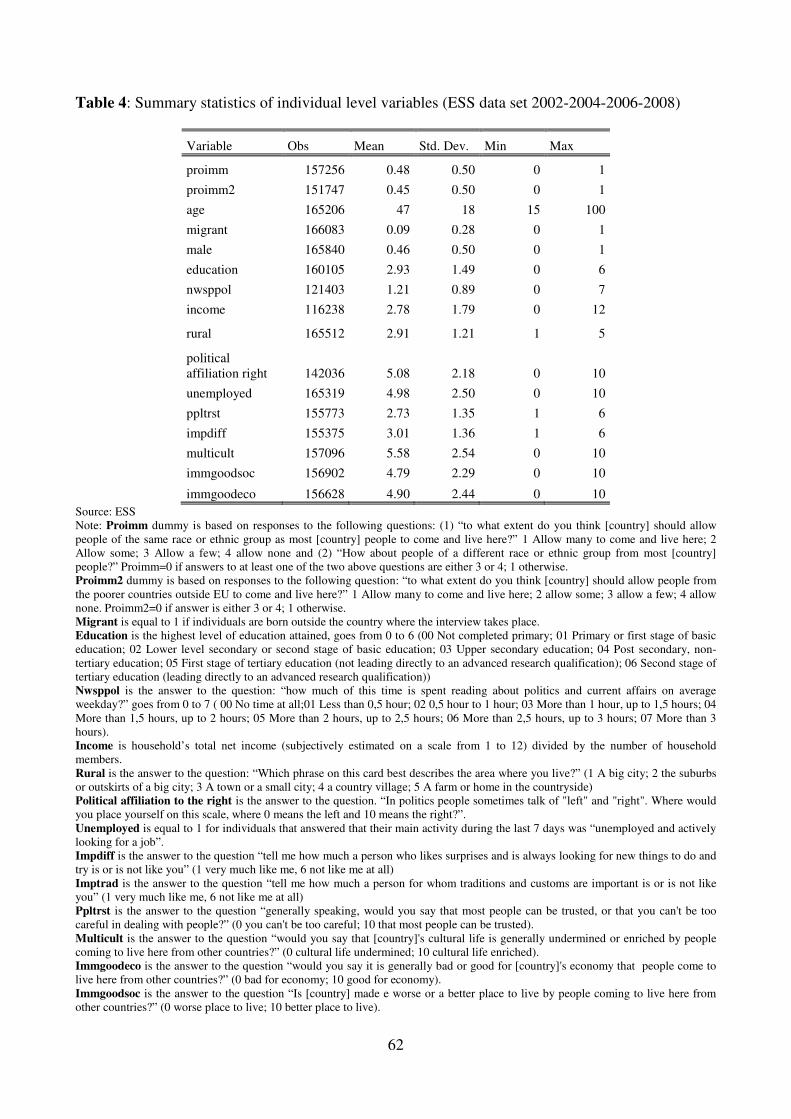
62
Table 4: Summary statistics of individual level variables (ESS data set 2002-2004-2006-2008)
Variable Obs Mean Std. Dev. Min Max
proimm 157256 0.48 0.50 0 1
proimm2 151747 0.45 0.50 0 1
age 165206 47 18 15 100
migrant 166083 0.09 0.28 0 1
male 165840 0.46 0.50 0 1
education 160105 2.93 1.49 0 6
nwsppol 121403 1.21 0.89 0 7
income 116238 2.78 1.79 0 12
rural 165512 2.91 1.21 1 5
political
affiliation right 142036 5.08 2.18 0 10
unemployed 165319 4.98 2.50 0 10
ppltrst 155773 2.73 1.35 1 6
impdiff 155375 3.01 1.36 1 6
multicult 157096 5.58 2.54 0 10
immgoodsoc 156902 4.79 2.29 0 10
immgoodeco 156628 4.90 2.44 0 10
Source: ESS
Note: Proimm dummy is based on responses to the following questions: (1) “to what extent do you think [country] should allow
people of the same race or ethnic group as most [country] people to come and live here?” 1 Allow many to come and live here; 2
Allow some; 3 Allow a few; 4 allow none and (2) “How about people of a different race or ethnic group from most [country]
people?” Proimm=0 if answers to at least one of the two above questions are either 3 or 4; 1 otherwise.
Proimm2 dummy is based on responses to the following question: “to what extent do you think [country] should allow people from
the poorer countries outside EU to come and live here?” 1 Allow many to come and live here; 2 allow some; 3 allow a few; 4 allow
none. Proimm2=0 if answer is either 3 or 4; 1 otherwise.
Migrant is equal to 1 if individuals are born outside the country where the interview takes place.
Education is the highest level of education attained, goes from 0 to 6 (00 Not completed primary; 01 Primary or first stage of basic
education; 02 Lower level secondary or second stage of basic education; 03 Upper secondary education; 04 Post secondary, non-
tertiary education; 05 First stage of tertiary education (not leading directly to an advanced research qualification); 06 Second stage of
tertiary education (leading directly to an advanced research qualification))
Nwsppol is the answer to the question: “how much of this time is spent reading about politics and current affairs on average
weekday?” goes from 0 to 7 ( 00 No time at all;01 Less than 0,5 hour; 02 0,5 hour to 1 hour; 03 More than 1 hour, up to 1,5 hours; 04
More than 1,5 hours, up to 2 hours; 05 More than 2 hours, up to 2,5 hours; 06 More than 2,5 hours, up to 3 hours; 07 More than 3
hours).
Income is household’s total net income (subjectively estimated on a scale from 1 to 12) divided by the number of household
members.
Rural is the answer to the question: “Which phrase on this card best describes the area where you live?” (1 A big city; 2 the suburbs
or outskirts of a big city; 3 A town or a small city; 4 a country village; 5 A farm or home in the countryside)
Political affiliation to the right is the answer to the question. “In politics people sometimes talk of "left" and "right". Where would
you place yourself on this scale, where 0 means the left and 10 means the right?”.
Unemployed is equal to 1 for individuals that answered that their main activity during the last 7 days was “unemployed and actively
looking for a job”.
Impdiff is the answer to the question “tell me how much a person who likes surprises and is always looking for new things to do and
try is or is not like you” (1 very much like me, 6 not like me at all)
Imptrad is the answer to the question “tell me how much a person for whom traditions and customs are important is or is not like
you” (1 very much like me, 6 not like me at all)
Ppltrst is the answer to the question “generally speaking, would you say that most people can be trusted, or that you can't be too
careful in dealing with people?” (0 you can't be too careful; 10 that most people can be trusted).
Multicult is the answer to the question “would you say that [country]'s cultural life is generally undermined or enriched by people
coming to live here from other countries?” (0 cultural life undermined; 10 cultural life enriched).
Immgoodeco is the answer to the question “would you say it is generally bad or good for [country]'s economy that people come to
live here from other countries?” (0 bad for economy; 10 good for economy).
Immgoodsoc is the answer to the question “Is [country] made e worse or a better place to live by people coming to live here from
other countries?” (0 worse place to live; 10 better place to live).

63
Table 5: Averages (2002-2004-2006-2008 when available) of individual level variables, by country
country proimm proimm2 age migrant male edu nwsppol income rural
political
affiliation
right
ppltrst imptrad impdiff multicult
imm
good
soc
imm
good
eco
at 0.40 0.39 43.95 0.08 0.46 2.36 1.29 3.12 2.90 4.66 5.08 2.87 2.99 5.30 4.34 5.17
be 0.52 0.54 45.41 0.09 0.49 3.18 1.15 2.92 3.24 4.89 4.93 2.76 2.82 5.79 4.51 4.54
bg 0.65 0.45 50.62 0.01 0.42 2.93 1.18 0.78 2.45 4.67 3.39 2.20 3.16 5.64 5.60 5.32
ch 0.58 0.60 48.30 0.19 0.46 3.27 1.20 4.28 3.34 4.96 5.69 2.89 2.88 6.21 5.16 5.80
cy 0.11 0.08 45.60 0.07 0.49 3.06 1.27 2.46 2.35 5.14 4.38 1.99 2.89 3.92 4.50 4.17
cz 0.41 0.40 49.37 0.04 0.47 3.02 1.11 1.95 2.81 5.40 4.19 2.81 3.27 4.46 4.14 4.28
de 0.51 0.50 47.42 0.08 0.50 3.44 1.25 2.96 2.78 4.51 4.73 2.96 3.06 5.90 4.67 4.79
dk 0.50 0.43 47.96 0.06 0.50 3.39 1.35 3.39 2.86 5.43 6.92 2.66 3.19 5.94 5.57 5.04
ee 0.31 0.25 46.96 0.20 0.42 3.28 1.28 2.58 2.70 5.24 5.31 3.06 3.12 4.92 4.07 4.39
es 0.45 0.43 46.52 0.07 0.48 2.20 1.21 2.13 2.98 4.48 4.94 2.62 3.00 5.80 4.76 5.28
fi 0.39 0.36 47.28 0.03 0.48 3.02 1.30 3.15 3.17 5.70 6.50 3.03 2.92 7.19 5.41 5.30
fr 0.49 0.46 47.91 0.09 0.46 3.02 1.16 3.02 2.90 4.78 4.47 3.30 2.90 5.22 4.45 4.72
gr 0.45 0.45 48.76 0.10 0.46 3.19 1.15 3.43 2.88 5.06 5.22 2.87 2.97 4.90 4.34 4.35
hu 0.14 0.14 48.99 0.10 0.43 2.19 1.27 2.17 2.34 5.67 3.76 1.76 2.77 3.68 3.24 3.56
ie 0.19 0.12 47.59 0.02 0.44 2.33 1.02 1.54 2.84 5.11 4.12 2.53 2.75 5.05 3.91 3.69
il 0.61 0.61 45.85 0.09 0.45 2.86 1.39 3.03 3.39 5.31 5.58 2.44 2.97 5.79 5.47 5.55
is 0.31 0.41 41.74 0.34 0.46 3.49 1.43 1.97 2.24 5.30 4.76 2.78 2.79 5.70 4.24 4.14
it 0.66 0.65 43.76 0.03 0.47 3.69 1.07 3.30 2.72 5.08 6.37 3.34 3.16 6.80 6.50 5.93
lu 0.63 0.59 45.91 0.02 0.45 2.34 1.14 2.26 3.10 4.79 4.55 . . 5.33 4.53 5.33
nl 0.38 0.43 43.12 0.31 0.50 2.61 1.23 3.38 3.21 5.08 5.11 2.80 2.70 6.84 5.24 6.24
no 0.51 0.50 48.54 0.08 0.44 3.00 1.30 3.56 2.97 5.20 5.74 2.80 2.90 6.01 4.75 4.82
pl 0.55 0.60 45.66 0.07 0.52 3.61 1.38 3.66 3.12 5.24 6.67 3.01 3.33 5.86 4.92 5.39
pt 0.63 0.63 43.30 0.01 0.48 2.62 0.97 1.39 2.84 5.49 3.88 2.17 2.90 6.38 5.63 5.01
ru 0.35 0.32 50.10 0.06 0.40 1.76 1.29 2.06 2.71 4.91 3.89 2.76 3.30 5.24 4.00 4.74
se 0.39 0.28 46.53 0.06 0.40 3.55 1.03 1.61 2.45 5.28 3.89 2.49 3.37 3.56 3.23 3.80
si 0.83 0.82 46.85 0.11 0.50 3.12 1.20 3.35 2.94 5.11 6.19 3.16 3.25 6.99 6.04 5.28
sk 0.53 0.50 45.68 0.08 0.46 2.45 0.90 1.70 3.32 4.78 4.12 2.64 2.56 5.09 4.47 4.26
tk 0.58 0.58 42.65 0.03 0.49 3.03 1.08 1.24 3.10 4.95 4.17 2.51 2.96 5.34 4.61 4.45
ua 0.31 0.25 38.09 0.01 0.45 1.55 1.58 0.87 2.33 6.32 3.00 1.87 2.76 3.47 3.58 3.87
uk 0.56 0.40 48.86 0.13 0.38 3.62 1.25 . 2.74 5.56 4.16 2.47 3.53 4.76 4.49 4.50
Total 0.48 0.45 46.83 0.09 0.46 2.93 1.21 2.78 2.91 5.08 4.98 2.73 3.01 5.58 4.70 4.82
Source: ESS
Note: see table 4 for a description of the variables

64
Table 6: Natives to immigrants relative skill mix (named skillgap).
country 2002 2004 2006 2008
at 1.22 1.16 1.17 1.16
be 1.18 1.14 1.15 1.15
bg . . 0.30 0.70
ch . 1.30 1.30 1.29
cy 0.64 0.73 0.84 0.79
cz 1.27 1.34 1.31 1.23
de . . . .
dk 1.01 1.04 1.07 1.04
ee 0.87 0.86 0.74 0.75
es 0.66 0.68 0.67 0.77
fi 0.91 0.96 1.01 1.03
fr 1.25 1.23 1.22 1.21
gr 0.80 0.90 0.93 1.00
hr . . . .
hu 0.92 0.83 0.78 0.83
ie 0.64 0.69 . 0.57
is 0.88 1.12 0.84 0.96
it . . 0.87 0.86
lt 0.82 0.87 0.74 0.87
lu 1.18 1.02 0.97 0.89
lv . 0.89 0.83 0.78
mt . . . .
nl 1.14 1.03 0.72 0.58
no 1.03 1.04 0.97 1.13
pl . 1.34 1.14 1.07
pt 0.42 0.50 1.38 1.32
ro . 0.22 0.52 0.55
se 1.10 1.09 0.49 0.57
si 1.16 1.06 1.11 1.09
sk . 1.02 1.10 1.15
uk 1.04 0.86 1.00 0.77
Source: LFS Eurostat
Note: the relative skill ratio is computed as one plus the log of the relative skill composition of natives to immigrants. For both
natives and immigrants, the ratio of skilled to unskilled labor is measured as the ratio of the number of individuals with high levels of
education (ISCED 03 and over) to the number of individuals with low level of education (ISCED 00, 01, 02).

65
Table 7: Number of sources available by country in Dow Jones Factiva database.
Country at be bg ch cz de dk ee es fi fr gr hu ie it lt lu lv nl no pl pt ro se si sk tk uk
Number
of
sources
25 73 18 80 39 260 15 9 151 15 200 9 20 55 91 5 55 7 64 17 26 23 13 30 6 10 17 301
Source: www.factiva.com/sources/results.asp
Table 8: Total number of individuals affected or killed during selected disasters between 2002-
2008 (hundreds)
Source: EM-DAT: The OFDA/CRED International Disaster Database (www.em-dat.net - Université Catholique de Louvain -
Brussels – Belgium)
Note: I select disasters that involved more than 50 killed or more than 100 affected individuals.
Table 9: Total number of medals won during summer Olympics Games.
total medals in Olympics games
at be bg ch cy cz de dk ee es fi Fr gr hr hu ie it lt lu lv mt nl no pl pt ro se si sk tk uk
Athens 7 3 12 5 0 8 49 8 3 19 2 33 16 5 17 0 32 3 0 4 0 22 6 10 3 19 7 4 6 10 30
Beijing 3 2 5 7 0 6 41 7 2 0 4 40 4 5 11 3 28 5 0 3 0 16 9 10 2 8 5 5 6 8 47
Source: BBC Sport
Disastertot (sum 2002-2008), hundreds
at be bg cy cz de dk ee es fi fr gr hu ie it lu nl pl pt se si sk ro tk uk
21 50 137 0 2049 3335 21 1 230 4 629 108 352 5 521 2 20 62 1532 3 20 107 1357 7070 3784
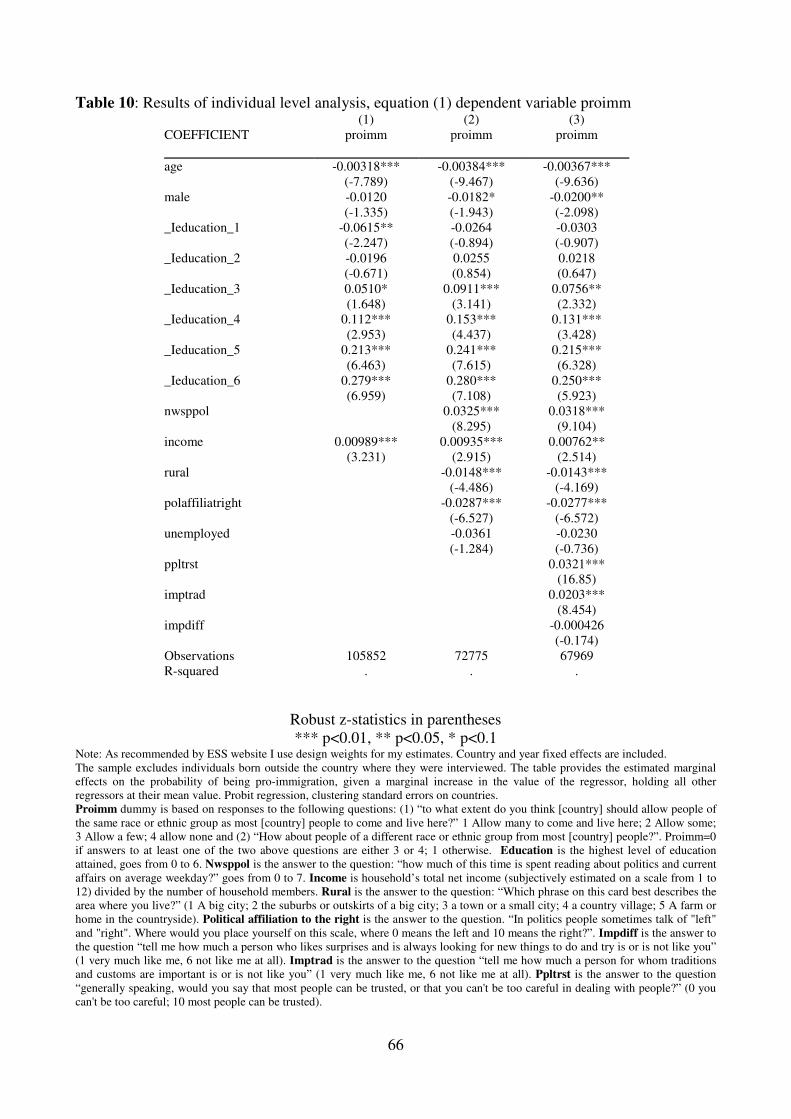
66
Table 10: Results of individual level analysis, equation (1) dependent variable proimm (1) (2) (3)
COEFFICIENT proimm proimm proimm
age -0.00318*** -0.00384*** -0.00367***
(-7.789) (-9.467) (-9.636)
male -0.0120 -0.0182* -0.0200**
(-1.335) (-1.943) (-2.098)
_Ieducation_1 -0.0615** -0.0264 -0.0303
(-2.247) (-0.894) (-0.907)
_Ieducation_2 -0.0196 0.0255 0.0218
(-0.671) (0.854) (0.647)
_Ieducation_3 0.0510* 0.0911*** 0.0756**
(1.648) (3.141) (2.332)
_Ieducation_4 0.112*** 0.153*** 0.131***
(2.953) (4.437) (3.428)
_Ieducation_5 0.213*** 0.241*** 0.215***
(6.463) (7.615) (6.328)
_Ieducation_6 0.279*** 0.280*** 0.250***
(6.959) (7.108) (5.923)
nwsppol 0.0325*** 0.0318***
(8.295) (9.104)
income 0.00989*** 0.00935*** 0.00762**
(3.231) (2.915) (2.514)
rural -0.0148*** -0.0143***
(-4.486) (-4.169)
polaffiliatright -0.0287*** -0.0277***
(-6.527) (-6.572)
unemployed -0.0361 -0.0230
(-1.284) (-0.736)
ppltrst 0.0321***
(16.85)
imptrad 0.0203***
(8.454)
impdiff -0.000426
(-0.174)
Observations 105852 72775 67969
R-squared . . .
Robust z-statistics in parentheses
*** p<0.01, ** p<0.05, * p<0.1 Note: As recommended by ESS website I use design weights for my estimates. Country and year fixed effects are included.
The sample excludes individuals born outside the country where they were interviewed. The table provides the estimated marginal
effects on the probability of being pro-immigration, given a marginal increase in the value of the regressor, holding all other
regressors at their mean value. Probit regression, clustering standard errors on countries.
Proimm dummy is based on responses to the following questions: (1) “to what extent do you think [country] should allow people of
the same race or ethnic group as most [country] people to come and live here?” 1 Allow many to come and live here; 2 Allow some;
3 Allow a few; 4 allow none and (2) “How about people of a different race or ethnic group from most [country] people?”. Proimm=0
if answers to at least one of the two above questions are either 3 or 4; 1 otherwise. Education is the highest level of education
attained, goes from 0 to 6. Nwsppol is the answer to the question: “how much of this time is spent reading about politics and current
affairs on average weekday?” goes from 0 to 7. Income is household’s total net income (subjectively estimated on a scale from 1 to
12) divided by the number of household members. Rural is the answer to the question: “Which phrase on this card best describes the
area where you live?” (1 A big city; 2 the suburbs or outskirts of a big city; 3 a town or a small city; 4 a country village; 5 A farm or
home in the countryside). Political affiliation to the right is the answer to the question. “In politics people sometimes talk of "left"
and "right". Where would you place yourself on this scale, where 0 means the left and 10 means the right?”. Impdiff is the answer to
the question “tell me how much a person who likes surprises and is always looking for new things to do and try is or is not like you”
(1 very much like me, 6 not like me at all). Imptrad is the answer to the question “tell me how much a person for whom traditions
and customs are important is or is not like you” (1 very much like me, 6 not like me at all). Ppltrst is the answer to the question
“generally speaking, would you say that most people can be trusted, or that you can't be too careful in dealing with people?” (0 you
can't be too careful; 10 most people can be trusted).

67
Table 11: Results of individual level analysis, equation (1) dependent variable proimm2 (1) (2) (3)
COEFFICIENT proimm2 proimm2 proimm2
age -0.00360*** -0.00395*** -0.00375***
(-12.09) (-12.64) (-12.05)
male -0.0124 -0.0236** -0.0256***
(-1.258) (-2.520) (-2.860)
_Ieducation_1 0.00150 -0.0355 -0.0370
(0.108) (-1.305) (-1.217)
_Ieducation_2 0.0484*** 0.00608 -0.000298
(2.927) (0.202) (-0.00891)
_Ieducation_3 0.0921*** 0.0421 0.0239
(5.546) (1.401) (0.713)
_Ieducation_4 0.149*** 0.106*** 0.0846**
(6.381) (3.091) (2.257)
_Ieducation_5 0.237*** 0.182*** 0.155***
(16.39) (6.342) (4.958)
_Ieducation_6 0.294*** 0.231*** 0.195***
(14.24) (6.650) (5.177)
nwsppol 0.0274*** 0.0262***
(7.405) (7.435)
income 0.00483** 0.00437** 0.00248
(2.096) (1.964) (1.217)
rural -0.0110*** -0.0106***
(-3.600) (-3.300)
polaffiliatright -0.0291*** -0.0293***
(-6.005) (-6.455)
unemployed -0.00778 -0.00123
(-0.264) (-0.0426)
ppltrst 0.0281***
(16.66)
imptrad 0.0154***
(5.433)
impdiff -0.00386
(-1.193)
Observations 102325 70663 66060
R-squared . . .
Robust z-statistics in parentheses
*** p<0.01, ** p<0.05, * p<0.1
Note: As recommended by ESS website I use design weights for my estimates. Country and years fixed effects are included.
The sample excludes individuals born outside the country where they were interviewed. The table provides the estimated marginal
effects on the probability of being pro-immigration from poorer countries outside Europe, given a marginal increase in the value of
the regressor, holding all other regressors at their mean value. Probit regression, clustering standard errors on countries. Proimm2
dummy is based on responses to the following question: “to what extent do you think [country] should allow people from the poorer
countries outside EU to come and live here?” 1 Allow many to come and live here; 2 allow some; 3 allow a few; 4 allow none.
Proimm2=0 if answer is either 3 or 4; 1 otherwise. Education is the highest level of education attained, goes from 0 to 6. Nwsppol
is the answer to the question: “how much of this time is spent reading about politics and current affairs on average weekday?” goes
from 0 to 7. Income is household’s total net income (subjectively estimated on a scale from 1 to 12) divided by the number of
household members. Rural is the answer to the question: “Which phrase on this card best describes the area where you live?” (1 A
big city; 2 the suburbs or outskirts of a big city; 3 a town or a small city; 4 a country village; 5 A farm or home in the countryside).
Political affiliation to the right is the answer to the question. “In politics people sometimes talk of "left" and "right". Where would
you place yourself on this scale, where 0 means the left and 10 means the right?” Impdiff is the answer to the question “tell me how
much a person who likes surprises and is always looking for new things to do and try is or is not like you” (1 very much like me, 6
not like me at all). Imptrad is the answer to the question “tell me how much a person for whom traditions and customs are important
is or is not like you” (1 very much like me, 6 not like me at all). Ppltrst is the answer to the question “generally speaking, would you
say that most people can be trusted, or that you can't be too careful in dealing with people?” (0 you can't be too careful; 10 most
people can be trusted).
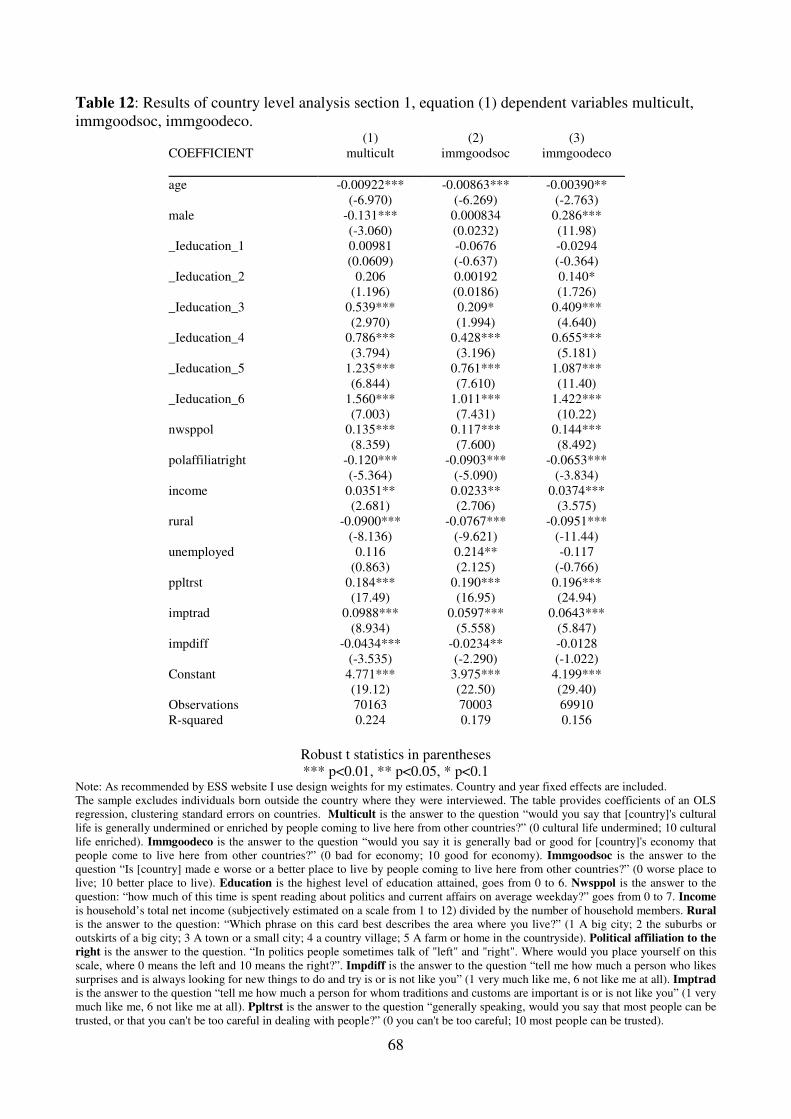
68
Table 12: Results of country level analysis section 1, equation (1) dependent variables multicult,
immgoodsoc, immgoodeco. (1) (2) (3)
COEFFICIENT multicult immgoodsoc immgoodeco
age -0.00922*** -0.00863*** -0.00390**
(-6.970) (-6.269) (-2.763)
male -0.131*** 0.000834 0.286***
(-3.060) (0.0232) (11.98)
_Ieducation_1 0.00981 -0.0676 -0.0294
(0.0609) (-0.637) (-0.364)
_Ieducation_2 0.206 0.00192 0.140*
(1.196) (0.0186) (1.726)
_Ieducation_3 0.539*** 0.209* 0.409***
(2.970) (1.994) (4.640)
_Ieducation_4 0.786*** 0.428*** 0.655***
(3.794) (3.196) (5.181)
_Ieducation_5 1.235*** 0.761*** 1.087***
(6.844) (7.610) (11.40)
_Ieducation_6 1.560*** 1.011*** 1.422***
(7.003) (7.431) (10.22)
nwsppol 0.135*** 0.117*** 0.144***
(8.359) (7.600) (8.492)
polaffiliatright -0.120*** -0.0903*** -0.0653***
(-5.364) (-5.090) (-3.834)
income 0.0351** 0.0233** 0.0374***
(2.681) (2.706) (3.575)
rural -0.0900*** -0.0767*** -0.0951***
(-8.136) (-9.621) (-11.44)
unemployed 0.116 0.214** -0.117
(0.863) (2.125) (-0.766)
ppltrst 0.184*** 0.190*** 0.196***
(17.49) (16.95) (24.94)
imptrad 0.0988*** 0.0597*** 0.0643***
(8.934) (5.558) (5.847)
impdiff -0.0434*** -0.0234** -0.0128
(-3.535) (-2.290) (-1.022)
Constant 4.771*** 3.975*** 4.199***
(19.12) (22.50) (29.40)
Observations 70163 70003 69910
R-squared 0.224 0.179 0.156
Robust t statistics in parentheses
*** p<0.01, ** p<0.05, * p<0.1 Note: As recommended by ESS website I use design weights for my estimates. Country and year fixed effects are included.
The sample excludes individuals born outside the country where they were interviewed. The table provides coefficients of an OLS
regression, clustering standard errors on countries. Multicult is the answer to the question “would you say that [country]'s cultural
life is generally undermined or enriched by people coming to live here from other countries?” (0 cultural life undermined; 10 cultural
life enriched). Immgoodeco is the answer to the question “would you say it is generally bad or good for [country]'s economy that
people come to live here from other countries?” (0 bad for economy; 10 good for economy). Immgoodsoc is the answer to the
question “Is [country] made e worse or a better place to live by people coming to live here from other countries?” (0 worse place to
live; 10 better place to live). Education is the highest level of education attained, goes from 0 to 6. Nwsppol is the answer to the
question: “how much of this time is spent reading about politics and current affairs on average weekday?” goes from 0 to 7. Income
is household’s total net income (subjectively estimated on a scale from 1 to 12) divided by the number of household members. Rural
is the answer to the question: “Which phrase on this card best describes the area where you live?” (1 A big city; 2 the suburbs or
outskirts of a big city; 3 A town or a small city; 4 a country village; 5 A farm or home in the countryside). Political affiliation to the
right is the answer to the question. “In politics people sometimes talk of "left" and "right". Where would you place yourself on this
scale, where 0 means the left and 10 means the right?”. Impdiff is the answer to the question “tell me how much a person who likes
surprises and is always looking for new things to do and try is or is not like you” (1 very much like me, 6 not like me at all). Imptrad
is the answer to the question “tell me how much a person for whom traditions and customs are important is or is not like you” (1 very
much like me, 6 not like me at all). Ppltrst is the answer to the question “generally speaking, would you say that most people can be
trusted, or that you can't be too careful in dealing with people?” (0 you can't be too careful; 10 most people can be trusted).

69
Table 13: Results country level analysis, equation (2), dependent variable proimm and proimm2 (1) (2) (3) (4) (5) (6)
COEFFICIENT proimm proimm proimm proimm proimm2 proimm2
Age -0.00371*** -0.00369*** -0.00371*** -0.00362*** -0.00366*** -0.00380***
(-7.843) (-6.676) (-7.812) (-7.855) (-8.447) (-10.45)
Male -0.0246** -0.0255** -0.0246** -0.0227** -0.0315*** -0.0257**
(-2.077) (-2.137) (-2.082) (-2.092) (-2.696) (-2.457)
Education 0.0249** 0.0643*** 0.0217*** 0.0223*** 0.00844 0.00628
(2.316) (14.11) (2.669) (3.007) (1.002) (0.710)
Rural -0.0126*** -0.0103** -0.0125*** -0.0119*** -0.00637 -0.00862**
(-3.013) (-1.971) (-3.021) (-2.874) (-1.391) (-2.244)
Income 0.00722** -0.0126 0.0157 0.0217 0.0240 0.0244**
(2.538) (-0.622) (0.948) (1.414) (1.628) (1.976)
Nwsppol 0.0330*** 0.0372*** 0.0183** 0.0224*** 0.0307*** 0.0202**
(8.380) (9.575) (2.070) (2.922) (7.525) (2.396)
polaffiliatright -0.0282*** -0.0270*** -0.0283*** -0.0281*** -0.0285*** -0.0311***
(-5.945) (-4.888) (-5.970) (-5.618) (-5.236) (-6.009)
unemployed -0.00432 0.00284 -0.00456 0.00870 -0.0263 0.0100
(-0.129) (0.0823) (-0.136) (0.285) (-0.660) (0.309)
Ppltrst 0.0330*** 0.0327*** 0.0330*** 0.0331*** 0.0281*** 0.0282***
(14.29) (12.33) (14.29) (13.75) (11.80) (13.16)
Imptrad 0.0222*** 0.0228*** 0.0221*** 0.0226*** 0.0187*** 0.0167***
(10.93) (10.19) (10.88) (11.12) (5.814) (6.223)
Impdiff -0.0000729 -0.000768 -0.0000333 0.0000330 -0.00619 -0.00449
(-0.0237) (-0.229) (-0.0109) (0.0106) (-1.515) (-1.147)
edu_skillgap 0.0379*** 0.0379*** 0.0381*** 0.0421*** 0.0368***
(3.849) (4.105) (4.749) (5.171) (4.460)
income_skillgap 0.0118 -0.0109 -0.0161 -0.0229 -0.0199
(0.565) (-0.627) (-1.007) (-1.556) (-1.544)
nwsppol_edu_skillgap 0.00245 0.00251 0.00512**
(0.975) (1.263) (1.976)
nwsppol_income_skillgap 0.00222 0.00150 -0.00196
(1.523) (1.171) (-1.280)
income_skillgap_benefit 0.00000125 -0.0000000144
(1.167) (-0.0169)
Immnews -0.000235*** -0.0000722
(-3.307) (-0.915)
Observations 52395 36323 52395 48883 35481 47616
R-squared . . . . . .
Robust z statistics in parentheses
*** p<0.01, ** p<0.05, * p<0.1 Note: As recommended by ESS website I use design weights for my estimates. Country and year fixed effects are included.
The sample excludes individuals born outside the country where they were interviewed. Probit regression, clustering standard errors
on countries. Proimm dummy is based on responses to the following questions: (1) “to what extent do you think [country] should
allow people of the same race or ethnic group as most [country] people to come and live here?” 1 Allow many; 2 Allow some; 3
Allow a few; 4 allow none and (2) “How about people of a different race or ethnic group from most [country] people?”. Proimm=0 if
answers to at least one of the two above questions are either 3 or 4; 1 otherwise. Proimm2 dummy is based on responses to: “what
about people from the poorer countries outside EU?”. Proimm2=0 if answer is either 3 or 4; 1 otherwise. Education is the highest
level of education attained, goes from 0 to 6. Nwsppol is the answer to the question: “how much of this time is spent reading about
politics and current affairs on average weekday?” goes from 0 to 7. Income is household’s total net income (subjectively estimated
on a scale from 1 to 12) divided by the number of household members. Rural goes from 1 to 6 (1 if living in a big city; 2 the suburbs
or outskirts of a big city; 3 A town or a small city; 4 a country village; 5 A farm or home in the countryside). Polaffiliatright is the
answer to the question. “Where would you place yourself on a scale, where 0 means the left and 10 means the right?”. Impdiff is the
answer to the question “tell me how much a person who likes surprises and is always looking for new things to do and try is or is not
like you” (1 like me, 6 not like me).Imptrad is the answer to the question “tell me how much a person for whom traditions and
customs are important is or is not like you” (1like me, 6 not like me). Ppltrst is the answer to the question “would you say that most
people can be trusted, or that you can't be too careful in dealing with people?” (0 you can't be too careful; 10 most people can be
trusted). Skillgap is one plus the log of the relative skill composition of natives to immigrants. The ratio of skilled to unskilled labor
is given by individuals with high education (ISCED 03 and over) divided by to individuals with low education (ISCED 00, 01, 02).

70
Table 14: Summary statistics of country level variables (ESS dataset)
Variable Obs Mean Std. Dev. Min Max
proimm 87 49.5 15.2 10.6 87.0
proimm2 87 45.5 16.5 7.4 85.7
loggdp 120 10.1 0.5 8.3 11.3
immcontrnews 98 20 39 0 277
immnews 98 40.4 71.7 0.0 432.9
disaster2 104 0.49 0.5 0 1
disastertot 104 10403 45983 0 331080
totalolympsummer 104 5.6 10.5 0.0 49.0
age 87 46.7 2.8 36.2 52.9
male 87 46.6 3.7 36.7 53.9
edu 84 2.9 0.5 1.5 3.7
income 77 2.7 0.9 0.8 4.9
ppltrst 87 5.0 1.0 3.0 7.1
impdiff 85 3.0 0.2 2.5 3.6
imptrad 85 2.7 0.4 1.7 3.4
benefit 72 4105 2820 287 11865
skillgap 92 1.0 0.2 0.3 1.4
Note: loggdp is the per capita gdp in PPP, taken by IMF website. Benefit is the per capita level of government expenditure in social
protection, taken from Eurostat. Note that the variable benefit is not available for the year 2008. Immcontrnews is the average
number of news on immigration per media outlet whose subjects have been categorized by Dow Jones Factiva as on crimes, safety,
terrorism, order forces, military actions, social disorders, racism and asylum.
Immnews is the average number of news that contains the worlds “immigrant” or “immigration” in English and in the most spoken
languages per media outlet. (Source: Dow Jones Factiva). Disastertot is equal to n of killed and affected people in disasters occurred
in the destination country. (Source: EM CRED database). Disaster2 is a dummy that indicates whether there has been a disaster (that
satisfies the criteria mentioned in the text) in the country and year indicated (source: EM CRED database). Skillgap is computed as
one plus the log of the relative skill composition of natives to immigrants. For both natives and immigrants, the ratio of skilled to
unskilled labor is measured as the ratio of the number of individuals with levels of education 2 and 3 (ISCED 03 and over) to the
number of individuals with level 1 of education (ISCED 00, 01, 02). (Source: LFS Eurostat). Totalolympsummer is the total number
of medals won by the considered country during Olympic Games (source BBC sport).

71
Table 15: Country level variables averages 2002-2004-2006-2008 by countries (when available)
country loggdp immcontr
news immnews disaster2 disastertot
total
olymp
summer
benefit skillgap
at 10.45 18.00 36.11 0.50 202.72 2.50 6024.09 1.18
be 10.38 3.14 8.72 0.75 963.80 1.25 4903.18 1.16
bg 9.14 2.68 3.99 0.25 382.08 4.25 330.32 0.50
ch 10.52 12.61 31.68 0.50 821.25 3.00 . 1.30
cy 10.13 . . 0.00 0.00 0.00 1707.13 0.75
cz 9.92 3.47 6.16 0.75 51111.97 3.50 1226.74 1.29
de 10.34 7.52 19.14 1.00 83182.20 22.50 5926.35 .
dk 10.42 9.96 43.45 0.25 518.17 3.75 8369.77 1.04
ee 9.69 1.92 4.56 0.00 0.00 1.25 744.85 0.80
es 10.21 166.40 323.81 0.50 822.85 4.75 2593.15 0.69
fi 10.34 5.16 9.88 0.00 0.00 1.50 6110.19 0.98
fr 10.33 39.55 69.78 0.75 2125.68 18.25 5908.27 1.23
gr 10.14 10.69 14.25 0.75 2409.13 5.00 2944.79 0.91
hu 9.72 1.51 2.36 1.00 8661.76 7.00 1313.87 0.84
ie 10.54 21.45 33.67 0.50 125.42 0.75 3465.55 0.64
it 10.25 54.71 121.22 1.00 12639.71 15.00 4304.93 0.86
lu 11.17 0.50 2.13 0.00 0.00 0.00 10628.83 1.02
nl 10.47 11.18 18.49 0.25 249.10 9.50 5184.34 0.87
no 10.76 1.49 8.40 0.25 25.00 3.75 8347.72 1.04
pl 9.53 4.92 9.48 0.75 648.51 5.00 1049.51 1.18
pt 9.92 21.22 41.39 0.50 89.97 1.25 2067.85 0.90
se 10.39 3.16 15.73 0.25 86.86 3.00 7488.09 0.81
si 10.07 2.83 6.58 0.25 151.73 2.25 2357.83 1.10
sk 9.71 2.68 5.50 0.50 2664.52 3.00 838.48 1.09
tk 9.27 50.84 122.41 1.00 101571.50 4.50 . .
uk 10.37 38.08 68.89 0.50 1018.33 19.25 4672.63 0.92
Total 10.09 19.54 40.39 0.49 10402.78 5.61 4104.52 0.97
Source: Eurostat, IMF, Dow Jones Factiva database, EM-DAT: The OFDA/CRED International disaster Database (www.em-dat.net
- Université Catholique de Louvain - Brussels – Belgium).

72
Table 16: Results of country level analysis equation (3)
(1) (2) (3) (4) (5) (6) (7) (8)
COEFFICIENT proimm proimm proimm proimm proimm proimm proimm proimm
skillgap 9.027** 17.76** 9.809** 12.89* 15.55**
(2.143) (2.274) (2.312) (2.050) (2.187)
income_skillgap -5.320 -5.212 -6.528*
(-1.321) (-1.648) (-1.827)
benefit -0.00515
(-0.806)
ppltrst 11.63*** 17.57*** 19.33*** 15.26*** 17.16***
(2.981) (3.892) (3.877) (3.346) (3.314)
imptrad 18.66* 16.59** 15.70* 14.21 11.90
(2.012) (2.083) (1.774) (1.544) (1.135)
impdiff 13.07 15.93* 16.02* 16.58** 16.30*
(1.350) (2.034) (1.838) (2.341) (2.019)
immnews -0.0588*** -0.0574***
(-4.103) (-4.578)
immcontrnews -0.0622*** -0.0647***
(-2.954) (-3.445)
Constant 6.295 -33.56 -53.00 -148.7** -106.7* -104.3 -31.27 -28.68
(0.0849) (-0.424) (-0.453) (-2.316) (-1.815) (-1.587) (-0.438) (-0.349)
Observations 57 57 41 72 63 63 53 53
Adj-R-squared 0.9403 0.9420 0.9611 0.9405 0.9624 0.9541 0.976 0.9693
T-statistics in parentheses
*** p<0.01, ** p<0.05, * p<0.1
Note: Both year and country fixed effects are used. Simple OLS model, controlling for average level by country and years of age,
sex, rural, education and income. Data on benefits not available for 2008. . Proimm is the average by country and year of the dummy
proimm of the previous section (1 if pro-immigration attitudes, 0 otherwise). Proimm goes now from 0 to 100 and represents the
share of pro-immigration natives. The variables age, income, rural, male, education, ppltrst imptrad impdiff are averages by country
and years of individual variables of the ESS. Immcontrnews is the average number of news on immigration per media outlet whose
subjects have been categorized by Dow Jones Factiva as on crimes, safety, terrorism, order forces, military actions, social disorders,
racism and asylum. Immnews is the average number of news on immigration per media outlet in the country. Disastertot is equal to
n of killed and affected people in disasters occurred in the destination country. Disaster2 is a dummy that indicates whether there has
been a disaster (that satisfies the criteria mentioned in the text) in the country and year indicated. Skillgap is one plus the log of the
relative skill composition of natives to immigrants. For both natives and immigrants, the ratio of skilled to unskilled labor is
measured as the ratio of the number of individuals with levels of education 2 and 3 (ISCED 03 and over) to the number of individuals
with level 1 of education (ISCED 00, 01, 02). Totalolympsummer is the total number of medals won by the considered country
during Olympic Games.

73
Table 17: Results of country level analysis equation (3), dependent variable proimm2
(1) (2) (3) (4) (5) (6) (7) (8)
COEFFICIENT proimm2 proimm2 proimm2 proimm2 proimm2 proimm2 proimm2 proimm2
Skillgap 10.17** 24.04** 11.40 21.09** 22.48**
(2.082) (2.740) (1.756) (2.342) (2.409)
income_skillgap -8.445* -9.085* -9.798*
(-1.867) (-2.005) (-2.089)
benefit -0.0127
(-1.299)
ppltrst 12.23** 23.08*** 23.75*** 18.47** 19.30**
(2.672) (3.580) (3.580) (2.827) (2.838)
imptrad 9.132 7.092 7.559 4.220 3.427
(0.840) (0.624) (0.642) (0.320) (0.249)
impdiff 18.04 20.12* 18.97 19.68* 18.85*
(1.589) (1.798) (1.637) (1.939) (1.778)
immnews -0.0286 -0.0279
(-1.398) (-1.555)
immcontrnews -0.0148 -0.0207
(-0.527) (-0.841)
Constant 6.656 -56.61 80.82 -125.9 -82.18 -92.57 -36.55 -48.16
(0.0775) (-0.638) (0.451) (-1.672) (-0.979) (-1.058) (-0.358) (-0.447)
Observations 57 57 41 72 63 63 53 53
Adj-R-squared 0.9304 0.9365 0.9177 0.9314 0.9365 0.9328 0.9585 0.9549
T-statistics in parentheses
*** p<0.01, ** p<0.05, * p<0.1
Note: Both year and country fixed effects are used. Simple OLS model, controlling for average level by country and years of age,
sex, rural, education and income. Data on benefits not available for 2008. . Proimm2 is the average by country and year of the
dummy proimm2 of the previous section (1 if pro-immigration attitudes towards poorer immigrants from outside Europe, 0
otherwise). Proimm2 goes now from 0 to 100 and represents the share of pro-immigration natives. The variables age, income, rural,
male, education, ppltrst imptrad impdiff are averages by country and years of individual variables of the ESS. Immcontrnews is the
average number of news on immigration per media outlet whose subjects have been categorized by Dow Jones Factiva as on crimes,
safety, terrorism, order forces, military actions, social disorders, racism and asylum. Immnews is the average number of news on
immigration per media outlet in the country. Disastertot is equal to n of killed and affected people in disasters occurred in the
destination country. Disaster2 is a dummy that indicates whether there has been a disaster (that satisfies the criteria mentioned in the
text) in the country and year indicated. Skillgap is one plus the log of the relative skill composition of natives to immigrants. For
both natives and immigrants, the ratio of skilled to unskilled labor is measured as the ratio of the number of individuals with levels of
education 2 and 3 (ISCED 03 and over) to the number of individuals with level 1 of education (ISCED 00, 01, 02).
Totalolympsummer is the total number of medals won by the considered country during Olympic Games.
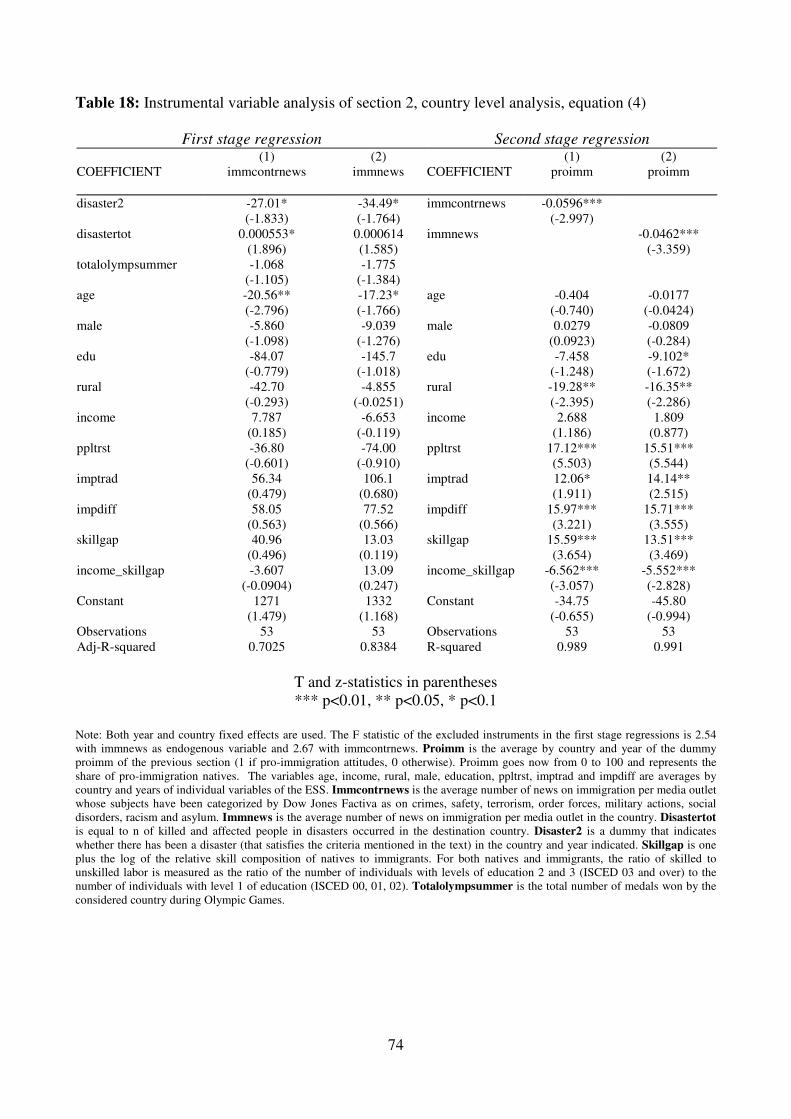
74
Table 18: Instrumental variable analysis of section 2, country level analysis, equation (4)
First stage regression Second stage regression (1) (2) (1) (2)
COEFFICIENT immcontrnews immnews COEFFICIENT proimm proimm
disaster2 -27.01* -34.49* immcontrnews -0.0596***
(-1.833) (-1.764) (-2.997)
disastertot 0.000553* 0.000614 immnews -0.0462***
(1.896) (1.585) (-3.359)
totalolympsummer -1.068 -1.775
(-1.105) (-1.384)
age -20.56** -17.23* age -0.404 -0.0177
(-2.796) (-1.766) (-0.740) (-0.0424)
male -5.860 -9.039 male 0.0279 -0.0809
(-1.098) (-1.276) (0.0923) (-0.284)
edu -84.07 -145.7 edu -7.458 -9.102*
(-0.779) (-1.018) (-1.248) (-1.672)
rural -42.70 -4.855 rural -19.28** -16.35**
(-0.293) (-0.0251) (-2.395) (-2.286)
income 7.787 -6.653 income 2.688 1.809
(0.185) (-0.119) (1.186) (0.877)
ppltrst -36.80 -74.00 ppltrst 17.12*** 15.51***
(-0.601) (-0.910) (5.503) (5.544)
imptrad 56.34 106.1 imptrad 12.06* 14.14**
(0.479) (0.680) (1.911) (2.515)
impdiff 58.05 77.52 impdiff 15.97*** 15.71***
(0.563) (0.566) (3.221) (3.555)
skillgap 40.96 13.03 skillgap 15.59*** 13.51***
(0.496) (0.119) (3.654) (3.469)
income_skillgap -3.607 13.09 income_skillgap -6.562*** -5.552***
(-0.0904) (0.247) (-3.057) (-2.828)
Constant 1271 1332 Constant -34.75 -45.80
(1.479) (1.168) (-0.655) (-0.994)
Observations 53 53 Observations 53 53
Adj-R-squared 0.7025 0.8384 R-squared 0.989 0.991
T and z-statistics in parentheses
*** p<0.01, ** p<0.05, * p<0.1
Note: Both year and country fixed effects are used. The F statistic of the excluded instruments in the first stage regressions is 2.54
with immnews as endogenous variable and 2.67 with immcontrnews. Proimm is the average by country and year of the dummy
proimm of the previous section (1 if pro-immigration attitudes, 0 otherwise). Proimm goes now from 0 to 100 and represents the
share of pro-immigration natives. The variables age, income, rural, male, education, ppltrst, imptrad and impdiff are averages by
country and years of individual variables of the ESS. Immcontrnews is the average number of news on immigration per media outlet
whose subjects have been categorized by Dow Jones Factiva as on crimes, safety, terrorism, order forces, military actions, social
disorders, racism and asylum. Immnews is the average number of news on immigration per media outlet in the country. Disastertot
is equal to n of killed and affected people in disasters occurred in the destination country. Disaster2 is a dummy that indicates
whether there has been a disaster (that satisfies the criteria mentioned in the text) in the country and year indicated. Skillgap is one
plus the log of the relative skill composition of natives to immigrants. For both natives and immigrants, the ratio of skilled to
unskilled labor is measured as the ratio of the number of individuals with levels of education 2 and 3 (ISCED 03 and over) to the
number of individuals with level 1 of education (ISCED 00, 01, 02). Totalolympsummer is the total number of medals won by the
considered country during Olympic Games.

75
Table 19: Summary statistics for database in section 3
Variable Obs Mean Std. Dev. Min Max
Immig 306 10.38 9.91 0.00 64.00
Immnews 259 23.01 41.26 0.11 234.62
Immcontrnews 259 13.05 24.38 0.00 157.20
Immposnews 259 0.90 2.12 0.00 20.76
Totalolympicsummer 306 1.99 6.74 0 49
Disaster2 297 0.29 0.45 0 1
Disastertot 297 3117 23994 0 370009
Disasterkill 297 210 1843 0 20091
Note: Immig is the share of people answering "immigration" to the Eurobarometer question on " What do you think are the two most
important issues facing (OUR COUNTRY) at the moment?". Immcontrnews is the average number of news on immigration per
media outlet whose subjects have been categorized by Dow Jones Factiva as on crimes, safety, terrorism, order forces, military
actions, social disorders, racism and asylum. (Source: Dow Jones Factiva). Immnews is the average number of news that contains
the worlds “immigrant” or “immigration” in English and in the most spoken languages per media outlet. (Source: Dow Jones Factiva)
Immposnews is the average number of news per media outlet that on immigration have been categorized by Dow Jones Factiva as
on sport, culture (book, film…) and social issue. (Source: Dow Jones Factiva). Disastertot is the number of killed and affected
people in disasters occurred in the considered country. (Source: EM CRED database). Disaster2 is a dummy that indicates whether
there has been a disaster (that satisfies the criteria mentioned in the text) in the country and year indicated (source: EM CRED
database). Totalolympsummer is the total number of medals won by the considered country during Olympic Games (source BBC
sport).

76
Table 20: Averages by country of variables for analysis of section 3
country immig immnews
Imm
contr
news
Imm pos
news
total
olympic
summer
disaster2 disasterkill disastertot
at 16.00 26.52 13.99 1.44 0.83 0.25 29 146
be 17.42 4.27 1.74 0.49 0.42 0.33 178 207
bg 4.67 1.76 1.19 0.03 1.89 0.33 3 1527
cy 7.67 . . . 0.00 0.00 0 0
cz 4.11 2.47 1.56 0.08 1.56 0.33 1 492
de 6.58 9.90 3.97 1.35 7.50 0.42 2 199
dk 23.92 15.22 5.10 2.11 1.25 0.08 0 173
ee 2.33 1.67 0.90 0.15 0.56 0.11 0 11
es 28.08 170.50 97.10 5.28 1.58 0.50 1259 1782
fi 6.08 . . . 0.50 0.08 0 33
fr 10.83 36.60 22.02 0.95 6.08 0.50 1741 4932
gr 5.17 6.89 6.07 0.00 1.67 0.42 16 855
hu 1.78 1.38 0.83 0.03 3.11 0.56 58 3746
ie 9.50 17.67 11.66 1.48 0.25 0.08 0 17
it 14.00 79.75 44.92 1.59 5.00 0.50 1675 1882
lt 7.22 6.11 3.30 0.13 0.89 0.00 0 0
lu 12.75 0.49 0.17 0.10 0.00 0.08 14 14
lv 4.11 3.68 2.62 0.15 0.78 0.00 0 0
mt 31.22 . . . 0.00 0.00 0 0
nl 12.75 10.90 6.99 0.12 3.17 0.17 164 164
pl 4.22 6.54 3.79 0.15 2.22 0.44 29 687
pt 2.42 21.53 13.09 0.44 0.42 0.33 0 12768
ro 2.67 2.29 1.83 0.08 3.00 0.89 18 14042
se 9.17 7.43 1.98 1.19 1.00 0.00 0 0
si 2.22 3.26 2.37 0.13 1.00 0.22 0 185
sk 1.78 1.59 1.14 0.01 1.33 0.22 1 1184
tk 1.67 80.15 45.18 2.03 2.00 0.89 2 8146
uk 32.92 36.74 22.24 1.48 6.42 0.50 27 31471
Total 10.38 23.01 13.06 0.90 1.99 0.29 210 3117
Source: Eurostat, Eurobarometer standard survey, Dow Jones Factiva database, EM-DAT: The OFDA/CRED International disaster
Database (www.em-dat.net - Université Catholique de Louvain - Brussels – Belgium).

77
Table 21: Results of country level analysis, equation (5), country and semester fixed effects
(1) (2)
COEFFICIENT immig immig
immcontrnews 0.129***
(5.971)
immposnews -0.591***
(-4.727)
immnews 0.0590***
(3.642)
Constant 13.11*** 14.14***
(8.989) (10.50)
Observations 259 259
R-squared 0.874 0.893
T-statistics in parentheses
*** p<0.01, ** p<0.05, * p<0.1
Note: Both semester and country fixed effects are used. Simple OLS model. Immig is the share of people answering "immigration"
to the Eurobarometer question on " What do you think are the two most important issues facing (OUR COUNTRY) at the moment?".
Immcontrnews is the average number of news on immigration per media outlet whose subjects have been categorized by Dow
Jones Factiva as on crimes, safety, terrorism, order forces, military actions, social disorders, racism and asylum. Immnews is the
average number of news on immigration per media outlet. Immposnews is the average number of news on immigration per media
outlet, categorized by Dow Jones Factiva as on sport, culture (book, film…) and social issues.
Table 22: Results of country level analysis, equation (5), country and year fixed effects (1) (2)
COEFFICIENT immig immig
Immcontrnews 0.132***
(6.109)
immposnews -0.623***
(-4.944)
Immnews 0.0611***
(3.765)
Constant 13.42*** 13.88***
(10.62) (12.42)
Observations 259 259
R-squared 0.866 0.873
Note: Both year and country fixed effects are used. Simple OLS model. Immig is the share of people answering "immigration" to the
Eurobarometer question on " What do you think are the two most important issues facing (OUR COUNTRY) at the moment?".
Immcontrnews is the average number of news on immigration per media outlet whose subjects have been categorized by Dow Jones
Factiva as on crimes, safety, terrorism, order forces, military actions, social disorders, racism and asylum. Immnews is the average
number of news on immigration per media outlet. Immposnews is the average number of news on immigration per media outlet,
categorized by Dow Jones Factiva as on sport, culture (book, film…) and social issues.
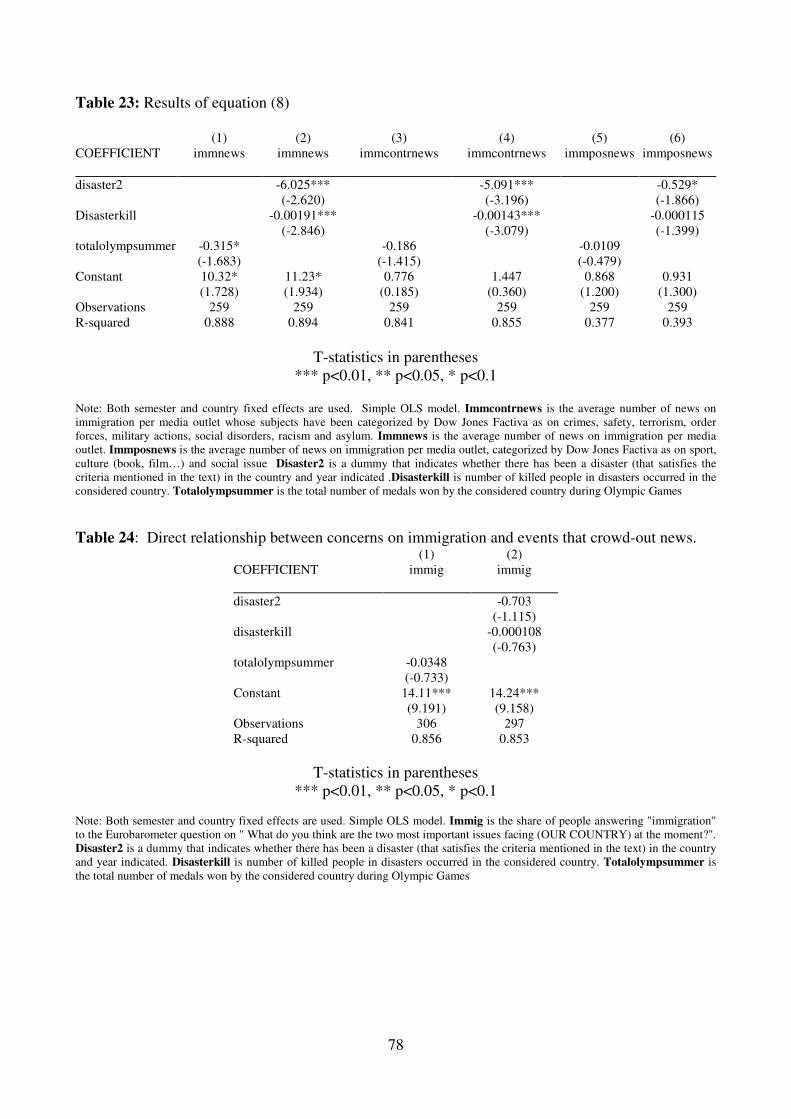
78
Table 23: Results of equation (8)
(1) (2) (3) (4) (5) (6)
COEFFICIENT immnews immnews immcontrnews immcontrnews immposnews immposnews
disaster2 -6.025*** -5.091*** -0.529*
(-2.620) (-3.196) (-1.866)
Disasterkill -0.00191*** -0.00143*** -0.000115
(-2.846) (-3.079) (-1.399)
totalolympsummer -0.315* -0.186 -0.0109
(-1.683) (-1.415) (-0.479)
Constant 10.32* 11.23* 0.776 1.447 0.868 0.931
(1.728) (1.934) (0.185) (0.360) (1.200) (1.300)
Observations 259 259 259 259 259 259
R-squared 0.888 0.894 0.841 0.855 0.377 0.393
T-statistics in parentheses
*** p<0.01, ** p<0.05, * p<0.1
Note: Both semester and country fixed effects are used. Simple OLS model. Immcontrnews is the average number of news on
immigration per media outlet whose subjects have been categorized by Dow Jones Factiva as on crimes, safety, terrorism, order
forces, military actions, social disorders, racism and asylum. Immnews is the average number of news on immigration per media
outlet. Immposnews is the average number of news on immigration per media outlet, categorized by Dow Jones Factiva as on sport,
culture (book, film…) and social issue Disaster2 is a dummy that indicates whether there has been a disaster (that satisfies the
criteria mentioned in the text) in the country and year indicated .Disasterkill is number of killed people in disasters occurred in the
considered country. Totalolympsummer is the total number of medals won by the considered country during Olympic Games
Table 24: Direct relationship between concerns on immigration and events that crowd-out news. (1) (2)
COEFFICIENT immig immig
disaster2 -0.703
(-1.115)
disasterkill -0.000108
(-0.763)
totalolympsummer -0.0348
(-0.733)
Constant 14.11*** 14.24***
(9.191) (9.158)
Observations 306 297
R-squared 0.856 0.853
T-statistics in parentheses
*** p<0.01, ** p<0.05, * p<0.1
Note: Both semester and country fixed effects are used. Simple OLS model. Immig is the share of people answering "immigration"
to the Eurobarometer question on " What do you think are the two most important issues facing (OUR COUNTRY) at the moment?".
Disaster2 is a dummy that indicates whether there has been a disaster (that satisfies the criteria mentioned in the text) in the country
and year indicated. Disasterkill is number of killed people in disasters occurred in the considered country. Totalolympsummer is
the total number of medals won by the considered country during Olympic Games

79
Table 25: Instrumental variable regression, equation (7) for first stage, equation (5) for second
stage, semester and country fixed effects
Second stage regression (1) (2)
COEFFICIENT immig Immig
immnews 0.0989*
(1.864)
immcontrnews 0.132**
(1.995)
Constant 12.68*** 13.61***
(8.585) (10.44)
Observations 259 259
R-squared 0.871 0.882
First stage regression (1) (2) (3)
COEFFICIENT immnews immcontrnews Immposnews
totalolympsummer -0.306* -0.175 -0.00929
(-1.677) (-1.384) (-0.441)
disaster2 -5.734** -4.924*** -0.520*
(-2.497) (-3.089) (-1.826)
disasterkill -0.00196*** -0.00146*** -0.000117
(-2.937) (-3.151) (-1.415)
Constant 10.61* 1.092 0.912
(1.831) (0.271) (1.268)
Observations 259 259 259
R-squared 0.896 0.856 0.394
Note: Both semester and country fixed effects are used. F statistic 6.56 for immnews as endogenous variable, 8 for immcontrnews
and 2.07 for immposnews. Immig is the share of people answering "immigration" to the Eurobarometer question on " What do you
think are the two most important issues facing (OUR COUNTRY) at the moment?". Immcontrnews is the average number of news
on immigration per media outlet whose subjects have been categorized by Dow Jones Factiva as on crimes, safety, terrorism, order
forces, military actions, social disorders, racism and asylum. Immnews is the average number of news on immigration per media
outlet. Immposnews is the average number of news on immigration per media outlet, categorized by Dow Jones Factiva as on sport,
culture (book, film…) and social issue. Disaster2 is a dummy that indicates whether there has been a disaster (that satisfies the
criteria mentioned in the text) in the country and year indicated .Disasterkill is number of killed people in disasters occurred in the
considered country. Totalolympsummer is the total number of medals won by the considered country during Olympic Games

80
Table 26: Instrumental variable regression, year and country fixed effects
Second stage regression (1) (2)
COEFFICIENT immig immig
Immnews 0.116*
(1.809)
immcontrnews 0.158**
(2.409)
Constant 12.70*** 13.79***
(8.667) (9.886)
Observations 259 259
R-squared 0.861 0.851
First stage regressiom (1) (2) (3)
COEFFICIENT immnews immcontrnews immposnews
totalolympsummer -0.191 -0.107 0.00146
(-1.239) (-0.993) (0.0772)
disaster2 -4.702** -4.191*** -0.451
(-2.054) (-2.632) (-1.612)
disasterkill -0.00161** -0.00119*** -0.000105
(-2.486) (-2.644) (-1.324)
Constant 16.19*** 5.347 1.107*
(3.207) (1.522) (1.794)
Observations 259 259 259
R-squared 0.891 0.848 0.384
Z- and t-statistics in parentheses
*** p<0.01, ** p<0.05, * p<0.1
Note: Both year and country fixed effects are used. F statistic for immcontrnews as endogenous variable is 8.67, for immnews is
4.84 and 1.96 for immposnews. Immig is the share of people answering "immigration" to the Eurobarometer question on " What do
you think are the two most important issues facing (OUR COUNTRY) at the moment?". Immcontrnews is the average number of
news on immigration per media outlet whose subjects have been categorized by Dow Jones Factiva as on crimes, safety, terrorism,
order forces, military actions, social disorders, racism and asylum. Immnews is the average number of news on immigration per
media outlet. Immposnews is the average number of news X on immigration by media outlet, categorized by Dow Jones Factiva as
on sport, culture (book, film…) and social issue. Disaster2 is a dummy that indicates whether there has been a disaster (that satisfies
the criteria mentioned in the text) in the country and year indicated .Disasterkill is number of killed people in disasters occurred in
the considered country. Totalolympsummer is the total number of medals won by the considered country during Olympic Games.
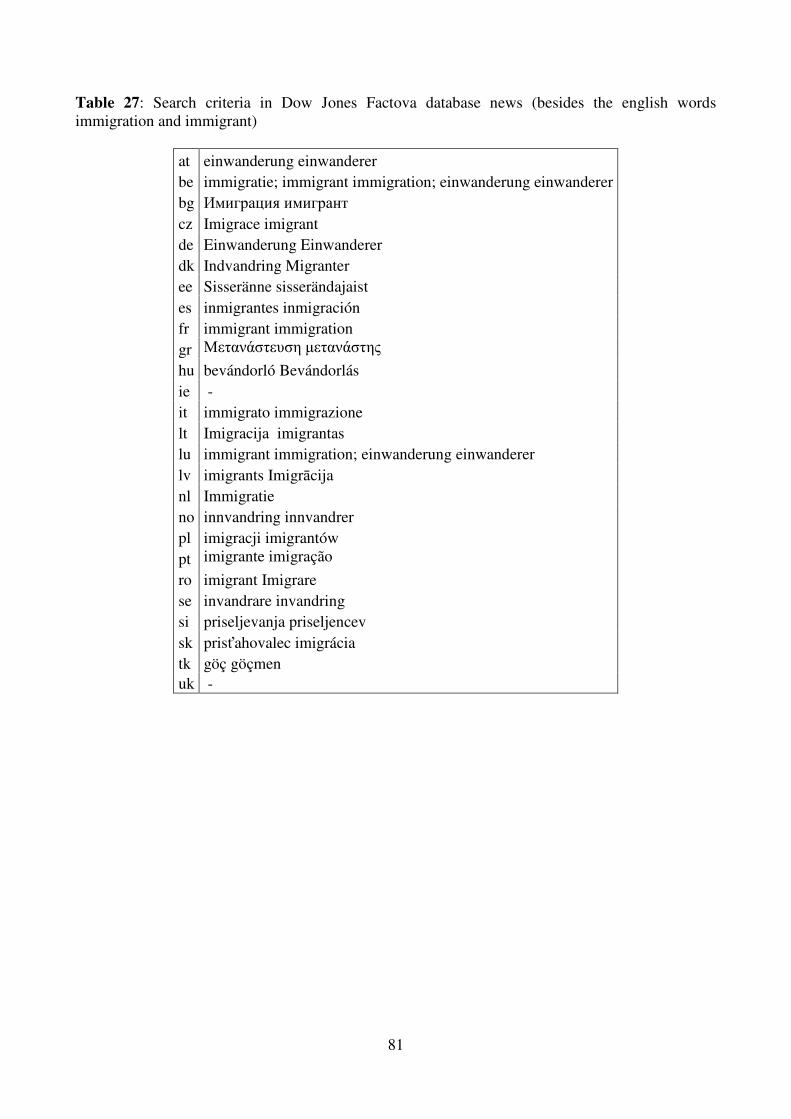
81
Table 27: Search criteria in Dow Jones Factova database news (besides the english words
immigration and immigrant)
at einwanderung einwanderer
be immigratie; immigrant immigration; einwanderung einwanderer
bg Имиграция имигрант
cz Imigrace imigrant
de Einwanderung Einwanderer
dk Indvandring Migranter
ee Sisseränne sisserändajaist
es inmigrantes inmigración
fr immigrant immigration
gr Μετανάστευση µετανάστης
hu bevándorló Bevándorlás
ie -
it immigrato immigrazione
lt Imigracija imigrantas
lu immigrant immigration; einwanderung einwanderer
lv imigrants Imigrācija
nl Immigratie
no innvandring innvandrer
pl imigracji imigrantów
pt imigrante imigração
ro imigrant Imigrare
se invandrare invandring
si priseljevanja priseljencev
sk prisťahovalec imigrácia
tk göç göçmen
uk -

82
Figure 1: relationship between the number of news on crimes related to immigration and the actual
number of crimes in Italy (2005-2009)
Source: Osservatorio di Pavia.
Figure 2: EU citizens’ concerns on immigration by semestres 2003-2008 (variable: immig)
Note: share of people answering that immigration is one of the two main concerns of their country at the moment.
Source: Eurobarometer standard survey

83
Figure 3: Average number of news on immigration per media outlet by semesters, by country and
year 2003-2008 (variable: immnews).
Source: Elaboration from Dow Jones Factiva database
Note: Immnews is the average number of news containing the words "immigration" or "immigrant" in English and in most spoken
languages per media outlet.
Figure 4: immigration news, by subjects. Average 2003-20081, by semester.
Source: author’s elaborations from Dow Jones Factiva database
Note: articles are considered safety/ criminality issues if Dow Jones Factiva inserted them in the categories: crimes, safety, terrorism,
security forces, civil disorders, racism. Articles are considered on asylum if Dow Jones Factiva inserted the in the categories asylum
and international relationships. Articles are considered on culture – free time issues if inserted in the categories: religion, arts, books,
school, social affairs, sports, travels, environment, and society.
1 For BG, CZ, HU, PL, RO, SI, SK, EE, LV, LT data is from the second half of 2004, not from the first half of 2003.

84
Figure 5: Odds ratio of foreign born population in prison and pro-immigration attitudes
Note: Average 2002-2004-2006-2008 when data are available. The relationship is positive but not significant at 10% level, .
Source: ESS, International Centre for Prison Studies (Kings college London), Council of Europe (ECRI).
Figure 6: odds ratio of foreign born population in prison and crime news related to immigrants.
Note: Average 2002-2004-2006-2008 when data is available. Correlation is negative (-33.98) not significant at 10% level .
Source: Dow Jones Factiva database, International Centre for Prison Studies (Kings college London), Council of Europe (ECRI).
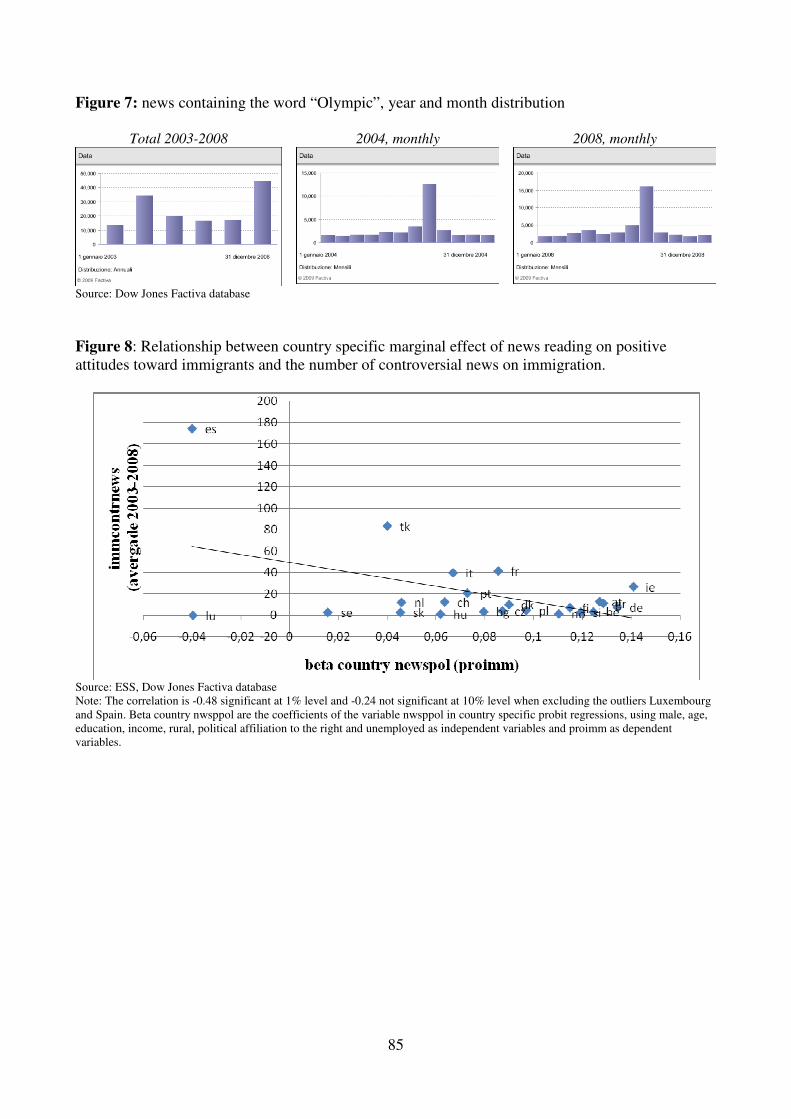
85
Figure 7: news containing the word “Olympic”, year and month distribution
Total 2003-2008 2004, monthly 2008, monthly
Source: Dow Jones Factiva database
Figure 8: Relationship between country specific marginal effect of news reading on positive
attitudes toward immigrants and the number of controversial news on immigration.
Source: ESS, Dow Jones Factiva database
Note: The correlation is -0.48 significant at 1% level and -0.24 not significant at 10% level when excluding the outliers Luxembourg
and Spain. Beta country nwsppol are the coefficients of the variable nwsppol in country specific probit regressions, using male, age,
education, income, rural, political affiliation to the right and unemployed as independent variables and proimm as dependent
variables.

86
Figure 9: Relationship between country specific marginal effect of news reading on attitudes
towards immigrants from poorer countries outside Europe and controversial news on immigration.
Source: ESS, Dow Jones Factiva database
Note: The correlation is -0.30 significant at 17% level and -0.36 significant at 12% level when excluding the outliers Luxembourg
and Spain. Beta country nwsppol are the coefficients of the variable nwsppol in country specific probit regressions, using male, age,
education, income, rural, political affiliation to the right and unemployed as independent variables and proimm2 as dependent
variables.
Figure 10: Time trends (2003-2008) of news on immigration, by subject.
Source: Elaborations from Dow Jones Factiva.
Note: These are the coefficients of the time trend in country specific regressions with respectively immnews, immcontrnews and
immposnews as dependent variables. Immcontrnews is the average number of news on immigration per media outlet whose subjects
have been categorized by Dow Jones Factiva as on crimes, safety, terrorism, order forces, military actions, social disorders, racism
and asylum. Immnews is the average number of news on immigration per media outlet. Immposnews is the average number of news
X on immigration per media outlet, categorized by Dow Jones Factiva as on sport, culture (book, film…) and social issue.