media release full year profit announcement...mineral resources has become one of the asx’s...
TRANSCRIPT

Page 1 | 4
Thursday, 22 August 2019
MEDIA RELEASE
Full Year Profit Announcement Mineral Resources Limited (ASX: MIN) (‘MRL’ or ‘the Company’) is pleased to announce its financial results for the full year ended 30 June 2019 (FY19) and to provide an update on initiatives carried out during the year as part of the Company’s strategy to become Australia’s leading integrated mining services provider. The Company generated normalised1 Earnings Before Interest, Tax, Depreciation and Amortisation (EBITDA) of $433 million for FY19. This was above guidance previously provided2 for FY19’s EBITDA of between $360 million to $390 million. Profit for the Company, after providing for income tax and non-controlling interest, amounted to $164 million. The Company’s Directors have declared a fully franked final dividend of 31.0 cents per share. During FY19, the Company delivered on a number of major initiatives including:
Execution of a transaction with Albemarle Corporation (NYSE: ALB, Albemarle) to sell 60% of the Wodgina Lithium Project and form a 60:40 unincorporated joint venture3, providing MRL the opportunity to participate in the lithium hydroxide market on an accelerated basis while preserving optionality for future capacity expansions. On completion of the transaction, Albemarle will pay the Company US$820 million and transfer a 40% interest in the first two 25,000 dry tonne per annum lithium hydroxide conversion units currently being built by Albemarle in Kemerton, Western Australia. This transaction remains subject to regulatory approvals and is expected to complete in calendar year 2019;
Significant investments for future growth, with capital outlays of more than $850 million on key projects including:
o The construction of world-class lithium mining and processing facilities at Wodgina and Mt Marion;
o Acquisition of additional equity in Mt Marion to take MRL’s stake to 50%4;
1 Normalised EBITDA has been derived by excluding from reported EBITDA of $386 million both a $42 million unrealised fair value loss on listed investments and a $4 million unrealised loss on the foreign exchange translation impact of the Company’s US$ denominated Bond 2 MIN ASX: 01 May 2019 3 MIN ASX: 01 August 2019 4 MIN ASX: 18 March 2019

Page 2 | 4
o Completion of the acquisition of the Koolyanobbing Iron Ore Project5,
allowing operations in the Yilgarn region to continue, and ramping up to a
current annual run rate of 7.5 million tonnes per annum;
o Expanded iron ore investment in the Pilbara region with the acquisition of the Kumina iron ore tenements6 and establishment of a 50:50 joint venture with Brockman Mining Limited in relation to the Marillana Iron Ore Project7;
o Achievement of substantial progress across the portfolio of innovation projects including:
- Production of five carbon fibre dump trays to date with two mobilised to Koolyanobbing during the year for on-site testing; and
- Successful commissioning of a pilot synthetic graphite plant; and
Completion of MRL’s inaugural US$700 million senior unsecured notes offering due
20278, representing an important financing milestone for MRL and aligning funding
with the long-term nature of our operations and capital investments.
MRL’s Managing Director Chris Ellison said, “This past year has been the most significant in our Company’s history as we set MRL up for long-term growth. The financial results for FY19 reflect our strategic decisions and investments to lay the foundations for a strong future and are a testament to the hard work and dedication of the entire MRL team. We continue to be focussed on maximising the value of our world-class lithium ore bodies and our iron ore operations, while the infrastructure and innovation initiatives we have been developing during the past three to five years will provide us with industry-changing mining services capabilities. MRL has entered FY20 well-positioned to create long-term shareholder value through the development of our world-class resource assets and increased annuity-style earnings from enhanced mining services offerings.” Operational highlights
Mining Services & Processing achieved 39% growth in EBITDA in the second half of
FY19 driven by the ramp up of Koolyanobbing and contributions from external
contracts;
Iron ore exports totalled 10.6 million wet tonnes (up 14% on FY18); and
Mt Marion spodumene operation shipped 378,000 wet tonnes (down 1% on FY18).
5 MIN ASX: 30 August 2018 6 MIN ASX: 22 October 2018 7 MIN ASX: 27 July 2018 8 MIN ASX: 24 April 2019

Page 3 | 4
Financial performance
Revenue and EBITDA for FY19 were lower than the previous corresponding period (pcp) in FY18, driven by:
The decision to halt DSO activities at the Wodgina Lithium Project in September 2018 in favour of higher-value beneficiation of spodumene concentrate for future periods; and
A temporary pause in mining activity in the Yilgarn region following the depletion of Carina in late FY18 with Koolyanobbing commencing operations only in September 2018 with its first shipment in December 2018. Despite this pause, iron ore provided strong returns in FY19 with volumes ramping up in the second half, supported by favourable pricing.
During the period, the Company invested heavily across a number of strategically important projects including the construction of a world-class spodumene concentrate plant and related site infrastructure at Wodgina and a processing plant upgrade at Mt Marion. Based on the Company’s dividend policy, which sees 50% of net profit after tax made available for distribution, the directors have resolved to distribute a fully franked final dividend of 31.0 cents per share for shareholders. The final dividend, together with the interim dividend of 13.0 cents per share, makes a total fully franked dividend for FY19 of 44.0 cents per share.
9 Comparison to pcp being FY18 10 Operating cash flow before interest and taxation
FY19 Comparison to pcp9
Revenue $1,512m ↓ 7%
EBITDA (reported) $386m ↓ 33%
EBITDA (normalised) $433m ↓ 14%
Net profit after tax (NPAT) (reported) $165m ↓ 39%
NPAT (normalised) $205m ↓ 24%
Diluted EPS (reported) 87cps ↓ 40%
Diluted EPS (normalised) 108cps ↓ 25%
Fully franked dividends (Interim and Final) 44cps ↓ 32%
Operating cash flow10 $269m ↓ 50%
Capex and investments $858m ↑ 140%
Net assets $1,380m ↑ 6%
Return on invested capital 9.7% ↓ 46%

Page 4 | 4
ENDS For investor enquiries: For media enquiries: Mark Wilson Peter Klinger Chief Financial Officer/Company Secretary Cannings Purple T: +61 8 9329 3600 T: +61 (0)411 251 540 E: [email protected] E: [email protected]
About Mineral Resources Mineral Resources Limited (ASX: MIN) is a Perth-based leading mining services provider, with a particular focus on the iron ore and hard-rock lithium sectors in Western Australia. Using technical know-how and an innovative approach to deliver exceptional outcomes, Mineral Resources has become one of the ASX’s best-performing contractors since listing in 2006. To learn more, please visit www.mineralresources.com.au.
ANNUAL FINANCIAL REPORT30 JUNE 2019
MINERAL RESOURCES LIMITEDABN 33 118 549 910
www.mineralresources.com.au

Mineral Resources Limited Appendix 4E Preliminary final report
1
1. Company details Name of entity: Mineral Resources Limited ABN: 33 118 549 910 Reporting period: For the year ended 30 June 2019 Previous period: For the year ended 30 June 2018
2. Results for announcement to the market $'000 Revenues from ordinary activities down 6.9% to 1,511,975 Profit from ordinary activities after tax attributable to the owners of Mineral Resources Limited
down
39.9%
to
163,669
Profit for the year attributable to the owners of Mineral Resources Limited down 39.9% to 163,669 Comments A commentary on the results for the period is contained within the Financial Report as well as the Media Release that accompanies this announcement.
3. Net tangible assets
Reporting
period Previous
period Cents Cents Net tangible assets per ordinary security 688.68 658.10
4. Dividends Cents Franked % $'000 2019 final dividend – declared 22 August 2019 31.00 100% 58,064 2019 interim dividend – paid 17 April 2019 13.00 100% 24,386 2018 final dividend – paid 27 September 2018 40.00 100% 75,015 2018 interim dividend – paid 8 March 2018 25.00 100% 46,796
Record date for determining entitlements to the 2019 final dividend 10 September 2019 Payment date for the 2019 final dividend 4 October 2019
Mineral Resources Limited Appendix 4E Preliminary final report
2
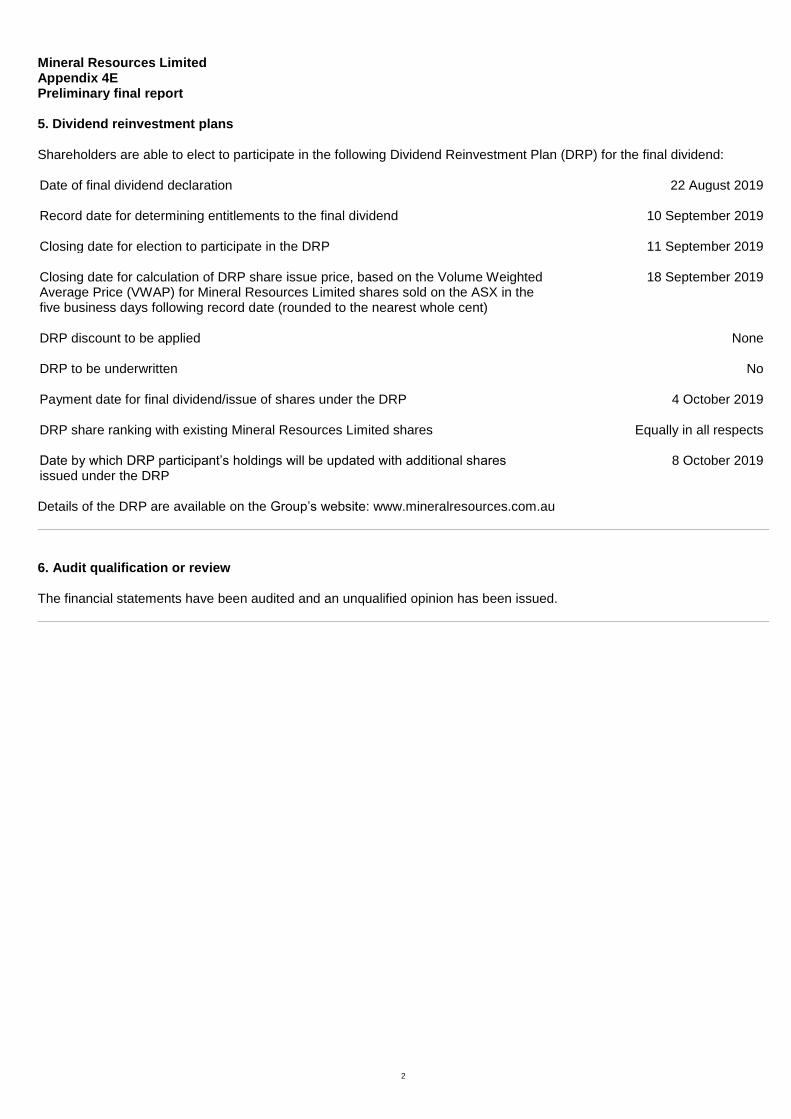
5. Dividend reinvestment plans Shareholders are able to elect to participate in the following Dividend Reinvestment Plan (DRP) for the final dividend: Date of final dividend declaration 22 August 2019 Record date for determining entitlements to the final dividend 10 September 2019 Closing date for election to participate in the DRP 11 September 2019 Closing date for calculation of DRP share issue price, based on the Volume Weighted Average Price (VWAP) for Mineral Resources Limited shares sold on the ASX in the five business days following record date (rounded to the nearest whole cent)
18 September 2019
DRP discount to be applied None DRP to be underwritten No Payment date for final dividend/issue of shares under the DRP 4 October 2019 DRP share ranking with existing Mineral Resources Limited shares Equally in all respects Date by which DRP participant’s holdings will be updated with additional shares issued under the DRP
8 October 2019
Details of the DRP are available on the Group’s website: www.mineralresources.com.au
6. Audit qualification or review The financial statements have been audited and an unqualified opinion has been issued.

Mineral Resources Limited Corporate directory 30 June 2019
3
Directors Peter Wade Chris Ellison Kelvin Flynn James McClements Tim Roberts (ceased 5 June 2019) Xi Xi Company secretaries Mark Wilson Derek Oelofse Registered office 1 Sleat Road Applecross WA 6153 P: + 61 8 9329 3600 F: + 61 8 9329 3601 Postal address: Locked Bag 3, Canning Bridge, Applecross WA 6153 Principal place of business 1 Sleat Road Applecross WA 6153 Share register Computershare Investor Services Pty Limited Level 11, 172 St Georges Terrace Perth WA 6000 P: + 61 8 9323 2000 F: + 61 8 9322 2033 www.computershare.com/au Auditor RSM Australia Partners Level 32 Exchange Tower 2 The Esplanade Perth WA 6000 P: + 61 8 9261 9100 F: + 61 8 9261 9111 www.rsm.com.au Bankers National Australia Bank 100 St Georges Terrace Perth WA 6000 www.nab.com.au Stock exchange listing Mineral Resources Limited shares are listed on the Australian Securities Exchange
(ASX: MIN) Website www.mineralresources.com.au

Mineral Resources Limited Contents 30 June 2019
4
Directors' report 5 Auditor's independence declaration 48 Statement of profit or loss and other comprehensive income 49 Statement of financial position 50 Statement of changes in equity 51 Statement of cash flows 52 Notes to the financial statements 53 Directors' declaration 104 Independent auditor's report to the members of Mineral Resources Limited 105
General information The financial statements cover Mineral Resources Limited as a group consisting of Mineral Resources Limited (referred to hereafter as the ‘Company’ or ‘parent entity’) and the entities it controlled at the end of, or during, the year (referred to hereafter as the ‘Group’). The financial statements are presented in Australian dollars, which is the Group's functional and presentation currency. Mineral Resources Limited is a listed public company limited by shares, incorporated and domiciled in Australia. Its registered office and principal place of business is: 1 Sleat Road Applecross WA 6153 A description of the nature of the Group's operations and its principal activities are included in the notes to the financial statements. The financial statements were authorised for issue, in accordance with a resolution of directors, on 22 August 2019.

Mineral Resources Limited Directors' report 30 June 2019
5
The directors present their report, together with the financial statements, for the Group for the year ended 30 June 2019.
Directors The following persons were directors of Mineral Resources Limited during the whole of the financial year and up to the date of this report, unless otherwise stated: Peter Wade Chris Ellison Kelvin Flynn James McClements Tim Roberts (ceased 5 June 2019) Xi Xi
Principal activities During the financial year, the principal continuing activities of the Group consisted of the integrated supply of goods and services to the resources sector.
Dividends Dividends paid during the financial year were as follows: Cents Franked % $'000 2019 final dividend – declared 22 August 2019 31.00 100% 58,064 2019 interim dividend – paid 17 April 2019 13.00 100% 24,386 2018 final dividend – paid 27 September 2018 40.00 100% 75,015 2018 interim dividend – paid 8 March 2018 25.00 100% 46,796
Review of operations Financial performance The Group generated normalised earnings before interest, tax, depreciation and amortisation (EBITDA) of $433 million for the financial year ended 30 June 2019 (FY19). This result was down $73 million (14%) on the prior corresponding period (pcp) and above FY19 guidance of $360 million to $390 million. Reported net profit after tax (NPAT) was $165 million, and this was down $107 million on pcp. Normalised EBITDA has been derived by excluding from reported EBITDA of $386 million both a $42 million unrealised fair value loss on listed investments (pcp was a $60 million fair value gain), and a $4 million unrealized loss on the foreign exchange translation impact of the Group’s US dollar denominated notes. Group revenue for the year ended 30 June 2019 was $1,512 million, and this was down $113 million (7%) on pcp. FY19 was a year of significant investment for the business with capital outlays totalling $858 million, up 140% on the pcp. Key investment projects included:
Development of Wodgina from a Direct Shipping Ore (DSO) operation into a higher value lithium spodumene operation. This involved the ceasing of DSO sales from Wodgina during FY19 in order to preserve the value of the resource, and the construction of a 750,000 dry tonne per annum spodumene concentrate plant along with significant associated site infrastructure;
Upgrade of the Mt Marion lithium project; and
Commencement of iron ore operations at Koolyanobbing, which by year end was operating at a production rate in excess of 6 million wet tonnes per annum.
These investments have positioned the Group for future growth and will strengthen its earnings base. Volatility in commodity prices saw lithium prices fall over the course of the year, while the Platts 62% Fines Index increased by 70% over the period. Despite the price volatility and the decision to halt DSO operations at Wodgina in favour of expansionary investment, the Group’s business model continued to deliver a strong result for investors, underpinned by the Mining Services operations.

Mineral Resources Limited Directors' report 30 June 2019
6
Operational performance Mining Services Mining Services EBITDA of $209 million was $51 million (20%) below pcp. EBITDA in the second half increased 39%, driven by the ramp up of the Koolyanobbing project following commencement of operations in September 2018, and by contributions from a number of external contracts. Mining Services revenue of $850 million (internal and external) was $35 million (4%) lower than pcp. Mining Services revenue and EBITDA were primarily impacted by:
Suspension of DSO operations at Wodgina resulting in a reduction of earnings for pit-to-port mining services;
A reduction in crushing volumes at Wodgina to 0.8 million wet tonnes, down 78.5% on pcp. The Wodgina crushing plant re-commenced operations by year end with the commissioning of the spodumene concentrate plant;
Delays in the Mt Marion upgrade project; and
A reduction in Iron Valley crushing volumes to 6.1 million wet tonnes, down 19% on pcp. Sales were not impacted as inventory levels were reduced during FY19.
Mining Commodity volumes and prices impacted the financial performance for FY19, including:
Favourable iron ore tonnes and pricing in the second half of FY19 resulted in strong returns despite the temporary pause in mining activity in the Yilgarn region of Western Australia. This pause saw mining activities at Carina cease in the latter half of FY18, with the commencement of mining activity at Koolyanobbing in September 2018 with its first shipment in December 2018. Operations ramping up to an annual run rate as at the date of this report of 7.5 million wet tonnes; and
Lithium volumes reduced in FY19 as Wodgina DSO operations ceased due to the spodumene development. The Group’s actual commodity export sales volumes in the period were as follows:
Commodity exports 1H FY18 2H FY18 Total FY18 1H FY19 2H FY19 Total FY19 ('000 wet metric tonnes) Utah Point Iron Valley 3,058 3,136 6,194 3,673 3,733 7,406 Wodgina 1,772 1,710 3,481 422 - 422
Total Utah Point 4,830 4,846 9,675 4,095 3,733 7,828 KBT2 Yilgarn 1,777 1,378 3,155 - - - Mt Marion 202 181 382 186 192 378
Total KBT2 1,979 1,559 3,537 186 192 378 Esperance Koolyanobbing - - - 292 2,864 3,156
Total Esperance - - - 292 2,864 3,156 Total Iron Ore 4,835 4,514 9,349 3,965 6,597 10,562 Total Lithium DSO 1,772 1,710 3,481 422 - 422 Total Spodumene 202 181 382 186 192 378
Total Commodity Exports 6,809 6,404 13,212 4,573 6,789 11,362
Note: volume shown for Mt Marion is 100%. MRL's ownership interest in this project increased from 43.1% to 50% on 18 March 2019.

Mineral Resources Limited Directors' report 30 June 2019
7
Iron Ore The Group operates two iron ore projects being Iron Valley and Koolyanobbing. Iron ore produced an EBITDA of $214 million, $187 million higher than pcp, reflecting increased tonnes shipped and higher prices following strong market conditions. Iron ore revenue of $954 million was $330 million (53%) higher on pcp. Iron ore exports in FY19 of 10.6 million wet tonnes were higher than pcp as a result of a 20% increase in the tonnes shipped from Iron Valley. Exports from Koolyanobbing in the Yilgarn were in line with that region’s pcp despite the temporary pause in activity as operations commenced and ramped up. The Group’s average iron ore price achieved for FY19 was A$90.4 per wet tonne, an increase of 35% on the pcp and a net 15% discount to Platts. This was driven by strong Platts pricing and a material narrowing of discounts in the second half of the year from 26% in the first half to 13% in the second half. The Platts 62% Fines Index (adjusted for moisture) averaged A$105.9 per wet tonne for FY19, an increase of 25% on pcp, reflecting strong market conditions. The Platts 62% Fines Index (adjusted for moisture) averaged A$88.4 per wet tonne in the first half and A$120.6 per wet tonne in the second half. Mt Marion Lithium Project The Mt Marion Lithium Project is operated by the Group under a life-of-mine mining services contract and is a joint project between the Group (50.0%) and one of the world’s largest lithium producers, Jiangxi Ganfeng Lithium Co. Ltd. (Ganfeng) (50.0%). As announced on 21 December 2018, Neometals Limited sold its share of 13.8% equally between the Group and Ganfeng, increasing each party’s share from 43.1% to 50.0% effective 18 March 2019. Mt Marion produced an EBITDA of $70 million for the Group, 39% up on pcp. This was mainly due to:
The achieved price for 6% and 4% spodumene products averaging A$1,044 per wet tonne for all tonnes exported, representing an increase of 19% on pcp;
Yields from mining activities improving in FY19, resulting in an increased proportion of the higher grade 6% spodumene exported at 72%, compared to 55% in pcp; and
Total sales volumes in FY19 being consistent with pcp at 378,000 wet tonnes, 1% lower on pcp. Pricing for Mt Marion is linked to international and Chinese domestic lithium carbonate and hydroxide prices rather than bilateral spodumene market prices. The 6% spodumene price for quarter four of FY19 was agreed at US$682 per dry tonne CFR China (the equivalent of US$659 per wet tonne), a 29% reduction in pricing on pcp. Wodgina Lithium Project The Wodgina Lithium Project is 100% owned and operated by the Group. Operations are managed under a life-of-mine mining services contract. Construction on the Wodgina spodumene concentrate plant and related infrastructure continued to progress in FY19, with the construction of train 1 and 2 complete and in the commissioning phase, and train 3 expected to be completed by end September 2019. As announced to the market on 14 December 2018 and subsequently amended on 1 August 2019, the Group is partnering with Albemarle Corporation (NYSE: ALB, Albemarle) to invest in the opportunity to participate in the lithium hydroxide market on an accelerated basis while preserving optionality for future capacity expansions. As part of this agreement, Albemarle will acquire a 60% interest in certain tenements, assets and related infrastructure comprising the Wodgina Lithium Project and on completion of the sale, form a 60:40 unincorporated joint venture with the Group. On completion Albemarle will pay the Group US$820 million and transfer a 40% interest in the first two 25,000 dry tonne per annum lithium hydroxide conversion units currently being built by Albemarle in Kemerton, Western Australia. This transaction remains subject to regulatory approvals and is expected to complete by 31 December 2019.

Mineral Resources Limited Directors' report 30 June 2019
8
Cash and capital management At 30 June 2019, the Group held cash and cash equivalents of $265 million, an increase from $240 million at 30 June 2018. In addition to its 30 June 2019 cash holdings, the Group has access to substantial undrawn debt facilities to support business development activities ($366 million as at 30 June 2019). On 23 April 2019, MRL completed its US$700 million senior unsecured notes offering due 2027, at an interest rate of 8.125% per annum. A portion of the net cash proceeds from the USD notes raising was used to refinance certain of the Group’s existing credit facilities. On 4 June 2019, MRL entered into a new $250m syndicated revolving credit facility, which was undrawn at financial year end. Completion of the Albemarle transaction is expected to result in the Group moving back to a net cash position. Net cash from operating activities before interest and tax of $269 million in FY19 was down $269 million on pcp, reflecting working capital outflow associated with increasing ore stockpile levels for the ramp up at Koolyanobbing during the year, as well as the buildup for commencement of spodumene concentrate production at Wodgina. Net cash used in investing activities in FY19 was $840 million, up $507 million on pcp, primarily relating to capital outlays totaling $858 million during the year on key investment projects including:
Construction of the Wodgina spodumene concentrate plant and related infrastructure;
Mt Marion beneficiation plant upgrade and related infrastructure;
Acquisition of Kumina tenements;
Innovation costs, including progressing the development and testing of Carbonart’s carbon fibre dump truck trays; and
Mining assets and stripping activity to support the Group’s commodity projects.
Notes
1. Includes capitalised finance charges of $22m. Forecast outturn capex excluding capitalised finance charges currently materially in line with $610m budget (MIN ASX: 24 July 2018)
2. Exploration and Mine Development per cash flow statement, less cost of investment in Kumina iron ore assets ($27m included above in Investments) 3. Supporting both current and growth projects 4. Other comprises: proceeds from PPE sales ($17m); purchase of shares under employee share plans (-$19m); amounts advanced to other parties (-$10m); amounts
received from joint operations ($7m), and proceeds from investment sales ($4m) 5. Inventory build at Koolyanobbing, together with trade receivables increase from higher iron ore sales volumes and prices 6. Primarily Kumina iron ore and RIM equity investments 7. Primarily mining assets purchased under Hire Purchase arrangements 8. Net debt excludes $26m of Hire Purchase debt included in assets held for sale to Albemarle
Consistent with the Group’s dividend policy and reflecting the reduction in earnings during the year, a fully franked final dividend of 31.0 cents per ordinary share has been declared for shareholders as at 22 August 2019 to be paid on 4 October 2019. Inclusive of the fully franked interim dividend of 13.0 cents per ordinary share paid in April 2019, total dividends declared in respect of FY19 amount to 44.0 cents per ordinary share.
Significant changes in the state of affairs There were no significant changes in the state of affairs of the Group during the financial year.
Mineral Resources Limited Directors' report 30 June 2019
9
Matters subsequent to the end of the financial year The following significant events have arisen since the end of the financial year. Dividend On 22 August 2019, the directors declared a final fully franked dividend for the year ended 30 June 2019 of 31.0 cents per share to be paid on 4 October 2019, a total estimated distribution of $58,064,000 based on the number of ordinary shares on issue as at 22 August 2019. Sale arrangements for the Wodgina Lithium Project On 26 July 2019, the Group announced that it had received unconditional approval from the China State Administration for Market Regulation (SAMR) for the binding Wodgina Sale Agreement with Albemarle Corporation (NYSE: ALB, Albemarle) as announced on 14 December 2018. On 1 August 2019, the Group announced that it had entered into revised arrangements with Albemarle. Under the revised arrangements, the Group will increase the interest in the Wodgina Lithium Project to be sold to Albemarle from 50% to 60% and Albemarle and MRL will form a 60:40 joint venture to operate the Wodgina Lithium Mine and battery grade lithium hydroxide production facilities. Albemarle will pay US$820 million in cash at closing and transfer a 40% interest in the first two lithium hydroxide conversion units currently being built by Albemarle in Kemerton, near Bunbury in Western Australia, which will be capable of processing spodumene produced at Wodgina. Purchase agreement for Parker Range Project On 21 August 2019, the Group announced that it had executed a binding heads of agreement with Cazaly Iron Pty Ltd (a wholly-owned subsidiary of Cazaly Resources Limited (ASX: CAZ, Cazaly) to purchase the assets that comprise the Parker Range Project in the Yilgarn region of Western Australia. The heads of agreement is conditional on MRL completing due diligence within 21 days; board approval of both parties; ministerial consent for the transfer of the tenements; and Cazaly shareholder approval as, and if, required. On completion, the purchase price payable by MRL to Cazaly Iron Pty Ltd for the assets is $20,000,000. MRL will also pay Cazaly Iron Pty Ltd a royalty of $0.50 for every dry metric tonne of iron ore extracted and removed from the area of the tenements payable after the first 10 million dry metric tonnes of iron ore have been extracted and removed from the area of the tenements. No other matter or circumstance has arisen since 30 June 2019 that has significantly affected, or may significantly affect the Group's operations, the results of those operations, or the Group's state of affairs in future financial years.
Likely developments and expected results of operations Information on likely developments in the operations of the Group and the expected results of operations have not been included in this report because the directors believe it would be likely to result in unreasonable prejudice to the Group.
Environmental regulation The Group is subject to and is compliant with all aspects of environmental regulation of its exploration and mining activities. The directors are not aware of any environmental law that is not being complied with.
Mineral Resources Limited Directors' report 30 June 2019
10
Information on directors Name: Peter Wade Title: Non-Executive Chairman Appointment: 27 February 2006 Qualifications: BE (Hons), LGE Experience and expertise: Peter has over 45 years of experience in engineering, construction, project
management, mining and infrastructure services. He started his career with the NSW Public Service managing the construction of significant infrastructure projects in NSW including the Port Kembla coal loader and the grain terminals at Newcastle and Wollongong and was also the Deputy Director for the Darling Harbour Redevelopment construction project. Following his period of employment with the NSW Public Service, Peter joined the executive team of the Transfield Group. Throughout the 1980s and 1990s he was General Manager of Sabemo Pty Ltd, Transfield Construction Pty Ltd, and Transfield Power Technologies and subsequently became Transfield Chief Operations Officer (Southern). During this period Peter was responsible for significant build, own, operate projects including the Melbourne City Link, the Airport Link, the Northside Storage Tunnel and the Collinsville and Smithfield Power Plants. Peter became Managing Director of Crushing Services International Pty Ltd and PIHA Pty Ltd in 1999, and subsequently Process Minerals International Pty Ltd in 2002 (now wholly owned subsidiaries of Mineral Resources Limited). He managed the companies through a sustained period of growth and development prior to the formation and listing of Mineral Resources Limited in 2006 at which time he was appointed Managing Director of the Group. He was subsequently appointed Executive Chairman in 2008 and Non-Executive Chairman in 2012.
Other current directorships: SRG Global Limited (ASX: SRG) Former directorships (last 3 years): None Special responsibilities: Chairman of Board of Directors Interests in shares: 336,815 Interests in options: None Name: Chris Ellison Title: Managing Director Appointment: 27 February 2006 Experience and expertise: Chris is the founding shareholder of each of the three original subsidiary companies of
Mineral Resources Limited (Crushing Services International Pty Ltd, PIHA Pty Ltd and Process Minerals International Pty Ltd) and has over 36 years of experience in the mining contracting, engineering and resource processing industries. In 1979, Chris founded Karratha Rigging and was Managing Director until its acquisition by Walter Wright Industries in 1982. Chris was subsequently appointed as the General Manager, Walter Wright Industries for the Western Australia and Northern Territory regions. In 1986, Chris founded Genco Ltd and following two years of considerable growth, Genco Ltd merged with the Monadelphous Group in 1988. In September 1988, receivers and managers were appointed to the Monadelphous Group. At this time, Chris was appointed the Managing Director and under his careful management, Monadelphous Group successfully traded out of its financial difficulties and eventually relisted on the ASX in late 1989. In 1992, Chris founded PIHA Pty Ltd, a company focused on the provision of specialised pipe lining and general infrastructure.
Other current directorships: Mesa Minerals Limited (ASX: MAS) Former directorships (last 3 years): None Special responsibilities: Managing Director Interests in shares: 22,032,591 Interests in options: None

Mineral Resources Limited Directors' report 30 June 2019
11
Name: Kelvin Flynn Title: Independent Non-Executive Director Appointment: 22 March 2010 Qualifications: B Com, CA Experience and expertise: Kelvin is a qualified Chartered Accountant with over 28 years’ experience in investment
banking and corporate advisory roles, including private equity and special situations investments in the mining and resources sector. He has held various leadership positions in Australia and Asia, having previously held the position of Executive Director/Vice President with Goldman Sachs and Managing Director of Alvarez & Marsal in Asia. He has worked in complex financial workouts, turnaround advisory and interim management. Kelvin is the Managing Director of the specialist alternative funds manager Harvis, which focuses on investments in the real estate and real assets sectors. Kelvin is currently a Director of privately held Global Advanced Metals Pty Ltd and a Non-Executive Director of Silver Lake Resources Limited.
Other current directorships: Silver Lake Resources Limited (ASX: SLR) Former directorships (last 3 years): None Special responsibilities: Chair of Audit Committee
Member of Nomination Committee Member of Remuneration Committee
Interests in shares: 11,566 Interests in options: None Name: James McClements Title: Lead Independent Non-Executive Director Appointment: 29 May 2015 Qualifications: B Econ (Hons) Experience and expertise: James has 35 years’ experience in the mining industry as a banker and fund manager
financing projects globally. He was raised and educated in the Pilbara region of Western Australia and began his professional career with BHP Limited before joining Standard Chartered Bank in Perth and N.M. Rothschild & Sons in Sydney then Denver. James also spent 11 years in the USA and co-founded Resource Capital Funds during that time. James is currently the Managing Partner of Resource Capital Funds (RCF) and has extensive Board experience having served as a Director of 12 RCF portfolio companies.
Other current directorships: None Former directorships (last 3 years): None Special responsibilities: Member of Audit Committee
Member of Nomination Committee Chair of Remuneration Committee
Interests in shares: 11,566 Interests in options: None

Mineral Resources Limited Directors' report 30 June 2019
12
Name: Tim Roberts Title: Independent Non-Executive Director Appointment: 17 November 2016 Ceased: 5 June 2019 Experience and expertise: Tim played a key role in the transformation of Multiplex, one of the nation’s largest
privately owned companies established by John Roberts in 1962, from a construction contractor into a broadly based property group with operations spanning property development and investment, facilities management, and property funds management. He was also an executive director of Multiplex Group from 2003 until 2007, when the Roberts family sold its remaining interests in Multiplex to Brookfield Asset Management Inc. Since 2007, Tim, through his family office, has established a private investment group that is significant and diverse, both domestically and internationally, with interests in private and listed equities, hedge funds, infrastructure, property, aviation, fishing and aquaculture. Tim has served as a board member of Crown Resorts Pty Ltd, the owner of Crown Casino and hotels in Western Australia. Tim is a Patron of the Perth Symphony Orchestra; a member of the Board of Trustees of the Telethon Institute; and Patron of the North Cottesloe Surf Lifesaving Club.
Other current directorships: None Former directorships (last 3 years): None Special responsibilities: Member of Audit Committee (1 July 2018 to 5 June 2019)
Member of Remuneration Committee (1 July 2018 to 5 June 2019) Chair of Nomination Committee (1 July 2018 to 5 June 2019)
Interests in shares: None Interests in options: None Name: Xi Xi Title: Independent Non-Executive Director Appointment: 11 September 2017 Experience and expertise: Xi Xi has extensive experience in the global natural resources sector having served as
a director of Sailing Capital, a US$2 billion private equity fund founded by the Shanghai International Group in 2012. She has worked with numerous Chinese state owned and privately-owned enterprises, advising on international acquisitions and investments overseas. Xi Xi has previously served as an analyst and portfolio manager for the Tigris Financial Group in New York, focused in the oil and gas and mining sector. Xi Xi currently serves as a non-executive director of Zeta Resources, a closed-end investment company with a broad portfolio of oil and gas, as well as mining assets. Xi Xi has an MA in International Relations (China Studies & International Finance) from Johns Hopkins University, and holds a double BS in Chemical Engineering & Petroleum Refining, as well as Economics, from the Colorado School of Mines.
Other current directorships: None Former directorships (last 3 years): Galaxy Resources Limited (ceased 11 September 2017) Special responsibilities: Member of Nomination Committee (Member 1 July 2018 to 5 June 2019 and Chair from
6 June 2019) Interests in shares: 10,186 Interests in options: None 'Other current directorships' quoted above are current directorships for listed entities only and excludes directorships of all other types of entities, unless otherwise stated. 'Former directorships (in the last 3 years)' quoted above are directorships held in the last 3 years for listed entities only and excludes directorships of all other types of entities, unless otherwise stated. 'Interest in shares' quoted above are as at the date of this report.

Mineral Resources Limited Directors' report 30 June 2019
13
Company secretaries Mark Wilson joined Mineral Resources Limited as Chief Financial Officer in August 2018. Mark is an experienced senior executive with a strong track record in development and implementation of business strategy, balance sheet management, organisational design, project management, and transaction execution. Mark has held senior positions in a number of Australian and international companies, including Laing O’Rourke, Multiplex and Brookfield Multiplex, where he led Multiplex’s listing on the ASX. Mark holds a Bachelor of Commerce (Finance) and Bachelor of Laws from the University of New South Wales, and has a Graduate Diploma in Applied Finance and Investment from the Securities Institute of Australia (FINSIA). Derek Oelofse has over 35 years financial and commercial management experience in large private, governmental and listed entities based within Australia, South Africa and the United Kingdom. Derek has a Bachelor of Accounting and Bachelor of Commerce degree from the University of the Witwatersrand in South Africa, a Master of Business Administration from Henley Management College in the United Kingdom, and is a Fellow of the Institute of Chartered Accountants Australia and New Zealand. Derek joined Mineral Resources Limited in 2012 as Group Financial Controller and was appointed joint Company Secretary on 4 October 2018.
Meetings of directors The number of meetings of the Company's Board of Directors (the Board) and of each Board committee held during the year ended 30 June 2019, and the number of meetings attended by each director were: Full Board Audit Committee Remuneration Committee Nomination Committee Attended Held Attended Held Attended Held Attended Held
Peter Wade 16 16 n/a n/a n/a n/a n/a n/a Chris Ellison 16 16 n/a n/a n/a n/a n/a n/a Kelvin Flynn 14 16 3 3 3 3 3 3 James McClements 13 16 3 3 3 3 3 3 Tim Roberts* 14 16 3 3 2 3 3 3 Xi Xi 14 16 n/a n/a n/a n/a 3 3
*Ceased 5 June 2019.

Mineral Resources Limited Directors' report 30 June 2019
14
Letter from the Remuneration Committee Chair
Dear Shareholder,
I am pleased to present the 2019 Financial Year Remuneration Report (Remuneration report) for Mineral Resources
Limited (MRL or the Company).
The 2019 Financial Year (FY19) has been a very successful year for the Company, as we continued to invest for the
future. We progressed the development of our world-class lithium portfolio, with significant investment into our Wodgina
project. In December, we announced an agreement with Albemarle Corporation, one of the world’s largest lithium
companies, to form a joint venture to develop the Wodgina Lithium Project further. We continued to grow our Mining
Services business, and expanded our iron ore business by commencing operations at Koolyanobbing. We also ensured a
strong financial platform for continued growth with a debut 8 year unsecured notes offering in the United States. Our
business model continued to demonstrate its resilience in the face of volatile lithium and iron ore prices at various times
through the year.
The Remuneration Committee has reviewed in detail the remuneration practices of the Company. This followed the
Company receiving a “strike” against its FY18 remuneration report. We actively engaged with shareholders and proxy
advisors while working with multiple third party advisors to ensure we understood in detail the concerns that prompted the
“strike”. Having listened and gathered substantial data, we have responded by implementing major remuneration policy
changes for our next financial year, FY20. We have also sought to respond to feedback for better remuneration report
clarity.
The major changes developed for FY20 also have regard to an increasingly tight labour market within the Western
Australian resources industry. We trust that the changes to be introduced in FY20 will be considered a significant step in
the right direction and we expect that we will continue to make changes in coming years to reflect best practices in the
industry.
Investor feedback on FY18 remuneration
With the help of external specialists and following the 2018 AGM, the Company has sought to engage extensively with a
selection of shareholders and with proxy advisors to understand fully the issues that led to a “strike” in 2018.
Feedback received in relation to the FY18 remuneration report recognised:
The strong financial results of the Company delivered over many years;
The outstanding shareholder value created for investors over that period;
Alignment of the Company’s remuneration structure with these results; and
That the key financial measure of Return on Invested Capital (ROIC) was appropriate for the Long Term Incentive
(LTI) plan.
However, we were also told that:
Greater clarity regarding the strengths of the remuneration structure was required;
The Managing Director’s remuneration, particularly his Fixed Annual Remuneration (FAR) was too high;
The weight allocated to financial KPIs within the Short Term Incentive (STI) scheme was too low, particularly for
the Managing Director; and
The LTI plan:
o Was too narrowly focused on performance in the year of grant;
o Was subject to retesting at hurdle rates below those used to determine the initial grant; and
o Contained one single absolute measure being Return on Invested Capital (ROIC) and that some investors
preferred to have more than one measure.

Mineral Resources Limited Directors' report 30 June 2019
15
Company responses to investor feedback and a strategic review of remuneration policy
The Board has resolved to amend executive remuneration arrangements with effect from FY20 in response to this
feedback. These amendments are also intended to ensure strong alignment with the long-term interests of shareholders.
Changes are set out in detail in this report and include changes to the remuneration arrangements of both the Managing
Director and the other executive Key Management Personnel (KMP), as well as a redesign of the mechanics of the LTI
plan.
Changes to Managing Director remuneration
In particular, I note that the Managing Director has offered to reduce his FAR to $1.2 million from $1.5 million from FY20.
The Board has agreed to this change, despite the ongoing strategic and financial success of the Company.
This change reflects shareholder feedback preferring the Managing Director’s FAR to be closer to the median of a peer
group of comparable companies (rather than at the 75th percentile as had previously been decided), with higher levels of
remuneration ‘at risk’ and able to be earned only through performance.
Analysis also showed that the STI opportunity offered to KMP was below that offered elsewhere. As a consequence, in
FY20 the STI opportunity for KMP will increase and a significant portion will be settled in equity and deferred over two
years. Combined, these changes will mean all KMP will have a greater proportion of ‘at-risk’ pay as part of their total
remuneration opportunity.
In addition to the change in his FAR, the Managing Director’s STI Key Performance Indicators (KPIs) have been
reweighted such that financial KPIs contribute to 40% of scorecard outcomes, up from 25%, and his STI restructured to
enable stretch performance at up to 100% of FAR.
Changes to LTI arrangements Feedback from investor discussions suggested that the intent of our LTI scheme was appropriate, that is, to align the interest of participants with those of shareholders and focus attention on generating attractive returns on capital. We had conflicting feedback regarding the reliance on a single measure with some wishing to see a Total Shareholder
Return (TSR) measure (absolute or relative) added to the calculation, but a substantial portion of shareholders argued
against the use of TSR and preferred the retention of ROIC as a sole measure. We have decided for now to retain the
focus on ROIC as the key driver of execution of our business strategy and feel there is strong alignment with shareholders
given the high level of equity ownership within the ranks of the directors and executives.
As noted above, investors also called for a simplification of the LTI plan. After a review of alternative structures, the Company has decided to implement changes in the LTI arrangements from FY20 through the adoption of a new scheme. The new scheme will see grants made to participants annually that will vest after four years, subject to the Company’s average ROIC through that period. This approach is simpler and more consistent with common practice than our existing LTI scheme, without changing the intent of generating strong returns for shareholders over the long term. The Board also reviewed the ROIC hurdle rates for vesting of LTI opportunity and following analysis of the Company’s cost
of capital, its historic performance and that of peers, has decided to maintain the existing challenging threshold of 12% for
any shares to vest and 18% for full vesting for the FY20 grant. These hurdles will be reviewed annually before any new
grant is made, recognising the long-term cyclical nature of our business.
Changes to STI arrangements
As noted above, the Company has identified that the current level of STI opportunity offered to KMP is well below the
average offered at comparable peers. In FY20, the maximum STI opportunity for the Managing Director will be increased
from 50% to 100% of his Fixed Annual Remuneration (FAR), and for other KMP from 40% of their FAR to 80%.

Mineral Resources Limited Directors' report 30 June 2019
16
In addition, from FY20 any amounts declared under the STI programme above 50% of FAR for the Managing Director and
40% of FAR for other KMP will be settled in equity that will be released over the following two years, subject to ongoing
service.
Retention of key executives
Retention of key executives has become a significant business risk for the Company, as a result of a period of increased
activity within the resources sector.
The Board has considered a number of alternatives to address this risk. It has determined to make an allocation of equity
to executives identified as crucial to the organisation’s performance. While the arrangements will differ by individual
employee, any such grant would vest subject to continuous service over four or more years, and be no more than 30% of
the employee’s FAR at the date of grant. Only one grant would be made over the service period.
Some members of the KMP, but not the Managing Director, will participate in this programme. Where applicable, amounts
awarded under this programme will be disclosed in the FY20 Remuneration Report.
FY19 outcomes and alignment
As noted above FY19 has been a significant year for the Company for a number of reasons, including the substantial
investment made in the development of Wodgina, and the strategically significant deal reached with Albemarle.
Achievements during the year see the Company positioned very well for future growth on a number of fronts.
The majority of at-risk rewards available under the Company’s remuneration structure come through the LTI plan, which is
based on the Company’s ROIC performance. Over the year, the Invested Capital of the Company for the purposes of this
formula increased from $1.3 billion to $2.3 billion as a result of the significant investment made. The Company calculates
ROIC using a year-end number for capital and on this basis, the FY19 ROIC was below 12%. As a result, no LTI grant will
be made with respect to the FY19 Assessment Year, with the potential loss to KMP in aggregate over $3.7 million.
Separately, the FAR for the Managing Director was unchanged during FY19, while the remaining executive KMP were all
appointed during the year. Rewards made to the KMP under the STI plan were on average 79% of the maximum, reflecting
strategic and operational outcomes of the year. Further detail of these outcomes can be found in Section 5 of the
Remuneration Report. Finally, no changes were made to non-executive remuneration during FY19.
In conclusion, we are satisfied that the FY19 remuneration outcomes reflected short-term strategic and financial
performance. However, we have acted to amend remuneration from FY20 to ensure an appropriate focus on sustainable
long-term performance in accord with our business strategy and industry pressures, while reflecting the need for simplicity,
transparency, governance, and fairness, and responding to investor feedback.
As indicated by our response to last year’s remuneration report, we value your feedback. I invite you to review the full
report and thank you for your interest.
Yours faithfully
James McClements Lead Independent Non-Executive Director Chairman, Remuneration Committee

Mineral Resources Limited Directors' report 30 June 2019
17
Remuneration report (audited)
This Remuneration Report forms part of the Directors’ Report for the year ended 30 June 2019 and has been audited in accordance with section 300A of the Corporations Act 2001.
The report addresses the following key areas:
1. Key Management Personnel
2. Remuneration governance
3. Remuneration strategy
4. Remuneration framework
5. Remuneration outcomes for FY19
6. KMP remuneration schedules
7. Key changes to remuneration for FY20
8. Summary of KMP employment conditions
9. Shareholdings
10. Transactions with related parties

Mineral Resources Limited Directors' report 30 June 2019
Remuneration report (audited) (continued)
18
1. Key Management Personnel
Key Management Personnel (KMP) comprise those persons that have responsibility, authority and accountability for planning, directing and controlling the activities of the entity, directly or indirectly, including any director of that entity. In this report, a reference to an “Executive" or "Executives” is a reference to a KMP executive, including the Managing Director. The following table outlines the KMP of the Group during the whole of FY19 and up to the date of this report, unless otherwise stated: Executive KMP
Current
Chris Ellison Managing Director
Mike Grey Chief Operating Officer – Mining Services (Appointed as COO – Mining Services on 6 May 2019)
Rohan O’Grady Chief Operating Officer – Construction (Commenced as COO – Construction on 3 September 2018)
Mark Wilson Chief Financial Officer (Commenced as CFO 27 August 2018)
Former
Danny McCarthy Chief Operating Officer (Ceased employment on 30 November 2018)
Scott Winter Chief Operating Officer – Mining (Commenced as COO – Mining on 9 October 2018 and ceased employment on 18 June 2019)
Bruce Goulds Chief Financial Officer (Retired as CFO 6 December 2018)
Non-Executive KMP
Current
Peter Wade Non-Executive Chairman
Kelvin Flynn Non-Executive Director
James McClements Lead Independent Non-Executive Director
Xi Xi Non-Executive Director
Former
Tim Roberts Non-Executive Director (Resigned 5 June 2019)
2. Remuneration governance
2.1 Remuneration Committee Independence
The Remuneration Committee continued to be comprised solely by independent Non-Executive Directors:
James McClements, Committee Chair
Kelvin Flynn, Committee Member
Tim Roberts, Committee Member (resigned 5 June 2019)

Mineral Resources Limited Directors' report 30 June 2019
Remuneration report (audited) (continued)
19
2.2 Role of the Remuneration Committee
The Remuneration Committee advises the Board on KMP remuneration by performing the following functions:
(a) making recommendations on remuneration structure, practices and policy to the Board;
(b) determining the pool of available funds that the Board and management may distribute to participants in the short-
term incentive (STI) plan provided those individuals have achieved their agreed KPIs; and
(c) determining the eligibility and vesting of long-term incentive (LTI) awards.
The Remuneration Committee convened regularly throughout FY19 and invited senior management and external
consultants’ input as required. This is not reflected in the number of formal meetings reported.
2.3 External and independent advice
As with previous years, the Remuneration Committee engaged the services of independent external consultants to provide
insights on KMP remuneration trends, regulatory and governance updates and market data.
No remuneration recommendations as defined in Section 9B of the Corporations Act 2001 were obtained during FY19.
2.4 Change in accounting approach for Share Based Payments
In FY17 and FY18, the value of share based payments was shown as the full face value of shares granted under each of
FY17 and FY18’s LTI plan. This has been changed in FY19 to comply with AASB 2 ‘Share Based Payments’, so that the
cost of equity-settled transactions is measured at fair value on grant date and recognised as an expense with a
corresponding increase in equity over the vesting period. The cumulative charge to profit or loss is calculated based on the
grant date fair value of the award, the best estimate of the number of awards that are likely to vest and the expired portion
of the vesting period. The amount recognised in profit or loss and disclosed as remuneration for KMPs’ Share Based
Payments for the period is the cumulative amount calculated at each reporting date less amounts already recognised in
previous periods.
The effect of this change is shown at Table 6.2.
3. Remuneration strategy
3.1 The context in which we set our remuneration strategy
The Company’s remuneration policy is designed to attract and retain directors and executives qualified to add value for our shareholders and reward executives for the delivery of our vision and purpose in line with our core values. The remuneration framework is structured to promote long-term sustainable growth of the Company by the delivery of a significant portion of remuneration in equity, aligning the senior leadership team with shareholders. The outcomes of the remuneration framework will help achieve the Company’s vision to be recognised as a great Australian company that:
is a leading provider of innovative and sustainable mining services;
provides innovative and low cost solutions across the mining infrastructure supply chain;
operates with integrity and respect; and
works in partnership with our clients, our customers, our people and our community to achieve these objectives.
To create wealth for shareholders, we task our management team with employing the capital entrusted to them to sustain attractive rates of return, i.e. exceeding the long-term returns that could be achieved elsewhere at comparable levels of risk.

Mineral Resources Limited Directors' report 30 June 2019
Remuneration report (audited) (continued)
20
The Board has approved a strategy to deliver on this objective comprising:
a core business as a mining services contractor;
an owner and operator of mining related infrastructure;
an acquirer of significant profit share stakes in mineral projects with rights to operate the associated mines, for
longer-term sustainability, higher capital efficiency and lower risk;
recycling of capital; and
a flexible balance sheet to fund organic growth to its mining services and mining infrastructure businesses, while
retaining a level of agility for opportunistic growth opportunities as they arise.
The ability to execute this strategy in a way that creates attractive returns for shareholders is highly dependent on the quality of MRL’s management and workforce.
More generally, MRL is now operating in a market with notably increased demand for executives at all levels. This increases the importance of ensuring there are adequate and effective retention mechanisms in place.
3.2 Remuneration principles
Given the above, the following principles guide the Company’s KMP remuneration decisions:
fairness and equity;
transparency;
promotion of a direct linkage between reward and performance;
encouraging retention of key personnel over the longer term;
alignment to promote mutually beneficial outcomes between employee, customer and shareholder interests;
incentivise behaviour that optimises the return on invested capital by rigorous project selection and management practices;
flexibility to optimise returns on capital by accommodating varying levels of investment and time horizons for returns to be achieved; and
maintenance of the MRL culture and behaviours to promote innovation, safety, risk management, and social and environmental responsibility.
3.3 Market position for remuneration
As part of its review of remuneration practices for KMP during the year, the Company conducted a review of its market position for KMP remuneration that included examination of common practice within comparable businesses, external advice and input from investors and their advisors.
As a result of this review, for FY20 and in following years, fixed remuneration for KMP will be targeted at the 50th percentile of comparable roles, taking into account the experience and skills of the manager involved, while total remuneration, inclusive of fixed and at-risk remuneration, will be targeted up to the 75th percentile of comparable roles.
As a consequence, the remuneration positioning for the Managing Director that previously included fixed remuneration targeted at the 75th percentile, has been revised down towards the median.
Each of the balance of the KMP was recruited into the business during FY19 and their remuneration recognises their particular skills, experience and capability.

Mineral Resources Limited Directors' report 30 June 2019
Remuneration report (audited) (continued)
21
Comparator businesses
The Company’s business model differs from others in the resources sector. Therefore, in determining the amount and mix of remuneration to offer, the Board considers remuneration on offer in a broad group of ASX-listed companies of a comparable size in terms of enterprise value and revenue with a particular focus on those in the commercial services and mining sectors. The comparator group adopted currently comprises:
ALS Limited Ausdrill Limited Downer EDI Limited
Evolution Mining Limited Iluka Resources Limited Independence Group NL
Maca Limited New Hope Corporation Limited Newcrest Mining Limited
Northern Star Resources Limited OceanaGold Corporation Limited OZ Minerals Limited
Regis Resources Limited Resolute Mining Limited Saracen Mineral Holdings Limited
Sims Metal Management Limited Whitehaven Coal Limited WorleyParsons Limited
4. Remuneration framework
4.1 Remuneration framework
The table below outlines the remuneration framework that applied in FY19.
Fixed remuneration
At-risk remuneration
Element Salary, superannuation &
other fixed benefits
Short-Term Incentive (STI) Long-Term Incentive (LTI)
Format Cash Cash Share rights
Performance measures
Personal, business unit and corporate KPIs
Return on Invested Capital (ROIC)
Performance period
One year Over 4 years (a):
Initial grant based on 1 year ROIC (the Award Year)
Subsequent vesting subject to ROIC performance over the following 3 financial years (Assessment Years)
Link to MRL strategy
Serves to attract and motivate high calibre people to deliver on the business’ immediate business
objectives over a 12 month period
Recognises that we are a capital intensive business and management and shareholder wealth are created through achieving superior returns on capital deployed
(a) Vesting subject to sustained average ROIC at or above 12% for the Award Year and in average over the Performance Years

Mineral Resources Limited Directors' report 30 June 2019
Remuneration report (audited) (continued)
22
The timeline below illustrates how the components of KMP remuneration for FY19 will be delivered to the KMP. Details for each component are set out in section 4.3.
FY19 FY20 FY21 FY22 FY23
FAR (Salary, superannuation & fixed benefits)
Paid throughout the year
STI
Performance period
(12 months)
Paid Aug 2019
LTI
Total Performance period (4 years)
Grant performance
period (12 months)
(Award Year) (a)
Performance period (Performance Years)
Total vesting period (4 years)
1/3rd vested Aug
2020(b) 1/3rd vested Aug
2021(b) 1/3rd vested Aug 2022(b)
Holding lock on all vested LTI to August 2022 (a) As FY19’s ROIC is less than 12% there is no LTI award for FY19
(b) Vesting subject to sustained average ROIC at or above 12% for the Award Year and in average over the Performance Years.

Mineral Resources Limited Directors' report 30 June 2019
Remuneration report (audited) (continued)
23
4.2 Remuneration mix
The mix of executive KMP fixed, short and long-term remuneration reflects the Company’s remuneration strategy of holding substantial amounts of pay subject to service and performance so that it can only be maximised by sustained high levels of performance over rolling 4 year periods.
The table below summarises the ‘on-target’ and maximum remuneration mix applicable in FY19 for KMP.
4.3 Key components of remuneration
The tables below summarise the key components of executive KMP remuneration for FY19.
Fixed Annual Reward
Composition Fixed Annual Reward (FAR) comprises salary, superannuation and other fixed elements of remuneration such as vehicle allowances.
Determination Fixed remuneration is determined based on market comparisons for similar positions, taking into account the experience and skills of the manager involved.
Review FAR is determined on appointment and reviewed annually.
39%
30%
48%
39%
15%
15%
14%
15%
47%55%
38%
46%
0%
10%
20%
30%
40%
50%
60%
70%
80%
90%
100%
On target Max On target Max
MD Other KMP
FAR STI LTI

Mineral Resources Limited Directors' report 30 June 2019
Remuneration report (audited) (continued)
24
Short-Term Incentive
The key elements of the FY19 STI plan are as follows:
Purpose Focus participants on delivery of business objectives over a 12 month period.
Participation All executive KMP, plus approximately 60 senior employees.
Determining the STI pool The Board reviews annually and set the maximum STI pool, with reference to the overall performance of the Company. In FY19, the total STI pool for KMP executives and 60 senior employees was set at 3% of Net Profit After Tax, providing a strong alignment with shareholders.
An amount up to, but no more than this amount, is then allocated to individual STI participants based on their individual performance measures (see below).
Opportunity For the Managing Director, the maximum STI reward has been set for FY19 at 50% of FAR, with on-target rewards at 75% of this amount, or 37.5% of FAR.
For other members of the KMP, the maximum STI award for FY19 is 40% of FAR, with on-target rewards at 75% of this amount, or 30% of FAR.
Performance period Performance is measured from 1 July to 30 June.
Individual performance measures
Performance measure and link to remuneration framework:
Safety indicators:
Safety is part of MRL’s DNA. It is how we do things, and is embedded into our systems and processes. Our continuing success depends on our people and our ability to deliver quality results safely for our customers, our shareholders and each other. Safety outcomes are measured by the total recorded injury frequency rate (TRIFR).
Strategic growth options:
Growth through acquisitions and transactions that maximise value creation for shareholders while maintaining a strong balance sheet
Operational efficiency and performance measures:
MRL fosters an environment focused on delivery and pioneering innovation. It is through this culture that a range of innovative products and processes have been developed, all of which are designed to facilitate increases in efficiency and lower costs.
Financial management and performance targets:
Ensuring MRL’s financial position is adequate to support the growth agenda will set MRL up for future success
Organisational culture and development:
Providing a harmonious and nurturing environment will allow our employees to reach their full potential.
In addition to the above a number of personal KPIs are measured to ensure alignment to business plans and to stretch levels of performance.
Example of metric used: Total recorded injury frequency rate, lost time injury frequency rate Development of long-term, recurring income streams Shipped tonnes and cost per tonne Delivering budgeted/forecast results and various investment returns; strengthening balance sheet Cultural development programme progress

Mineral Resources Limited Directors' report 30 June 2019
Remuneration report (audited) (continued)
25
The precise mix of metrics selected for each senior employee and KMP is configured to ensure they are linked to and measurable against business outcomes that he or she can influence, so that the assessment is both relevant and fair.
STI awards limited to a maximum % of NPAT
The total amount of STI awards vary with profitability. The Board retains the discretion to set the STI pool, which in FY19 was capped at 3% of NPAT. At the Board’s discretion the pool could be set at 0%, which ensures STI payments are in the best interests of shareholders.
Payment FY19 STI payments will be made in cash in August 2019, following the Board’s authorisation of the Company’s FY19 financial results.
Rights on termination To be eligible for payment, a participant in the STI must be employed by the Company on the date of payment. Any employee whose employment is terminated before the date of payment for whatever reason is not eligible for any STI payment.
Clawback The Board may, at its discretion, reduce or rescind any awards made under the STI for a period of up to two years following payment in the event that it determines payments have been made inappropriately, including in the instance of fraud, dishonesty, breach of duties, or misstatement or manipulation of financial information.

Mineral Resources Limited Directors' report 30 June 2019
Remuneration report (audited) (continued)
26
Long-Term Incentive
The key elements of the FY19 LTI plan are as follows:
Purpose Focus KMP and senior executives on:
achieving a high and sustained ROIC over the longer term (total 4 years)
encouraging agility and entrepreneurialism to seize opportunities for higher returns contingent on rapid capital deployment within shorter timeframes
alignment with shareholders’ interests through shareholdings that must be held for up to 4 years.
Participation KMP and senior executives are invited to participate in LTI Plan.
Payment vehicle LTI grants are rights to MRL shares. Rights are automatically delivered as shares on vesting.
Performance period Four years, the first being the Assessment Year (the year of initial grant, i.e. FY19 for the FY19 LTI plan) and the following three years, being the Performance Years, post the initial grant.
Opportunity The maximum grant opportunity for the Managing Director is equal to 180% of FAR and 150% of FAR for other KMP.
Grant hurdle The size of the grant to LTI participants is determined by company ROIC (see section 4.4) achieved by the Company during the Assessment Year. For ROIC that is:
Larger than 18% = LTI award is equal to 100% of the maximum grant opportunity as described above
Greater than or equal to 15% but less than 18% = 83% of the maximum grant opportunity
Greater than or equal to 12% but less than 15% = 67% of the maximum grant opportunity
Less than 12% = Nil
Vesting period Rights granted under the LTI vest over 3 years after grant, with an opportunity for a third of the grant to vest in either the first, second or third year after grant, a third to vest in either the second or third year after grant and a third to vest in the third year after grant (see the remuneration timeline at section 4.1 Rights that vest in the first and/or second Performance Year remain in Holding Lock until the end of the third Performance Year. These are released from Holding Lock when performance hurdles are confirmed for third Performance Year, along with grants that may vest for that third Performance Period.
Vesting Hurdles For the first tranche to vest, ROIC in the first Performance Year following the Award Year, or the average ROIC over the first and second Performance Year, or the average ROIC over the first, second and third Performance Years must equal or exceed 12%.
For the second tranche to vest, ROIC in the second Performance Year following the Award Year, or the average ROIC over the second and third Performance Years, must equal or exceed 12%.
For the third tranche to vest, ROIC in the third Performance Year following the Award Year, must equal or exceed 12%.

Mineral Resources Limited Directors' report 30 June 2019
Remuneration report (audited) (continued)
27
Where Vesting Hurdles are not met, either one, or all, affected tranches become a Suspended Tranche.
Suspended Tranche A Suspended Tranche is eligible to vest where the average ROIC for the Performance Year following the year in which the tranche became suspended, or the following two years if there are two Suspended Tranches, exceeds 12%.
Holding lock All shares that vest under the LTI are released to participants for trading only after the release of the third financial year’s results (i.e. the third Performance Year) and after assessing for the Clawback Policy.
This provides an ongoing incentive for LTI participants to deliver value-adding growth for shareholders.
LTI grant allocation A senior executive and KMP’s LTI opportunity, expressed as a dollar amount, is divided by MRL share value, as determined by the Volume Weighed Average Price (VWAP) for the five trading days preceding the release of the financial results for each Award Year, to determine the number of MRL shares granted. In prior financial years the number of MRL share rights granted has been based on the VWAP to the 30 June of each year. This has been amended for FY19 to avoid differences in accounting and taxation valuations for participants.
Dividends No dividends are paid to LTI participants on unvested MRL share rights. Dividends declared by the Company on vested shares subject to the Holding Lock are paid to the LTI participant, and participants can vote these shares (subject to the usual Corporations Act restrictions relating to the Remuneration Report etc.).
Clawback Policy The Board has the discretion to claw back previously vested LTI awards in the event that the Board concludes that such awards should not have vested due to:
(a) fraud, dishonesty or fundamental breach of duties (including misstatement or manipulation of financial information) of any person; or
(b) the intentional or inadvertent conduct of any person that the Board determines resulted in an unfair benefit being obtained by a participant.
Hedging Hedging by senior executives or KMP, or the use of derivatives such as collars, caps or similar products in relation to MRL securities, including vested shares or unvested MRL share rights, allocated under MRL incentive schemes, is strictly prohibited.
Change of Control / Resignation / Retirement in the event of ill health
In the event of a change of control, resignation or retirement due to ill health, the Board may exercise its discretion to determining whether to vest any granted but unvested MRL share rights.
Board discretion The Board retains the discretion to amend, vary, terminate or suspend the LTI Plan at any time. Any such variation, amendment, termination or suspension is not to adversely affect or prejudice rights of LTI participants holding MRL share rights at that time.

Mineral Resources Limited Directors' report 30 June 2019
Remuneration report (audited) (continued)
28
4.4 LTI performance measures
Calculating ROIC
ROIC is measured at a Group consolidated level, on the following basis:
ROIC = NOPAT/Invested Capital
Where:
Net Operating Profit After Tax (NOPAT) is calculated as the Company’s statutory Earnings Before Interest and Taxes (EBIT) for the year, adjusted to remove the impact of changes to accounting policies (such as the treatment of operating leases), whether favourable or unfavourable, and after applying a flat 30% tax rate.
Invested Capital is calculated as the sum of Net Assets and Net Interest Bearing Debt at balance date adjusted for accumulative accounting policy adjustments.
Treatment of cash balances for the purposes of calculating ROIC
Strategic cash is defined as cash, over and above normal operational requirements, retained for future opportunities. The Board nominated strategic cash holdings ($100 million) is excluded from the calculation of Invested Capital on the basis that retention of a strong cash balance, and available borrowing facilities, are retained to enable strategic growth and investment. As retention of strategic cash holdings is a Board decision that senior executives and KMP are unable to influence, the Board has determined it is reasonable not to require senior executives and KMP to earn a return on these facilities.
Why ROIC has been chosen to determine LTI awards
Following ongoing consultation and external advice, the Remuneration Committee continues to be of the view that: (a) ROIC remains the most appropriate measure for evaluating entitlement to an LTI award, as:
(i) it provides a clear and unambiguous link between Company performance and the creation of shareholder
value;
(ii) it is the key value driver considered when management decides when and how to invest capital; and
(iii) the financial return earned on capital deployed is a true measure of value creation and a long-term
representation of Company value.
(b) MRL continues to be a highly capital intensive business. As such, it is vital that KMP ensure that maximum returns
are generated on invested capital, which again supports utilisation of ROIC as the most appropriate measure for
assessing senior executives and KMPs’ entitlement to LTI.
The use of ROIC and the target of 12% are designed to encourage strong longer-term performance of the Company.

Mineral Resources Limited Directors' report 30 June 2019
Remuneration report (audited) (continued)
29
5. Remuneration outcomes for FY19
5.1 Summary of FY19 Company performance
A summary of the Group’s financial performance over the past five years is set out in the tables below. The relationship between the Group’s financial performance, return to shareholders and KMP remuneration reflects the direct correlation between financial performance, shareholder value creation and executive remuneration.
Financial Summary ($millions unless otherwise stated) 20151 2016 2017 2018 2019
Earnings
Revenue 1,299 1,178 1,458 1,624 1,512
EBITDA 283 278 473 575 386
NPAT 78 (26) 201 272 165
Return on Revenue 6% -2% 14% 17% 11%
Return on Equity 7% -3% 18% 21% 12%
ROIC 6.9% -2.8% 20.1% 18.3% 9.7%
Diluted EPS (cents/share) 41.52 (13.31) 107.66 145.30 87.09
1 2015 Financial Year NPAT and Earnings Per Share exclude the impact of the reversal of Deferred Tax Asset on the abolition of the Minerals
Resource Rent Tax (MRRT). NPAT for the 2015 Financial Year would be $12,814,000 and Diluted EPS 6.85c/share if the impact of MRRT were to be
included.
Financial Year Ended 30 June 2015 2016 2017 2018 2019
Final dividend for the preceding financial year 0.3200 0.1500 0.2100 0.3300 0.4000
Interim dividend for the current financial year 0.0750 0.0850 0.2100 0.2500 0.1300
Total dividend paid 0.3950 0.2350 0.4200 0.5800 0.5300
Share price 6.60 8.31 10.85 16.00 14.98
Total Shareholder Return (TSR) (cumulative) 8.44 10.38 13.34 19.07 18.58
-
20
40
60
80
100
120
140
160
180
2014 2015 2016 2017 2018 2019
TSR
-B
ase
10
0
TSR
MinRes (Base 100)

Mineral Resources Limited Directors' report 30 June 2019
Remuneration report (audited) (continued)
30
5.2 STI performance outcomes
Determining the STI pool for FY19 Based on the performance of the Company in FY19, the board assessed the maximum pool available for the STI incentive
pool to be 3% of Net Profit After Tax, providing a total pool available to senior executives and KMP of $6.3 million. The final
FY19 STI award for senior executives and KMP is less than the total pool.
KMP individual performance outcomes
The tables below summarise the STI performance outcomes for the executive KMP for FY19.
Managing Director
STI element Weight Performance Comments
Threshold Target Max
Safety, governance and ESG
20%
Continued delivery of better than industry performance. Increased focus on Environmental, Social and Governance
(ESG) reporting and governance processes
Strategic growth 20% Development of lithium portfolio and partial realisation
thereof. Positioning of Mining Services for longer-term annuity streams
Operational efficiency and performance
10%
Continued cost discipline
Financial management performance
20%
Financial flexibility to support longer-term capital investment,
combined with operating earnings
Organisational culture and development
30%
Senior staff hiring and development, combined with ongoing
cultural training
Total 100% The Remuneration Committee determined that the MD’s STI
for FY19 would be set at 78% of his maximum opportunity.
Chief Financial Officer
STI element Weight Performance Comments
Threshold Target Max
Safety, governance and ESG
25%
Strategic growth
25%
Financial management performance
25%
Organisational culture and development
25%
Total 100% The Chief Financial Officer’s STI for FY19 has been
determined at 85% of his maximum opportunity.
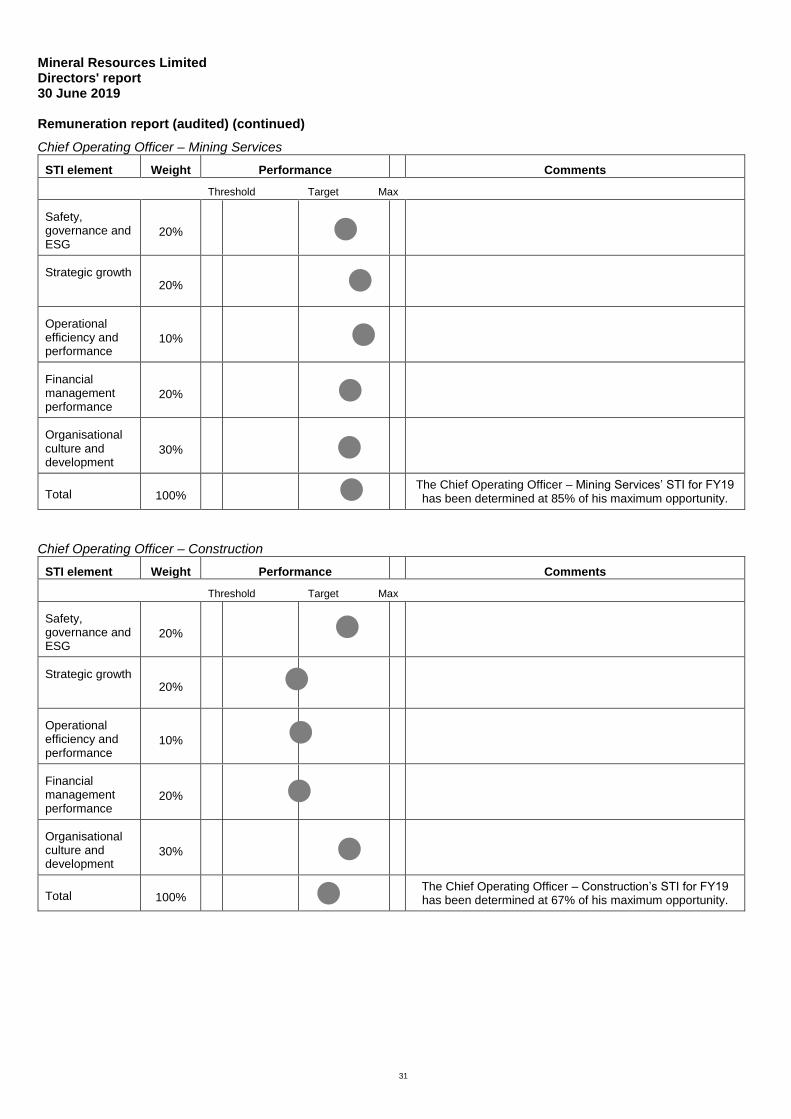
Mineral Resources Limited Directors' report 30 June 2019
Remuneration report (audited) (continued)
31
Chief Operating Officer – Mining Services
STI element Weight Performance Comments
Threshold Target Max
Safety, governance and ESG
20%
Strategic growth
20%
Operational efficiency and performance
10%
Financial management performance
20%
Organisational culture and development
30%
Total 100% The Chief Operating Officer – Mining Services’ STI for FY19
has been determined at 85% of his maximum opportunity.
Chief Operating Officer – Construction
STI element Weight Performance Comments
Threshold Target Max
Safety, governance and ESG
20%
Strategic growth
20%
Operational efficiency and performance
10%
Financial management performance
20%
Organisational culture and development
30%
Total 100% The Chief Operating Officer – Construction’s STI for FY19
has been determined at 67% of his maximum opportunity.

Mineral Resources Limited Directors' report 30 June 2019
Remuneration report (audited) (continued)
32
5.3 LTI performance outcomes: FY19 grant
For FY19, the Company achieved a ROIC of 9.7%. This result was primarily driven by the substantial increase in the capital deployed into growth opportunities by the Company, mainly the Wodgina Lithium project of approximately $600 million, which represents an important investment for the future success of the Company.
Over the course of FY19, the Invested Capital increased by $992 million to $2.3 billion and, as with prior years, it is this closing balance that is adopted in calculating the Group’s ROIC for the financial year. Consequently, as ROIC for FY19 is below the hurdle rate of 12%, no LTI grants have been made for FY19. As a comparison, the ROIC achieved using an average capital base rather than year-end was 12.5%.
$ millions FY14 FY15 FY16 FY17 FY18 FY19
Actual Actual Actual Actual Actual Actual
NOPAT:
EBITDA 554.1 283.0 278.2 473.5 575.2 385.9
Normalised (a)
-
-
-
- (68.5) 46.8
EBITDA for ROIC 554.1 283.0 278.2 473.5 506.7 432.7
Less impairments (18.2) (44.5) (186.2) (16.7) (65.4) (9.8)
Less depreciation and amortisation (196.7) (126.9) (134.0) (160.2) (112.9) (108.6)
Net Operating Profit Before Tax 339.2 111.6 (42.0) 296.5 328.5 314.2
Less tax at 30% (101.8) (33.5) 12.6 (89.0) (98.5) (94.3)
NOPAT 237.4 78.1 (29.4) 207.6 229.9 220.0
Invested Capital:
Net assets (per balance sheet) 1,139.3 1,082.2 1,008.7 1,132.1 1,304.6 1,380.2
Normalised (cumulative, net of tax) (a)
-
-
-
- (47.9) (14.8)
Net Assets for ROIC 1,139.3 1,082.2 1,008.7 1,132.1 1,256.6 1,365.4
Net Debt 19.3 55.3 136.1 0.0 98.9 997.1
Total invested capital 1,158.6 1,137.4 1,144.7 1,132.1 1,355.5 2,362.5
Strategic cash holding (100.0)
- (100.0) (100.0) (100.0) (100.0)
Net Invested Capital 1,058.6 1,137.4 1,044.7 1,032.1 1,255.5 2,262.5
ROIC % 22.4% 6.9% -2.8% 20.1% 18.3% 9.7%
(a) Normalised for the impact of matters outside of the control of management, such as gains/losses on strategic investments where such investments are held at the discretion of the Board. Adjustments are also made to operating profits for the effect of new/revised accounting standards, where these adjustments are outside of management’s day-to-day operational control.

Mineral Resources Limited Directors' report 30 June 2019
Remuneration report (audited) (continued)
33
5.4 LTI performance outcomes: earlier grants on-foot
FY16 Grant
A total of 47,796 MRL shares representing the fourth and final tranche of MRL share rights granted under the FY16 LTI scheme will be issued to eligible KMP on 23rd August 2019. The vesting of these shares is subject only to continued service.
FY17 Grant
Although FY19’s ROIC is less than 12%, the average ROIC over FY18 and FY19 is 12.8%. As this exceeds 12% a total of 89,910 MRL shares, representing the second tranche of MRL share rights granted under the FY17 LTI scheme, will be issued to KMP on 23rd August 2019.
FY18 Grant
Due to FY19’s ROIC being less than 12%, a total of 56,052 MRL shares, representing the first tranche of MRL share rights granted under the FY18 LTI scheme, will become a Suspended Tranche subject to Performance Hurdle testing in FY20 and will become eligible to vest in August 2020, along with Tranche 2 of the FY18 LTI scheme, provided the average ROIC for FY19 and FY20 exceeds 12%.
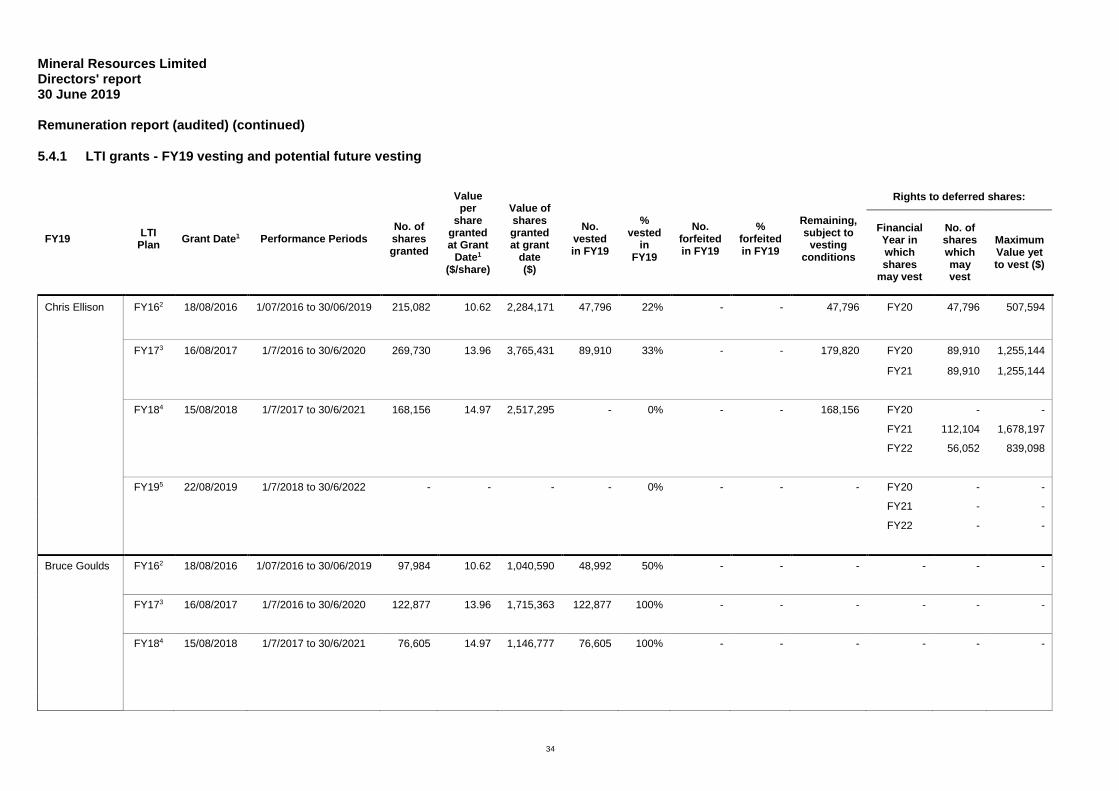
Mineral Resources Limited Directors' report 30 June 2019
Remuneration report (audited) (continued)
34
5.4.1 LTI grants - FY19 vesting and potential future vesting
FY19 LTI
Plan Grant Date1 Performance Periods
No. of shares granted
Value per
share granted at Grant
Date1 ($/share)
Value of shares granted at grant
date ($)
No. vested in FY19
% vested
in FY19
No. forfeited in FY19
% forfeited in FY19
Remaining, subject to
vesting conditions
Rights to deferred shares:
Financial Year in which shares
may vest
No. of shares which may vest
Maximum Value yet to vest ($)
Chris Ellison FY162 18/08/2016 1/07/2016 to 30/06/2019 215,082 10.62 2,284,171 47,796 22% - - 47,796 FY20 47,796 507,594
FY173 16/08/2017 1/7/2016 to 30/6/2020 269,730 13.96 3,765,431 89,910 33% - - 179,820 FY20 89,910 1,255,144
FY21 89,910 1,255,144
FY184 15/08/2018 1/7/2017 to 30/6/2021 168,156 14.97 2,517,295 - 0% - - 168,156 FY20 - -
FY21 112,104 1,678,197
FY22 56,052 839,098
FY195 22/08/2019 1/7/2018 to 30/6/2022 - - - - 0% - - - FY20 - -
FY21 - -
FY22 - -
Bruce Goulds FY162 18/08/2016 1/07/2016 to 30/06/2019 97,984 10.62 1,040,590 48,992 50% - - - - - -
FY173 16/08/2017 1/7/2016 to 30/6/2020 122,877 13.96 1,715,363 122,877 100% - - - - - -
FY184 15/08/2018 1/7/2017 to 30/6/2021 76,605 14.97 1,146,777 76,605 100% - - - - - -

Mineral Resources Limited Directors' report 30 June 2019
Remuneration report (audited) (continued)
35
Danny McCarthy
FY162 18/08/2016 1/07/2016 to 30/06/2019 95,592 10.62 1,015,187 44,343 46% 3,453 4% - - - -
FY173 16/08/2017 1/7/2016 to 30/6/2020 119,880 13.96 1,673,525 39,960 33% 42,112 35% 37,808 FY20 18,904 263,900
FY21 18,904 263,900
FY184 15/08/2018 1/7/2017 to 30/6/2021 74,736 14.97 1,118,798 - 0% 64,293 86% 10,443 FY20 - -
FY21 6,962 104,221
FY22 3,481 52,111
Mark Wilson FY195 22/08/2019 1/7/2018 to 30/6/2022 - - - - 0% - - - FY19 - -
FY20 - -
FY21 - -
Rohan O'Grady
FY195 22/08/2019 1/7/2018 to 30/6/2022 - - - - 0% - - - FY19 - -
FY20 - -
FY21 - -
Michael Grey FY195 22/08/2019 1/7/2018 to 30/6/2022 - - - - 0% - - - FY19 - -
FY20 - -
FY21 - -
1 Grant date is the date at which the Annual Financial Statements are authorised by the Board for release to the market.
2 The FY16 LTI Plan vests in favour of participants provided participants remain employed with the Company over each of the Performance Periods
3 FY17 was the Award Year for the FY17 LTI Plan (ROIC exceeded 12%). Each tranche of the FY17 LTI Plan vests in favour of participants provided participants remain employed with the Company over each of the subsequent Performance Periods (FY18 to FY20) and ROIC for each subsequent Performance Period (FY18 to FY20) equals or exceeds 12%. As the average ROIC for FY18 and FY19 exceeds 12% (the average being 12.8%) Tranche 2 of the FY17 LTI Plan vests in favour of participants who remained employed for all of FY19
4 FY18 was the Award Year for the LTI Plan (ROIC for FY18 exceeded 12%). Each tranche of the FY18 LTI Plan vests in favour of participants provided participants remain employed with the Company over each of the subsequent Performance Periods (FY19 to FY21) and ROIC for each subsequent Performance Period (FY19 to FY21) equals or exceeds 12%. As ROIC for FY19 is less than 12%, Tranche 1 of the FY18 LTI Plan becomes a Suspended Tranche, subject to retesting if ROIC is equal to or exceeds 12% when averaged over the FY19 and subsequent (FY20 to FY21) Performance Periods
5 FY19 was the Award Year for the FY19 LTI Plan. As ROIC for FY19 is less than 12% there is no LTI award for FY19.

Mineral Resources Limited Directors' report 30 June 2019
Remuneration report (audited) (continued)
36
6. KMP remuneration schedules
6.1 FY19 remuneration schedule
Short-Term Benefits
Post-Employment
Benefits Share-based payments
Cash salary and fees Other9 STI
Non-Monetary Superannuation
Value of LTI equity10
NED remuneration11 Total
Performance related
$ $ $ $ $ $ $ $ %
Non-Executive Directors
Current1
Peter Wade 125,000 - - - 23,750 - 125,000 273,750 -
Kelvin Flynn 70,000 - - - 13,300 - 70,000 153,300 -
James McClements 70,000 - - - 13,300 - 70,000 153,300 -
Xi Xi 83,300 - - - - - 70,000 153,300 -
Former
Tim Roberts2 65,192 - - - 12,387 - 65,192 142,771 -
Executive Director
Chris Ellison 1,500,000 - 585,000 68,436 20,531 847,276 - 3,021,243 47%
Other Executives
Current1
Michael Grey3 107,692 - 35,863 - - - - 143,555 25%
Rohan O'Grady4 535,769 - 154,615 - 19,235 - - 709,619 22%
Mark Wilson5 916,346 250,000 250,913 32,104 20,531 - - 1,469,894 17%
Former
Bruce Goulds6 656,963 820,000 - - 10,266 1,221,095 - 2,708,324 45%
Danny McCarthy7 588,216 476,923 - 108,871 10,266 (506,713) - 677,563 -75%

Mineral Resources Limited Directors' report 30 June 2019
Remuneration report (audited) (continued)
37
Scott Winter8 463,286 350,000 - - 15,399 - - 828,685 -
Total 5,181,764 1,896,923 1,026,391 209,411 158,965 1,561,658 400,192 10,435,304
Current KMP subtotal 3,408,107 250,000 1,026,391 100,540 110,647 847,276 335,000 6,077,961
Former KMP subtotal 1,773,657 1,646,923 - 108,871 48,318 714,382 65,192 4,357,343
Total 5,181,764 1,896,923 1,026,391 209,411 158,965 1,561,658 400,192 10,435,304 1 Current as at the date of this Remuneration Report (22 August 2019)
2 Tim Roberts resigned on 5 June 2019. Fees shown are for the period 1 July 2018 to 5 June 2019.
3 Michael Grey was appointed Chief Operating Officer - Mining Services on 6 May 2019. Remuneration disclosed is for period from appointment 6 May 2019 to 30 June 2019. Michael Grey’s total STI for FY19 was $237,346. The STI value shown in the table above represents a pro-rata portion of his FY19 STI for the period for which he was a KMP.
4 Rohan O'Grady commenced as Chief Operating Officer - Construction & Development on 3 September 2018. Remuneration is for the period 3 September 2018 to 30 June 2019
5 Mark Wilson commenced as Chief Financial Officer on 27 August 2018. Remuneration is for the period 27 August 2018 to 30 June 2019
6 Bruce Goulds retired as Chief Financial Officer on 6 December 2018. Remuneration is for the period 1 July 2018 to 6 December 2018
7 Danny McCarthy resigned as Chief Operating Officer on 30 November 2018. The negative value shown for LTI equity represents the value of LTI forfeited on resignation. Remuneration is for the period 1 July 2018 to 30 November 2018.
8 Scott Winter commenced as Chief Operating Officer - Commodities on 9 October 2018. He resigned on 18 June 2019. Remuneration is for the period 9 October 2018 to 11 June 2019
9 Termination entitlements for Bruce Goulds, Danny McCarthy and Scott Winter, and joining bonus for Mark Wilson
10 Refer to section 4 for details of the long-tern incentive (LTI) scheme. The amounts for the value of LTI equity represents the expense over the performance period calculated in accordance with Australian Accounting Standards and includes the FY16, FY17 and FY18 LTI schemes which continue to be expensed in FY19 based on the probability of vesting, as these shares are subject to performance and forfeiture conditions.
11 Equity component of Non-Executive Directors' (NED) remuneration. NED Remuneration is not linked to Company performance, however to create alignment with shareholders, Non-Executive Director fees continue to be paid 50% in cash and 50% in MIN shares.

Mineral Resources Limited Directors' report 30 June 2019
Remuneration report (audited) (continued)
38
6.2 FY18 remuneration schedule
Short-Term Benefits
Post-Employment
Benefits Share-based payments
Cash salary and fees STI Non-Monetary Superannuation
Value of LTI equity 2
NED remuneration3 Total
Performance related
$ $ $ $ $ $ $ %
Non-Executive Directors
Peter Wade 125,000 - - 20,049 - 125,000 270,049 -
Kelvin Flynn 70,000 - - 13,300 - 70,000 153,300 -
James McClements 70,000 - - 13,300 - 70,000 153,300 -
Tim Roberts 70,000 - - 13,300 - 70,000 153,300 -
Xi Xi1 66,868 - - - - 56,192 123,060 -
Executive Director
Chris Ellison 1,500,000 375,000 77,264 20,049 2,564,864 - 4,537,177 65%
Other Executives
David Geraghty 675,000 177,188 30,335 20,049 559,280 - 1,461,852 50%
Bruce Goulds 820,000 246,000 - 20,049 1,185,300 - 2,271,349 63%
Danny McCarthy 735,000 160,000 179,400 20,049 1,128,889 - 2,223,338 58%
4,131,868 958,188 286,999 140,145 5,438,333 391,192 11,346,725
1 Appointed 11 September 2017. 2 Refer to section 4 for details of the long-tern incentive (LTI) scheme. The amounts for the value of LTI equity represents the expense over the performance period calculated in accordance with Australian Accounting Standards and includes the FY16, FY17 and FY18 LTI schemes which would have been expensed in FY18 based on the probability of vesting, as these shares are subject to performance and forfeiture conditions. The amounts for the value of LTI equity disclosed previously in the FY18 remuneration report represented the expense based on the face value of shares granted under the FY18 LTIP, being:
- Chris Ellison: $2,700,000
- Bruce Goulds: $1,200,000
- David Geraghty: $1,230,000 -
- Danny McCarthy: $607,500 - As these amounts previously disclosed and expensed in FY18 at face value are not materially different from that expensed over the performance period, the comparatives for share based payments expense in the
financial statements have not been restated. 3 Equity component of Non-Executive Directors' (NED) remuneration. NED Remuneration is not linked to Company performance, however to create alignment with shareholders, Non-Executive Director fees continue to be paid 50% in cash and 50% in MIN shares.

Mineral Resources Limited Directors' report 30 June 2019
Remuneration report (audited) (continued)
39
7. Key changes to remuneration for FY20
During FY19, MRL commissioned independent research with respect to the level and mix of remuneration offered to the Managing Director in the context of the peer group as outlined above in section 3.3 above. Drawing on this analysis and feedback received from investors, the amounts and mix of remuneration for the Managing Director (MD) was amended with effect from FY20.
The tables below summarise where changes will be made to the key components of remuneration in FY20 for KMP. No changes will be made to the remuneration of non-executive KMP, which was last adjusted on 1 July 2017.
Fixed Annual Remuneration (FAR)
Review Following a review of peer company remuneration, the Managing Director has voluntarily agreed to reduce his FAR by $300,000 to $1,200,000 commencing 1 July 2019. This change is expected to bring the Managing Director’s FAR close to the middle of the peer group in FY20.
Reflecting market pressures, the FAR for the Chief Financial Officer and for the Chief Operating Officer – Mining Services will be increased from 1 September 2019 to $950,000 and $850,000 respectively. These increases reflect additional responsibilities and ongoing high performance.
Short-Term Incentive
The key changes to the STI plan effective in FY20 are as follows:
Opportunity For the Managing Director in FY20, the maximum STI reward will be increased to 100% of FAR, with an on-target amount equal to 75% of this amount, or 75% of FAR. This adjustment is made in conjunction with the reduction to FAR described above and is expected to bring the Managing Director’s STI opportunity into line with those on offer at remuneration peers in the listed Industrial and Metals & Mining sectors. For other members of the KMP, the maximum STI will be increased from 40% to 80%, consistent with that offered at remuneration peers relative to the comparator businesses mentioned above.
Weighting The Managing Director’s STI Key Performance Indicators (KPIs) will be reweighted such that financial KPIs contribute to 40% of scorecard outcomes, up from 25%, while financial KPIs for other KMP will also be increased, to 30%
Payment For payments made in relation to FY20 and following, any awards made under the STI plan to KMP that exceed 50% of FAR for the Managing Director or 40% of FAR for other KMP, will be settled in the form of MRL shares that will vest progressively over the two years following grant, subject to continued service and application of clawback provisions.

Mineral Resources Limited Directors' report 30 June 2019
Remuneration report (audited) (continued)
40
Long-Term Incentive
The key changes to the LTI plan effective in FY20 are as follows:
Maximum LTI Opportunity
The maximum LTI opportunity for the Managing Director of 180% of FAR and for the rest of the KMP of up to 150% of FAR will remain unchanged in FY20, despite a fall in the Managing Director’s FAR in FY20 as noted above.
Grant date A grant under the LTI for FY20 is expected to be made in August 2019. Rights granted under the LTI at this time will vest after four years in November 2023, subject to meeting Performance Measures and continued service.
LTI grant value An amount equal to the maximum LTI opportunity will be granted to each LTI participant and will vest subject to performance.
The number of Rights to be issued to KMP will be determined using the following formula:
LTI rights issued = (FAR x Maximum LTI Opportunity)/VWAP Where ‘VWAP’ is the five-day Volume Weighted Average Price to the Grant date.
Performance period For the purposes of the LTI, performance will be measured over four consecutive years with the first year being the year in which the LTI grant is made. For grants made in FY20, the Performance Period will be FY20 – FY23 inclusive.
Performance measure ROIC will continue to be the performance measure used to determine LTI awards, however the number of shares that will vest to LTI participants will now be subject to the four-year average ROIC enjoyed by the Company over the Performance Period compared with hurdles set in advance by the Board.
The four-year average ROIC will be determined as follows:
Four-year average ROIC = Cumulative 4 year NOPAT/Cumulative 4 year Invested Capital
Further discussion of the calculation of ROIC is included in Section 4.4
Vesting hurdle The amount of shares that vest at the end of the Performance Period will be determined by reference to the following hurdles set by the Board.
4 year average ROIC % of maximum achievement LTI opportunity
Less than 12% Nil Between 12% and 18% Pro-rata between 67% & 100%
18%+ 100%
The hurdle rates noted above have not changed from FY19, however performance between 12% and 18% is now pro-rated, rather than a step function, to better align outcomes for participants with shareholders.
In the past the rewards for each level of performance have been expressed as a percentage of the on-target amount, rather than the maximum (i.e. 12% ROIC meant a grant of 100% of the on-target LTI).
While the above table moves to the more widely used percentage of maximum format, the amounts on offer as a percentage of FAR at each level of performance have not changed.
Vesting period All shares will vest, subject to performance, four years after the grant date.
Holding lock As no shares will vest for four years from Grant Date under the revised LTI and in recognition of the introduction of a minimum shareholding policy for KMP, a holding lock will no longer apply to shares issued under the revised LTI.
Shares that vest under LTI plans up to and including FY19 will continue to be subject to the holding locks in place under previous LTI plans.

Mineral Resources Limited Directors' report 30 June 2019
Remuneration report (audited) (continued)
41
Dividends To provide KMP with greater alignment to shareholder returns, including dividends, any shares that vest under the revised LTI (FY20 onwards) will include the value of dividends that have accrued on those shares since the grant date.
The timeline below illustrates how the components of KMP remuneration for FY20 will be delivered to the KMP:
FY20 FY21 FY22 FY23 FY24
FAR (Salary, superannuation & fixed benefits)
Paid throughout the year
STI
Performance period (12 months)
STI less than 40% of FAR (50% for MD) paid Aug 2020. Any excess over 40% of FAR (50% for MD) deferred to Aug 2021 and 2022
Half of deferred portion paid Aug 2021
Half of deferred portion paid Aug 2022
LTI
Total Performance period (4 years)
Performance period (Performance Years)
Total rights determination period (4 years)
25% rights
determined Aug 2021(a)
25% rights determined Aug
2022(a)
25% rights determined Aug
2023 (a)
25% rights determined Aug 2024(a)
Rights convert to shares Aug 2024 and in Sep/Oct 2024 to shares/cash for dividend
entitlements (a) Subject to overall ROIC performance in excess of 12% for the Performance Period.

Mineral Resources Limited Directors' report 30 June 2019
Remuneration report (audited) (continued)
42
Remuneration mix
On-target remuneration mix
As a result of the changes discussed above, the on-target remuneration mix for the Managing Director for FY20 will be FAR 34% STI 25% LTI 41%.
The on-target remuneration mix for other KMP will be FAR 38% STI 24% LTI 38%.
Maximum remuneration mix
As a result of the changes discussed above, the remuneration mix for the Managing Director for FY20 at maximum STI and LTI allocation will be FAR 26% STI 26% LTI 48%.
The remuneration mix for other KMP at maximum STI and LTI allocation will be FAR 30% STI 24% LTI 46%.
Other changes
Introduction of minimum shareholding guideline
A minimum shareholder policy will be introduced requiring KMP to hold or make reasonable progress towards holding shares in MRL equal to or greater than the KMP’s FAR.
The minimum shareholding policy has been put in place to ensure KMP have a meaningful exposure to the long-term share price performance of the Company and to align their interests with those of shareholders.
The minimum holdings are as follows:
Managing Director: 200% FAR
Other KMP: 100% FAR
Non-Executive Directors: One financial year’s fees
Retention arrangements In the face of tightening employment market conditions, the Company has undertaken a review of alternatives to encourage retention of staff considered vital to the Company’s ongoing success.
A number of initiatives to encourage retention will be put in place in FY20 to address this risk including the allocation of equity to executives identified as critical to the organisation’s performance.
Any such grant would vest subject to service over four or more years following grant and be no more than 30% of the employee’s FAR at the date of grant. Only one grant would be made over the service period.
While the majority of participants in such a scheme are expected to be outside the ranks of KMP, this retention mechanism may be applied to KMP, with any such awards disclosed in the relevant Remuneration Report.

Mineral Resources Limited Directors' report 30 June 2019
Remuneration report (audited) (continued)
43
8. Summary of KMP employment conditions
8.1 Executives
The table below summarises the employment agreements in place with executive KMP as at the date of this report.
KMP Term of agreement
FAR Notice period: KMP and MRL
Termination entitlements1
Chris Ellison (MD) Full time – permanent
$1,200,000 1 year Notice period per contract and severance entitlements as per
National Employment Standards
Michael Grey (COO) Full time – permanent
$700,000 3 months Notice plus one month base salary
Rohan O’Grady (COO) Full time – permanent
$700,000 6 months Notice plus one month base salary
Mark Wilson (CFO) Full time – permanent
$875,000 6 months Notice plus one month base salary
1 Should this amount be a value that requires shareholder approval then it can be reduced to maximum permissible amount without shareholder
agreement.
8.2 Non-Executive Directors
Non-Executive Director remuneration remains unchanged from that disclosed in FY18 and remains as follows:
Chairman $250,000 (plus superannuation)
Non-Executive Director $140,000 (plus superannuation)
Non-Executive Director remuneration is not linked to Company performance, however to create alignment with shareholders, Non-Executive Director fees continue to be paid 50% in cash and 50% in MIN shares. All directors are subject to the Company’s Security Trading Policy.

Mineral Resources Limited Directors' report 30 June 2019
Remuneration report (audited) (continued)
44
9. Shareholdings
9.1 KMP shareholding
The number of MRL shares held during the Financial Year by each Director and Other Executive of the Company, including their related parties, is set out below:
Number of Shares Balance at the start of
the year
Received as part of FY19 LTI
vesting considerations
FY19 Directors
Fees
Other Additions
Disposals/ other
Balance at the end of the year
Non-Executive Directors
Current
Peter Wade1 328,656 - - - - 328,656
Kelvin Flynn1 6,997 - - - - 6,997
James McClements1 6,997 - - - - 6,997
XiXi1 5,617 - - - - 5,617
Former
Tim Roberts 6,997 - 4,267 - (11,264) -
Executive Director
Chris Ellison 21,265,668 137,706 - 629,217 - 22,032,591
Other KMP
Current
Mark Wilson - - - 8,670 - 8,670
Rohan O'Grady - - - - - -
Michael Grey - - - - - -
Former
Bruce Goulds 107,391 122,877 - - (230,268) -
Danny McCarthy 47,796 63,858 - - (111,654) -
Scott Winter - - - - - -
21,776,119 324,441 4,267 637,887 (353,186) 22,389,528
1 Shares paid to Non-Executive Directors as part of their remuneration package were issued post the financial year end.

Mineral Resources Limited Directors' report 30 June 2019
Remuneration report (audited) (continued)
45
10. Transactions with related parties
The following transactions occurred with related parties:
2019
$
2018
$
Key Management Personnel / directors’ interests:
Properties from which some of the Group’s operations are performed are rented from parties related to Chris Ellison and Peter Wade.
(2,026,840) (1,938,936)
Occupation of these premises date back prior to the Company’s listing in 2006. The ongoing need for occupation of these premises, as well as rental arrangements, are assessed periodically. The Group has a Related Party Transaction Policy that requires the review and approval of Related Party Transactions by the Audit and Risk Committee (the Committee). A resolution is required by the Company’s Board of Directors (where applicable, excluding those involved in the Related Party Transaction) to confirm that the transaction is on terms not materially less favourable than terms generally available from an unaffiliated third party under the same or similar circumstances.
This concludes the Remuneration Report, which has been audited.

Mineral Resources Limited Directors' report 30 June 2019
46
Indemnity and insurance of officers The Company has indemnified the directors and executives of the Company for costs incurred, in their capacity as a director or executive, for which they may be held personally liable, except where there is a lack of good faith. During the financial year, the Company paid a premium in respect of a contract to insure the directors and executives of the Company against a liability to the extent permitted by the Corporations Act 2001. The contract of insurance prohibits disclosure of the nature of the liability and the amount of the premium.
Indemnity and insurance of auditor The Company has not, during or since the financial year, indemnified or agreed to indemnify the auditor of the Company or any related entity against a liability incurred by the auditor. During the financial year, the Company has not paid a premium in respect of a contract to insure the auditor of the Company or any related entity.
Proceedings on behalf of the Company No person has applied to the Court under section 237 of the Corporations Act 2001 for leave to bring proceedings on behalf of the Company, or to intervene in any proceedings to which the Company is a party for the purpose of taking responsibility on behalf of the Company for all or part of those proceedings.
Non-audit services Details of the amounts paid or payable to the auditor for non-audit services provided during the financial year by the auditor are outlined in note 37 to the financial statements. The directors are satisfied that the provision of non-audit services during the financial year, by the auditor (or by another person or firm on the auditor's behalf), is compatible with the general standard of independence for auditors imposed by the Corporations Act 2001. The directors are of the opinion that the services as disclosed in note 37 to the financial statements do not compromise the external auditor's independence requirements of the Corporations Act 2001 for the following reasons: ● all non-audit services have been reviewed and approved to ensure that they do not impact the integrity and objectivity
of the auditor; and ● none of the services undermine the general principles relating to auditor independence as set out in APES 110 Code
of Ethics for Professional Accountants issued by the Accounting Professional and Ethical Standards Board, including reviewing or auditing the auditor's own work, acting in a management or decision-making capacity for the Company, acting as advocate for the Company or jointly sharing economic risks and rewards.
Officers of the Company who are former partners of RSM Australia Partners There are no officers of the Company who are former partners of RSM Australia Partners.
Rounding of amounts The Company is of a kind referred to in Corporations Instrument 2016/191, issued by the Australian Securities and Investments Commission, relating to 'rounding-off'. Amounts in this report have been rounded off in accordance with that Corporations Instrument to the nearest thousand dollars, or in certain cases, the nearest dollar.
Auditor's independence declaration A copy of the auditor's independence declaration as required under section 307C of the Corporations Act 2001 is set out immediately after this directors' report.
Auditor RSM Australia Partners continues in office in accordance with section 327 of the Corporations Act 2001.

Mineral Resources Limited Directors' report 30 June 2019
47
This report is made in accordance with a resolution of directors, pursuant to section 298(2)(a) of the Corporations Act 2001. On behalf of the directors
Chris Ellison Managing Director 22 August 2019 Perth

THE POWER OF BEING UNDERSTOODAUDIT | TAX | CONSULTING
RSM Australia Partners is a member of the RSM network and trades as RSM. RSM is the trading name used by the members of the RSM network. Each member of the RSM network is an independent accounting and consulting firm which practices in its own right. The RSM network is not itself a separate legal entity in any jurisdiction.
RSM Australia Partners ABN 36 965 185 036
Liability limited by a scheme approved under Professional Standards Legislation
RSM Australia Partners
8 St Georges Terrace Perth WA 6000 GPO Box R1253 Perth WA 6844
T +61 (0) 8 9261 9100 F +61 (0) 8 9261 9111
www.rsm.com.au
AUDITOR’S INDEPENDENCE DECLARATION
As lead auditor for the audit of the financial report of Mineral Resources Limited for the year ended 30 June 2019, I declare that, to the best of my knowledge and belief, there have been no contraventions of:
(i) the auditor independence requirements of the Corporations Act 2001 in relation to the audit; and
(ii) any applicable code of professional conduct in relation to the audit.
RSM AUSTRALIA PARTNERS
Perth, WA JAMES KOMNINOS Dated: 22 August 2019 Partner

Mineral Resources Limited Statement of profit or loss and other comprehensive income For the year ended 30 June 2019
Group Note 2019 2018 $'000 $'000
The above statement of profit or loss and other comprehensive income should be read in conjunction with the accompanying notes
49
Revenue 4 1,511,975 1,624,431 Other income 5 10,572 85,619 Expenses Changes in closing stock 60,364 96,454 Raw materials and consumables (165,555) (149,252) Equipment costs (60,248) (72,581) Subcontractors (106,574) (149,153) Employee benefits expense (278,141) (225,159) Transport and freight (431,742) (518,937) Depreciation and amortisation 6 (108,634) (112,876) Impairment charges 6 (9,809) (65,365) Other expenses 6 (152,323) (112,862) Finance costs 6 (33,877) (10,090)
Profit before tax 236,008 390,229 Income tax expense 7 (71,020) (118,381) Profit after tax for the year 164,988 271,848
Other comprehensive income Items that may be reclassified subsequently to profit or loss Net gain on cash flow hedges 5,209 290
Other comprehensive income for the year, net of tax 5,209 290
Total comprehensive income for the year 170,197 272,138
Profit for the year is attributable to: Non-controlling interest 1,319 (650) Owners of Mineral Resources Limited 163,669 272,498
164,988 271,848
Total comprehensive income for the year is attributable to: Non-controlling interest 1,319 (650) Owners of Mineral Resources Limited 168,878 272,788
170,197 272,138
Cents Cents Basic earnings per share 8 87.09 145.30 Diluted earnings per share 8 87.09 145.30

Mineral Resources Limited Statement of financial position As at 30 June 2019
Group Note 2019 2018 $'000 $'000
The above statement of financial position should be read in conjunction with the accompanying notes 50
Assets Current assets Cash and cash equivalents 9 265,399 240,406 Trade and other receivables 10 167,466 101,838 Inventories 11 180,126 132,189 Current tax assets 54,413 33,607 Other 12 35,401 14,531
702,805 522,571 Assets held for sale 13 503,970 -
Total current assets 1,206,775 522,571
Non-current assets Receivables 14 39,976 250 Financial assets 15 75,149 118,113 Property, plant and equipment 16 1,300,578 972,531 Intangibles 17 84,811 69,302 Exploration and mine development 18 408,512 364,484 Deferred tax 7 45,456 38,084
Total non-current assets 1,954,482 1,562,764
Total assets 3,161,257 2,085,335
Liabilities Current liabilities Trade and other payables 20 259,441 261,571 Borrowings 21 55,269 63,852 Employee benefits 22 35,565 42,176 Provisions 23 11,422 7,115
361,697 374,714 Liabilities directly associated with assets classified as held for sale 13 63,092 - Total current liabilities 424,789 374,714
Non-current liabilities Borrowings 21 1,081,715 175,437 Deferred tax 7 185,572 165,736 Provisions 23 88,975 64,882
Total non-current liabilities 1,356,262 406,055
Total liabilities 1,781,051 780,769
Net assets 1,380,206 1,304,566
Equity Issued capital 24 507,855 511,188 Reserves 16,110 1,442 Retained profits 837,255 774,126
Equity attributable to the owners of Mineral Resources Limited 1,361,220 1,286,756 Non-controlling interest 18,986 17,810
Total equity 1,380,206 1,304,566

Mineral Resources Limited Statement of changes in equity For the year ended 30 June 2019
The above statement of changes in equity should be read in conjunction with the accompanying notes 51
Issued
Retained Non-
controlling
Total equity capital Reserves profits interest Group $'000 $'000 $'000 $'000 $'000 Balance at 1 July 2017 502,448 1,152 610,130 18,362 1,132,092 Profit/(loss) after tax for the year - - 272,498 (650) 271,848 Other comprehensive income for the year, net of tax
-
290
-
-
290
Total comprehensive income for the year - 290 272,498 (650) 272,138 Transactions with owners in their capacity as owners:
Share issued under Dividend Reinvestment Plan (note 24)
6,493
-
-
-
6,493
Employee share awards issued (note 24) 2,247 - - - 2,247 Acquisition of subsidiary - - - 98 98 Dividends paid (note 25) - - (108,502) - (108,502)
Balance at 30 June 2018 511,188 1,442 774,126 17,810 1,304,566
Issued
Retained Non-
controlling
Total equity capital Reserves profits interest Group $'000 $'000 $'000 $'000 $'000 Balance at 1 July 2018 511,188 1,442 774,126 17,810 1,304,566 Prior period remeasurement on adoption of AASB 15 (note 1(w))
-
-
(1,139)
-
(1,139)
Balance at 1 July 2018 - restated 511,188 1,442 772,987 17,810 1,303,427 Profit after tax for the year - - 163,669 1,319 164,988 Other comprehensive income for the year, net of tax
-
5,209
-
-
5,209
Total comprehensive income for the year - 5,209 163,669 1,319 170,197 Transactions with owners in their capacity as owners:
Share issued under Dividend Reinvestment Plan (note 24)
5,879
-
-
-
5,879
Purchase of shares under employee share plans (note 24)
(18,922)
-
-
-
(18,922)
Equity settled share-based payments - 20,904 - - 20,904 Employee share awards issued (note 24) 9,710 (11,445) - - (1,735) Other - - - (143) (143) Dividends paid (note 25) - - (99,401) - (99,401)
Balance at 30 June 2019 507,855 16,110 837,255 18,986 1,380,206

Mineral Resources Limited Statement of cash flows For the year ended 30 June 2019
Group Note 2019 2018 $'000 $'000
The above statement of cash flows should be read in conjunction with the accompanying notes 52
Cash flows from operating activities Receipts from customers 1,449,353 1,654,505 Payments to suppliers and employees (1,180,078) (1,115,832)
269,275 538,673 Interest received 2,469 3,522 Interest and other finance costs paid (19,445) (9,430) Income taxes paid (66,200) (121,337)
Net cash from operating activities 9(b) 186,099 411,428
Cash flows from investing activities Payments for investments (3,388) (14,905) Proceeds from disposal of investment 4,000 9,763 Payments for property, plant and equipment (686,638) (259,713) Proceeds from disposal of property, plant and equipment 16,808 7,739 Payments for intangibles (17,829) (11,704) Payments for exploration and evaluation (43,534) (3,791) Payments for mine development expenditure (62,144) (66,920) Payment for increased investment in joint operations (44,405) - Amounts received from joint operations 6,754 6,754 Amounts advanced to other parties (10,000) -
Net cash used in investing activities (840,376) (332,777)
Cash flows from financing activities Dividends paid (93,518) (102,009) Proceeds from borrowings 1,671,457 110,000 Repayment of borrowings (796,750) (166,191) Payment of finance lease liabilities (82,731) (58,122) Purchase of shares under employee share plans (18,922) -
Net cash from/(used in) financing activities 679,536 (216,322)
Net increase/(decrease) in cash and cash equivalents 25,259 (137,671) Cash and cash equivalents at the beginning of the financial year 240,406 378,169 Effects of exchange rate changes on cash and cash equivalents (266) (92)
Cash and cash equivalents at the end of the financial year 9(a) 265,399 240,406

Mineral Resources Limited Notes to the financial statements 30 June 2019
53
Notes to the financial statements Basis of preparation
Note 1. Significant accounting policies 54 Note 2. Critical accounting judgements, estimates and assumptions 66 Note 3. Operating segments 68 Note 4. Revenue 70 Note 5. Other income 71 Note 6. Expenses 72 Note 7. Income tax expense 73 Note 8. Earnings per share 75
Key balance sheet items Note 9. Current assets - cash and cash equivalents 75 Note 10. Current assets - trade and other receivables 76 Note 11. Current assets - inventories 76 Note 12. Current assets - other 76 Note 13. Current assets - assets held for sale 77 Note 14. Non-current assets - receivables 77 Note 15. Non-current assets - financial assets 78 Note 16. Non-current assets - property, plant and equipment 78 Note 17. Non-current assets - intangibles 80 Note 18. Non-current assets - exploration and mine development 81 Note 19. Impairment of non-financial assets 81 Note 20. Trade and other payables 82 Note 21. Borrowings 83 Note 22. Employee benefits 83 Note 23. Provisions 84 Note 24. Equity - issued capital 85 Note 25. Equity - dividends 86 Note 26. Financial instruments 86 Note 27. Fair value measurement 93
Unrecognised items Note 28. Contingent liabilities 94 Note 29. Commitments 94
Other information Note 30. Parent entity information 95 Note 31. Business combinations 96 Note 32. Interests in subsidiaries 98 Note 33. Interests in joint operations 98 Note 34. Related party transactions 98 Note 35. Key Management Personnel disclosures 99 Note 36. Share based payments 100 Note 37. Remuneration of auditors 102 Note 38. Events after the reporting period 103
Mineral Resources Limited Notes to the financial statements 30 June 2019
54
Note 1. Significant accounting policies The principal accounting policies adopted in the preparation of the financial statements are set out below. These policies have been consistently applied to all the years presented, unless otherwise stated. 1.1 Basis of preparation These general purpose financial statements have been prepared in accordance with Australian Accounting Standards and Interpretations issued by the Australian Accounting Standards Board (AASB) and the Corporations Act 2001, as appropriate for for-profit oriented entities. These financial statements also comply with International Financial Reporting Standards as issued by the International Accounting Standards Board (IASB). Historical cost convention The financial statements have been prepared under the historical cost convention, except for, where applicable, the revaluation of financial assets and liabilities at fair value through profit or loss, certain classes of property, plant and equipment and derivative financial instruments. Critical accounting estimates The preparation of the financial statements requires the use of certain critical accounting estimates. It also requires management to exercise its judgement in the process of applying the Group's accounting policies. The areas involving a higher degree of judgement or complexity, or areas where assumptions and estimates are significant to the financial statements, are disclosed in note 2. Rounding of amounts The Company is of a kind referred to in Corporations Instrument 2016/191, issued by the Australian Securities and Investment Commission, relating to 'rounding-off'. Amounts in this report have been rounded off in accordance with that Corporations Instrument to the nearest thousand dollars, or in certain cases, the nearest dollar. Foreign currency transactions The financial statements are presented in Australian dollars, which is the Group's functional and presentation currency. Foreign currency transactions are translated into Australian dollars using the exchange rates prevailing at the dates of the transactions. Foreign exchange gains and losses resulting from the settlement of such transactions and from the translation at financial year-end exchange rates of monetary assets and liabilities denominated in foreign currencies are recognised in profit or loss. 1.2 Principles of consolidation The consolidated financial statements incorporate the assets and liabilities of all subsidiaries of the Company as at 30 June 2019 and the results of all subsidiaries for the year then ended. Subsidiaries are all those entities over which the Group has control. The Group controls an entity when the Group is exposed to, or has rights to, variable returns from its involvement with the entity and has the ability to affect those returns through its power to direct the activities of the entity. Subsidiaries are fully consolidated from the date on which control is transferred to the Group. They are de-consolidated from the date that control ceases. Intercompany transactions, balances and unrealised gains on transactions between entities in the Group are eliminated. Unrealised losses are also eliminated unless the transaction provides evidence of the impairment of the asset transferred. Accounting policies of subsidiaries have been changed where necessary to ensure consistency with the policies adopted by the Group. The acquisition of subsidiaries is accounted for using the acquisition method of accounting. A change in ownership interest, without the loss of control, is accounted for as an equity transaction, where the difference between the consideration transferred and the book value of the share of the non-controlling interest acquired is recognised directly in equity attributable to the parent. Profit or loss and each component of other comprehensive income are attributed to the equity holders of the parent of the Group and to the non-controlling interests, even if this results in the non-controlling interests having a deficit balance.

Mineral Resources Limited Notes to the financial statements 30 June 2019
Note 1. Significant accounting policies (continued)
55
Where the Group loses control over a subsidiary, it derecognises the assets including goodwill, liabilities and non-controlling interest in the subsidiary together with any cumulative translation differences recognised in equity. The Group recognises the fair value of the consideration received and the fair value of any investment retained together with any gain or loss in profit or loss. 1.3 Summary of significant accounting policies (a) Business combinations The acquisition method of accounting is used to account for business combinations regardless of whether equity instruments or other assets are acquired. The consideration transferred is the sum of the acquisition-date fair values of the assets transferred, equity instruments issued or liabilities incurred by the acquirer to former owners of the acquiree and the amount of any non-controlling interest in the acquiree. For each business combination, the non-controlling interest in the acquiree is measured at either fair value or at the proportionate share of the acquiree's identifiable net assets. All acquisition costs are expensed as incurred to profit or loss. On the acquisition of a business, the Group assesses the financial assets acquired and liabilities assumed for appropriate classification and designation in accordance with the contractual terms, economic conditions, the Group's operating or accounting policies and other pertinent conditions in existence at the acquisition-date. Where the business combination is achieved in stages, the Group remeasures its previously held equity interest in the acquiree at the acquisition-date fair value and the difference between the fair value and the previous carrying amount is recognised in profit or loss. Contingent consideration to be transferred by the acquirer is recognised at the acquisition-date fair value. Subsequent changes in the fair value of the contingent consideration classified as an asset or liability is recognised in profit or loss. Contingent consideration classified as equity is not remeasured and its subsequent settlement is accounted for within equity. The difference between the acquisition-date fair value of assets acquired, liabilities assumed and any non-controlling interest in the acquiree and the fair value of the consideration transferred and the fair value of any pre-existing investment in the acquiree is recognised as goodwill. If the consideration transferred and the pre-existing fair value is less than the fair value of the identifiable net assets acquired, being a bargain purchase to the acquirer, the difference is recognised as a gain directly in profit or loss by the acquirer on the acquisition-date, but only after a reassessment of the identification and measurement of the net assets acquired, the non-controlling interest in the acquiree, if any, the consideration transferred and the acquirer's previously held equity interest in the acquirer. Business combinations are initially accounted for on a provisional basis. The acquirer retrospectively adjusts the provisional amounts recognised and also recognises additional assets or liabilities during the measurement period, based on new information obtained about the facts and circumstances that existed at the acquisition-date. The measurement period ends on either the earlier of (i) 12 months from the date of the acquisition or (ii) when the acquirer receives all the information possible to determine fair value. (b) Joint operations A joint operation is a joint arrangement whereby the parties that have joint control of the arrangement have rights to the assets, and obligations for the liabilities, relating to the arrangement. The Group has recognised its share of jointly held assets, liabilities, revenues and expenses of joint operations. These have been incorporated in the financial statements under the appropriate classifications.
Mineral Resources Limited Notes to the financial statements 30 June 2019
Note 1. Significant accounting policies (continued)
56
(c) Revenue from contracts with customers Revenue is recognised at an amount that reflects the consideration to which the Group is expected to be entitled in exchange for transferring goods or services to a customer. For each contract with a customer, the Group: identifies the contract with a customer; identifies the performance obligations in the contract; determines the transaction price which takes into account estimates of variable consideration and the time value of money; allocates the transaction price to the separate performance obligations on the basis of the relative stand-alone selling price of each distinct good or service to be delivered; and recognises revenue when or as each performance obligation is satisfied in a manner that depicts the transfer to the customer of the goods or services promised. Variable consideration within the transaction price, if any, reflects concessions provided to the customer such as discounts, rebates and refunds, any potential bonuses receivable from the customer and any other contingent events. Such estimates are determined using either the 'expected value' or 'most likely amount' method. The measurement of variable consideration is subject to a constraining principle whereby revenue will only be recognised to the extent that it is highly probable that a significant reversal in the amount of cumulative revenue recognised will not occur. The measurement constraint continues until the uncertainty associated with the variable consideration is subsequently resolved. Amounts received that are subject to the constraining principle are recognised as a refund liability. (i) Sale of goods The Group earns revenue by mining, processing, and subsequently selling commodity products (including iron ore and lithium) by export to customers under a range of commercial terms. Revenue from the sale of product is recognised at the point in time when control has been transferred to the customer, no further work or processing is required by the Group, the quantity and quality of the goods has been determined with reasonable accuracy, the price is fixed or determinable, and collectability is reasonably assured. This is generally when title passes. The majority of the Group's sales agreements specify that title passes when the product is delivered to the destination specified by the customer, which is typically the vessel on which the product will be shipped. In practical terms, revenue is generally recognised on the bill of lading date, which is the date the commodity is delivered to the shipping agent. Within each contract to sell commodity products, each unit of product shipped is a separate performance obligation. Revenue is generally recognised at the contracted price at this reflects the stand-alone selling price. The Group’s sales agreements may provide for provisional pricing of sales with pricing subsequently adjusted to reflect market prices over a quotation period stipulated in the sales contract, typically on or after the vessel’s arrival to the port of discharge. The estimated consideration in relation to provisionally priced contracts is marked to market using the spot price at the end of each reporting period with the impact of the price movements recorded as an adjustment to sales revenue. These sales agreements also allow for an adjustment to the sales price based on a survey of the goods by the customer (an assay for mineral content), therefore recognition of the sales revenue is based on the most recently determined estimate of product specifications. The effect of variable consideration arising from these arrangements with customers is included in revenue to the extent that it is highly probable that there will be no significant reversal of the cumulative amount of revenue recognised when any pricing uncertainty is resolved. The Group sells the majority its commodity products on CFR (Cost and Freight) or CIF (Cost, Insurance and Freight) Incoterms which means that the Group is responsible for providing freight services and, in CIF instances, insurance after the date at which title of the goods passes. The Group therefore has separate performance obligations for freight/insurance services provided for sale of products under CFR and CIF incoterms. Freight/insurance revenue is allocated from the overall contract price at its standalone selling price (where observable) or otherwise at its estimated cost plus margin. The recognition of freight/insurance revenue is deferred until the product is delivered rather than when the product is shipped. The Group does not disclose sales revenue from freight and insurance services separately as it does not consider that this is necessary in order to understand the impact of economic factors on the Group; and the Group's Chief Operating Decision Makers (as defined in the operating segments note 3) do not review information specifically relating to these sources of revenue in order to evaluate the performance of business segments, neither is information on these sources of revenue provided externally. The Group applies the practical expedient in AASB 15 paragraph 121 for its freight/insurance services and does not disclose information on the transaction price allocated to performance obligations that remain unsatisfied at the end of the reporting period as the performance obligations arising under sales arrangement for its commodity products have an original expected duration of one year or less.
Mineral Resources Limited Notes to the financial statements 30 June 2019
Note 1. Significant accounting policies (continued)
57
(ii) Rendering of services The Group’s Mining Services & Processing segment earns contract and operational revenue from the provision of a range of mining services, including crushing services. Revenue from mining services is recognised over time as the services are rendered. As mining services are invoiced on a monthly basis based on the actual services provided or at cost plus margin incurred to date, the Group has used the practical expedient available under AASB 15 to recognise revenue based on the right to invoice, on the basis that the invoiced amount corresponds directly with the value to the customer of the Group’s performance completed to date. For crushing service contracts specifically, each tonne of ore crushed represents a separate performance obligation. Revenue from the rendering of crushing services is measured and recognised as each tonne is crushed based on a schedule of rates that is invoiced to the customer, being the estimate of the price to which the Group expects to be entitled, and a corresponding trade receivable is recognised. Mobilisation / demobilisation charges on crushing service contracts constitute variable charges that will be associated and allocated to each tonne crushed (each performance obligation) and therefore recognised based on the actual tonnes crushed each period, rather than when invoiced. The Group applies the practical expedient in AASB 15 paragraph 121 for its mining services revenue and does not disclose information on the transaction price allocated to performance obligations that remain unsatisfied at the end of the reporting period as these are not material. (d) Income tax The income tax expense or benefit for the period is the tax payable on that period's taxable income based on the applicable income tax rate for each jurisdiction, adjusted by the changes in deferred tax assets and liabilities attributable to temporary differences, unused tax losses and the adjustment recognised for prior periods, where applicable. Deferred tax assets and liabilities are recognised for temporary differences at the tax rates expected to be applied when the assets are recovered or liabilities are settled, based on those tax rates that are enacted or substantively enacted, except for: ● When the deferred income tax asset or liability arises from the initial recognition of goodwill or an asset or liability in a
transaction that is not a business combination and that, at the time of the transaction, affects neither the accounting nor taxable profits; or
● When the taxable temporary difference is associated with interests in subsidiaries, associates or joint ventures, and the timing of the reversal can be controlled and it is probable that the temporary difference will not reverse in the foreseeable future.
Deferred tax assets are recognised for deductible temporary differences and unused tax losses only if it is probable that future taxable amounts will be available to utilise those temporary differences and losses. The carrying amount of recognised and unrecognised deferred tax assets are reviewed at each reporting date. Deferred tax assets recognised are reduced to the extent that it is no longer probable that future taxable profits will be available for the carrying amount to be recovered. Previously unrecognised deferred tax assets are recognised to the extent that it is probable that there are future taxable profits available to recover the asset. Deferred tax assets and liabilities are offset only where there is a legally enforceable right to offset current tax assets against current tax liabilities and deferred tax assets against deferred tax liabilities; and they relate to the same taxable authority on either the same taxable entity or different taxable entities which intend to settle simultaneously. Mineral Resources Limited (the 'head entity') and its wholly-owned Australian subsidiaries have formed an income tax group under the tax consolidation regime. The head entity and each subsidiary in the tax consolidated group continue to account for their own current and deferred tax amounts. The tax group has applied the 'separate taxpayer within group' approach in determining the appropriate amount of taxes to allocate to members of the tax group. In addition to its own current and deferred tax amounts, the head entity also recognises the current tax liabilities (or assets) and the deferred tax assets arising from unused tax losses and unused tax credits assumed from each subsidiary in the tax group.

Mineral Resources Limited Notes to the financial statements 30 June 2019
Note 1. Significant accounting policies (continued)
58
Assets or liabilities arising under tax funding agreements with the tax group are recognised as amounts receivable from or payable to other entities in the tax group. The tax funding arrangement ensures that the intercompany charge equals the current tax liability or benefit of each tax group member, resulting in neither a contribution by the head entity to the subsidiaries nor a distribution by the subsidiaries to the head entity. (e) Current and non-current classification Assets and liabilities are presented in the statement of financial position based on current and non-current classification. An asset is current when it is expected to be realised or intended to be sold or consumed in normal operating cycle; it is held primarily for the purpose of trading; it is expected to be realised within 12 months after the reporting period; or the asset is cash or cash equivalent unless restricted from being exchanged or used to settle a liability for at least 12 months after the reporting period. All other assets are classified as non-current. A liability is current when it is expected to be settled in normal operating cycle; it is held primarily for the purpose of trading; it is due to be settled within 12 months after the reporting period; or there is no unconditional right to defer the settlement of the liability for at least 12 months after the reporting period. All other liabilities are classified as non-current. Deferred tax assets and liabilities are always classified as non-current. (f) Financial Instruments (i) Classification of financial instruments The Group classified its financial assets under AASB 9 into the following measurement categories:
Those to be measured at fair value (either through other comprehensive income (FVOCI), or through profit or loss (FVTPL)); and
Those to be measured at amortised cost. The classification depends on the Group’s business model for managing financial assets and the contractual terms of the financial assets cash flows. The Group classifies its financial liabilities as liabilities at amortised cost. (ii) Financial assets Cash and cash equivalents Cash and cash equivalents includes cash on hand, deposits held at call with financial institutions, other short-term, highly liquid investments with original maturities of three months or less that are readily convertible to known amounts of cash and which are subject to an insignificant risk of changes in value. Cash and cash equivalents are classified as financial assets held at amortised cost. Trade and other receivables Trade receivables are initially recognised at fair value and subsequently measured at amortised cost using the effective interest method, less any allowance for impairment losses. Trade receivables are generally due for settlement within 30 days. Refer note 26(d) for the Group’s credit risk management policies.

Mineral Resources Limited Notes to the financial statements 30 June 2019
Note 1. Significant accounting policies (continued)
59
Impairment of trade receivables Collectability of trade receivables is reviewed on an ongoing basis. Loss allowances for trade receivables are measured at an amount equal to lifetime expected credit losses (ECLs). Lifetime ECLs are the ECLs that result from all possible default events over the expected life of a financial instrument. Significant financial difficulties of the debtor, probability that the debtor will enter bankruptcy or financial reorganisation and default or delinquency in payments are considered indicators that a receivable is credit-impaired. ECLs are a probability-weighted estimate of credit losses. Credit losses are measured as the present value of all cash shortfalls (i.e. the difference between the cash flows due to the entity in accordance with the contract and the cash flows that the Group expects to receive). Cash flows relating to short-term receivables are not discounted if the effect of discounting is immaterial. Debts which are known to be uncollectable are written off by reducing the carrying amount directly. If an impairment allowance has been recognised for a debt that then becomes uncollectable, the debt is written off against the allowance account. If an amount is subsequently recovered, it is credited against profit or loss. Loans and other receivables Other receivables generally arise from transactions outside the usual operating activities of the Group. Loans and other receivables are classified as financial assets held at amortised cost, less any allowance for impairment losses. The Group’s other receivables do not contain impaired assets and are not past due. Based on the credit history, it is expected that these other receivables will be received when due. Financial assets – investments in equity instruments The Group’s investments in equity instruments that are not held for trading are measured at fair value through profit or loss (FVTPL). An irrevocable election has not been made by management to measure any instruments at fair value through other comprehensive income (FVOCI). This election is made on an investment by investment basis. Investments in equity instruments are initially recognised at fair value, with transaction costs recognised in the income statement as incurred. Subsequently, they are measured at fair value and any gains and losses are recognised in profit or loss as they arise. (iii) Financial liabilities Loans and borrowings Loans and borrowings are initially recognised at the fair value of the consideration received, net of transaction costs. They are subsequently measured at amortised cost using the effective interest method. Where there is an unconditional right to defer settlement of the liability for at least 12 months after the reporting date, the loans or borrowings are classified as non-current. (iv) Derivative financial instruments The Group holds derivative financial instruments to hedge its foreign currency risk exposure and a portion of its exposure to iron ore prices. Derivatives are initially recognised at fair value on the date a derivative contract is entered into and are subsequently remeasured to their fair value at each reporting date. The accounting for subsequent changes in fair value depends on whether the derivative is designated as a hedging instrument, and if so, the nature of the item being hedged. Cash flow hedges Cash flow hedges are used to cover the Group's exposure to variability in cash flows that is attributable to particular risks associated with a recognised asset or liability or a firm commitment which could affect profit or loss. When a derivative is designated as a cash flow hedging instrument, the effective portion of the gain or loss on the hedging instrument is recognised in other comprehensive income through the cash flow hedges reserve in equity, whilst the ineffective portion is recognised in profit or loss. Amounts taken to equity are transferred out of equity and included in the measurement of the hedged transaction when the forecast transaction occurs. Cash flow hedges are tested for effectiveness on a regular basis both retrospectively and prospectively to ensure that each hedge is highly effective and continues to be designated as a cash flow hedge. If the forecast transaction is no longer expected to occur, the amounts recognised in equity are transferred to profit or loss.

Mineral Resources Limited Notes to the financial statements 30 June 2019
Note 1. Significant accounting policies (continued)
60
(g) Inventories Raw materials, work in progress and finished goods are stated at the lower of cost and net realisable value on a 'first in first out' basis. Cost comprises direct materials and delivery costs, direct labour, import duties and other taxes, an appropriate proportion of variable and fixed overhead expenditure based on normal operating capacity, and, where applicable, transfers from cash flow hedging reserves in equity. Costs of purchased inventory are determined after deducting rebates and discounts received or receivable. Net realisable value is the estimated selling price in the ordinary course of business less the estimated costs of completion and the estimated costs necessary to make the sale. (h) Non-current assets or disposal groups classified as held for sale Non-current assets and assets of disposal groups are classified as held for sale if their carrying amount will be recovered principally through a sale transaction rather than through continued use. They are measured at the lower of their carrying amount and fair value less costs of disposal. For non-current assets or assets of disposal groups to be classified as held for sale, they must be available for immediate sale in their present condition and their sale must be highly probable. An impairment loss is recognised for any initial or subsequent write down of the non-current assets and assets of disposal groups to fair value less costs of disposal. A gain is recognised for any subsequent increases in fair value less costs of disposal of a non-current assets and assets of disposal groups, but not in excess of any cumulative impairment loss previously recognised. Non-current assets are not depreciated or amortised while they are classified as held for sale. Interest and other expenses attributable to the liabilities of assets held for sale continue to be recognised. Non-current assets classified as held for sale and the assets of disposal groups classified as held for sale are presented separately on the face of the statement of financial position, in current assets. The liabilities of disposal groups classified as held for sale are presented separately on the face of the statement of financial position, in current liabilities. (i) Property, plant and equipment Owned assets Items of plant and equipment are stated at cost less accumulated depreciation and impairment losses. The cost of self-constructed assets includes the cost of materials, direct labour and an appropriate portion of production overheads. The cost of self-constructed and acquired assets includes (i) the initial estimate at the time of installation and during the period of use, when relevant, of the costs of dismantling and removing the items and restoring the site on which they are located, and (ii) changes in the measurement of existing liabilities recognised for these costs resulting from changes in the timing or outflow of resources required to settle the obligation or from changes in the discount rate. Where parts of an item of plant and equipment have different useful lives, they are accounted for as separate items of plant and equipment. Leased assets Leases in terms of which the Group assumes substantially all of the risks and rewards of ownership are classified as finance leases. Finance leases are stated at an amount equal to the lower of fair value and the present value of minimum lease payment at inception of the lease, less accumulated depreciation and impairment losses. Depreciation Depreciation is calculated on a straight-line basis to write off the net cost of each item of property, plant and equipment over their expected useful lives as follows: Buildings 40 years Plant and equipment financed 3 - 20 years or the term of the lease Plant and equipment 1 - 10 years or usage basis The residual values, useful lives and depreciation methods are reviewed, and adjusted if appropriate, at each reporting date.

Mineral Resources Limited Notes to the financial statements 30 June 2019
Note 1. Significant accounting policies (continued)
61
Subsequent costs The Group recognises in the carrying amount of an item of plant and equipment the cost of replacing part of such an item when that cost is incurred if it is probable that the future economic benefits embodied within the item will flow to the Group and the cost of the item can be measured reliably. All other costs are recognised in the statement of profit or loss and other comprehensive income as an expense as incurred. Revaluation Increases in the carrying amount arising on the revaluation of plant and equipment are credited to a revaluation reserve in equity. Decreases that offset previous increases of the same asset are charged against fair value reserves directly in equity; all other decreases are charged to profit or loss as an expense. (j) Leases The determination of whether an arrangement is or contains a lease is based on the substance of the arrangement and requires an assessment of whether the fulfilment of the arrangement is dependent on the use of a specific asset or assets and the arrangement conveys a right to use the asset. A distinction is made between finance leases, which effectively transfer from the lessor to the lessee substantially all the risks and benefits incidental to the ownership of leased assets, and operating leases, under which the lessor effectively retains substantially all such risks and benefits. Finance leases are capitalised. A lease asset and liability are established at the fair value of the leased assets, or if lower, the present value of minimum lease payments. Lease payments are allocated between the principal component of the lease liability and the finance costs, so as to achieve a constant rate of interest on the remaining balance of the liability. Leased assets acquired under a finance lease are depreciated over the asset's useful life or over the shorter of the asset's useful life and the lease term if there is no reasonable certainty that the Group will obtain ownership at the end of the lease term. Operating lease payments, net of any incentives received from the lessor, are charged to profit or loss on a straight-line basis over the term of the lease. (k) Intangible assets Intangible assets acquired as part of a business combination, other than goodwill, are initially measured at their fair value at the date of the acquisition. Intangible assets acquired separately are initially recognised at cost. Indefinite life intangible assets are not amortised and are subsequently measured at cost less any impairment. Finite life intangible assets are subsequently measured at cost less amortisation and any impairment. The gains or losses recognised in profit or loss arising from the derecognition of intangible assets are measured as the difference between net disposal proceeds and the carrying amount of the intangible asset. The method and useful lives of finite life intangible assets are reviewed annually. Changes in the expected pattern of consumption or useful life are accounted for prospectively by changing the amortisation method or period. Goodwill Goodwill arises on the acquisition of a business. Goodwill is not amortised. Instead, goodwill is tested annually for impairment, or more frequently if events or changes in circumstances indicate that it might be impaired, and is carried at cost less accumulated impairment losses. Impairment losses on goodwill are taken to profit or loss and are not subsequently reversed. Research and development Research costs are expensed in the period in which they are incurred. Development costs are capitalised when it is probable that the project will be a success considering its commercial and technical feasibility; the Group is able to use or sell the asset; the Group has sufficient resources; and intent to complete the development and its costs can be measured reliably. Capitalised development costs are amortised on a straight-line basis over the period of their expected benefit. Patents and trademarks Significant costs associated with patents and trademarks are deferred and amortised on a straight-line basis over the period of their expected benefit.
Mineral Resources Limited Notes to the financial statements 30 June 2019
Note 1. Significant accounting policies (continued)
62
Access rights Access rights acquired as part of a business combination are recognised separately from goodwill. The rights are carried at their fair value at the date of acquisition less accumulated amortisation and impairment losses. Amortisation is calculated based on the timing of projected cash flows of the access rights over their estimated useful lives. (l) Exploration and evaluation assets Exploration and evaluation expenditure in relation to separate areas of interest for which rights of tenure are current is carried forward as an asset in the statement of financial position where it is expected that the expenditure will be recovered through the successful development and exploitation of an area of interest, or by its sale; or exploration activities are continuing in an area and activities have not reached a stage which permits a reasonable estimate of the existence or otherwise of economically recoverable reserves. Where a project or an area of interest has been abandoned, the expenditure incurred thereon is written off in the year in which the decision is made. (m) Mine development Development expenditure incurred by or on behalf of the Group is accumulated separately for each area of interest in which economically recoverable resources have been identified. Such expenditure comprises cost directly attributable to the construction of a mine and the related infrastructure. Once a development decision has been taken, the carrying amount of the exploration and evaluation expenditure in respect of the area of interest is aggregated with the development expenditure and classified under non-current assets as development properties. A development property is reclassified as a mining property at the end of the commissioning phase, when the mine is capable of operating in the manner intended by management. Depreciation is charged using the units-of-production method, with separate calculations being made for each area of interest. The units-of-production basis results in a depreciation charge proportional to the depletion of proved, probable and estimated reserves. Development properties are tested for impairment in accordance with the policy on impairment of assets. Stripping (waste removal) costs As part of its mining operations, the Group incurs stripping (waste removal) costs both during the development phase and production phase of its operations. Development stripping costs arise from the removal of overburden and other mine waste materials removed during the development of a mine site in order to access the mineral deposit. Costs directly attributable to development stripping activities, inclusive of an allocation of relevant overhead expenditure, are initially capitalised to exploration and evaluation expenditure. Capitalisation of development stripping costs ceases at the time that saleable material begins to be extracted from the mine. On completion of development, all capitalised development stripping included in exploration and evaluation is transferred to mine development. Production stripping commences at the time that saleable materials begin to be extracted from the mine and, under normal circumstances, continue throughout the life of the mine. Costs of production stripping are charged to the profit or loss as operating costs when the ratio of waste material to ore extracted for a "component" of the ore body is expected to be constant throughout its estimated life. A "component" is a specific section of the orebody that is made more accessible by the stripping activity. It will typically be a subset of the larger orebody that is distinguished by a separate useful economic life.

Mineral Resources Limited Notes to the financial statements 30 June 2019
Note 1. Significant accounting policies (continued)
63
When the ratio of waste to ore is not expected to be constant, production stripping costs are accounted for as follows: (i) All costs are initially charged to profit or loss and classified as operating costs (ii) When the current ratio of waste to ore is greater than the estimated life-of-component strip ratio, a portion of the
stripping costs (inclusive of an allocation of relevant overhead expenditure) is capitalised to mine development as a stripping activity asset
(iii) The amount of production stripping costs capitalised or charged in a financial year is determined so that the stripping expense for the financial year reflects the estimated life-of-component strip ratio. The stripping activity asset is amortised on a units-of-production method over the life of the component, unless another method is more appropriate.
Life-of-component strip ratios are based on estimates of ore reserves and resources and the latest approved mine plan; they are a function of the mine design and therefore changes to that design will generally result in changes to the ratios. Changes to the estimated life-of-mine ratio are accounted for prospectively from the date of the change. (n) Impairment of non-financial assets Goodwill and other intangible assets that have an indefinite useful life are not subject to amortisation and are tested annually for impairment, or more frequently if events or changes in circumstances indicate that they might be impaired. Other non-financial assets are reviewed for impairment whenever events or changes in circumstances indicate that the carrying amount may not be recoverable. An impairment loss is recognised for the amount by which the asset's carrying amount exceeds its recoverable amount. Recoverable amount is the higher of an asset's fair value less costs of disposal and value-in-use. The value-in-use is the present value of the estimated future cash flows relating to the asset using a pre-tax discount rate specific to the asset or cash-generating unit to which the asset belongs. Assets that do not have independent cash flows are grouped together to form a cash-generating unit. (o) Borrowing costs Borrowing costs directly attributable to the acquisition, construction or production of assets that necessarily take a substantial period of time to prepare for their intended use or sale are added to the cost of those assets, until such time as the assets are substantially ready for their intended use or sale. All other borrowing costs are recognised in profit or loss in the period in which they are incurred. (p) Provisions Provisions are recognised when the Group has a present (legal or constructive) obligation as a result of a past event, it is probable the Group will be required to settle the obligation, and a reliable estimate can be made of the amount of the obligation. The amount recognised as a provision is the best estimate of the consideration required to settle the present obligation at the reporting date, taking into account the risks and uncertainties surrounding the obligation. If the time value of money is material, provisions are discounted using a current pre-tax rate specific to the liability. The increase in the provision resulting from the passage of time is recognised as a finance cost. (q) Employee benefits Liabilities for wages and salaries, including non-monetary benefits, annual leave and long service leave expected to be settled wholly within 12 months of the reporting date are measured at the amounts expected to be paid when the liabilities are settled. Share-based payments
Certain employees may be entitled to participate in employee share schemes, as set out in note 36. Equity-settled transactions are awards of shares, or options over shares, that are provided to employees in exchange for the rendering of services. The cost of equity-settled transactions are measured at fair value on grant date and recognised as an expense with a corresponding increase in equity over the vesting period. The cumulative charge to profit or loss is calculated based on the grant date fair value of the award, the best estimate of the number of awards that are likely to vest and the expired portion of the vesting period. The amount recognised in profit or loss for the period is the cumulative amount calculated at each reporting date less amounts already recognised in previous periods.
Mineral Resources Limited Notes to the financial statements 30 June 2019
Note 1. Significant accounting policies (continued)
64
If the non-vesting condition is within the control of the Group or employee, the failure to satisfy the condition is treated as a cancellation. If the condition is not within the control of the Group or employee and is not satisfied during the vesting period, any remaining expense for the award is recognised over the remaining vesting period, unless the award is forfeited. Employee share trust The Group has in place a trust to administer the Group's employee share and share option schemes. This trust is consolidated, as the substance of the relationship is that the trust is controlled by the consolidated entity. Shares held by the Mineral Resources Employee Share Trust are disclosed as treasury shares and deducted from contributed equity. (r) Fair value measurement When an asset or liability, financial or non-financial, is measured at fair value for recognition or disclosure purposes, the fair value is based on the price that would be received to sell an asset or paid to transfer a liability in an orderly transaction between market participants at the measurement date; and assumes that the transaction will take place either: in the principal market; or in the absence of a principal market, in the most advantageous market. Fair value is measured using the assumptions that market participants would use when pricing the asset or liability, assuming they act in their economic best interests. For non-financial assets, the fair value measurement is based on its highest and best use. Valuation techniques that are appropriate in the circumstances and for which sufficient data are available to measure fair value, are used, maximising the use of relevant observable inputs and minimising the use of unobservable inputs. Assets and liabilities measured at fair value are classified into three levels, using a fair value hierarchy that reflects the significance of the inputs used in making the measurements. Classifications are reviewed at each reporting date and transfers between levels are determined based on a reassessment of the lowest level of input that is significant to the fair value measurement. For recurring and non-recurring fair value measurements, external valuers may be used when internal expertise is either not available or when the valuation is deemed to be significant. External valuers are selected based on market knowledge and reputation. Where there is a significant change in fair value of an asset or liability from one period to another, an analysis is undertaken, which includes a verification of the major inputs applied in the latest valuation and a comparison, where applicable, with external sources of data. (s) Issued capital Ordinary shares are classified as equity. Incremental costs directly attributable to the issue of new shares or options are shown in equity as a deduction, net of tax, from the proceeds. (t) Dividends Dividends are recognised when declared during the financial year and no longer at the discretion of the Company. (u) Earnings per share Basic earnings per share Basic earnings per share is calculated by dividing the profit attributable to the owners of Mineral Resources Limited, excluding any costs of servicing equity other than ordinary shares, by the weighted average number of ordinary shares outstanding during the financial year, adjusted for bonus elements in ordinary shares issued during the financial year. Diluted earnings per share Diluted earnings per share adjusts the figures used in the determination of basic earnings per share to take into account the after income tax effect of interest and other financing costs associated with dilutive potential ordinary shares and the weighted average number of shares assumed to have been issued for no consideration in relation to dilutive potential ordinary shares. (v) Goods and Services Tax (GST) and other similar taxes Revenues, expenses and assets are recognised net of the amount of associated GST, unless the GST incurred is not recoverable from the tax authority. In this case it is recognised as part of the cost of the acquisition of the asset or as part of the expense.

Mineral Resources Limited Notes to the financial statements 30 June 2019
Note 1. Significant accounting policies (continued)
65
Receivables and payables are stated inclusive of the amount of GST receivable or payable. The net amount of GST recoverable from, or payable to, the tax authority is included in other receivables or other payables in the statement of financial position. Cash flows are presented on a gross basis. The GST components of cash flows arising from investing or financing activities which are recoverable from, or payable to the tax authority, are presented as operating cash flows. Commitments and contingencies are disclosed net of the amount of GST recoverable from, or payable to, the tax authority. (w) New or amended Accounting Standards and Interpretations adopted The Group has adopted all of the new, revised or amending Accounting Standards and Interpretations issued by the Australian Accounting Standards Board (AASB) that are mandatory for the current reporting period, including the application of AASB 15 ‘Revenue from Contracts with Customers’ (AASB 15) for the first time. The nature and effect of the changes as a result of adoption of AASB 15 is described below. Any new or amended Accounting Standards or Interpretations that are not yet mandatory have not been early adopted. AASB 15 Revenue from Contracts with Customers (AASB 15) The Group has adopted AASB 15 from 1 July 2018. AASB 15 supersedes AASB 118 ‘Revenue’, AASB 111 ‘Construction Contracts’ and related Interpretations. AASB 15 applies to all revenue arising from contracts with customers, unless those contracts are within the scope of other accounting standards. AASB 15 provides a single comprehensive model for revenue recognition. The core principle of the standard is that an entity shall recognise revenue to depict the transfer of promised goods or services to customers at an amount that reflects the consideration to which the entity expects to be entitled in exchange for those goods or services. The standard introduces a new contract-based revenue recognition model with a measurement approach that is based on an allocation of the transaction price. The adoption has resulted in changes in accounting policies from 1 July 2018 that are set out in note 1(c) and adjustments to the amounts recognised in the financial statements as described below. The change in the accounting policies has no impact on the commercial arrangements or current or future cash flows. In accordance with the transition provisions of the AASB 15, the Group has adopted the modified retrospective transition approach to implement the new standard. Under this approach, comparatives are not restated. Instead, the cumulative effect of adopting the new standard is applied only to contracts that remain in force at 1 July 2018 and recognised in the opening balance of retained earnings in the current reporting period. Adoption adjustment to the opening balance of retained earnings A $1,139,000 ($1,627,000 pre-tax) transition adjustment has been recognised in retained earnings on transition at 1 July 2018 without adjustment of comparatives. The transition adjustment related to mobilisation charges which were recognised as revenue during the period to 30 June 2018 for which the related performance obligation was partially completed as at that date. Under AASB 15, such charges cannot be recognised as revenue until the performance obligation is delivered over the contractual period. This resulted in a decrease to the opening balance of retained earnings as follows: Group $'000 Opening retained earnings 1 July 2018 as previously reported 774,126 Decrease due to deferral of revenue under AASB 15 (1,627) Deferred tax effect 488
Opening retained earnings 1 July 2018 restated 772,987
The impact of all other measurement differences identified between AASB 118 and AASB 15 was immaterial at 30 June 2018 and 1 July 2018.

Mineral Resources Limited Notes to the financial statements 30 June 2019
Note 1. Significant accounting policies (continued)
66
Impact of adoption on the current reporting period The impact of adopting the new standard for the year ended 30 June 2019 is a decrease of $8,221,000 in sales revenue compared with the amount that would have been reflected under AASB 118, as the recognition of freight revenue is now deferred until the product is delivered. Correspondingly, freight costs of $9,544,000 have also been deferred. The impact of all other measurement differences identified between AASB 118 and AASB 15 were immaterial for the year ended 30 June 2019. (x) New Accounting Standards and Interpretations not yet mandatory or early adopted Australian Accounting Standards and Interpretations that have recently been issued or amended but are not yet mandatory, have not been early adopted by the Group for the year ended 30 June 2019. The Group's assessment of the impact of these new or amended Accounting Standards and Interpretations, most relevant to the Group, are set out below. AASB 16 Leases (AASB 16) This standard is applicable to annual reporting periods beginning on or after 1 January 2019. The standard replaces AASB 117 'Leases' and will primarily affect the accounting of operating leases for lessees. Subject to exceptions, a 'right-of-use' asset will be capitalised in the statement of financial position, measured as the present value of the unavoidable future lease payments to be made over the lease term. A depreciation charge for the leased asset (included in operating costs) and an interest expense on the lease liability (included in finance costs) will be recognised. A liability corresponding to the capitalised lease will also be recognised, adjusted for lease prepayments, lease incentives received, initial direct costs incurred and an estimate of any future restoration, removal or dismantling costs. Exceptions will apply to short-term leases of 12 months or less and leases of low-value assets (such as personal computers and small office furniture) where an accounting policy choice exists whereby either a 'right-of-use' asset is recognised or lease payments are expensed to profit or loss as incurred. The Group is in the process of assessing the extent of the impact of the application of this standard from 1 July 2019. The financial estimate of the effect of adopting this standard is expected to approximate the Operating Lease Commitments set out in Note 29, with an increase in non-current assets and an increase in current and non-current liabilities materially in line with the balance shown for Operating Lease Commitments set out in Note 29. In the earlier periods of the lease, the expenses associated with the lease under AASB 16 will be higher when compared to lease expenses under AASB 117. EBITDA (Earnings Before Interest, Tax, Depreciation and Amortisation) results will be improved as the operating expense is replaced by interest expense and depreciation in profit or loss under AASB 16. Profit Before Tax will therefore not be materially affected by the adoption of this standard. For classification within the statement of cash flows, the lease payments will be separated into both a principal (financing activities) and interest (operating activities) component. The Group has ensured banking covenants, Long and Short-Term Incentive Plans will not be affected by the adoption of AASB 16.
Note 2. Critical accounting judgements, estimates and assumptions The preparation of the financial statements requires management to make judgements, estimates and assumptions that affect the reported amounts in the financial statements. Management continually evaluates its judgements and estimates in relation to assets, liabilities, contingent liabilities, revenue and expenses. Management bases its judgements, estimates and assumptions on historical experience and on other various factors, including expectations of future events, management believes to be reasonable under the circumstances. The resulting accounting judgements and estimates will seldom equal the related actual results. The judgements, estimates and assumptions that have a significant risk of causing a material adjustment to the carrying amounts of assets and liabilities (refer to the respective notes) within the next financial year are discussed below. Goodwill and other indefinite life intangible assets The Group tests annually, or more frequently if events or changes in circumstances indicate impairment, whether goodwill and other indefinite life intangible assets have suffered any impairment, in accordance with the accounting policy stated in note 1. The recoverable amounts of cash-generating units have been determined based on value-in-use calculations. These calculations require the use of assumptions, including estimated discount rates based on the current cost of capital and growth rates of the estimated future cash flows.

Mineral Resources Limited Notes to the financial statements 30 June 2019
Note 2. Critical accounting judgements, estimates and assumptions (continued)
67
Income tax The Group is subject to income taxes in the jurisdictions in which it operates. Significant judgement is required in determining the provision for income tax. There are many transactions and calculations undertaken during the ordinary course of business for which the ultimate tax determination is uncertain. The Group recognises liabilities for anticipated tax audit issues based on the Group's current understanding of the tax law. Where the final tax outcome of these matters is different from the carrying amounts, such differences will impact the current and deferred tax provisions in the period in which such determination is made. Recovery of deferred tax assets Deferred tax assets are recognised for deductible temporary differences only if the Group considers it is probable that future taxable amounts will be available to utilise those temporary differences and losses. Exploration and evaluation costs Exploration and evaluation costs have been capitalised on the basis that the Group will commence commercial production in the future, from which time the costs will be amortised in proportion to the depletion of the mineral resources. Key judgements are applied in considering costs to be capitalised which includes determining expenditures directly related to these activities and allocating overheads between those that are expensed and capitalised. In addition, costs are only capitalised if expected to be recovered either through successful development or sale of the relevant mining interest. Factors that could impact the future commercial production at the mine include the level of reserves and resources, future technology changes, which could impact the cost of mining, future legal changes and changes in commodity prices. To the extent that capitalised costs are determined not to be recoverable in the future, they will be written off in the period in which this determination is made. Ore reserve and resource estimates Ore reserves are estimates of the amount of product that can be economically and legally extracted from the Group's current mining tenements. The Group estimates its ore reserves based on information compiled by appropriately qualified persons able to interpret the geological data. The estimation of recoverable reserves is based on factors such as estimates of foreign exchange rates, commodity prices, future capital requirements, and production costs, along with geological assumptions and judgements made in estimating the size and grade of the ore body. Changes in the reserve or resource estimates may impact on the value of exploration and evaluation assets, mine properties, property plant and equipment, provision for rehabilitation and depreciation and amortisation charges. Units of production depreciation Estimated recoverable reserves are used in determining the depreciation and/or amortisation of mine specific assets. This results in a depreciation/amortisation charge proportional to the depletion of the anticipated remaining life of mine production. Each item's life, which is assessed annually, has regard to both its physical life limitations and to present assessments of economically recoverable reserves of the mine property at which the asset is located. These calculations require the use of estimates and assumptions, including the amount of recoverable reserves and estimates of future capital expenditure. The Group adopts a Run of Mine (ROM) tonnes of ore produced methodology. Site rehabilitation provisions In accordance with the Group's legal requirements, provision is made for the anticipated costs of future restoration and rehabilitation of areas from which natural resources have been extracted. The provision includes costs associated with dismantling of assets, reclamation, plant closure, waste site closure, monitoring, demolition and decontamination. The provision is based upon current costs and has been determined on a discounted basis with reference to current legal requirements and current technology. Each period the impact of unwinding of the discount is recognised in the statement of profit or loss and other comprehensive income as a financing cost. Any change in the restoration provision is recorded against the carrying value of the provision and the related asset, only to the extent that it is probable that future economic benefits associated with the restoration expenditure will flow to the entity, with the effect being recognised in the statement of profit or loss and other comprehensive income on a prospective basis over the remaining life of the relevant operation. The restoration provision is separated into current (estimated costs arising within 12 months) and non-current components based on the expected timing of these cash flows.

Mineral Resources Limited Notes to the financial statements 30 June 2019
Note 2. Critical accounting judgements, estimates and assumptions (continued)
68
Project closure At the completion of some projects the Group has a liability for redundancy and the cost of relocating crushing and other mobile plant. An assessment is undertaken on the probability that such expenses will be incurred in the normal business of contracting services and is provided for in the financial statements.
Note 3. Operating segments Business segment The Group has identified its operating segments based on internal management reports that are reviewed by the Board (the Chief Operating Decision Makers) in assessing performance and in determining the allocation of resources. The Group continues to report its business results as three operating segments being Mining Services & Processing, Mining, and Central. All are operating within the resources sector of the Australian economy. The measurement of segment results is in line with the basis of information presented to management for internal management reporting purposes and the performance of each segment is measured based on normalised Earnings Before Interest, Tax, Depreciation and Amortisation (EBITDA) contribution. The accounting policies applied for internal reporting purposes are consistent with those applied in the preparation of the financial statements. Operating segment information
Mining Services & Processing
Mining
Central Inter-
segment
Total Group – 30 June 2019 $'000 $'000 $'000 $'000 $'000 Revenue External sales 327,673 1,184,226 76 - 1,511,975 Intersegment sales 522,531 - - (522,531) -
Total revenue 850,204 1,184,226 76
(522,531) 1,511,975 Other income 7,365 192 546 - 8,103 Expenses (648,633) (937,982) (55,615) 508,011 (1,134,219)
Earnings before interest, tax, depreciation and amortisation
208,936 246,436 (54,993) (14,520) 385,859
Depreciation and amortisation (79,341) (25,996) (3,297) - (108,634) Impairment charges (9,809) - - - (9,809) Interest income 38 238 3,586 (1,393) 2,469 Finance costs (6,044) (4,099) (25,127) 1,393 (33,877)
Profit before tax 113,780 216,579 (79,831) (14,520) 236,008
Income tax (71,020)
Profit after tax for the year 164,988
Assets Segment assets 928,748 930,503 1,326,971 (24,965) 3,161,257
Liabilities Segment liabilities 384,539 340,444 1,056,068 - 1,781,051
Segment net assets 544,209 590,059 270,903 (24,965) 1,380,206
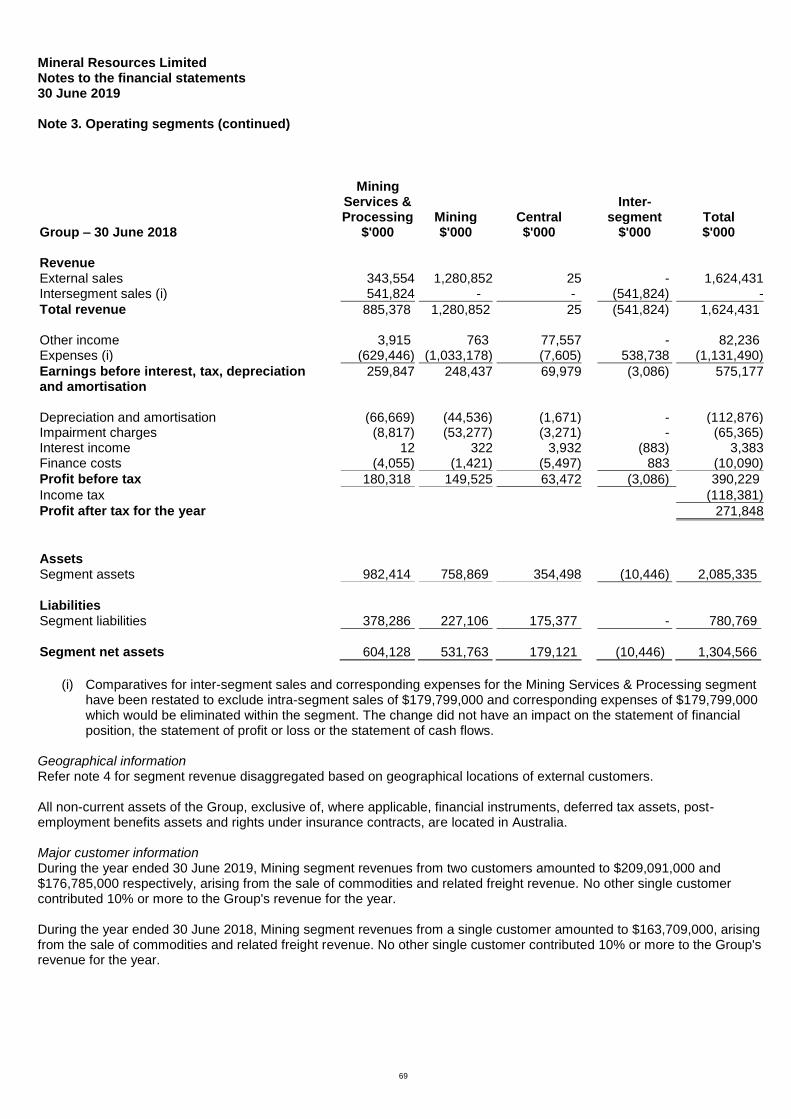
Mineral Resources Limited Notes to the financial statements 30 June 2019
Note 3. Operating segments (continued)
69
Mining Services & Processing
Mining
Central Inter-
segment
Total Group – 30 June 2018 $'000 $'000 $'000 $'000 $'000 Revenue External sales 343,554 1,280,852 25 - 1,624,431 Intersegment sales (i) 541,824 - - (541,824) -
Total revenue 885,378 1,280,852 25
(541,824) 1,624,431 Other income 3,915 763 77,557 - 82,236 Expenses (i) (629,446) (1,033,178) (7,605) 538,738 (1,131,490)
Earnings before interest, tax, depreciation and amortisation
259,847 248,437 69,979 (3,086) 575,177
Depreciation and amortisation (66,669) (44,536) (1,671) - (112,876) Impairment charges (8,817) (53,277) (3,271) - (65,365) Interest income 12 322 3,932 (883) 3,383 Finance costs (4,055) (1,421) (5,497) 883 (10,090)
Profit before tax 180,318 149,525 63,472 (3,086) 390,229
Income tax (118,381)
Profit after tax for the year 271,848
Assets Segment assets 982,414 758,869 354,498 (10,446) 2,085,335
Liabilities Segment liabilities 378,286 227,106 175,377 - 780,769
Segment net assets 604,128 531,763 179,121 (10,446) 1,304,566
(i) Comparatives for inter-segment sales and corresponding expenses for the Mining Services & Processing segment
have been restated to exclude intra-segment sales of $179,799,000 and corresponding expenses of $179,799,000 which would be eliminated within the segment. The change did not have an impact on the statement of financial position, the statement of profit or loss or the statement of cash flows.
Geographical information Refer note 4 for segment revenue disaggregated based on geographical locations of external customers. All non-current assets of the Group, exclusive of, where applicable, financial instruments, deferred tax assets, post-employment benefits assets and rights under insurance contracts, are located in Australia. Major customer information During the year ended 30 June 2019, Mining segment revenues from two customers amounted to $209,091,000 and $176,785,000 respectively, arising from the sale of commodities and related freight revenue. No other single customer contributed 10% or more to the Group's revenue for the year. During the year ended 30 June 2018, Mining segment revenues from a single customer amounted to $163,709,000, arising from the sale of commodities and related freight revenue. No other single customer contributed 10% or more to the Group's revenue for the year.

Mineral Resources Limited Notes to the financial statements 30 June 2019
70
Note 4. Revenue The effect of initially applying AASB 15 on the Group’s revenue from contracts with customers is described in Note 1(w). Due to the modified retrospective transition method chosen in applying AASB 15, comparative information has not been restated to reflect the new requirements. (a) Disaggregation of revenue The disaggregation of revenue from contracts with customers is as follows:
Mining Services & Processing
Mining
Central
Total Group - 2019 $'000 $'000 $'000 $'000 Type of goods or service Sale of iron ore - 954,354 - 954,354 Sale of lithium - 229,872 - 229,872 Contract and operational revenue 325,977 - - 325,977 Other 1,696 - 76 1,772
Total external revenue from contracts with customers 327,673 1,184,226 76 1,511,975
Geographical information (by location of customer) Australia 327,625 - 76 327,701 China - 662,356 - 662,356 Singapore - 521,870 - 521,870 Other 48 - - 48
Total external revenue from contracts with customers 327,673 1,184,226 76 1,511,975
Mining Services & Processing
Mining
Central
Total Group - 2018 $'000 $'000 $'000 $'000 Type of goods or service Sale of iron ore - 624,334 - 624,334 Sale of lithium - 656,518 - 656,518 Contract and operational revenue 343,262 - - 343,262 Other 292 - 25 317
Total external revenue from contracts with customers 343,554 1,280,852 25 1,624,431
Geographical information (by location of customer) Australia 343,124 620 25 343,769 China - 1,178,279 - 1,178,279 Singapore - 82,913 - 82,913 Other 430 19,040 - 19,470
Total external revenue from contracts with customers 343,554 1,280,852 25 1,624,431

Mineral Resources Limited Notes to the financial statements 30 June 2019
Note 4. Revenue (continued)
71
(b) Contract balances Contract assets A contract asset is the right to consideration in exchange for goods or services transferred to the customer. If the Group performs by transferring goods or services to a customer before the customer pays consideration or before payment is due, a contract asset is recognised for the earned consideration that is conditional. The Group does not have any contract assets as at 30 June 2019 as performance and a right to consideration occurs within a short period of time and all rights to consideration are unconditional. Trade receivables A receivable represents the Group’s right to an amount of consideration that is unconditional (i.e., only the passage of time is required before payment of the consideration is due). Refer to Note 1f(ii) for the accounting policies for financial assets and Note 10 for trade receivables. Contract liabilities A contract liability is the obligation to transfer goods or services to a customer for which the Group has received consideration (or an amount of consideration is due) from the customer. If a customer pays consideration before the Group transfers goods or services to the customer, a contract liability is recognised when the payment is made or the payment is due (whichever is earlier). Contract liabilities are recognised as revenue when the Group performs under the contract. From time to time, the Group recognises contract liabilities in relation to: ● commodity sales which are sold under CFR and CIF Incoterms, whereby a portion of the cash may be received from the customer before the freight/insurance services are provided ● mining services revenue, including crushing services, whereby mobilisation charges may be received from the customer but is to be allocated and recognised based on the actual tonnes crushed each period (each performance obligation) See Note 20 for further details of contract liabilities disclosed within Trade and Other Payables.
Note 5. Other income Group 2019 2018 $'000 $'000 Net fair value gain on investments held at fair value through profit or loss 33 60,064 Gain on bargain purchase - 9,173 Net gain on disposal of property, plant and equipment 949 4,125 Interest income 2,469 3,383 Other 7,121 8,874
Other income 10,572 85,619
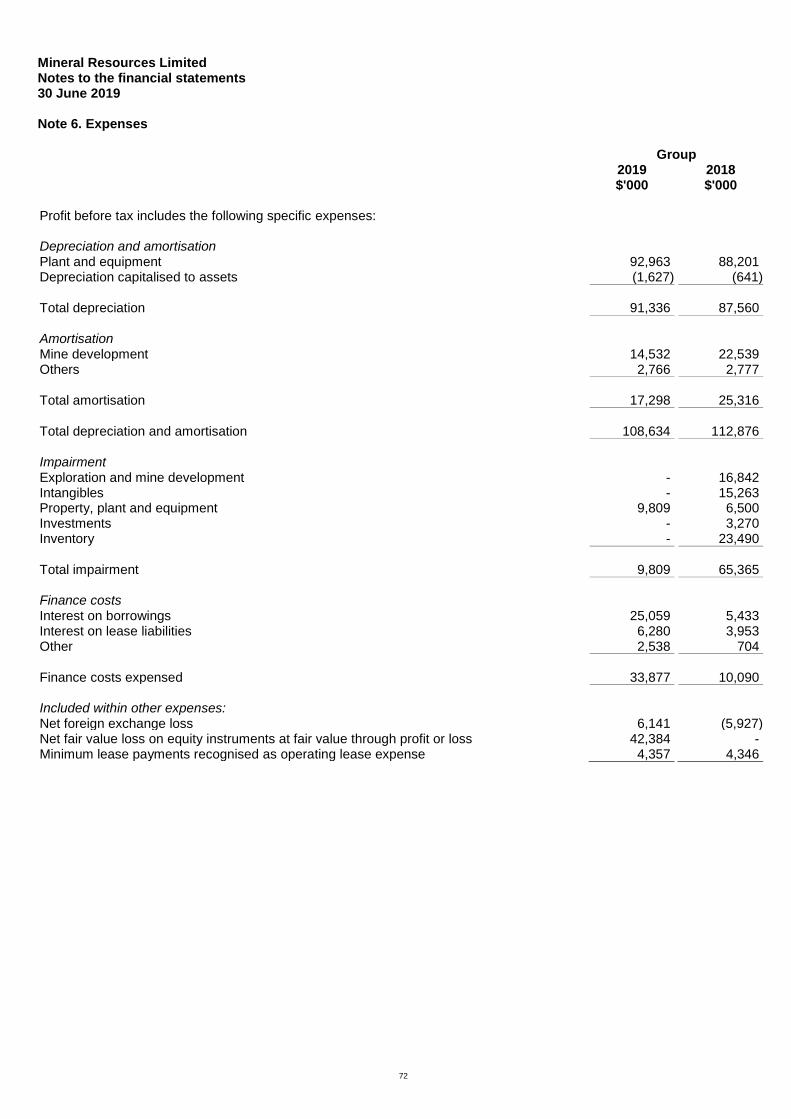
Mineral Resources Limited Notes to the financial statements 30 June 2019
72
Note 6. Expenses Group 2019 2018 $'000 $'000 Profit before tax includes the following specific expenses: Depreciation and amortisation Plant and equipment 92,963 88,201 Depreciation capitalised to assets (1,627) (641) Total depreciation 91,336 87,560
Amortisation Mine development 14,532 22,539 Others 2,766 2,777
Total amortisation 17,298 25,316
Total depreciation and amortisation 108,634 112,876
Impairment Exploration and mine development - 16,842 Intangibles - 15,263 Property, plant and equipment 9,809 6,500 Investments - 3,270 Inventory - 23,490
Total impairment 9,809 65,365
Finance costs Interest on borrowings 25,059 5,433 Interest on lease liabilities 6,280 3,953 Other 2,538 704
Finance costs expensed 33,877 10,090
Included within other expenses: Net foreign exchange loss 6,141 (5,927) Net fair value loss on equity instruments at fair value through profit or loss 42,384 - Minimum lease payments recognised as operating lease expense 4,357 4,346

Mineral Resources Limited Notes to the financial statements 30 June 2019
73
Note 7. Income tax expense (a) Income tax expense Group 2019 2018 $'000 $'000 Income tax expense Current tax 48,716 78,828 Deferred tax - origination and reversal of temporary differences 20,544 33,611 Adjustment recognised for prior periods 1,760 5,942 Aggregate income tax expense 71,020 118,381
Deferred tax included in income tax expense comprises: (Increase)/decrease in deferred tax assets (note 7(b)) (13,659) 15,772 Increase in deferred tax liabilities (note 7(c)) 34,203 17,839 Deferred tax - origination and reversal of temporary differences 20,544 33,611
Numerical reconciliation of income tax expense and tax at the statutory rate Profit before tax 236,008 390,229
Tax at the statutory tax rate of 30% 70,802 117,069 Tax effect amounts which are not deductible/(taxable) in calculating taxable income:
Non allowable expenses 288 2,736 Non assessable income - (2,752) Research and development concessions (850) (5,100)
70,240 111,953 Adjustment recognised for prior periods 1,760 5,942 Current year tax losses not recognised 421 486 Prior year tax losses not recognised now recouped (1,401) -
Income tax expense 71,020 118,381
Group 2019 2018 $'000 $'000 Amounts credited directly to equity Deferred tax assets (note 7(b)) - (290)
Tax losses not recognised Unused tax losses for which no deferred tax asset has been recognised 26,702 29,967
Potential tax benefit @ 30% 8,011 8,990
The above potential tax benefit for tax losses has not been recognised in the statement of financial position. These tax losses can only be utilised in the future if the continuity of ownership test is passed, or failing that, the same business test is passed.

Mineral Resources Limited Notes to the financial statements 30 June 2019
Note 7. Income tax expense (continued)
74
(b) Deferred tax asset Group 2019 2018 $'000 $'000 Deferred tax asset comprises temporary differences attributable to: Amounts recognised in profit or loss:
Allowance for expected credit losses 1,258 1,258 Contract liabilities 3,228 - Employee benefits 10,510 12,567 Provisions 30,014 21,599 Unrealised foreign exchange loss 1,774 428 Other (1,328) 2,232
Deferred tax asset 45,456 38,084
Movements: Opening balance 38,084 51,680 Credited/(charged) to profit or loss (note 7(a)) 13,659 (15,772) Credited to equity (note 7(a)) - 290 (Over)/under provision from prior year (1,252) 1,886 Transfer to assets held for sale (5,035) -
Closing balance 45,456 38,084
(c) Deferred tax liability Group 2019 2018 $'000 $'000 Deferred tax liability comprises temporary differences attributable to: Amounts recognised in profit or loss:
Trade and other receivables 30,782 3,791 Property, plant and equipment 101,753 97,828 Exploration and evaluation 35,690 36,401 Research and development 20,010 17,010 Financial assets (2,681) 10,257 Other 18 449
Deferred tax liability 185,572 165,736
Movements: Opening balance 165,736 142,807 Charged to profit or loss (note 7(a)) 34,203 17,839 Under-provision from prior year 6,737 5,090 Transfer to liabilities associated with assets held for sale (21,104) -
Closing balance 185,572 165,736

Mineral Resources Limited Notes to the financial statements 30 June 2019
75
Note 8. Earnings per share Group 2019 2018 $'000 $'000 Profit after tax attributable to the owners of Mineral Resources Limited 163,669 272,498
Number Number Weighted average number of ordinary shares used in calculating basic earnings per share 187,929,729 187,535,933 Weighted average number of ordinary shares used in calculating diluted earnings per share 187,929,729 187,535,933
Cents Cents Basic earnings per share 87.09 145.30 Diluted earnings per share 87.09 145.30
Note 9. Current assets - cash and cash equivalents (a) Cash and cash equivalents Group 2019 2018 $'000 $'000 Cash at bank and on hand 265,399 240,406
(b) Cash flow information – Reconciliation of profit after tax for the year to net cash from operating activities Group 2019 2018 $'000 $'000 Profit after tax for the year 164,988 271,848 Adjustments for: Depreciation and amortisation 108,634 112,876 Share-based payments 3,324 799 Foreign exchange differences 5,424 1,428 Impairment loss 9,809 65,365 Net gain on disposal of property, plant and equipment (949) (4,125) Fair value loss/(gain) on investments held at fair value through profit or loss 42,351 (60,064) Gain on bargain purchase - (9,173) Other non-cash transactions 876 827 Change in operating assets and liabilities:
Increase in trade and other receivables (97,382) (15,715) Increase in inventories (73,902) (39,236) (Increase)/decrease in deferred tax assets (11,747) 13,886 Increase in other operating assets (17,975) (5,503) Increase in trade and other payables 38,227 108,384 Decrease in provision for income tax (23,331) (39,770) Increase in deferred tax liabilities 39,898 22,928 Decrease in other provisions (2,146) (13,327)
Net cash from operating activities 186,099 411,428

Mineral Resources Limited Notes to the financial statements 30 June 2019
76
Note 10. Current assets - trade and other receivables Group 2019 2018 $'000 $'000 Trade receivables 171,659 99,277 Less: Allowance for expected credit losses (4,193) (4,193)
167,466 95,084
Receivables from joint operation - 6,754
- 6,754
167,466 101,838
Credit and market risks, and impairment losses
Movement in the allowance for expected credit losses are as follows: Group 2019 2018 $'000 $'000 Opening balance 4,193 9,332 Additional provisions recognised/(released) - (5,139)
Closing balance 4,193 4,193
Information about the Group’s exposure to credit and market risks, and impairment losses for trade receivables and contract assets is included in Note 26(d).
Note 11. Current assets - inventories Group 2019 2018 $'000 $'000 Raw materials and stores 28,962 14,369 Ore inventory stockpiles 136,373 102,380 Work in progress 14,791 15,440
180,126 132,189
Note 12. Current assets - other Group 2019 2018 $'000 $'000 Prepayments 29,390 11,435 Foreign exchange forward contracts 6,011 - Other current assets - 3,096
35,401 14,531

Mineral Resources Limited Notes to the financial statements 30 June 2019
77
Note 13. Current assets - assets held for sale See accounting policy in Note 1(h). As at 30 June 2019, management has committed to sell a 60% interest in certain tenements, assets and related infrastructure, together comprising the Wodgina Lithium Project within the Mining segment under a binding Asset Sale and Share Subscription Agreement (Sale Agreement) with Albemarle Corporation (NYSE: ALB, Albemarle). An Amendment Deed to the Sale Agreement was executed on 1 August 2019 which revised the sale interest from 50% to 60%. Refer further details on the subsequent event in note 38. The sale is expected to complete by the end of the 2019 calendar year. As a result, the 60% interest in the assets and associated liabilities to be sold is presented as a disposal group held for sale as at 30 June 2019. Group 2019 2018 $'000 $'000 Inventories 25,750 - Property, plant and equipment 356,331 - Exploration and evaluation 116,854 - Deferred tax asset 5,035 -
Assets held for sale 503,970 -
Group 2019 2018 $'000 $'000 Lease liability 25,555 - Provisions - site rehabilitation 16,433 - Deferred tax liability 21,104 -
Liabilities associated with the assets held for sale 63,092 -
There are no cumulative income or expenses included in other comprehensive income relating to the disposal group.
Note 14. Non-current assets - receivables Group 2019 2018 $'000 $'000 Loan receivable 24,437 - Other receivables 14,489 - Security deposits 1,050 250
39,976 250
The receivables are not past due nor impaired. The carrying amount is equivalent to fair value.

Mineral Resources Limited Notes to the financial statements 30 June 2019
78
Note 15. Non-current assets - financial assets Group 2019 2018 $'000 $'000 Shares in listed corporations - at fair value through profit or loss 75,149 114,113 Investment in unlisted company - at fair value through profit or loss - 4,000
75,149 118,113
Reconciliation Reconciliation of the fair values at the beginning and end of the current and previous financial year are set out below:
Opening fair value 118,113 54,890 Additions 3,387 16,193 Revaluation (42,351) 60,064 Impairment of assets - (3,271) Disposals (4,000) (9,763)
Closing fair value 75,149 118,113
Refer to note 27 for further information on fair value measurement.
Note 16. Non-current assets - property, plant and equipment Group 2019 2018 $'000 $'000 Land - cost 14,399 14,399
Buildings - cost 12,467 12,467 Less: Accumulated depreciation (2,066) (1,756)
10,401 10,711
Plant and equipment financed - cost 221,281 243,893 Less: Accumulated depreciation and impairment (62,231) (57,313)
159,050 186,580
Plant and equipment - cost 1,603,132 1,178,894 Less: Accumulated depreciation and impairment (486,404) (418,053)
1,116,728 760,841
1,300,578 972,531

Mineral Resources Limited Notes to the financial statements 30 June 2019
Note 16. Non-current assets - property, plant and equipment (continued)
79
Reconciliations Reconciliations of the written down values at the beginning and end of the current and previous financial year are set out below:
Plant and
equipment
Plant and
Land Building financed equipment Total Group $'000 $'000 $'000 $'000 $'000 Balance at 1 July 2017 14,399 17,167 140,671 551,495 723,732 Additions - - 71,611 267,844 339,455 Additions through business combinations (note 31)
-
975
-
12,500
13,475
Disposals - - (181) (3,372) (3,553) Impairment of assets - - - (6,500) (6,500) Transfers - (6,985) 716 (249) (6,519) Depreciation expense - (446) (26,237) (60,877) (87,560)
Balance at 30 June 2018 14,399 10,711 186,580 760,841 972,531 Additions - - 98,157 700,358 798,515 Additions through business combinations (note 31)
-
-
-
1,682
1,682
Classified as held for sale - - (29,219) (327,112) (356,331) Disposals - - (316) (14,347) (14,663) Impairment of assets - - - (9,809) (9,809) Transfers - - (58,955) 58,955 - Depreciation expense - (310) (37,197) (53,840) (91,347)
Balance at 30 June 2019 14,399 10,401 159,050 1,116,728 1,300,578
Property, plant and equipment secured under finance leases Refer to note 29 for further information on property, plant and equipment secured under finance leases. Assets in the course of construction Included in property, plant and equipment at 30 June 2019 was an amount of $468,871,000 (2018: $203,503,000) relating to expenditure for plants in the course of construction. Capitalised borrowing costs The Group continued to progress the construction of the Wodgina spodumene concentrate plant and related infrastructure during the year ended 30 June 2019. The project was financed for a substantial part of the financial year under a syndicated loan facility. The amount of borrowing costs capitalised during the year ended 30 June 2019 was $21,860,000 (2018: Nil) of which $13,116,000 being 60% of the balance is classified as held for sale as at 30 June 2019. The rate used to determine the amount of borrowing costs eligible for capitalisation was 4.33%, which is the effective interest rate (EIR) of the specific borrowing. Impairment testing Refer to note 19 for details of impairment testing.

Mineral Resources Limited Notes to the financial statements 30 June 2019
80
Note 17. Non-current assets - intangibles Group 2019 2018 $'000 $'000 Goodwill - cost 1,418 1,418
Development - at cost 56,699 40,105
Patents - cost 1,750 1,750
Access rights - cost 56,717 56,717 Less: Accumulated amortisation and impairment (33,112) (31,864)
23,605 24,853
Others - cost 5,037 2,882 Less: Accumulated amortisation (3,698) (1,706)
1,339 1,176
84,811 69,302
Reconciliations Reconciliations of the written down values at the beginning and end of the current and previous financial year are set out below:
Goodwill
Capitalised development
costs
Patents
Access rights
Others
Total Group $'000 $'000 $'000 $'000 $'000 $'000 Balance at 1 July 2017 16,681 29,209 1,750 26,774 1,225 75,639 Additions - 10,896 - - 808 11,704 Impairment of assets (15,263) - - - - (15,263) Amortisation expense - - - (1,921) (857) (2,778)
Balance at 30 June 2018 1,418 40,105 1,750 24,853 1,176 69,302 Additions - 16,594 - - 2,156 18,750 Amortisation expense - - - (1,248) (1,993) (3,241)
Balance at 30 June 2019 1,418 56,699 1,750 23,605 1,339 84,811
Allocation of goodwill to cash-generating units The following cash generating units have carrying amounts of goodwill: Group 2019 2018 $'000 $'000 Process Minerals International Pty Ltd 1,418 1,418
Impairment testing Refer to note 19 for details of impairment testing.

Mineral Resources Limited Notes to the financial statements 30 June 2019
81
Note 18. Non-current assets - exploration and mine development Group 2019 2018 $'000 $'000 Exploration and evaluation 163,423 128,905
Mine development 348,114 328,209 Less: Accumulated amortisation (103,025) (92,630)
245,089 235,579
408,512 364,484
Reconciliations Reconciliations of the written down values at the beginning and end of the current and previous financial year are set out below:
Exploration
and
Mine
evaluation development Total Group $'000 $'000 $'000 Balance at 1 July 2017 131,510 187,677 319,187 Additions 2,876 66,920 69,796 Additions through business combinations (note 31) 10,274 6,000 16,274 Impairment of assets (12,476) (4,366) (16,842) Reassessment of rehabilitation - (3,361) (3,361) Transfers (3,279) 5,248 1,969 Amortisation expense - (22,539) (22,539)
Balance at 30 June 2018 128,905 235,579 364,484 Additions 41,177 67,992 109,169 Additions through business combinations (note 31) 85 46,883 46,968 Classified as held for sale (6,744) (110,111) (116,855) Reassessment of rehabilitation - 19,278 19,278 Amortisation expense - (14,532) (14,532)
Balance at 30 June 2019 163,423 245,089 408,512
Note 19. Impairment of non-financial assets Impairment testing The Group tests non-financial assets for impairment:
At least annually for indefinite life intangibles and goodwill; and
Where there is an indication that the asset may be impaired If the asset does not generate independent cash inflows and its value in use cannot be estimated to be close to its fair value, the asset is tested for impairment as part of the cash generating unit (CGU) to which it belongs. The recoverable amount of each CGU is determined based on the higher of an asset’s fair value less costs of disposal (FVLCD) and value-in-use (VIU).

Mineral Resources Limited Notes to the financial statements 30 June 2019
Note 19. Impairment of non-financial assets (continued)
82
Key assumptions used in the cash flow projections and sensitivity to changes in assumptions Key assumptions contained in the cash flow projections for FVLCD and VIU models are market based commodity prices and foreign exchange assumptions, future production levels, operating costs and future capital expenditure. The cash flows are discounted using a real pre-tax discount rate of 8.3%, representing the target weighted average cost of capital for the Group, with appropriate adjustments made to reflect the risks specific to the cash generating unit. The terminal value calculation used in VIU models incorporates a nominal growth rate of 2.0% in line with externally sourced forward consensus rates. The estimation of the future production driving the cash flow projections is based on a detailed data analysis that reflects current life of mine and long-term production plans. As each area of interest has specific economic characteristics, the cash flows applied have been calculated using appropriate models and key assumptions established by management. Commodity prices are externally sourced, forward consensus prices, adjusted for ore properties. Exchange rates are externally sourced forward consensus rates. Management believe that any reasonably possible change in the key assumptions on which the recoverable amount is based would not cause the carrying amount to exceed its recoverable amount. Recognised impairment During the current financial year, an impairment expense of $9,809,000 represented the write-down of certain plant and equipment in the mining services segment which were assessed for impairment at the individual asset level. The write-down to the recoverable amount was recognised in the statement of profit or loss as impairment charges. No other material impairment was recognised during the year. Previously recognised impairment In the previous financial year, impairment expenses were recognised in the following CGUs:
PIHA Pty Ltd (PIHA): A $8,817,000 impairment was recognised in respect of PIHA’s goodwill which reflected management’s decision in 2018 to discontinue the PIHA brand and operations despite efforts to restructure the PIHA business and reduce its cost base following the decline in the construction and installation of new pipeline projects.
Road haulage – mine operations: A $6,446,000 impairment was recognised in respect of goodwill associated with the road haulage – mine operations CGU that arose on the acquisition of Mineral Resources Transport Pty Ltd (MRT Pty Ltd) in July 2016. The reduction in the recoverable value of the CGU reflected the change in the probability of utilising MRT Pty Ltd’s road haulage operation following the announcement of the State Government’s decision not to grant approval to allow the Company to mine at J5 and Bungalbin East. The CGU’s recoverable value as at 30 June 2018 continues to approximate its carrying value.
Yilgarn: An impairment in respect of low grade inventory ($23,490,000), property, plant and equipment ($6,500,000) and exploration and mine development assets ($16,842,000) was recognised. The reduction in the recoverable value of the CGU reflected the probability of changes in the production outlook while the Group considers its options for the Yilgarn region following the State Government’s decision not to grant approval to allow the Company to mine at J5 and Bungalbin East.
Note 20. Current liabilities - trade and other payables Group 2019 2018 $'000 $'000 Trade payables and accruals 248,682 261,571 Contract liabilities 10,759 -
259,441 261,571
Refer to note 26 for further information on financial instruments.

Mineral Resources Limited Notes to the financial statements 30 June 2019
83
Note 21. Borrowings Borrowings are initially recognised at fair value net of transaction costs incurred and subsequently at amortised cost. Group 2019 2018 $'000 $'000 Secured Lease liability 54,125 57,102 Unsecured Payable to joint operation partners - 6,750 Other borrowings 1,144 -
Total current 55,269 63,852
Secured Syndicated loan facility - 100,000 Senior unsecured notes 998,146 - Less: capitalised transaction costs (15,487) - Lease liability 99,056 75,437
Total non-current 1,081,715 175,437
Lease liabilities The lease liabilities are effectively secured as the rights to the leased assets, recognised in the statement of financial position and revert to the lessor in the event of default. The weighted average interest rate for the lease liabilities is 4.08% (2018: 3.82%). Senior unsecured notes During the year ended 30 June 2019, the Group completed its inaugural US$700 million senior unsecured notes offering due 2027, at an interest rate of 8.125% per annum. Syndicated loan facility The Syndicated Loan Facility as at 30 June 2018 related to drawdowns maturing in December 2020. The facility was repaid in April 2019 and a new $250 million Syndicated Loan Facility was executed in June 2019, maturing in June 2022. Interest rate for the Syndicated Loan Facility is charged at BBSY plus a margin if drawn. The Syndicated Loan Facility is secured by:
(a) General Security Agreements over the whole of the assets and undertakings of the Group’s wholly owned subsidiaries (information on subsidiaries in note 32);
(b) Negative pledges with respect to financial covenants; and (c) Interlocking guarantees.
No drawdowns have been made on the new facility as at 30 June 2019. Refer to note 26 for further information on financial instruments.
Note 22. Employee benefits Group 2019 2018 $'000 $'000 Employee benefits 35,565 42,176
Provision for employee benefits includes the Group’s liability for long service leave, annual leave and employee incentives. The current provision includes amounts for vested long service leave for which the Group does not have an unconditional right to defer settlement, regardless of when the actual settlement is expected to occur. However, based on past experience, the Group does not expect all employees to take the full amount of accrued leave or require payment within the next 12 months.
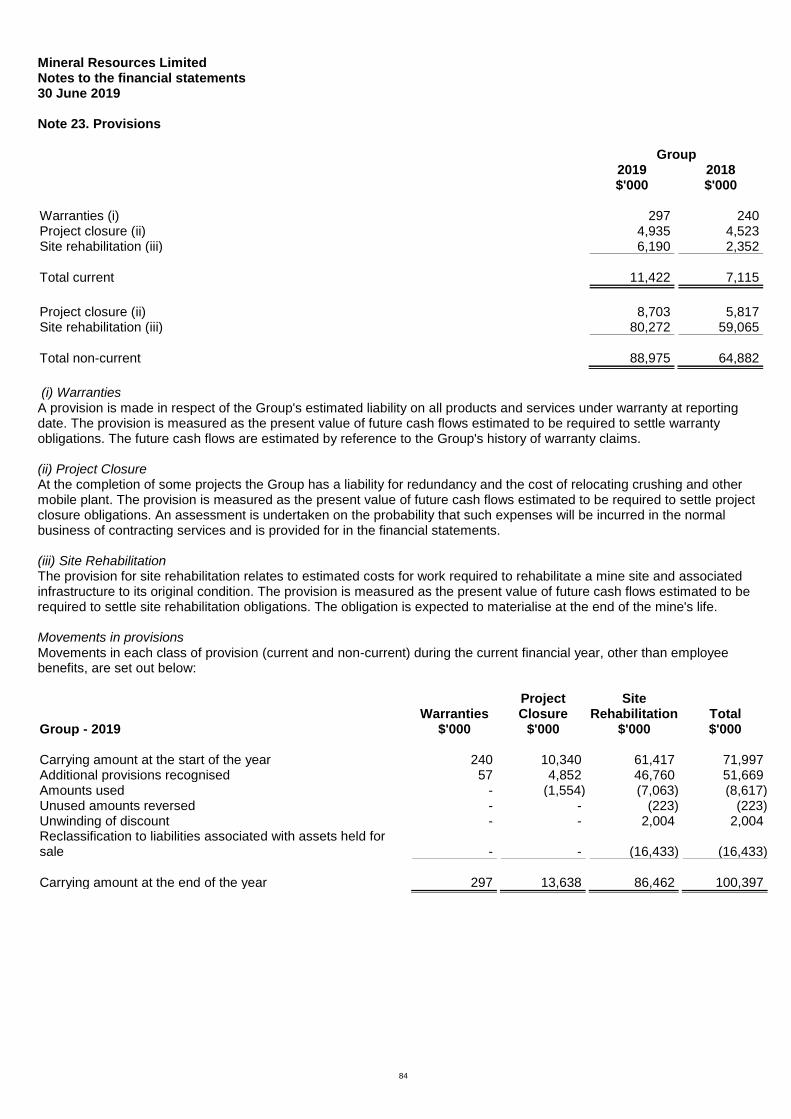
Mineral Resources Limited Notes to the financial statements 30 June 2019
84
Note 23. Provisions Group 2019 2018 $'000 $'000 Warranties (i) 297 240 Project closure (ii) 4,935 4,523 Site rehabilitation (iii) 6,190 2,352
Total current 11,422 7,115
Project closure (ii) 8,703 5,817 Site rehabilitation (iii) 80,272 59,065
Total non-current 88,975 64,882
(i) Warranties A provision is made in respect of the Group's estimated liability on all products and services under warranty at reporting date. The provision is measured as the present value of future cash flows estimated to be required to settle warranty obligations. The future cash flows are estimated by reference to the Group's history of warranty claims. (ii) Project Closure At the completion of some projects the Group has a liability for redundancy and the cost of relocating crushing and other mobile plant. The provision is measured as the present value of future cash flows estimated to be required to settle project closure obligations. An assessment is undertaken on the probability that such expenses will be incurred in the normal business of contracting services and is provided for in the financial statements. (iii) Site Rehabilitation The provision for site rehabilitation relates to estimated costs for work required to rehabilitate a mine site and associated infrastructure to its original condition. The provision is measured as the present value of future cash flows estimated to be required to settle site rehabilitation obligations. The obligation is expected to materialise at the end of the mine's life. Movements in provisions Movements in each class of provision (current and non-current) during the current financial year, other than employee benefits, are set out below: Project Site Warranties Closure Rehabilitation Total Group - 2019 $'000 $'000 $'000 $'000 Carrying amount at the start of the year 240 10,340 61,417 71,997 Additional provisions recognised 57 4,852 46,760 51,669 Amounts used - (1,554) (7,063) (8,617) Unused amounts reversed - - (223) (223) Unwinding of discount - - 2,004 2,004 Reclassification to liabilities associated with assets held for sale
-
-
(16,433)
(16,433)
Carrying amount at the end of the year 297 13,638 86,462 100,397
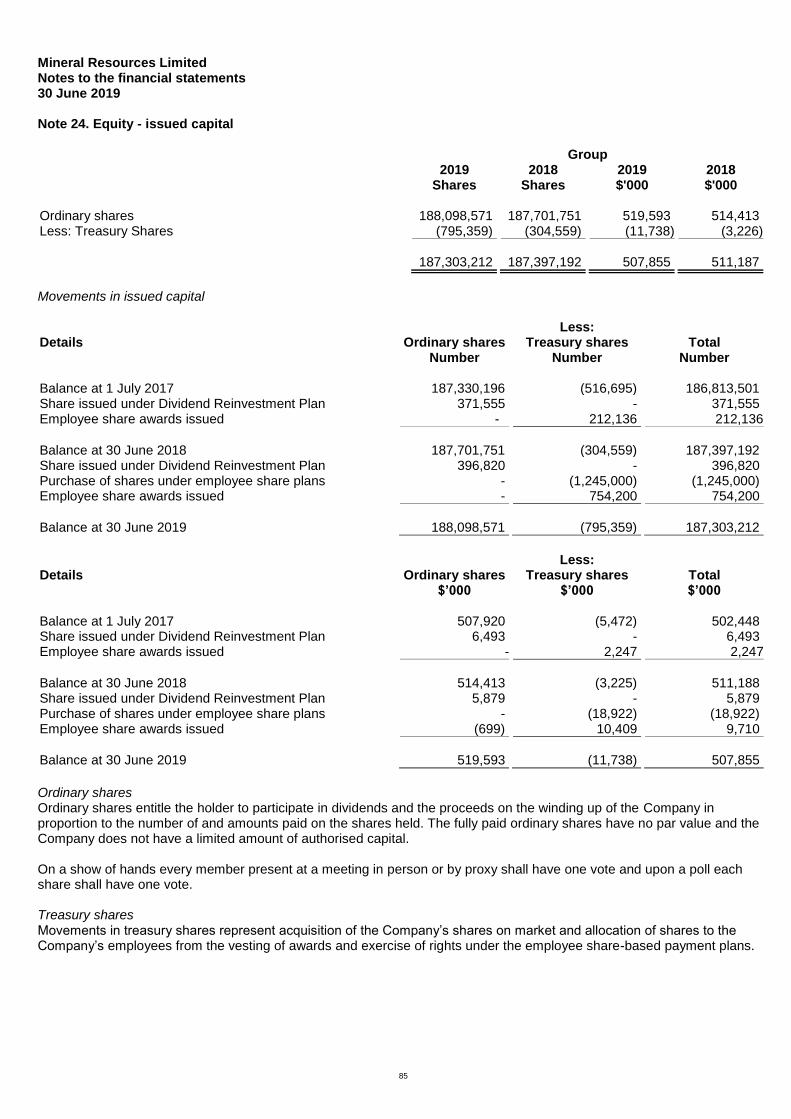
Mineral Resources Limited Notes to the financial statements 30 June 2019
85
Note 24. Equity - issued capital Group 2019 2018 2019 2018 Shares Shares $'000 $'000 Ordinary shares 188,098,571 187,701,751 519,593 514,413 Less: Treasury Shares (795,359) (304,559) (11,738) (3,226)
187,303,212 187,397,192 507,855 511,187
Movements in issued capital
Details
Ordinary shares Less:
Treasury shares
Total Number Number Number Balance at 1 July 2017 187,330,196 (516,695) 186,813,501 Share issued under Dividend Reinvestment Plan 371,555 - 371,555 Employee share awards issued - 212,136 212,136
Balance at 30 June 2018 187,701,751 (304,559) 187,397,192 Share issued under Dividend Reinvestment Plan 396,820 - 396,820 Purchase of shares under employee share plans - (1,245,000) (1,245,000) Employee share awards issued - 754,200 754,200
Balance at 30 June 2019 188,098,571 (795,359) 187,303,212
Details
Ordinary shares Less:
Treasury shares
Total $’000 $’000 $’000 Balance at 1 July 2017 507,920 (5,472) 502,448 Share issued under Dividend Reinvestment Plan 6,493 - 6,493 Employee share awards issued - 2,247 2,247
Balance at 30 June 2018 514,413 (3,225) 511,188 Share issued under Dividend Reinvestment Plan 5,879 - 5,879 Purchase of shares under employee share plans - (18,922) (18,922) Employee share awards issued (699) 10,409 9,710
Balance at 30 June 2019 519,593 (11,738) 507,855
Ordinary shares Ordinary shares entitle the holder to participate in dividends and the proceeds on the winding up of the Company in proportion to the number of and amounts paid on the shares held. The fully paid ordinary shares have no par value and the Company does not have a limited amount of authorised capital. On a show of hands every member present at a meeting in person or by proxy shall have one vote and upon a poll each share shall have one vote. Treasury shares Movements in treasury shares represent acquisition of the Company’s shares on market and allocation of shares to the Company’s employees from the vesting of awards and exercise of rights under the employee share-based payment plans.

Mineral Resources Limited Notes to the financial statements 30 June 2019
86
Note 25. Equity - dividends Dividends 2019 2018
Dividend per
share Total Dividend per
share Total
Cents $’000 Cents $’000 Declared and paid during the year Final franked dividend for the year ended 30 June 2018 (2018: 30 June 2017)
40.00 75,015 33.00 61,706
Interim franked dividend for the year ended 30 June 2019 (2018: 30 June 2018)
13.00 24,386 25.00 46,796
53.00 99,401 58.00 108,502 Proposed Final franked dividend for the year ended 30 June 2019 (2018: 30 June 2018)
31.00 58,064 40.00 74,959
Franking credits Group 2019 2018 $'000 $'000 Franking credits available for subsequent financial years based on a tax rate of 30% 235,008 211,286
The above amounts represent the balance of the franking account as at the end of the financial year, adjusted for: ● franking credits that will arise from the payment of the amount of the provision for income tax at the reporting date ● franking debits that will arise from the payment of dividends recognised as a liability at the reporting date ● franking credits that will arise from the receipt of dividends recognised as receivables at the reporting date
Note 26. Financial instruments (a) Capital risk management The Group's objectives when managing capital are to safeguard its ability to continue as a going concern, so that it can provide returns for shareholders and benefits for other stakeholders and to maintain an optimum capital structure to reduce the cost of capital. In order to maintain or adjust the capital structure, the Group may adjust the amount of dividends paid to shareholders, return capital to shareholders, issue new shares or sell assets to reduce debt. The Group may look to raise capital when an opportunity to invest in a business or company is seen as value adding relative to the current Company's share price at the time of the investment. The Group is actively pursuing additional investments in the short term as it continues to integrate and grow its existing businesses in order to maximise synergies. The Group is subject to certain financing arrangement covenants and meeting these is given priority in all capital risk management decisions. There have been no events of default on financing arrangement covenants during the financial year. The capital risk management policy remains unchanged from the prior year.

Mineral Resources Limited Notes to the financial statements 30 June 2019
Note 26. Financial instruments (continued)
87
The gearing ratio at the reporting date was as follows: Group 2019 2018 $'000 $'000 Current liabilities - borrowings (note 21) 55,269 63,852 Current liabilities – borrowings (held for sale) (note 13) 25,555 - Non-current liabilities - borrowings (note 21) 1,081,715 175,437 Total borrowings 1,162,539 239,289 Current assets - cash and cash equivalents (note 9) (265,399) (240,406)
Net debt/(Cash and cash equivalents, net of debt) 897,140 (1,117) Total equity 1,380,206 1,304,566
Total capital 2,277,346 1,303,449
Gearing ratio 39% - (b) Financial risk management objectives The Group's activities expose it to a variety of financial risks: market risk (including foreign currency risk, price risk and interest rate risk), credit risk and liquidity risk. The Group's overall risk management program focuses on the unpredictability of financial markets and seeks to minimise potential adverse effects on the financial performance of the Group. The Group uses derivative financial instruments such as forward foreign exchange contracts to hedge certain risk exposures. Derivatives are exclusively used for hedging purposes, i.e. not as trading or other speculative instruments. The Group uses different methods to measure different types of risk to which it is exposed. These methods include sensitivity analysis in the case of interest rate, foreign exchange and other price risks, ageing analysis for credit risk and beta analysis in respect of investment portfolios to determine market risk. Risk management is carried out by senior finance executives ('finance') under policies approved by the Board of Directors ('the Board'). These policies include identification and analysis of the risk exposure of the Group and appropriate procedures, controls and risk limits. Finance identifies, evaluates and hedges financial risks within the Group's operating units. Finance reports to the Board on a monthly basis. (c) Market risk Foreign currency risk The Group undertakes certain transactions denominated in foreign currency and is exposed to foreign currency risk through foreign exchange rate fluctuations. Foreign exchange risk arises from future commercial transactions and recognised financial assets and financial liabilities denominated in a currency that is not the entity's functional currency. The risk is measured using sensitivity analysis and cash flow forecasting. The Group enters into forward exchange contracts to buy and sell specified amounts of foreign currencies in the future at stipulated exchange rates. The objective in entering the forward exchange contracts is to protect the Group against unfavourable exchange rate movements for both the contracted and anticipated future sales undertaken in foreign currencies. Certain of these foreign exchange forward contracts are designated as hedging instruments, detailed in note 26(f).

Mineral Resources Limited Notes to the financial statements 30 June 2019
Note 26. Financial instruments (continued)
88
The carrying amount of the Group's foreign currency denominated financial assets and financial liabilities at the reporting date were as follows: Assets Liabilities 2019 2018 2019 2018 Group $'000 $'000 $'000 $'000 USD denominated 57,369 103,042 1,020,758 18,145
The following table demonstrates the sensitivity of these foreign currency denominated financial assets and financial liabilities to a weakening/strengthening in the Australian dollar, with all other variables held constant. The impact on the Group’s profit before tax is due to changes in the fair value of monetary assets and liabilities including non-designated foreign currency derivatives. The impact on the Group’s pre-tax equity is due to changes in the fair value of forward exchange contracts designated as cash flow hedges. 2019 2018
AUD strengthened/(weakened)
Profit before tax Higher/(lower)
Equity
Higher/(lower)
Profit before tax Higher/(lower)
Equity
Higher/(lower) % $'000 $'000 $'000 $'000 USD denominated +5% 46,124 45,876 4,245 4,245 USD denominated -5% (50,979) (50,705) (4,245) (4,245) The Group’s exposure to foreign currency changes for all other currencies is not material. Commodity price risk The Group is exposed to commodity price risk which arises from the Group’s sale of iron ore, lithium direct ship ore (DSO) and lithium spodumene concentrate at contracted and/or spot prices. A portion of the Group’s exposure to iron ore prices is hedged. 2019 2018
Change in
price Profit before tax
Higher/(lower) Equity
Higher/(lower) Profit before tax
Higher/(lower) Equity
Higher/(lower) % $'000 $'000 $'000 $'000 Iron Ore + 10% 95,385 95,385 62,433 62,433 Lithium DSO + 10% 5,309 5,309 50,988 50,988 Lithium Spodumene + 10% 17,678 17,678 14,476 14,476 Equity price risk The Group’s investment in listed equity securities are susceptible to market price risk arising from uncertainties about future values of the investment securities. The Board reviews and approves all equity investment decisions. At the reporting date, the Group’s exposure to listed equity securities at fair value was $75,149,000 (2018: $114,113,000). A decrease of 10% (2018: 10%) on the share prices could have an impact of approximately $7,515,000 (2018: $11,411,000) on the profit or loss attributable to the Group, depending on whether the decline is significant or prolonged.

Mineral Resources Limited Notes to the financial statements 30 June 2019
Note 26. Financial instruments (continued)
89
Interest rate risk The Group's main interest rate risk arises from long-term borrowings. Borrowings issued at variable rates expose the Group to interest rate risk. As at the reporting date, the Group is exposed to interest rate risk on its variable rate financial instruments as follows: 2019 2018
Weighted average
interest rate
Balance
Weighted average
interest rate
Balance Group % $'000 % $'000 Cash and cash equivalents 1.72% 265,399 1.44% 240,406 Syndicated loan facility - - 3.33% (100,000) Lease liabilities 4.08% (178,736) 3.82% (132,539)
Net exposure to cash flow interest rate risk 86,663 7,867
An analysis by remaining contractual maturities is shown in 'liquidity risk' note 26(e) below. The Group has considered sensitivity relating to exposure to interest rate risk at reporting date. An official increase/decrease in interest rate of 100 (2018: 100) basis points would have a favourable/adverse effect on the profit before tax of $1,288,000 (2018: $87,000) per annum. (d) Credit risk Nature of the risk Credit risk refers to the risk that a counterparty will default on its contractual obligations resulting in financial loss to the Group. The Group's exposure to financial position credit risk are as indicated by the carrying amounts of its financial assets, primarily from customer receivables from operating activities and deposits with financial instruments from financing activities. The Group does not have a significant exposure to any individual counterparty. The Group has adopted a lifetime expected loss allowance in estimating expected credit losses to trade receivables through the use of a provisions matrix using fixed rates of credit loss provisioning. These provisions are considered representative across all customers of the Group based on recent sales experience, historical collection rates and forward-looking information that is available. Credit risk management: trade receivables and contract assets The Group has a strict code of credit, including obtaining agency credit information, confirming references and setting appropriate credit limits. The Group obtains guarantees where appropriate to mitigate credit risk and obtains letters of credit to mitigate credit risk for commodity sales. The maximum exposure to credit risk at the reporting date to trade receivables and contract assets is the carrying amount, net of any allowances for credit losses, as disclosed in the statement of financial position and notes to the financial statements. The Group does not hold any collateral. Generally, trade receivables are written off when there is no reasonable expectation of recovery. Indicators of this include the failure of a debtor to engage in a repayment plan, no active enforcement activity and a failure to make contractual payments for a period greater than 1 year. In monitoring customer credit risk, customers are grouped according to their credit characteristics, including whether they are commodity sales, crushing services or construction contract type of customer, and existence of previous financial difficulties.

Mineral Resources Limited Notes to the financial statements 30 June 2019
Note 26. Financial instruments (continued)
90
At 30 June 2019, the exposure to credit risk for trade receivables and contract assets by type of counterparty was as follows: Group 2019 2018 $'000 $'000 Commodity sale customers 69,625 30,051 Crushing services customers 30,857 34,801 Other 66,964 36,986
167,446 101,838
At 30 June 2019, the carrying amount of receivables and contract assets for the Group's two major customers (commodity sale customers) totalled $50,375,000. At 30 June 2018, the carrying amount of receivables and contract assets for the Group's major customer (a commodity sale customer) was $14,067,000. The Group uses an allowance matrix to measure the ECLs of trade receivables. A summary of the Group’s exposure to credit risk and ECLs for trade receivables and contract assets is as follows. The Group has no customers who are credit-impaired at the reporting date.
Expected credit loss rate Carrying amount Allowance for expected
credit losses 2019 2018 2019 2018 2019 2018 Group % % $'000 $'000 $'000 $'000 Current (not past due) - - 142,250 88,098 - - 1-30 days past due - - 12,882 12,419 - - 30-60 days past due - - 11,120 109 - - 61-90 days past due 10.00% 10.00% 48 - 5 - More than 90 days past due 78.15% 77.58% 5,359 5,405 4,188 4,193
171,659 106,031 4,193 4,193
Credit risk management: cash deposits and derivatives The credit risk on liquid funds and derivative financial instruments is limited because the counterparties are banks with high credit-ratings assigned by international credit-rating agencies. Credit risk management: financial guarantees given to banks There is also exposure to credit risk when the Group provides a guarantee to another party. The Group's maximum exposure in this respect is the maximum amount the Group would have to pay if the guarantee is called on. Details of contingent liabilities are disclosed in note 28. (e) Liquidity risk Vigilant liquidity risk management requires the Group to maintain sufficient liquid assets (mainly cash and cash equivalents) and available borrowing facilities to be able to pay debts as and when they become due and payable. The Group manages liquidity risk by maintaining adequate cash reserves and available borrowing facilities by continuously monitoring actual and forecast cash flows and matching the maturity profiles of financial assets and liabilities.
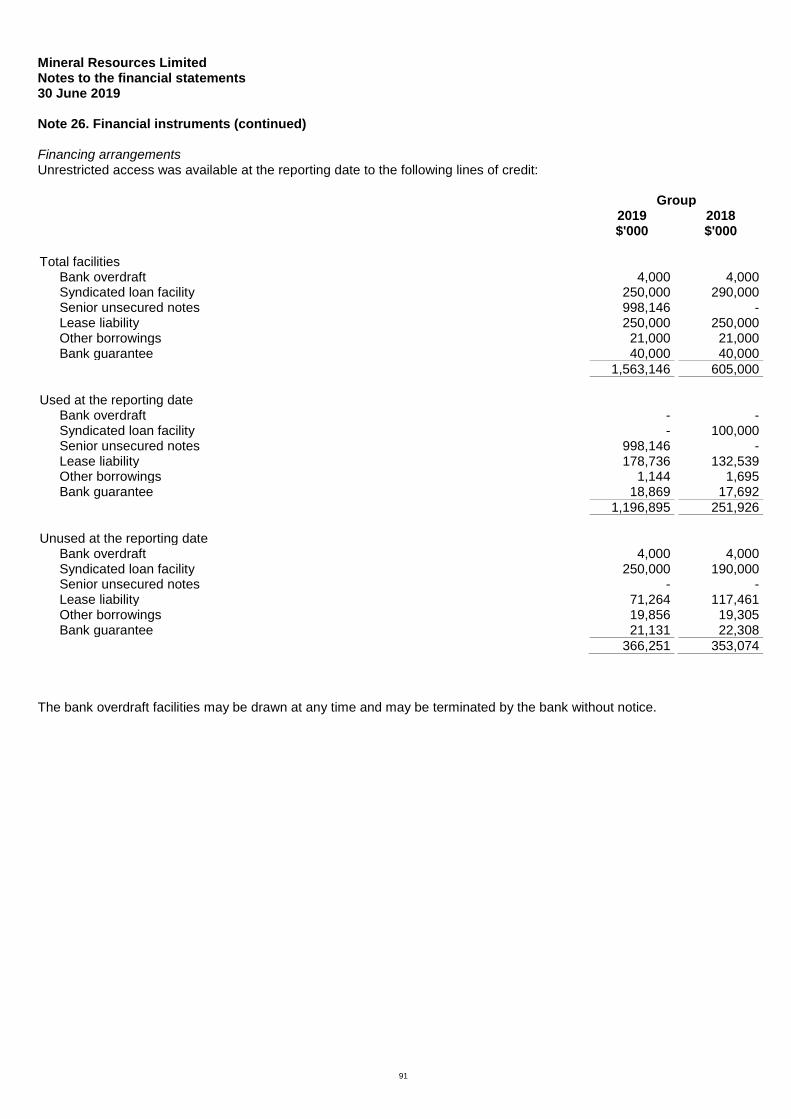
Mineral Resources Limited Notes to the financial statements 30 June 2019
Note 26. Financial instruments (continued)
91
Financing arrangements Unrestricted access was available at the reporting date to the following lines of credit: Group 2019 2018 $'000 $'000 Total facilities
Bank overdraft 4,000 4,000 Syndicated loan facility 250,000 290,000 Senior unsecured notes 998,146 - Lease liability 250,000 250,000 Other borrowings 21,000 21,000 Bank guarantee 40,000 40,000
1,563,146 605,000 Used at the reporting date
Bank overdraft - - Syndicated loan facility - 100,000 Senior unsecured notes 998,146 - Lease liability 178,736 132,539 Other borrowings 1,144 1,695 Bank guarantee 18,869 17,692
1,196,895 251,926
Unused at the reporting date
Bank overdraft 4,000 4,000 Syndicated loan facility 250,000 190,000 Senior unsecured notes - - Lease liability 71,264 117,461 Other borrowings 19,856 19,305 Bank guarantee 21,131 22,308
366,251 353,074
The bank overdraft facilities may be drawn at any time and may be terminated by the bank without notice.

Mineral Resources Limited Notes to the financial statements 30 June 2019
Note 26. Financial instruments (continued)
92
Remaining contractual maturities The following tables detail the Group's remaining contractual maturity for its financial instrument liabilities. The tables have been drawn up based on the undiscounted cash flows of financial liabilities based on the earliest date on which the financial liabilities are required to be paid. The tables include both interest and principal cash flows disclosed as remaining contractual maturities and therefore these totals may differ from their carrying amount in the statement of financial position.
1 year or
less
Between 1 and 2 years
Between 2 and 5 years
Over 5 years
Remaining contractual maturities
Group - 2019 $'000 $'000 $'000 $'000 $'000 Non-derivatives Non-interest bearing Trade payables 259,442 - - - 259,442 Interest-bearing - variable Lease liability 62,733 54,477 61,526 - 178,736 Interest-bearing - fixed rate Senior unsecured notes - - - 998,146 998,146 Other 1,144 - - - 1,144
Total non-derivatives 323,319 54,477 61,526 998,146 1,437,468
1 year or
less
Between 1 and 2 years
Between 2 and 5 years
Over 5 years
Remaining contractual maturities
Group - 2018 $'000 $'000 $'000 $'000 $'000 Non-derivatives Non-interest bearing Trade payables 261,571 - - - 261,571 Interest-bearing - variable Syndicated loan facility (i) - - 100,000 - 100,000 Lease liability 57,102 41,294 34,143 - 132,539
Total non-derivatives 318,673 41,294 134,143 - 494,110
(i) Relates to drawdowns under a Syndicated Loan Facility, maturing in December 2020. Drawdowns are currently
staggered and are able to be either repaid, or subject to compliance with facility covenants, unconditionally rolled every 30 days. The facility was repaid in April 2019 and a new $250 million Syndicated Loan Facility was executed in June 2019, maturing in June 2022. No drawdowns have been made on the facility as at 30 June 2019.
The cash flows in the maturity analysis above are not expected to occur significantly earlier than contractually disclosed above. Fair value of financial instruments Unless otherwise stated, the carrying amounts of financial instruments reflect their fair value. (f) Hedge activities and derivatives The Group is exposed to risk from movements in foreign exchange in relation to its forecast US dollar denominated sales and as part of the risk management strategy has entered into foreign exchange forward contracts. Certain of these foreign exchange forward contracts are designated as hedging instruments in cash flow hedges of forecast sales in US dollar. The following contracts in relation to US Dollar revenue from forecasted sales remain open at the reporting date: ● Foreign exchange forward contracts covering US$30,000,000 a month up to May 2020 (total US$330,000,000 open) at
an average rate of 0.6986

Mineral Resources Limited Notes to the financial statements 30 June 2019
Note 26. Financial instruments (continued)
93
These forward contracts were entered into in May 2019 and corresponds with the forecasted iron ore sales for the following 12 months to May 2020. The hedged US Dollar revenues do not represent the full value of expected sales over this period. The ineffective portion was immaterial in the current period.
Note 27. Fair value measurement Fair value hierarchy The following tables detail the Group's assets and liabilities, measured or disclosed at fair value, using a three level hierarchy, based on the lowest level of input that is significant to the entire fair value measurement, being: Level 1: Quoted prices (unadjusted) in active markets for identical assets or liabilities that the entity can access at the
measurement date Level 2: Inputs other than quoted prices included within Level 1 that are observable for the asset or liability, either
directly or indirectly Level 3: Unobservable inputs for the asset or liability
Level 1 Level 2 Level 3 Total Group - 2019 $'000 $'000 $'000 $'000 Assets Financial assets held at fair value through profit or loss 75,149 - - 75,149 Foreign exchange forward contracts in cash flow hedges 6,011 6,011
Total assets 81,160 - - 81,160
Level 1 Level 2 Level 3 Total Group - 2018 $'000 $'000 $'000 $'000 Assets Financial assets held at fair value through profit or loss 118,113 - - 118,113
Total assets 118,113 - - 118,113
Unless otherwise stated the carrying amount of other financial assets and financial liabilities reflect their fair value. The carrying amounts of trade and other receivables and trade and other payables are assumed to approximate their fair values due to their short-term nature. Classification of financial assets at fair value through profit or loss The Group classifies financial assets at fair value through profit or loss if they are acquired principally for the purpose of selling in the short term. They are presented as current assets if they are expected to be sold within 12 months after the end of the reporting period; otherwise they are presented as non-current assets.

Mineral Resources Limited Notes to the financial statements 30 June 2019
94
Note 28. Contingent liabilities The Group has provided guarantee to third parties in relation to performance of contracts and against warranty obligations for a defects liability period after completion of the work. Defects liability periods are usually from 12 to 18 months duration. Bank guarantees are issued as security for these obligations. Group 2019 2018 $'000 $'000 Restated* Bank guarantee facility 40,000 40,000 Amount utilised (18,869) (17,692)
Unused facility 21,131 22,308
* The bank guarantee facility limit and amount utilised disclosed in the prior period of $61,000,000 and ($19,387,000)
respectively contained non-guarantee borrowing facilities of $21,000,000 and amount utilised ($1,695,000) respectively. The overstatement has been corrected by restating the affected contingent liabilities line items. The change did not have an impact on the statement of financial position, the statement of profit or loss or the statement of cash flows.
Note 29. Commitments Group 2019 2018 $'000 $'000 Capital commitments Committed at the reporting date but not recognised as liabilities, payable: Property, plant and equipment 94,089 188,424
Lease commitments - operating Committed at the reporting date but not recognised as liabilities, payable: Within one year 6,616 4,432 One to five years 16,118 5,259 More than five years 21,513 -
44,247 9,691
Lease commitments - finance Committed at the reporting date and recognised as liabilities, payable: Within one year 69,295 61,383 One to five years 120,219 78,510
Total commitment 189,514 139,893 Less: Future finance charges (10,778) (7,354)
Net commitment recognised as liabilities 178,736 132,539
Representing: Lease liability - current (note 21) 54,125 57,102 Lease liability – associated with held for sale (note 13) 25,555 - Lease liability - non-current (note 21) 99,056 75,437
178,736 132,539

Mineral Resources Limited Notes to the financial statements 30 June 2019
Note 29. Commitments (continued)
95
Operating lease commitments includes contracted amounts for various retail outlets, warehouses, offices and plant and equipment under non-cancellable operating leases expiring within one to five years with, in some cases, options to extend. The leases have various escalation clauses. On renewal, the terms of the leases are renegotiated. Finance lease commitments includes contracted amounts for various plant and equipment with written down value of $188,269,000 (2018: $186,580,000) secured under finance leases expiring within one to five years. Under the terms of the leases, the Group has the option to acquire the leased assets for predetermined residual values on the expiry of the leases.
Note 30. Parent entity information Set out below is the supplementary information about the parent entity. Statement of profit or loss and other comprehensive income Parent 2019 2018 $'000 $'000 Profit after tax 29,751 144,254
Total comprehensive income 29,751 144,544
Statement of financial position Parent 2019 2018 $'000 $'000 Total current assets 1,169,669 173,617
Total assets 1,421,603 558,951
Total current liabilities 59,711 37,430
Total liabilities 1,267,538 346,577
Net assets 154,065 212,374
Equity
Issued capital 507,940 511,269 Reserves 14,666 - Accumulated losses (368,541) (298,895)
Total equity 154,065 212,374
Guarantees entered into by the parent entity in relation to the debts of its subsidiaries The parent entity had no guarantees in relation to the debts of its subsidiaries as at 30 June 2019 and 30 June 2018 other than as obligor under its syndicated financing facilities. Contingent liabilities The parent entity had no contingent liabilities as at 30 June 2019 (2018: $nil). Capital commitments - Property, plant and equipment The parent entity had no capital commitments for property, plant and equipment at as 30 June 2019 (2018: $1,627,000).

Mineral Resources Limited Notes to the financial statements 30 June 2019
Note 30. Parent entity information (continued)
96
Significant accounting policies The accounting policies of the parent entity are consistent with those of the Group, as disclosed in note 1, except for the following: ● Investments in subsidiaries are accounted for at cost, less any impairment, in the parent entity. ● Investments in associates are accounted for at cost, less any impairment, in the parent entity. ● Dividends received from subsidiaries are recognised as other income by the parent entity.
Note 31. Business combinations Business combinations in 2019 Acquisition of additional interest in Reed Industrial Minerals Pty Ltd (RIM) On 17 March 2019, the Group completed the purchase of an additional 6.9% equity interest in Reed Industrial Minerals Pty Ltd (RIM) under a Share Sale Agreement (Sale Agreement) with Neometals Ltd (ASX: NMT) (Neometals) for the Group and Ganfeng Lithium Co., Ltd (Ganfeng) to jointly and equally acquire Neometals’ 13.8% equity interest. The acquisition would take the Group’s interest in RIM and its underlying Mt Marion Lithium Project from 43.1% to 50.0%. The Group accounts for its interest in RIM as an interest in a joint operation and will continue to do so with its 50.0% interest as joint control has been maintained. The business combination principles were applied to the acquisition of the additional 6.9% interest in the joint operation. The Group’s previously held 43.1% interest in the joint operation was not remeasured. The fair value of the additional 6.9% interest in the identifiable assets acquired and liabilities assumed at the date of acquisition were: $'000 Assets Cash and cash equivalents 7,495 Receivables 2,436 Inventory 1,960 Property, plant and equipment 1,682 Exploration and mine development 46,968
Total assets 60,541 Liabilities Trade and other payables (7,770) Deferred tax liability (871)
Total liabilities (8,641)
Provisional fair value of net identifiable assets acquired 51,900 Consideration paid 51,900
Goodwill -
The purchase consideration is deemed to be representative of the fair value of the additional 6.9% interest in the underlying assets acquired and liabilities assumed, being substantially the tenements and mine development properties of the underlying Mt Marion Lithium Project, hence no goodwill nor gain on bargain purchase arises. Business combinations in 2018 Acquisition of Energy Resources Pty Ltd (previously Empire Oil Company (WA) Limited) On 8 November 2017, the Group acquired 100% of the ordinary shares of Energy Resources Pty Ltd (Energy Resources) and 90% of the ordinary shares of Cattamarra Farms Pty Ltd (Cattamarra Farms), a subsidiary of Energy Resources, through the effectuation of a Deed of Company Arrangement (DOCA).

Mineral Resources Limited Notes to the financial statements 30 June 2019
Note 31. Business combinations (continued)
97
The fair value of the identifiable assets acquired and liabilities assumed at the date of acquisition were: $'000 Assets Receivables 606 Property, plant and equipment 13,475 Exploration and development assets 16,274
Total assets 30,355 Liabilities Provision for rehabilitation (6,000) Borrowings (15,084)
Total liabilities (21,084)
Provisional fair value of net identifiable assets acquired 9,271 Consideration paid - Non-controlling interests (98)
Gain on bargain purchase 9,173
The acquisition accounting balances recognised at 30 June 2018 were based on a provisional assessment of their fair value. The valuations and tax–related matters affecting the acquisition accounting entries were finalised in the current year ended 30 June 2019 with no changes required to the provisional fair values of the identifiable assets acquired and liabilities assumed at the date of acquisition. A gain on bargain purchase arose in the business combination of Energy Resources as the Group obtained control and ownership of the Red Gully Processing Facility and all of Energy Resource’s petroleum exploration tenure by virtue of a 100% ownership in the shares in Energy Resources, without any purchase consideration being paid by the Group. This was a result of the DOCA that eventuated from Energy Resources defaulting on a loan facility provided by the Company, on which Energy Resource’s Red Gully Petroleum assets were provided as security. The gain on bargain purchase was recognised as other income in the income statement during the year ended 30 June 2018. From the date of acquisition, the contribution from Energy Resources to the net profit after-tax of the Group was insignificant. The 10% non-controlling interest in Cattamarra Farms, an unlisted company, has been estimated by reference to the proportionate share of the value of net identifiable assets acquired.

Mineral Resources Limited Notes to the financial statements 30 June 2019
98
Note 32. Interests in subsidiaries The consolidated financial statements incorporate the assets, liabilities and results of the following material subsidiaries in accordance with the accounting policy described in note 1: Ownership interest 2019 2018 Name Country of incorporation % % Crushing Services International Pty Ltd Australia 100.00% 100.00% Mesa Minerals Limited Australia 59.40% 59.40% PIHA Pty Ltd Australia 100.00% 100.00% Polaris Metals Pty Ltd Australia 100.00% 100.00% Process Minerals International Pty Ltd Australia 100.00% 100.00% Auvex Resources Pty Ltd Australia 100.00% 100.00% Mineral Resources (Equipment) Pty Ltd Australia 100.00% 100.00% MRL Asset Management Pty Ltd Australia 100.00% 100.00% MIS Carbonart Pty Ltd Australia 60.00% 60.00% Mineral Resources Transport Pty Ltd Australia 100.00% 100.00% Wodgina Lithium Pty Ltd Australia 100.00% 100.00% Bulk Ore Shuttle Systems Pty Ltd Australia 50.00% 50.00% Energy Resources Pty Ltd (previously Empire Oil Co (WA) Limited) New Zealand 100.00% 100.00% Cattamarra Farms Pty Ltd Australia 90.00% 90.00% Yilgarn Iron Pty Ltd (previously ACN 626 035 078) Australia 100.00% 100.00% Iron Resources Pty Ltd (previously ACN 626 063 796) Australia 100.00% 100.00% Kumina Iron Pty Ltd (previously ACN 169 725 973) Australia 100.00% 100.00%
Note 33. Interests in joint operations The Group has recognised its share of jointly held assets, liabilities, revenues and expenses of joint operations. These have been incorporated in the financial statements under the appropriate classifications. Information relating to joint operations that are material to the Group are set out below: Ownership interest Principal place of business / 2019 2018 Name Country of incorporation % % Reed Industrial Minerals Pty Ltd Australia 50.00% 43.10%
Note 34. Related party transactions Parent entity Mineral Resources Limited is the parent entity. Subsidiaries Interests in subsidiaries are set out in note 32. Joint operations Interests in joint operations are set out in note 33. Disclosures relating to key management personnel are set out in note 35 and the remuneration report included in the directors' report.

Mineral Resources Limited Notes to the financial statements 30 June 2019
Note 34. Related party transactions (continued)
99
Transactions with related parties The value of transactions with related parties and outstanding balances in relation to transactions with related parties were as follows: Group
Transaction values for the year ended 30
June
Transaction values for the year ended 30
June
Balances outstanding as at 30 June
Balances outstanding as at 30 June
2019 2018 2019 2018 $'000 $'000 $$'000 $'000 Key Management Personnel / directors' interests: Properties from which the Group's operations are performed are rented from parties related to Chris Ellison and Peter Wade
(2,027) (1,939)
- -
Occupation of these premises date back prior to the Company’s listing in 2006. The ongoing need for occupation of these premises, as well as rental arrangements, are assessed periodically. The Group has a Related Party Transaction Policy that requires the review and approval of Related Party Transactions by the Audit and Risk Committee (the Committee). A resolution is required by the Company’s Board of Directors (where applicable, excluding those involved in the Related Party Transaction) to confirm that the transaction is on terms not materially less favourable than terms generally available from an unaffiliated third party under the same or similar circumstances. Terms and conditions All transactions were made on normal commercial terms and conditions and at market rates.
Note 35. Key Management Personnel disclosures Compensation The aggregate compensation made to directors and other members of key management personnel of the Group is set out below: Group 2019 2018 $ $ Short-term employee benefits 8,314,489 5,768,247 Post-employment benefits 158,965 140,145 Share-based payments 1,961,850 5,737,500
10,435,304 11,645,892
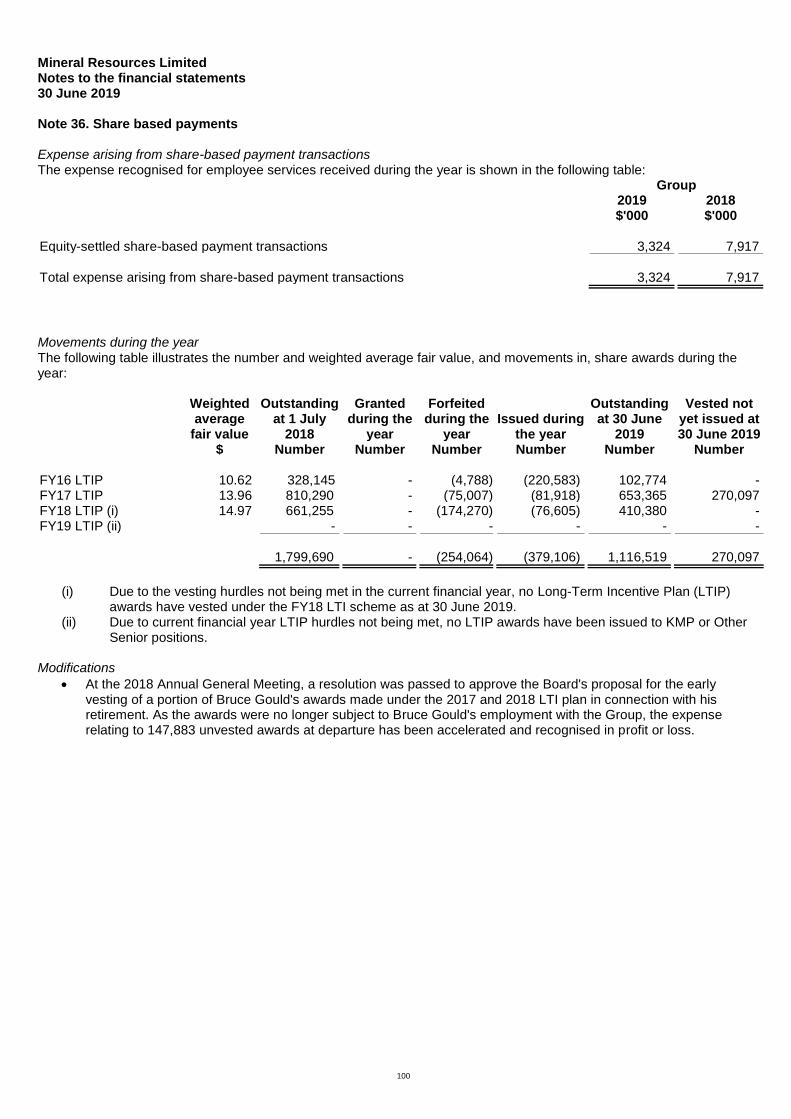
Mineral Resources Limited Notes to the financial statements 30 June 2019
100
Note 36. Share based payments Expense arising from share-based payment transactions The expense recognised for employee services received during the year is shown in the following table: Group 2019 2018 $'000 $'000 Equity-settled share-based payment transactions 3,324 7,917
Total expense arising from share-based payment transactions 3,324 7,917
Movements during the year The following table illustrates the number and weighted average fair value, and movements in, share awards during the year:
Weighted average
fair value
Outstanding at 1 July
2018
Granted during the
year
Forfeited during the
year
Issued during
the year
Outstanding at 30 June
2019
Vested not yet issued at 30 June 2019
$ Number Number Number Number Number Number FY16 LTIP 10.62 328,145 - (4,788) (220,583) 102,774 - FY17 LTIP 13.96 810,290 - (75,007) (81,918) 653,365 270,097 FY18 LTIP (i) 14.97 661,255 - (174,270) (76,605) 410,380 - FY19 LTIP (ii) - - - - - -
1,799,690 - (254,064) (379,106) 1,116,519 270,097
(i) Due to the vesting hurdles not being met in the current financial year, no Long-Term Incentive Plan (LTIP)
awards have vested under the FY18 LTI scheme as at 30 June 2019. (ii) Due to current financial year LTIP hurdles not being met, no LTIP awards have been issued to KMP or Other
Senior positions. Modifications
At the 2018 Annual General Meeting, a resolution was passed to approve the Board's proposal for the early vesting of a portion of Bruce Gould's awards made under the 2017 and 2018 LTI plan in connection with his retirement. As the awards were no longer subject to Bruce Gould's employment with the Group, the expense relating to 147,883 unvested awards at departure has been accelerated and recognised in profit or loss.

Mineral Resources Limited Notes to the financial statements 30 June 2019
Note 36. Share based payments (continued)
101
Summary of LTI structure A summary of the LTI structure is set out below:
1. A single financial measure (ROIC) that reflects the generation of long-term shareholder value is used to measure performance
2. LTI Program -
FY16: Vesting of awards equally (25% each year) over a period of 4 years, the first being the year of the grant (FY16) with FY16 LTI shares allocated to participants in August 2016.
FY17: Vesting awards equally over a period of three years, along with the corresponding dividends and voting rights the first being one financial year after the year of the grant (i.e. FY19 for the FY17 grant) with vesting subject to the ongoing performance of the business above the minimum performance level for the duration of the scheme. Shares that have vested remain subject to disposal restrictions preventing the individual from selling the vested shares until 38 months after the conclusion of the award year (that is, upon release of the full year financial results for the third financial year after the award year). Awards may be delayed or forfeited, depending on continuing service and ongoing business performance. Due to performance hurdles having been met when averaged over the 2017 and 2018 financial years, the second tranche of the 2017 LTIP will vest to eligible participants on 23rd August 2019.
FY18 Subject to the performance hurdle being met, LTI shares will vest to the individual over a period of three years, along with the corresponding dividends and voting rights, however shares that have vested remain subject to disposal restrictions preventing the individual from selling the vested shares until 38 months after the conclusion of the award year (that is, upon release of the full year financial results for the third financial year after the award year). For example, disposal restrictions on FY18 LTI shares will not be lifted until release of the full year financial results for FY21 expected to occur in August 2021). Awards may be delayed or forfeited, depending on continuing service and ongoing business performance. As performance hurdles have not been met for the 2019 financial year, the first tranche of the 2018 LTIP will be suspended and may vest to eligible participants in August 2021 subject to performance hurdles being met when averaged over the 2019 and 2020 financial years.
3. Re-measurement / claw-back mechanisms – once an entitlement is granted, vesting will be dependent on
continuing employment, and in addition, in the case of the FY17 and FY18 LTI, ongoing business performance in excess of minimum hurdles. The Board retains the right to withhold the vesting of individual tranches of granted rights depending on the Group performance and general economic conditions
4. Reward instruments – rights to MIN shares, with the basis for valuation being Volume Weighted Average Price
(VWAP) at the time of entitlement, being the VWAP for the 5 ASX trading days before 30 June each year: - FY16: $8.3689 per share - FY17: $10.0052 per share - FY18: $16.0594 per share. Once the entitlement to a number of shares is set, the recipient has the opportunity to benefit from share price movement between the date of grant and date of vesting, supporting further positive correlation between LTI’s granted and shareholder return
5. Participants do not have the right to hedge the value of unvested entitlements to shares
6. Benchmark ROIC of 12% for each period (i.e. each financial year)
7. ROIC is measured at a Group consolidated level, on the following basis: ROIC = NOPAT/Invested Capital Where: Net Operating Profit After Tax (NOPAT) is calculated as the Company’s statutory Earnings Before Interest and Taxes (EBIT) for the year, adjusted to remove the impact of changes to accounting policies (such as the treatment of operating leases), whether favourable or unfavourable, and after applying a flat 30% tax rate.

Mineral Resources Limited Notes to the financial statements 30 June 2019
Note 36. Share based payments (continued)
102
Invested Capital is calculated as the sum of Net Assets and Net Interest Bearing Debt at balance date adjusted for accumulative accounting policy adjustments. Treatment of cash balances for the purposes of calculating ROIC Strategic cash is defined as cash, over and above normal operational requirements, retained for future opportunities. The Board nominated strategic cash holdings ($100 million) is excluded from the calculation of Invested Capital on the basis that retention of a strong cash balance, and available borrowing facilities, are retained to enable strategic growth and investment. As retention of strategic cash holdings is a Board decision that senior executives and KMP are unable to influence, the Board has determined it is reasonable not to require senior executives and KMP to earn a return on these facilities.
8. Reward entitlement matrix is dependent on ROIC achieved for the measurement period. An uplift is available for
superior performance. LTI participants have an ability to exceed base entitlements based on the following matrix. The availability of an uplift in the award is in recognition of the difficulty of reaching the outstanding levels of performance (i.e. greater than 15% ROIC).
Note 37. Remuneration of auditors During the financial year the following fees were paid or payable for services provided by RSM Australia Partners, the auditor of the Company: Group 2019 2018 $ $ Audit services - RSM Australia Partners Audit or review of the financial statements 445,822 453,140
Other services - RSM Australia Partners & overseas network firms Taxation services 204,388 295,509 Due diligence services required for US Notes offering 169,338 - Other services - 5,720
373,726 301,229
819,548 754,369

Mineral Resources Limited Notes to the financial statements 30 June 2019
103
Note 38. Events after the reporting period The following significant events have arisen since the end of the financial year. Dividend On 22 August 2019, the directors declared a final fully franked dividend for the year ended 30 June 2019 of 31.0 cents per share to be paid on 4 October 2019, a total estimated distribution of $58,064,000 based on the number of ordinary shares on issue as at 22 August 2019. Sale arrangements for the Wodgina Lithium Project On 26 July 2019, the Group announced that it had received unconditional approval from the China State Administration for Market Regulation (SAMR) for the binding Wodgina Sale Agreement with Albemarle Corporation (NYSE: ALB, Albemarle) as announced on 14 December 2018. On 1 August 2019, the Group announced that it had entered into revised arrangements with Albemarle. Under the revised arrangements, the Group will increase the interest in the Wodgina Lithium Project to be sold to Albemarle from 50% to 60% and Albemarle and MRL will form a 60:40 joint venture to operate the Wodgina Lithium Mine and battery grade lithium hydroxide production facilities. Albemarle will pay US$820 million in cash at closing and transfer a 40% interest in the first two lithium hydroxide conversion units currently being built by Albemarle in Kemerton, near Bunbury in Western Australia, which will be capable of processing spodumene produced at Wodgina. Purchase agreement for Parker Range Project On 21 August 2019, the Group announced that it had executed a binding heads of agreement with Cazaly Iron Pty Ltd (a wholly owned subsidiary of Cazaly Resources Limited (ASX: CAZ, Cazaly) to purchase the assets that comprise the Parker Range Project in the Yilgarn region of Western Australia. The heads of agreement is conditional on MRL completing due diligence within 21 days; board approval of both parties; ministerial consent for the transfer of the tenements; and Cazaly shareholder approval as, and if, required. On completion, the purchase price payable by MRL to Cazaly Iron Pty Ltd for the assets is $20,000,000. MRL will also pay Cazaly Iron Pty Ltd a royalty of $0.50 for every dry metric tonne of iron ore extracted and removed from the area of the tenements payable after the first 10 million dry metric tonnes of iron ore have been extracted and removed from the area of the tenements. No other matter or circumstance has arisen since 30 June 2019 that has significantly affected, or may significantly affect the Group's operations, the results of those operations, or the Group's state of affairs in future financial years.
Mineral Resources Limited Directors' declaration 30 June 2019
104
In the directors' opinion: ● the attached financial statements and notes comply with the Corporations Act 2001, the Accounting Standards, the
Corporations Regulations 2001 and other mandatory professional reporting requirements; ● the attached financial statements and notes comply with International Financial Reporting Standards as issued by the
International Accounting Standards Board as described in note 1 to the financial statements; ● the attached financial statements and notes give a true and fair view of the Group's financial position as at 30 June
2019 and of its performance for the financial year ended on that date; and ● there are reasonable grounds to believe that the Company will be able to pay its debts as and when they become due
and payable. The directors have been given the declarations required by section 295A of the Corporations Act 2001. Signed in accordance with a resolution of directors made pursuant to section 295(5)(a) of the Corporations Act 2001. On behalf of the directors
Chris Ellison Managing Director 22 August 2019 Perth

THE POWER OF BEING UNDERSTOODAUDIT | TAX | CONSULTING
RSM Australia Partners is a member of the RSM network and trades as RSM. RSM is the trading name used by the members of the RSM network. Each member of the RSM network is an independent accounting and consulting firm which practices in its own right. The RSM network is not itself a separate legal entity in any jurisdiction.
RSM Australia Partners ABN 36 965 185 036
Liability limited by a scheme approved under Professional Standards Legislation
RSM Australia Partners
Level 32 Exchange Tower, 2 The Esplanade Perth WA 6000 GPO Box R1253 Perth WA 6844
T +61 (0) 8 9261 9100 F +61 (0) 8 9261 9111
www.rsm.com.au
INDEPENDENT AUDITOR’S REPORT TO THE MEMBERS OF
MINERAL RESOURCES LIMITED
Opinion
We have audited the financial report of Mineral Resources Limited (the Company) and its subsidiaries (the Group), which comprises the consolidated statement of financial position as at 30 June 2019, the consolidated statement of profit or loss and other comprehensive income, the consolidated statement of changes in equity and the consolidated statement of cash flows for the year then ended, and notes to the financial statements, including a summary of significant accounting policies, and the directors' declaration.
In our opinion, the accompanying financial report of the Group is in accordance with the Corporations Act 2001, including:
(i) giving a true and fair view of the Group's financial position as at 30 June 2019 and of its financial performance for the year then ended; and
(ii) complying with Australian Accounting Standards and the Corporations Regulations 2001.
Basis for Opinion
We conducted our audit in accordance with Australian Auditing Standards. Our responsibilities under those standards are further described in the Auditor's Responsibilities for the Audit of the Financial Report section of our report. We are independent of the Group in accordance with the auditor independence requirements of the Corporations Act 2001 and the ethical requirements of the Accounting Professional and Ethical Standards Board's APES 110 Code of Ethics for Professional Accountants (the Code) that are relevant to our audit of the financial report in Australia. We have also fulfilled our other ethical responsibilities in accordance with the Code.
We confirm that the independence declaration required by the Corporations Act 2001, which has been given to the directors of the Company, would be in the same terms if given to the directors as at the time of this auditor's report.
We believe that the audit evidence we have obtained is sufficient and appropriate to provide a basis for our opinion.
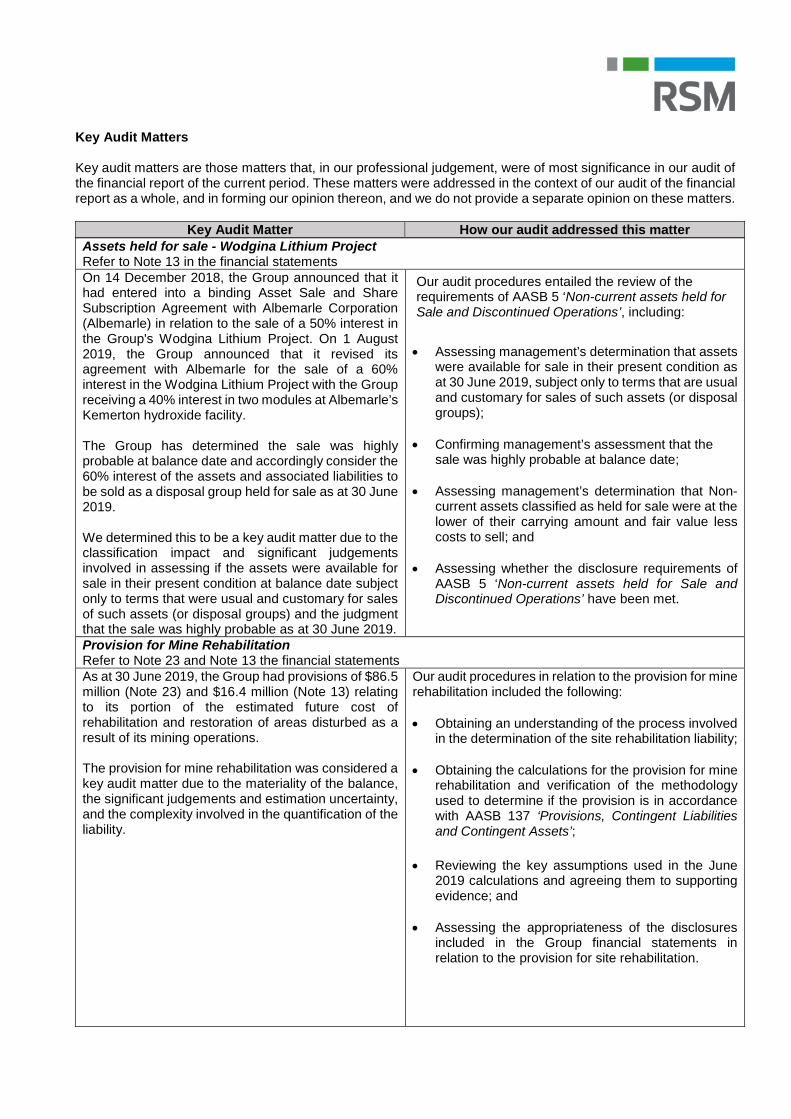
Key Audit Matters
Key audit matters are those matters that, in our professional judgement, were of most significance in our audit of the financial report of the current period. These matters were addressed in the context of our audit of the financial report as a whole, and in forming our opinion thereon, and we do not provide a separate opinion on these matters.
Key Audit Matter How our audit addressed this matter
Assets held for sale - Wodgina Lithium Project Refer to Note 13 in the financial statementsOn 14 December 2018, the Group announced that it had entered into a binding Asset Sale and Share Subscription Agreement with Albemarle Corporation (Albemarle) in relation to the sale of a 50% interest in the Group's Wodgina Lithium Project. On 1 August 2019, the Group announced that it revised its agreement with Albemarle for the sale of a 60% interest in the Wodgina Lithium Project with the Group receiving a 40% interest in two modules at Albemarle’s Kemerton hydroxide facility.
The Group has determined the sale was highly probable at balance date and accordingly consider the 60% interest of the assets and associated liabilities to be sold as a disposal group held for sale as at 30 June 2019.
We determined this to be a key audit matter due to the classification impact and significant judgements involved in assessing if the assets were available for sale in their present condition at balance date subject only to terms that were usual and customary for sales of such assets (or disposal groups) and the judgment that the sale was highly probable as at 30 June 2019.
Our audit procedures entailed the review of the requirements of AASB 5 ‘Non-current assets held for Sale and Discontinued Operations’, including:
Assessing management’s determination that assets were available for sale in their present condition as at 30 June 2019, subject only to terms that are usual and customary for sales of such assets (or disposal groups);
Confirming management’s assessment that the sale was highly probable at balance date;
Assessing management’s determination that Non-current assets classified as held for sale were at the lower of their carrying amount and fair value less costs to sell; and
Assessing whether the disclosure requirements of AASB 5 ‘Non-current assets held for Sale and Discontinued Operations’ have been met.
Provision for Mine Rehabilitation Refer to Note 23 and Note 13 the financial statements As at 30 June 2019, the Group had provisions of $86.5 million (Note 23) and $16.4 million (Note 13) relating to its portion of the estimated future cost of rehabilitation and restoration of areas disturbed as a result of its mining operations.
The provision for mine rehabilitation was considered a key audit matter due to the materiality of the balance, the significant judgements and estimation uncertainty, and the complexity involved in the quantification of the liability.
Our audit procedures in relation to the provision for mine rehabilitation included the following:
Obtaining an understanding of the process involved in the determination of the site rehabilitation liability;
Obtaining the calculations for the provision for mine rehabilitation and verification of the methodology used to determine if the provision is in accordance with AASB 137 ‘Provisions, Contingent Liabilities and Contingent Assets’;
Reviewing the key assumptions used in the June 2019 calculations and agreeing them to supporting evidence; and
Assessing the appropriateness of the disclosures included in the Group financial statements in relation to the provision for site rehabilitation.

Business Combination - Acquisition of additional interest in Reed Industrial Minerals Pty Ltd Refer to Note 31 in the financial statements
On 17 March 2019, the Group completed the purchase
of an additional 6.9% equity interest in Reed Industrial
Minerals Pty Ltd (RIM) under a Share Sale Agreement
(Sale Agreement) with Neometals Ltd (Neometals) for
the Group and Ganfeng Lithium Co. Ltd (Ganfeng) to
jointly and equally acquire Neometals' 13.8% equity
interest. The acquisition would take the Group's
interest in RIM and its underlying Mt Marion Lithium
Project from 43.1% to 50.0%
The Group accounts for its interest in RIM as an
interest in a joint operation and will continue to do so
with its 50.0% interest as joint control has been
maintained.
The business combination principles were applied to
the acquisition of the additional 6.9% interest in the
joint operation. The Group's previously held 43.1%
interest in the joint operation was not remeasured.
This was considered a key audit matter because the
accounting for the transaction is complex and involves
significant judgments in applying the accounting
standards AASB 3 ‘Business Combinations’ and
AASB 11 ‘Joint Arrangements’.
Our audit procedures in relation to the acquisition
transaction included:
Obtaining the share sale agreement, other associated documents, and ensuring that the transaction had been accounted for in compliance with AASB 3 ‘Business Combinations’ and AASB 11 ‘Joint Arrangements’;
Testing the consideration paid to the signed share sale agreement and to bank statements;
Assessing management’s determination that it retains joint control over RIM;
Evaluating the acquisition date fair values of the additional 6.9% interest in identifiable assets acquired and liabilities assumed at the date of the acquisition;
Verifying that the Group recognised its share of jointly held assets, liabilities, revenues and expenses in RIM at the correct proportion into the Group’s financial report; and
Reviewing the disclosures in Note 31 to the financial statements in order to assess compliance with the disclosure requirements of AASB 3 ‘Business Combinations’ and AASB 11 ‘Joint Arrangements’.
Existence and Valuation of Inventory Refer to Note 11 and Note 13 the financial statementsThe Group had inventory with a carrying value of $180.1 million (Note 11) and $25.7 million (Note 13) as at 30 June 2019. The existence and valuation of inventory is considered a key audit matter, due to the materiality of the balance and the significant judgments involved.
Areas of judgement included future estimates of foreign exchange, iron ore, lithium ore prices, ore grades and allocation of processing costs.
Our audit procedures in relation to the existence and valuation of inventory included the following:
Verifying the ore stockpiles at reporting date by reviewing the survey reports provided and reconciling them to the inventory models;
Reviewing and testing the methodology applied by management in the inventory models, including mathematical accuracy of the models, cost allocation and physical movement of the ore stockpiles;
Testing a sample of expenditure to supporting invoices or other documentation and confirmation of the validity of the amounts recorded in the accounting records;
Testing the net realisable value by checking future ore prices used with market data and expected processing with actual costs incurred; and
Assessing the competence and objectivity of the management expert used to conduct the physical survey.

Other Information
The directors are responsible for the other information. The other information comprises the information included in the Group's annual report for the year ended 30 June 2019, but does not include the financial report and the auditor's report thereon.
Our opinion on the financial report does not cover the other information and accordingly we do not express any form of assurance conclusion thereon.
In connection with our audit of the financial report, our responsibility is to read the other information and, in doing so, consider whether the other information is materially inconsistent with the financial report or our knowledge obtained in the audit or otherwise appears to be materially misstated.
If, based on the work we have performed, we conclude that there is a material misstatement of this other information, we are required to report that fact. We have nothing to report in this regard.
Responsibilities of the Directors for the Financial Report
The directors of the Company are responsible for the preparation of the financial report that gives a true and fair view in accordance with Australian Accounting Standards and the Corporations Act 2001 and for such internal control as the directors determine is necessary to enable the preparation of the financial report that gives a true and fair view and is free from material misstatement, whether due to fraud or error.
In preparing the financial report, the directors are responsible for assessing the ability of the Group to continue as a going concern, disclosing, as applicable, matters related to going concern and using the going concern basis of accounting unless the directors either intend to liquidate the Group or to cease operations, or have no realistic alternative but to do so.
Auditor's Responsibilities for the Audit of the Financial Report
Our objectives are to obtain reasonable assurance about whether the financial report as a whole is free from material misstatement, whether due to fraud or error, and to issue an auditor's report that includes our opinion. Reasonable assurance is a high level of assurance, but is not a guarantee that an audit conducted in accordance with the Australian Auditing Standards will always detect a material misstatement when it exists. Misstatements can arise from fraud or error and are considered material if, individually or in the aggregate, they could reasonably be expected to influence the economic decisions of users taken on the basis of this financial report.
A further description of our responsibilities for the audit of the financial report is located at the Auditing and Assurance Standards Board website at: http://www.auasb.gov.au/auditors_responsibilities/ar1.pdf. This description forms part of our auditor's report.

Report on the Remuneration Report
Opinion on the Remuneration Report
We have audited the Remuneration Report included within the directors' report for the year ended 30 June 2019.
In our opinion, the Remuneration Report of Mineral Resources Limited, for the year ended 30 June 2019, complies with section 300A of the Corporations Act 2001.
Responsibilities
The directors of the Company are responsible for the preparation and presentation of the Remuneration Report in accordance with section 300A of the Corporations Act 2001. Our responsibility is to express an opinion on the Remuneration Report, based on our audit conducted in accordance with Australian Auditing Standards.
RSM AUSTRALIA PARTNERS
Perth, WA JAMES KOMNINOS Dated: 22 August 2019 Partner