medicaid 1915(c) waiver data based on the cms 372 … section 1915(c) waiver data based on the cms...
TRANSCRIPT

Medicaid Section 1915(c) Waiver Data based on the CMS 372 Report, 2013 – 2014 September 6, 2017 Steve Eiken This report contains information which resulted from Contract No. HHSM-500-2010-00026I, between Mathematica Policy Research, Inc. and the Centers for Medicare & Medicaid Services (CMS), under which project Truven Health Analytics was a subcontractor.
Medicaid Section 1915(c) Waiver Data based on the CMS 372 Report, 2013 – 2014 2
Table of Contents
Executive Summary .......................................................................................................................... 3Summary Data for Section 1915(c) Waivers .................................................................................... 7
Trends in Section 1915(c) Waiver Data ............................................................................................ 9
Section 1915(c) Waiver Data by Target Population ...................................................................... 12
State Variation in Section 1915(c) Waiver Data ............................................................................. 18
Comparison to the Section 1915(c) Waiver Expenditures Report ............................................... 34
Conclusion ....................................................................................................................................... 35
Appendix A: Data Sources, Methods and Limitations ................................................................. 36
Appendix B: Data Tables ............................................................................................................... 37

Medicaid Section 1915(c) Waiver Data based on the CMS 372 Report, 2013 – 2014 3
Medicaid section 1915(c) waivers are a critical source of home and community-
based alternatives to institutional services, comprising more than half of
Medicaid home and community-based services expenditures.1 The Centers for
Medicare & Medicaid Services (CMS) requires states to submit an annual report,
called the CMS 372 for each section 1915(c) waiver. This report presents
information from the CMS 372 reports for waiver years ending in 2013 and
2014.2 We also present trend data for section 1915(c) waivers starting with
2009, the first year in the series of reports based on CMS 372 data.3
Over 1.6 million people received section 1915(c) waiver services in 2014, a five
percent increase from 1.5 million in 2013. The number of section 1915(c) waiver
participants has increased by an average of four percent per year since 2009.
After adjusting for overall U.S. population growth, the number of participants
increased an average of three percent per year, from 4.3 participants per 1,000
U.S. residents in 2009 to 5.0 participants per 1,000 residents in 2014.
Participants received services for an average of 10 months in 2014, as in
previous years.
1 Eiken S, Sredl K, Woodward R, and Saucier P. Medicaid Expenditures for Section 1915(c) Waivers in FY 2015 CMS, July 10, 2017. Available on-line at https://www.medicaid.gov/medicaid/ltss/reports-and-evaluations/index.html. 2 States must submit CMS 372 data for a waiver year, which starts on the waiver’s effective date or the anniversary of that date. The reporting period varies based on the waiver’s effective date. This report refers to the year in which the end of the reporting time period occurs. For example, 2014 data are for waiver years that end in 2014. 3 For the first report, see Eiken S and Lelchook S. Medicaid 1915(c) Waiver Data Based on the CMS 372 Report, 2009 – 2010 CMS, October 2013. All reports in the series are available on-line at https://www.medicaid.gov/medicaid/ltss/reports-and-evaluations/index.html.
Executive Summary
Medicaid Section 1915(c) Waiver Data based on the CMS 372 Report, 2013 – 2014 4
Average waiver expenditures per person were $26,055, 72 percent of total
Medicaid spending for these individuals ($36,039). Average waiver
expenditures have been almost flat since 2009, with an average annual increase
of less than half a percent. Total Medicaid expenditures per waiver participant
grew slightly more quickly, one percent per year from 2009 through 2014.
Waiver expenditures accounted for only 72 percent of total Medicaid
expenditures for waiver participants in 2014, compared to 76 percent in 2009.
Section 1915(c) waiver data by targeted population group have changed little
over the years when adjusting for overall participant growth. In all years, a
majority of participants received services in waivers targeting older adults and/or
people with physical disabilities (54 percent in 2014). Most of the remaining
participants received supports from waivers targeting people with developmental
disabilities (43 percent in 2014). Older adults and people with physical
disabilities received section 1915(c) waiver services for a shorter duration of
time (nine months) than people with developmental disabilities (11 months),
reflecting greater turnover in the program for the former group. Waivers
targeting people with developmental disabilities accounted for $30 billion in
2014, 71 percent of all section 1915(c) waiver expenditures, reflecting higher
average costs per participant for this population. Most of the remaining
spending, 27 percent, was targeted to older adults and/or people with physical
disabilities ($11 billion).
Waivers targeting people with brain injuries, medically fragile children, people
with HIV/AIDS, and people with serious mental illness or serious emotional
disturbance comprise approximately three percent of section 1915(c) waiver
participants and two percent of waiver expenditures.
Medicaid Section 1915(c) Waiver Data based on the CMS 372 Report, 2013 – 2014 5
Total section 1915(c) waiver expenditures in the CMS 372, $41.8 billion, was
only one percent greater than the $41.4 billion in federal fiscal year 2014
spending shown in a separate report of section 1915(c) waiver expenditures.
The other report was based on state CMS-64 reports and estimates from states
with managed care programs.4 For most states and about half of the waivers,
the two sources had similar data. Significant differences occurred for a minority
of states and for many waivers, however.
For all waivers and for each population group, Truven Health Analytics, now part
of the IBM Watson Health Business, analyzed state variation in the number of
waiver participants per 1,000 state residents and average waiver expenditures
per participant. For all waivers in a state and for each population group, this
report identifies typical values and outliers for the proportion of state residents in
a waiver and for average cost. Accompanying the report are tables that display
2013 and 2014 data for each section 1915(c) waiver, followed by state-level
data for total participants and for each target population. State-level tables rank
states according to the proportion of total state residents who received section
1915(c) waiver services.
4 Eiken S, Sredl K, Woodward R, and Saucier P. Medicaid Expenditures for Section 1915(c) Waivers in FY 2015 CMS, July 10, 2017. Available on-line at https://www.medicaid.gov/medicaid/ltss/reports-and-evaluations/index.html.
Medicaid Section 1915(c) Waiver Data based on the CMS 372 Report, 2013 – 2014 6
Medicaid Section 1915(c) Waiver Data based on the CMS 372 Report, 2013 - 2014
Waivers authorized by section 1915(c) of the Social Security Act account for a majority of Medicaid funding for
home and community-based services (HCBS).5 For each waiver, states must submit an annual report called
the CMS 372 to document that the waiver meets cost-neutrality requirements.6 The CMS 372 includes the
number of persons who received services (hereafter called participants), the number of days participants
received services, section 1915(c) waiver expenditures, and total Medicaid expenditures for waiver
participants.
Starting with waiver years7 ending in 2009, CMS required states to submit the CMS 372 using a web-based
system called the Waiver Management System (WMS). This report uses WMS data to provide national
information on section 1915(c) waivers for waiver years ending in 2013 and 2014. We also present trend data
for waivers starting with 2009, the first year in the series of reports based on CMS 372 data by Truven Health
Analytics, part of the IBM Watson Health Business.8 Readers are encouraged to review Appendix A for
important notes and caveats regarding the data.
Data tables in Appendix B of this report provide the number of participants, expenditures for waiver services,
and total Medicaid expenditures for section 1915(c) waivers. The tables also present the average number of
months participants received services during the year based on the total days of service on the CMS 372. We
use participant month instead of days to show smaller data values that clearly illustrate differences across
states and section 1915(c) waivers. Participant months are the number of days of service divided by average
days per month in a year: 365 divided by 12 for most years and 366 divided by 12 in 2012, a leap year.
5 Eiken S, Sredl K, Burwell B, and Woodward R. Medicaid Expenditures for Long Term Services and Supports (LTSS) in 2015 CMS, April 14, 2017. Available on-line at https://www.medicaid.gov/medicaid/ltss/reports-and-evaluations/index.html. 6 Federal Register Vol. 73, No. 188. The report is officially called the CMS 372(S), a name adopted when 1995 changes shortened the report’s format. 7 States must submit CMS 372 data for a waiver year, which starts on the waiver’s effective date or the anniversary of that date. The reporting period varies based on the waiver’s effective date. This report refers to the year in which the end of the reporting time period occurs. For example, 2014 data are for waiver years that end in 2014. 8 For the first report, see Eiken S and Lelchook S. Medicaid 1915(c) Waiver Data Based on the CMS 372 Report, 2009 – 2010 CMS, October 2013. All reports in the series are available on-line at https://www.medicaid.gov/medicaid/ltss/reports-and-evaluations/index.html.
Medicaid Section 1915(c) Waiver Data based on the CMS 372 Report, 2013 – 2014 7
Summary Data for Section 1915(c) Waivers Forty-seven states and the District of Columbia operated section 1915(c) waivers in 2013 and 2014. Three
states (Arizona, Rhode Island, and Vermont) did not have section 1915(c) waivers, but provided similar
services in demonstrations authorized under section 1115 of the Social Security Act. Delaware, Hawaii, and
Tennessee had section 1915(c) waivers only for people with developmental disabilities during both years;
they provided similar HCBS in section 1115 demonstrations for other populations. New Mexico only offered
section 1915(c) waivers to people with developmental disabilities and medically fragile children in 2014; the
state closed several waivers in 2013 and started providing similar services in a section 1115 demonstration.
This report does not include data from section 1115 demonstrations because the CMS 372 is only required for
section 1915(c) waivers.
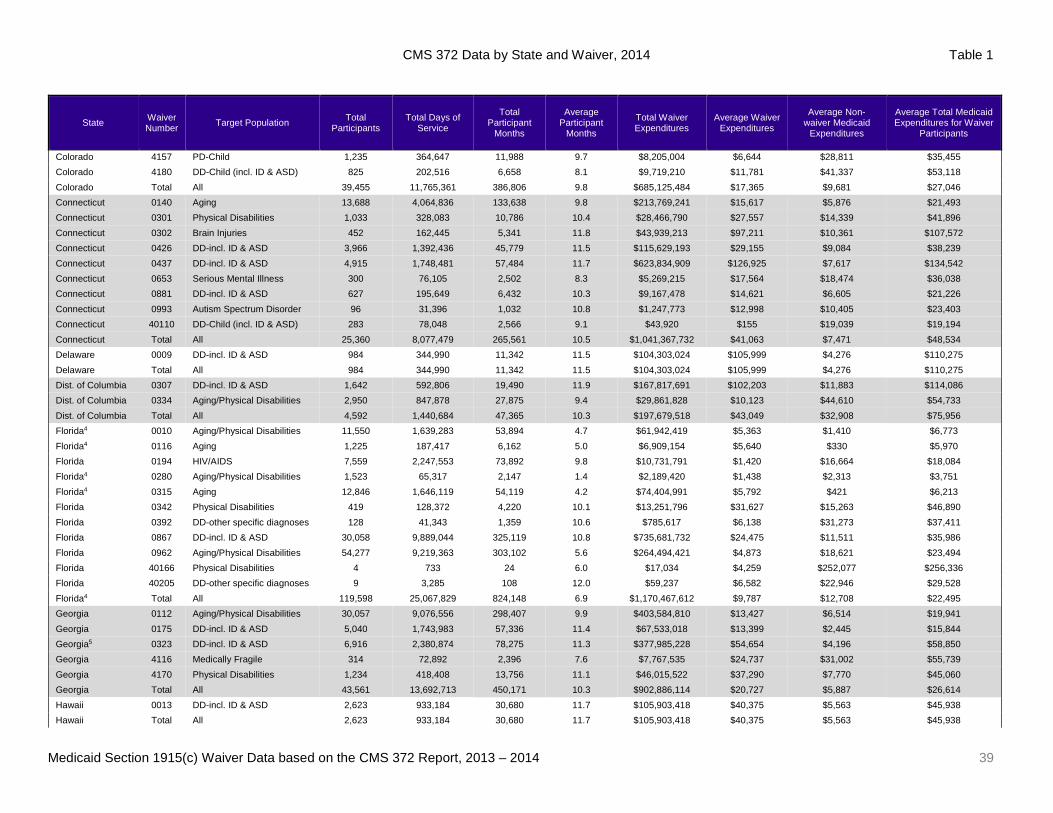
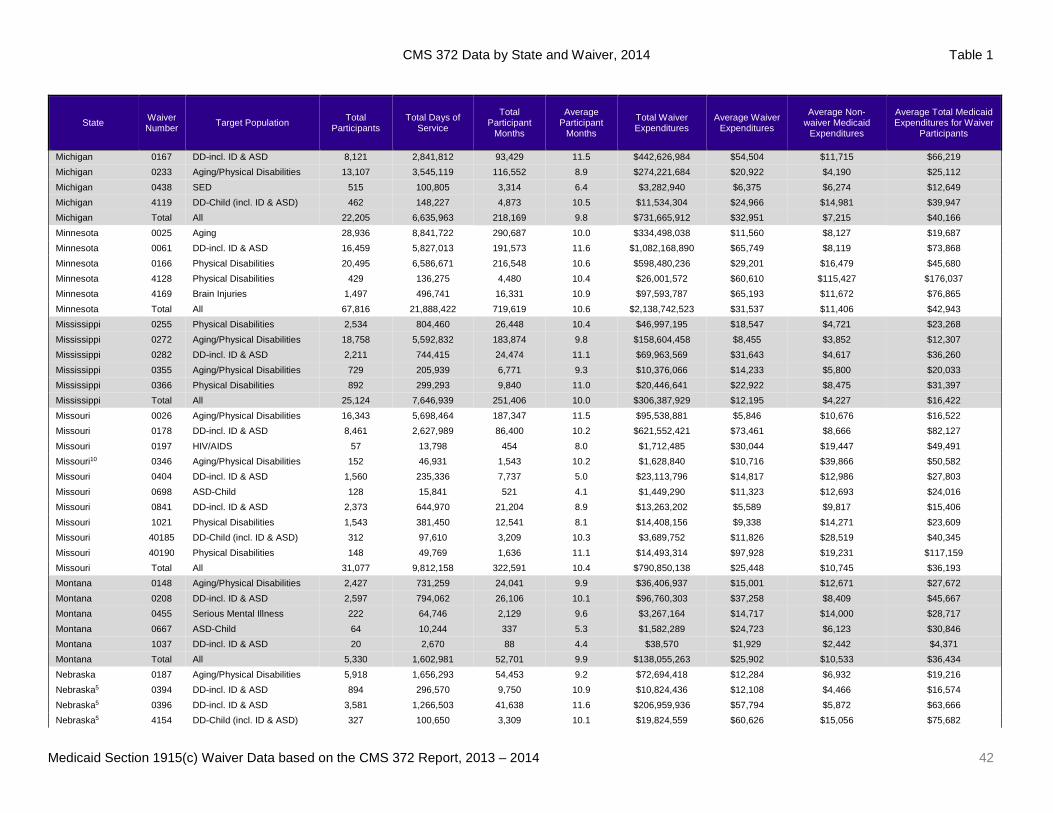
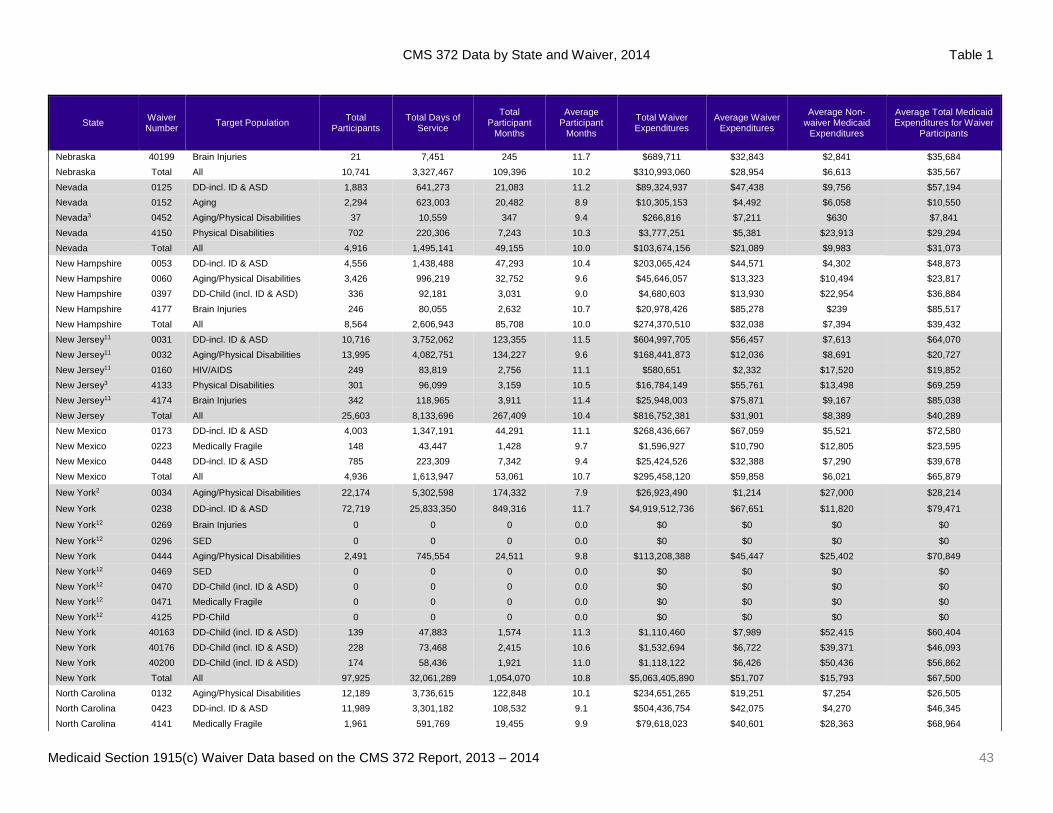
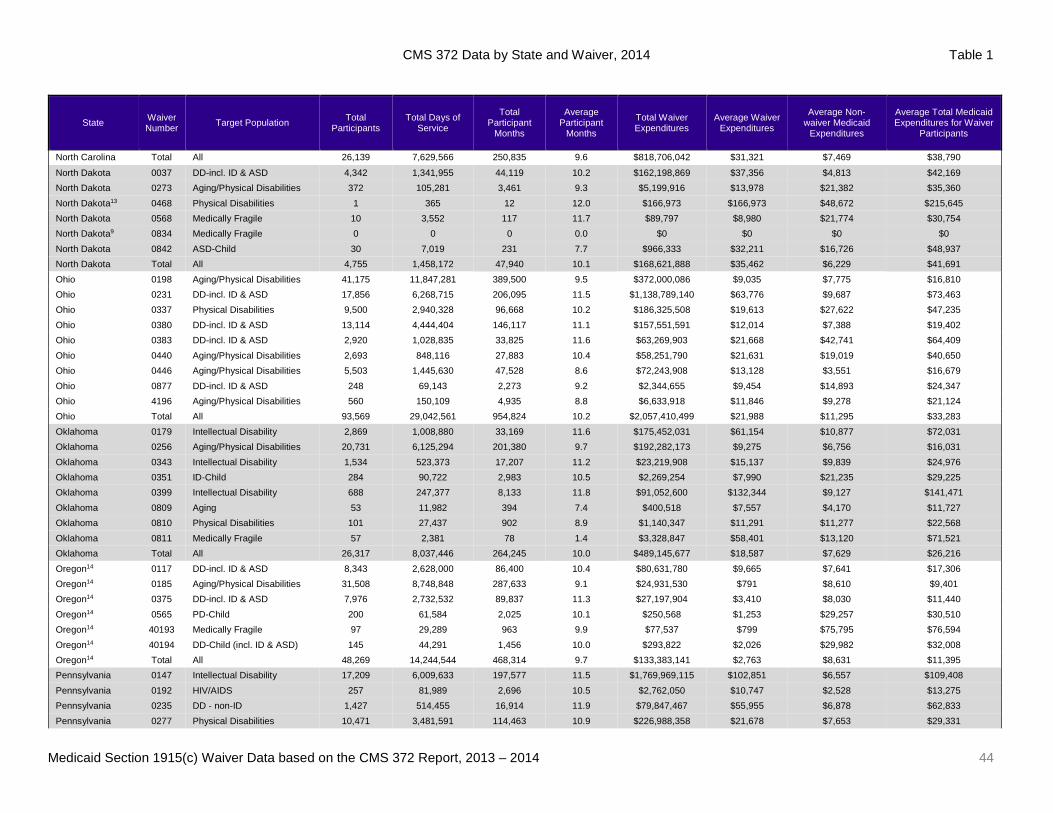
Table 1 presents 2014 data for each section 1915(c) waiver, arranged by state, as well as national totals. For
33 waivers, data were missing because either 1) the state did not submit a report or 2) CMS had not accepted
a state’s report by July 14, 2017, the final date for data included in this report. Data from previous years’
reports are used in Table 1 and subsequent tables so national totals include as many as waivers as possible.
This analysis used 2013 data for 18 waivers with missing reports, 2012 data for five waivers, and 2011 data
for four waivers. For six waivers, no data were used because no CMS 372 data from 2011 through 2014 were
available. Table 2 provides similar data for 2013, using the most recent CMS-accepted data when 2013 data
were not available.
Table 3 provides state-level 2014 data, ranking states according to the proportion of the total 2013 state
population served in section 1915(c) waivers. Truven Health used the U.S. Census Bureau’s Current
Population Estimates for state population.9 The table also shows trends since 2013 in the number of
participants, average months of service, and average cost.
Over 1.6 million people received section 1915(c) waiver services in 2014, about one of every 200 U.S.
residents. The number of participants increased five percent from 1.5 million in 2013. Participants received
services for an average of 10.0 months in 2014, a slight decrease from 10.1 months the previous year.
Average waiver expenditures per person were $26,055, a one percent decrease from 2013 driven by a $672
million decrease in Oregon’s expenditures as the state implemented the Medicaid state plan Community First
9 U.S. Census Bureau, Population Division “Table 1. Annual Estimates of the Resident Population for the United States, Regions, States, and Puerto Rico: April 1, 2010 to July 1, 2016 (NST-EST2016-01)” December 2016. Available on-line at https://www.census.gov/data/tables/2016/demo/popest/state-total.html.

Medicaid Section 1915(c) Waiver Data based on the CMS 372 Report, 2013 – 2014 8
Choice benefit, which includes services previously funded by the state’s section 1915(c) waivers. Average
total Medicaid expenditures for waiver participants were $36,039, a 1.5 percent increase from 2013.
Medicaid Section 1915(c) Waiver Data based on the CMS 372 Report, 2013 – 2014 9
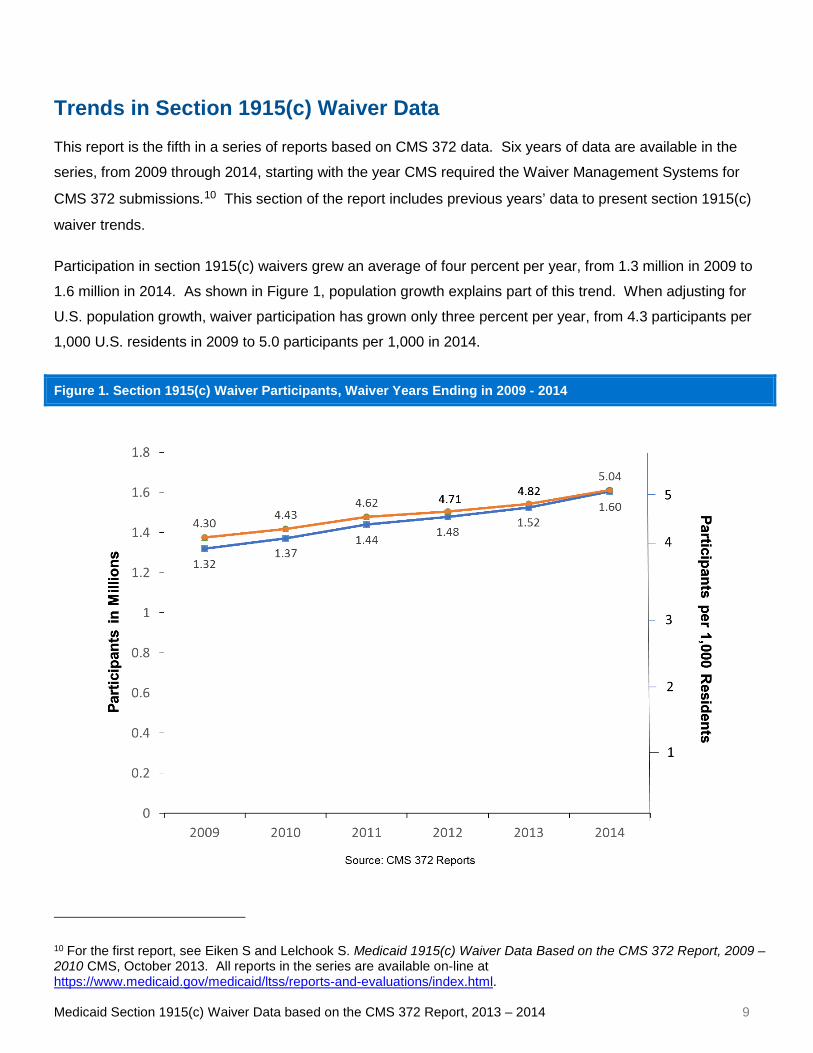
Trends in Section 1915(c) Waiver Data This report is the fifth in a series of reports based on CMS 372 data. Six years of data are available in the
series, from 2009 through 2014, starting with the year CMS required the Waiver Management Systems for
CMS 372 submissions.10 This section of the report includes previous years’ data to present section 1915(c)
waiver trends.
Participation in section 1915(c) waivers grew an average of four percent per year, from 1.3 million in 2009 to
1.6 million in 2014. As shown in Figure 1, population growth explains part of this trend. When adjusting for
U.S. population growth, waiver participation has grown only three percent per year, from 4.3 participants per
1,000 U.S. residents in 2009 to 5.0 participants per 1,000 in 2014.
Figure 1. Section 1915(c) Waiver Participants, Waiver Years Ending in 2009 - 2014
10 For the first report, see Eiken S and Lelchook S. Medicaid 1915(c) Waiver Data Based on the CMS 372 Report, 2009 – 2010 CMS, October 2013. All reports in the series are available on-line at https://www.medicaid.gov/medicaid/ltss/reports-and-evaluations/index.html.

Medicaid Section 1915(c) Waiver Data based on the CMS 372 Report, 2013 – 2014 10
Other data in the CMS 372 reports, when adjusting for the number of participants, have changed little from
2009 through 2014. For example, each year participants received services for an average of 10 months, as
Figure 2 illustrates. The average increased from 10.0 months in 2009 to 10.2 months in 2011, about one
percent per year, then decreased back to 10.0 months in 2014.
Figure 2. Average Months of Service per Section 1915(c) Waiver Participant, Waiver Years Ending in 2009 - 2014
Data labels are rounded to the tenth of a month, while points on the graph reflect the exact amount. Some years have data points at different levels but the same data label due to rounding.
Medicaid Section 1915(c) Waiver Data based on the CMS 372 Report, 2013 – 2014 11
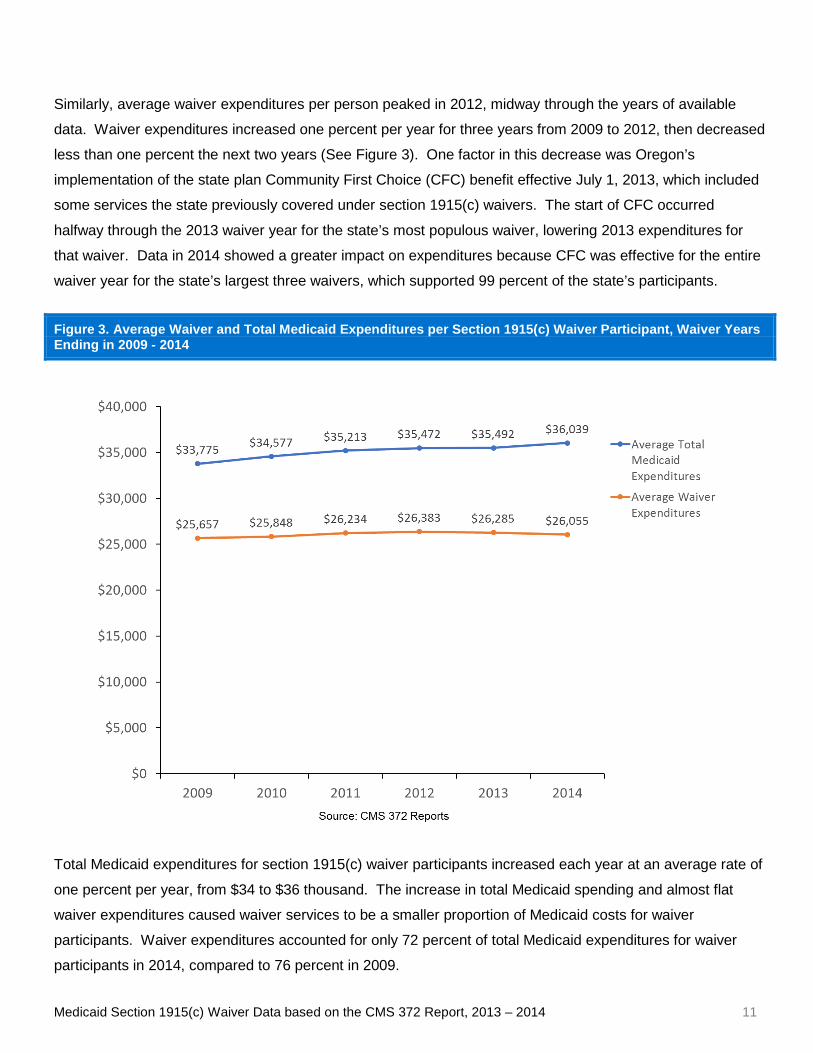
Similarly, average waiver expenditures per person peaked in 2012, midway through the years of available
data. Waiver expenditures increased one percent per year for three years from 2009 to 2012, then decreased
less than one percent the next two years (See Figure 3). One factor in this decrease was Oregon’s
implementation of the state plan Community First Choice (CFC) benefit effective July 1, 2013, which included
some services the state previously covered under section 1915(c) waivers. The start of CFC occurred
halfway through the 2013 waiver year for the state’s most populous waiver, lowering 2013 expenditures for
that waiver. Data in 2014 showed a greater impact on expenditures because CFC was effective for the entire
waiver year for the state’s largest three waivers, which supported 99 percent of the state’s participants.
Figure 3. Average Waiver and Total Medicaid Expenditures per Section 1915(c) Waiver Participant, Waiver Years Ending in 2009 - 2014
Total Medicaid expenditures for section 1915(c) waiver participants increased each year at an average rate of
one percent per year, from $34 to $36 thousand. The increase in total Medicaid spending and almost flat
waiver expenditures caused waiver services to be a smaller proportion of Medicaid costs for waiver
participants. Waiver expenditures accounted for only 72 percent of total Medicaid expenditures for waiver
participants in 2014, compared to 76 percent in 2009.
Medicaid Section 1915(c) Waiver Data based on the CMS 372 Report, 2013 – 2014 12
Section 1915(c) Waiver Data by Target Population Most of the remaining tables summarize 2014 data by target population groups. As in Table 3, each table
ranks states based on the proportion of the state population served in section 1915(c) waivers and shows
one-year trends in the number of participants, average months of service, and average waiver and total
Medicaid expenditures per participant. Tables 4 through 6 reflect three target population groups used in a
separate report on all long-term services and supports11 because several other program authorities primarily
serve these populations:
• Table 4: older adults and/or people with physical disabilities (abbreviated A/D for aging/disability)
• Table 5: people with developmental disabilities (DD)
• Table 6: adults with serious mental illness and/or children with serious emotional disturbance
(SMI/SED)
Tables 7 through 9 are arranged from populations with the most waiver participants to populations with the
fewest participants:
• Table 7: people with human immunodeficiency virus and/or acquired immunodeficiency syndrome
(HIV/AIDS)
• Table 8: medically fragile children (MF)
• Table 9: people with brain injuries (BI)
The following series of charts present compare data for the target populations with a focus on the most recent
year, 2014. Data were similar for 2013.
11 Eiken S, Sredl K, Burwell B, and Woodward R. Medicaid Expenditures for Long Term Services and Supports (LTSS) in 2015 CMS, April 14, 2017. Available on-line at https://www.medicaid.gov/medicaid/ltss/reports-and-evaluations/index.html.
Medicaid Section 1915(c) Waiver Data based on the CMS 372 Report, 2013 – 2014 13
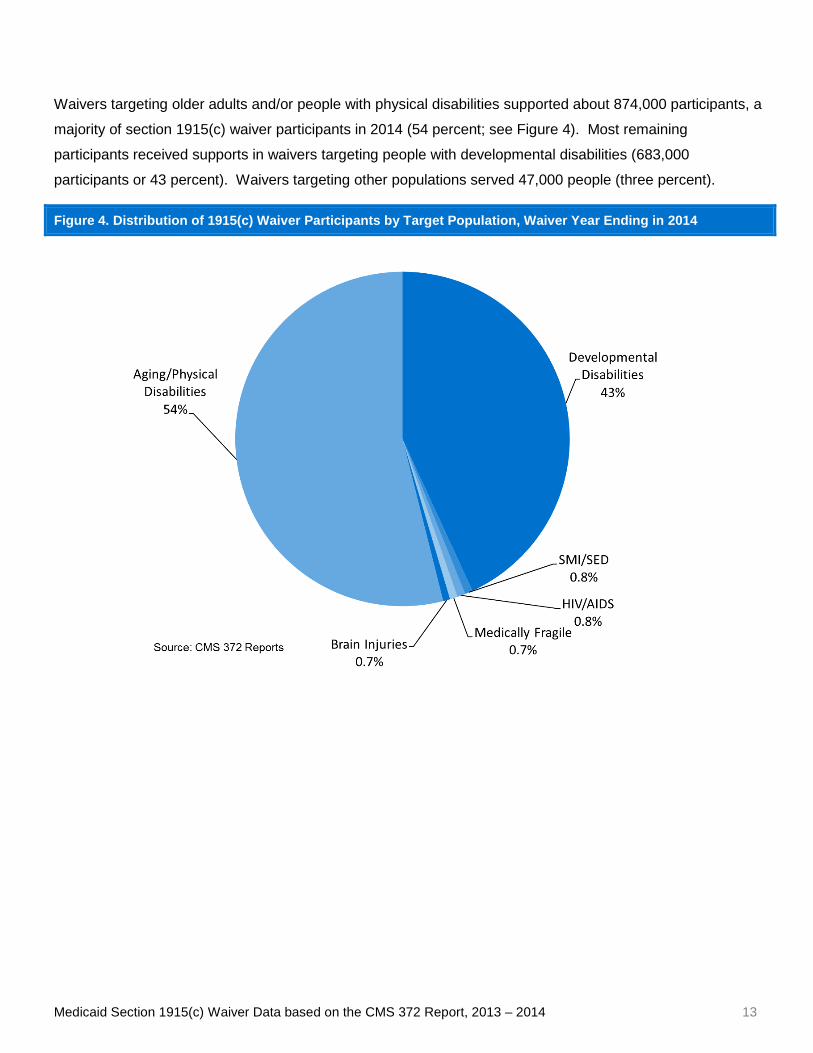
Waivers targeting older adults and/or people with physical disabilities supported about 874,000 participants, a
majority of section 1915(c) waiver participants in 2014 (54 percent; see Figure 4). Most remaining
participants received supports in waivers targeting people with developmental disabilities (683,000
participants or 43 percent). Waivers targeting other populations served 47,000 people (three percent).
Figure 4. Distribution of 1915(c) Waiver Participants by Target Population, Waiver Year Ending in 2014
Medicaid Section 1915(c) Waiver Data based on the CMS 372 Report, 2013 – 2014 14
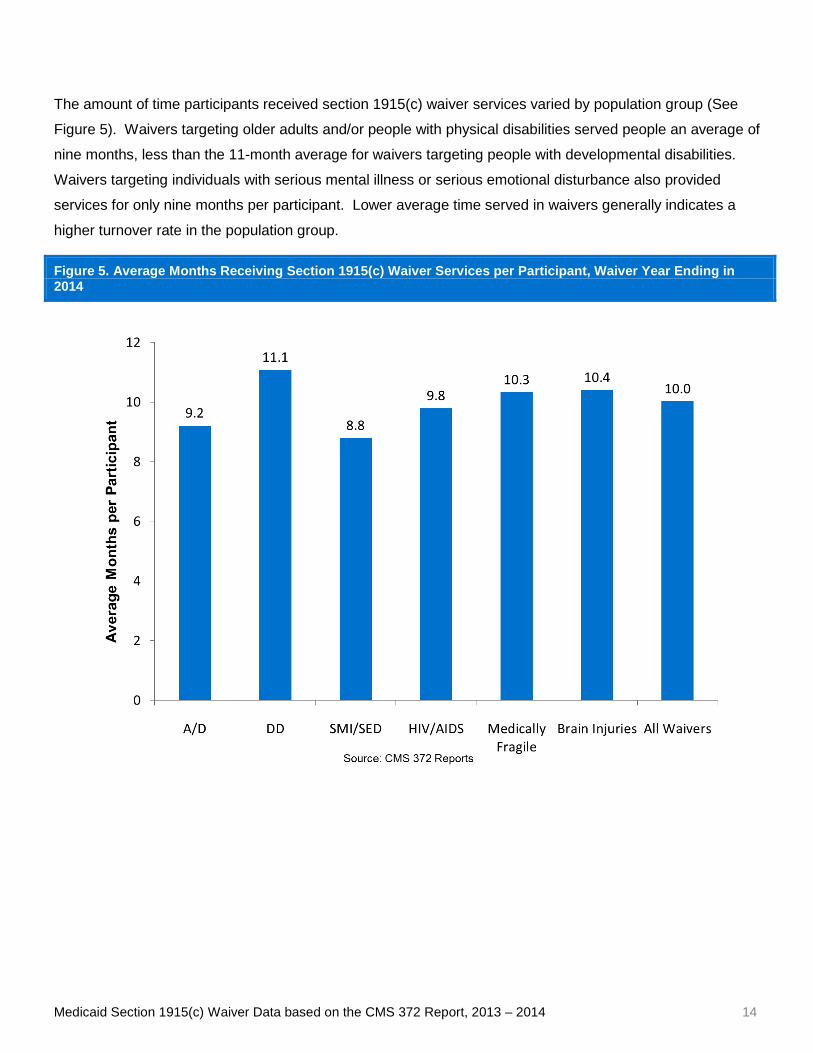
The amount of time participants received section 1915(c) waiver services varied by population group (See
Figure 5). Waivers targeting older adults and/or people with physical disabilities served people an average of
nine months, less than the 11-month average for waivers targeting people with developmental disabilities.
Waivers targeting individuals with serious mental illness or serious emotional disturbance also provided
services for only nine months per participant. Lower average time served in waivers generally indicates a
higher turnover rate in the population group.
Figure 5. Average Months Receiving Section 1915(c) Waiver Services per Participant, Waiver Year Ending in 2014
Medicaid Section 1915(c) Waiver Data based on the CMS 372 Report, 2013 – 2014 15
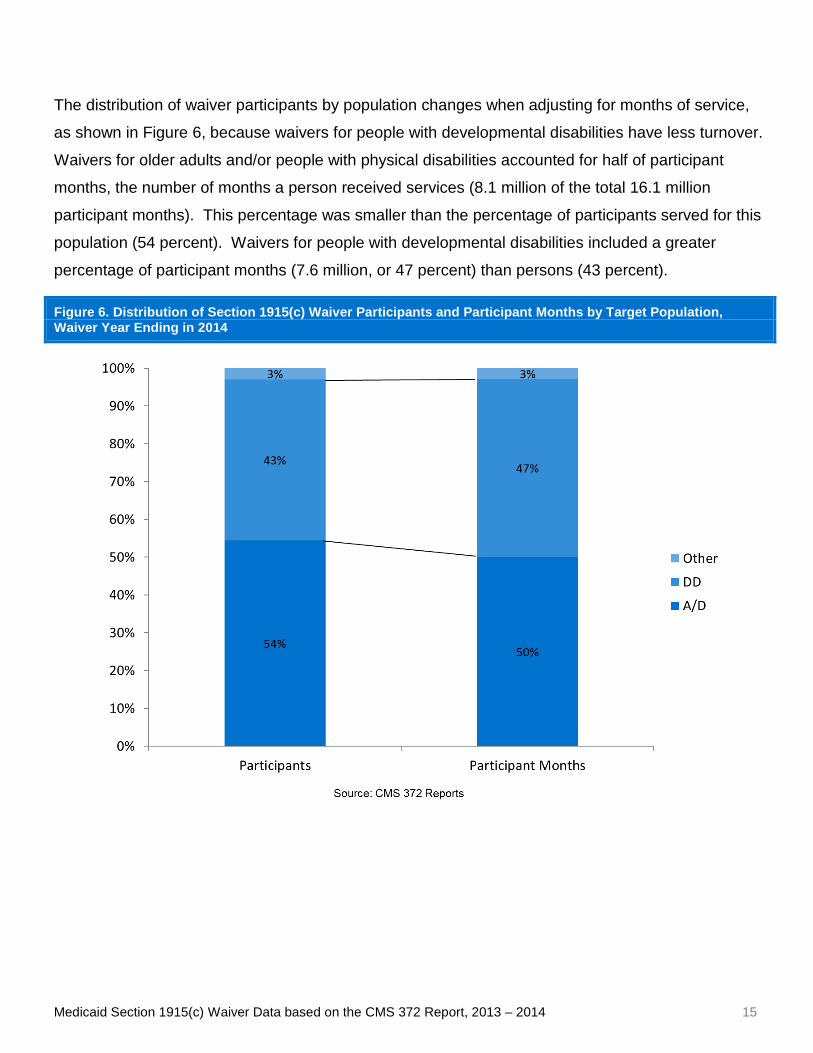
The distribution of waiver participants by population changes when adjusting for months of service,
as shown in Figure 6, because waivers for people with developmental disabilities have less turnover.
Waivers for older adults and/or people with physical disabilities accounted for half of participant
months, the number of months a person received services (8.1 million of the total 16.1 million
participant months). This percentage was smaller than the percentage of participants served for this
population (54 percent). Waivers for people with developmental disabilities included a greater
percentage of participant months (7.6 million, or 47 percent) than persons (43 percent).
Figure 6. Distribution of Section 1915(c) Waiver Participants and Participant Months by Target Population, Waiver Year Ending in 2014

Medicaid Section 1915(c) Waiver Data based on the CMS 372 Report, 2013 – 2014 16
The distribution of section 1915(c) waiver expenditures across target populations (See Figure 7) varied
significantly from the variation in participants, reflecting differences in the average cost of waiver services by
population (See Figure 8 on the following page). Waivers targeting people with developmental disabilities
accounted for $30 billion, 71 percent of expenditures, and had the highest average waiver service cost per
participant. Waivers targeting older adults and/or people with physical disabilities spent $11 billion (27
percent). Average expenditures per person for this group were about half the average for all waivers. The
proportion of total waiver expenditures for other populations also varied from the proportion of participants,
reflecting population differences in average cost per participant.
Figure 7. Distribution of Section 1915(c) Waiver Expenditures by Target Population, Waiver Year Ending in 2014
Medicaid Section 1915(c) Waiver Data based on the CMS 372 Report, 2013 – 2014 17
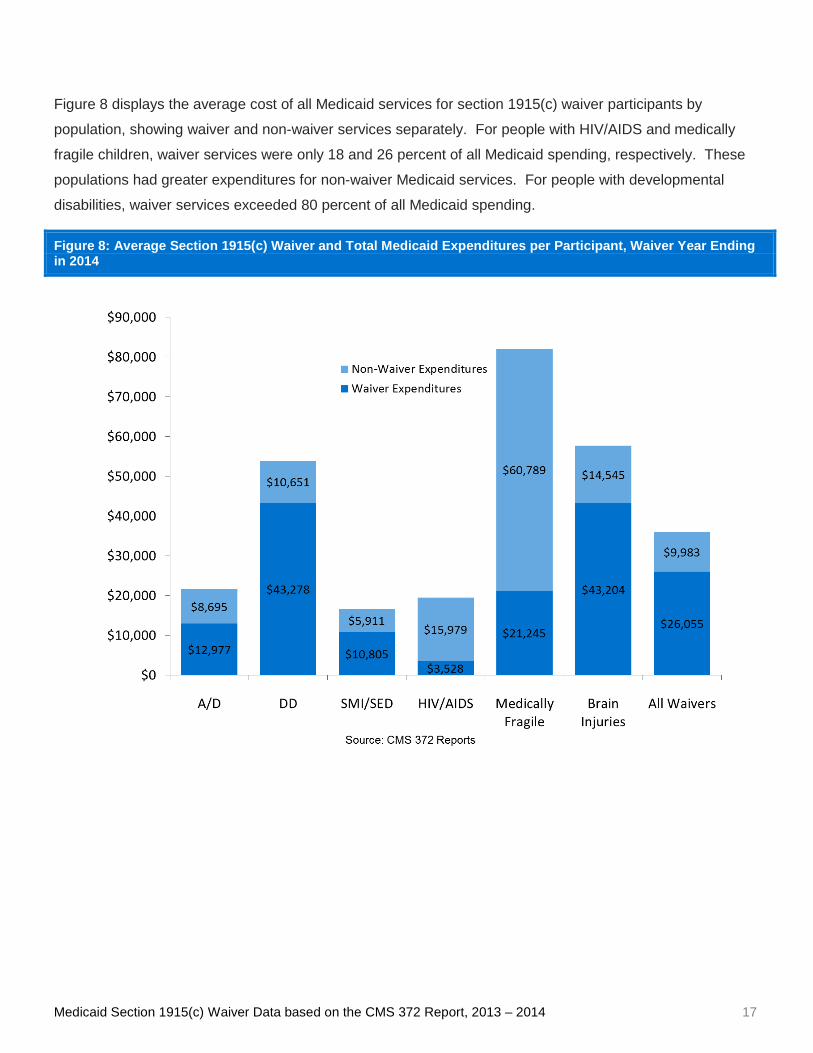
Figure 8 displays the average cost of all Medicaid services for section 1915(c) waiver participants by
population, showing waiver and non-waiver services separately. For people with HIV/AIDS and medically
fragile children, waiver services were only 18 and 26 percent of all Medicaid spending, respectively. These
populations had greater expenditures for non-waiver Medicaid services. For people with developmental
disabilities, waiver services exceeded 80 percent of all Medicaid spending.
Figure 8: Average Section 1915(c) Waiver and Total Medicaid Expenditures per Participant, Waiver Year Ending in 2014
Medicaid Section 1915(c) Waiver Data based on the CMS 372 Report, 2013 – 2014 18
State Variation in Section 1915(c) Waiver Data States vary significantly in the number of waiver participants and average cost per person. This variation is
not surprising given the flexibility section 1915(c) allows for states to define the number of participants, the
services offered, and the target population for services. This section describes state variation in total waiver
participants and overall average cost of waiver services based on the state total data in Table 3, followed by
state variation in target population data based on Tables 4 through 9. To facilitate state comparison, we
calculated the number of waiver participants per 1,000 individuals in the total state population using the U.S.
Census Bureau Current Population Estimates for state population data.12 Throughout this section, the term
“states” is used to refer to the District of Columbia as well as to the 47 states with section 1915(c) waivers in
2014. For several states, a 2014 CMS 372 was not available and data from previous years (2011 through
2013) were used. New York data are excluded from state comparisons for some populations because several
waivers did not have a CMS 372 report accepted by CMS in the years 2011 through 2014.
12 U.S. Census Bureau, Population Division “Table 1. Annual Estimates of the Resident Population for the United States, Regions, States, and Puerto Rico: April 1, 2010 to July 1, 2016 (NST-EST2016-01)” December 2016. Available on-line at https://www.census.gov/data/tables/2016/demo/popest/state-total.html.

Medicaid Section 1915(c) Waiver Data based on the CMS 372 Report, 2013 – 2014 19
As shown in Figure 9, a majority of states with section 1915(c) waivers (27 states, or 56 percent) served
between four and eight participants per 1,000 residents in 2014. Nine states (19 percent) served more than
eight participants per 1,000 residents. In order from most to least participants per 1,000 residents, these
states were Wisconsin, Minnesota, Oregon, Idaho, Kansas, Iowa, Illinois, Mississippi, and Ohio.
Figure 9: Waiver Participants per 1,000 State Population, Waiver Year Ending in 2014
* Data from previous years (2013, 2012, or 2011, the most recent available) were used for one or more waivers because the state did not submit a CMS 372 or CMS did not accept a submitted CMS 372. See Table 3 for more information. ** Florida 2014 data indicate 33% more participants than in 2013. Many individuals were counted in multiple waivers because the state terminated four waivers and transitioned participants to another waiver in March 2014. *** Data for some New York waivers are excluded because there was not a CMS 372 report accepted by CMS for 2011 through 2014.
Eleven states (23 percent) served fewer than three participants per 1,000 residents in 2014: Alabama, New
Jersey, North Carolina, Utah, New Mexico, Michigan, Texas, Hawaii, Nevada, Tennessee and Delaware (also
shown from most to least participants per 1,000 residents). New Mexico joined this group of states in 2014
because it terminated waivers for older adults and people with physical disabilities and people with HIV/AIDS
in 2013 and started offering these services in a section 1115 demonstration. New Mexico only offers section
1915(c) waivers to people with developmental disabilities and medically fragile children. Three states that
served a relatively low number of people in section 1915(c) waivers—Delaware, Hawaii, and Tennessee—
Medicaid Section 1915(c) Waiver Data based on the CMS 372 Report, 2013 – 2014 20
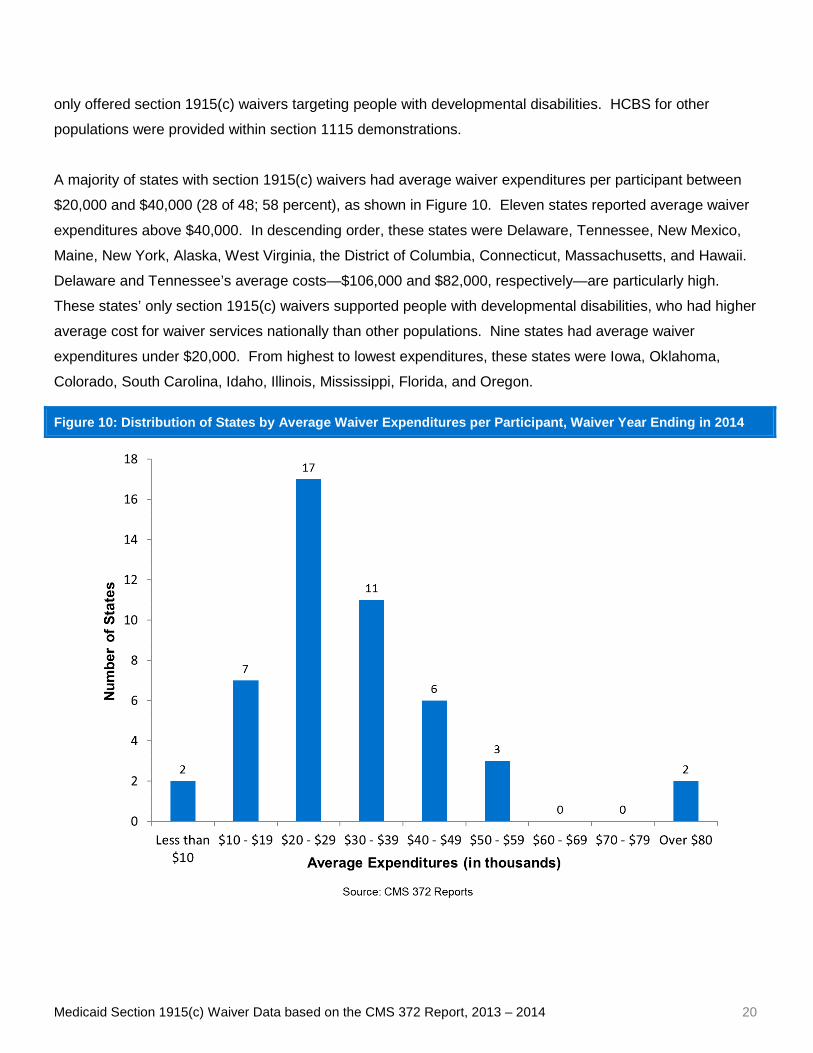
only offered section 1915(c) waivers targeting people with developmental disabilities. HCBS for other
populations were provided within section 1115 demonstrations.
A majority of states with section 1915(c) waivers had average waiver expenditures per participant between
$20,000 and $40,000 (28 of 48; 58 percent), as shown in Figure 10. Eleven states reported average waiver
expenditures above $40,000. In descending order, these states were Delaware, Tennessee, New Mexico,
Maine, New York, Alaska, West Virginia, the District of Columbia, Connecticut, Massachusetts, and Hawaii.
Delaware and Tennessee’s average costs—$106,000 and $82,000, respectively—are particularly high.
These states’ only section 1915(c) waivers supported people with developmental disabilities, who had higher
average cost for waiver services nationally than other populations. Nine states had average waiver
expenditures under $20,000. From highest to lowest expenditures, these states were Iowa, Oklahoma,
Colorado, South Carolina, Idaho, Illinois, Mississippi, Florida, and Oregon.
Figure 10: Distribution of States by Average Waiver Expenditures per Participant, Waiver Year Ending in 2014
Medicaid Section 1915(c) Waiver Data based on the CMS 372 Report, 2013 – 2014 21
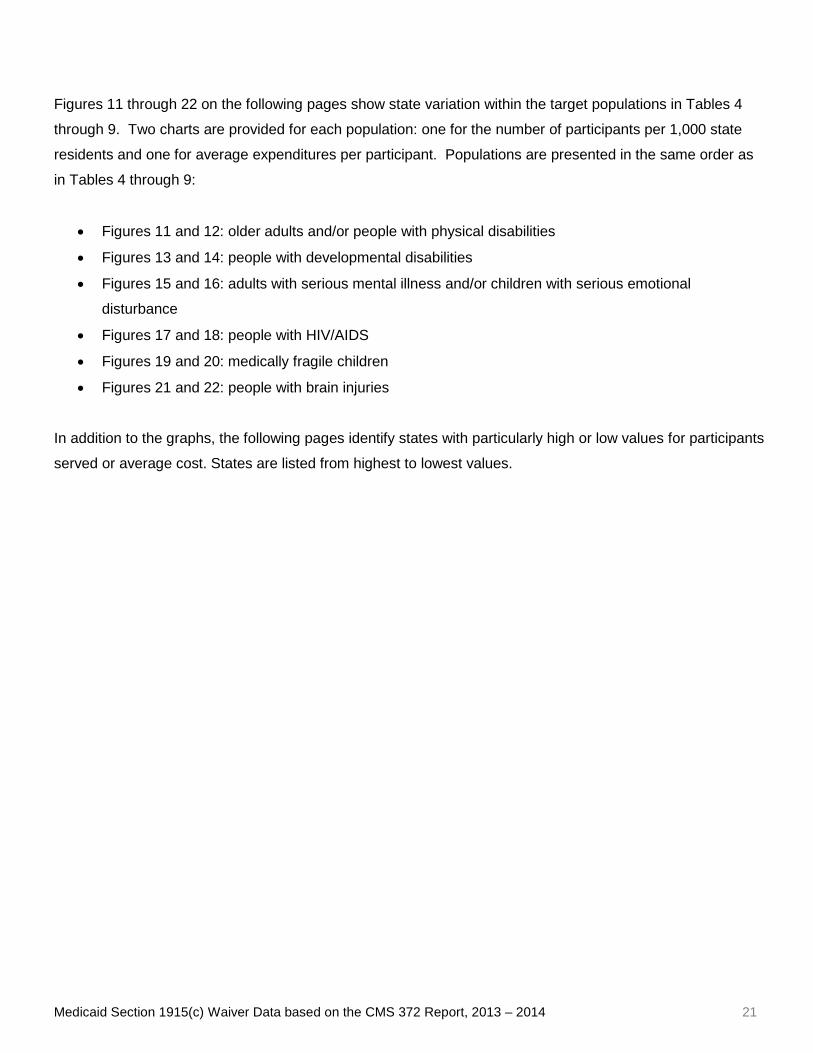
Figures 11 through 22 on the following pages show state variation within the target populations in Tables 4
through 9. Two charts are provided for each population: one for the number of participants per 1,000 state
residents and one for average expenditures per participant. Populations are presented in the same order as
in Tables 4 through 9:
• Figures 11 and 12: older adults and/or people with physical disabilities
• Figures 13 and 14: people with developmental disabilities
• Figures 15 and 16: adults with serious mental illness and/or children with serious emotional
disturbance
• Figures 17 and 18: people with HIV/AIDS
• Figures 19 and 20: medically fragile children
• Figures 21 and 22: people with brain injuries
In addition to the graphs, the following pages identify states with particularly high or low values for participants
served or average cost. States are listed from highest to lowest values.
Medicaid Section 1915(c) Waiver Data based on the CMS 372 Report, 2013 – 2014 22
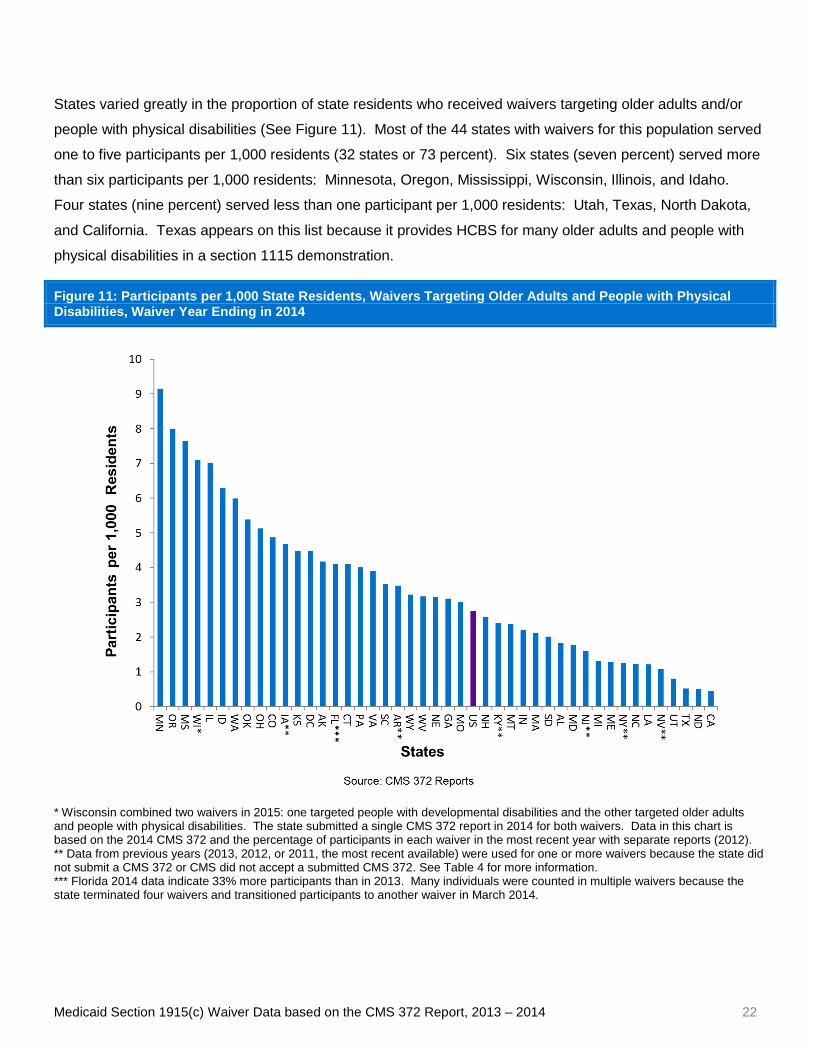
States varied greatly in the proportion of state residents who received waivers targeting older adults and/or
people with physical disabilities (See Figure 11). Most of the 44 states with waivers for this population served
one to five participants per 1,000 residents (32 states or 73 percent). Six states (seven percent) served more
than six participants per 1,000 residents: Minnesota, Oregon, Mississippi, Wisconsin, Illinois, and Idaho.
Four states (nine percent) served less than one participant per 1,000 residents: Utah, Texas, North Dakota,
and California. Texas appears on this list because it provides HCBS for many older adults and people with
physical disabilities in a section 1115 demonstration.
Figure 11: Participants per 1,000 State Residents, Waivers Targeting Older Adults and People with Physical Disabilities, Waiver Year Ending in 2014
* Wisconsin combined two waivers in 2015: one targeted people with developmental disabilities and the other targeted older adults and people with physical disabilities. The state submitted a single CMS 372 report in 2014 for both waivers. Data in this chart is based on the 2014 CMS 372 and the percentage of participants in each waiver in the most recent year with separate reports (2012). ** Data from previous years (2013, 2012, or 2011, the most recent available) were used for one or more waivers because the state did not submit a CMS 372 or CMS did not accept a submitted CMS 372. See Table 4 for more information. *** Florida 2014 data indicate 33% more participants than in 2013. Many individuals were counted in multiple waivers because the state terminated four waivers and transitioned participants to another waiver in March 2014.
Medicaid Section 1915(c) Waiver Data based on the CMS 372 Report, 2013 – 2014 23
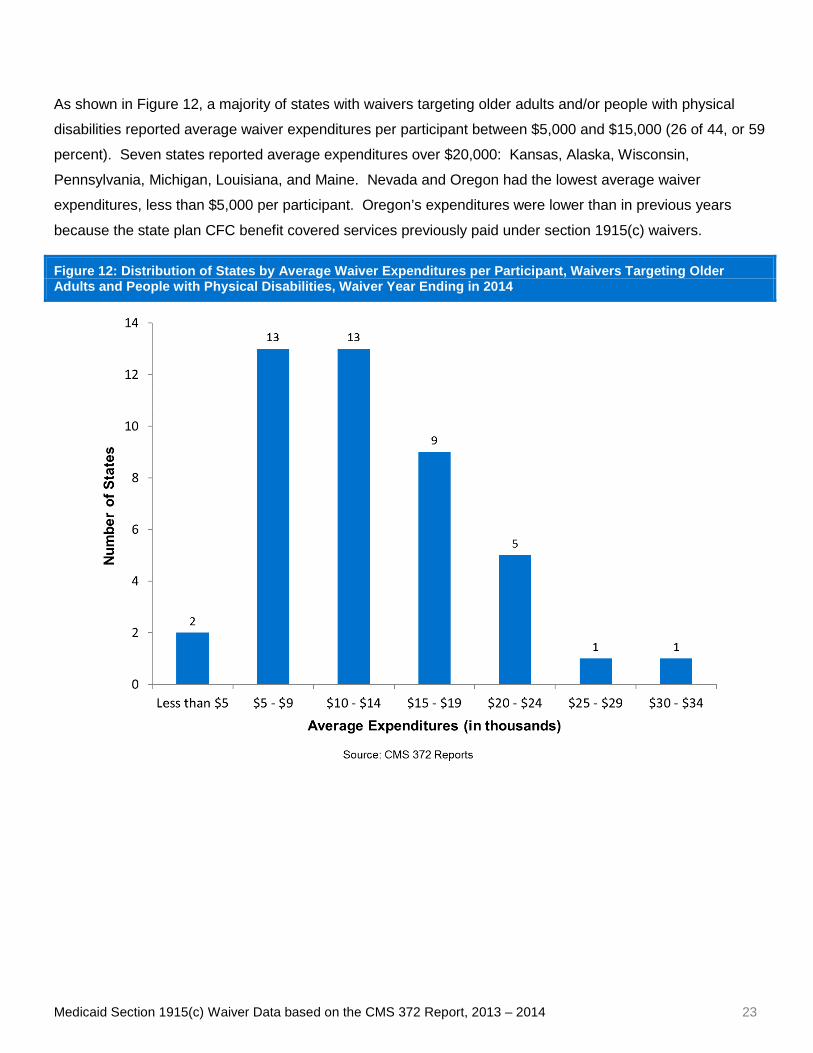
As shown in Figure 12, a majority of states with waivers targeting older adults and/or people with physical
disabilities reported average waiver expenditures per participant between $5,000 and $15,000 (26 of 44, or 59
percent). Seven states reported average expenditures over $20,000: Kansas, Alaska, Wisconsin,
Pennsylvania, Michigan, Louisiana, and Maine. Nevada and Oregon had the lowest average waiver
expenditures, less than $5,000 per participant. Oregon’s expenditures were lower than in previous years
because the state plan CFC benefit covered services previously paid under section 1915(c) waivers.
Figure 12: Distribution of States by Average Waiver Expenditures per Participant, Waivers Targeting Older Adults and People with Physical Disabilities, Waiver Year Ending in 2014
Medicaid Section 1915(c) Waiver Data based on the CMS 372 Report, 2013 – 2014 24
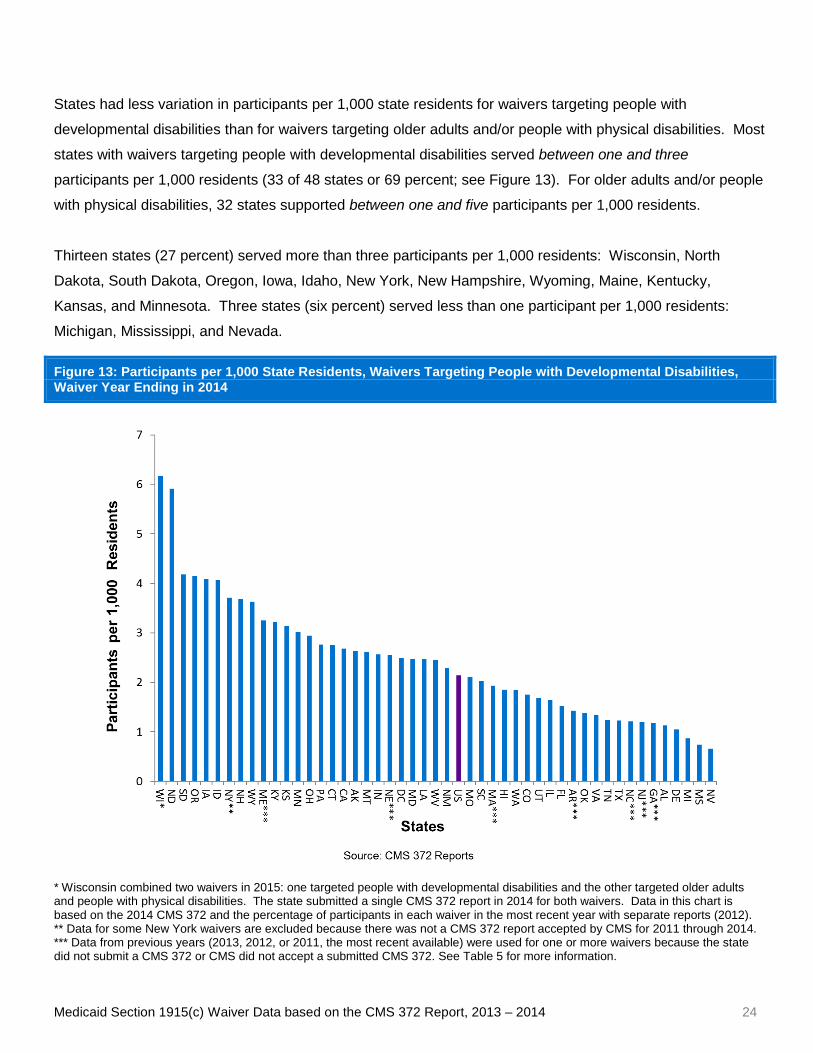
States had less variation in participants per 1,000 state residents for waivers targeting people with
developmental disabilities than for waivers targeting older adults and/or people with physical disabilities. Most
states with waivers targeting people with developmental disabilities served between one and three
participants per 1,000 residents (33 of 48 states or 69 percent; see Figure 13). For older adults and/or people
with physical disabilities, 32 states supported between one and five participants per 1,000 residents.
Thirteen states (27 percent) served more than three participants per 1,000 residents: Wisconsin, North
Dakota, South Dakota, Oregon, Iowa, Idaho, New York, New Hampshire, Wyoming, Maine, Kentucky,
Kansas, and Minnesota. Three states (six percent) served less than one participant per 1,000 residents:
Michigan, Mississippi, and Nevada.
Figure 13: Participants per 1,000 State Residents, Waivers Targeting People with Developmental Disabilities, Waiver Year Ending in 2014
* Wisconsin combined two waivers in 2015: one targeted people with developmental disabilities and the other targeted older adults and people with physical disabilities. The state submitted a single CMS 372 report in 2014 for both waivers. Data in this chart is based on the 2014 CMS 372 and the percentage of participants in each waiver in the most recent year with separate reports (2012). ** Data for some New York waivers are excluded because there was not a CMS 372 report accepted by CMS for 2011 through 2014. *** Data from previous years (2013, 2012, or 2011, the most recent available) were used for one or more waivers because the state did not submit a CMS 372 or CMS did not accept a submitted CMS 372. See Table 5 for more information.
Medicaid Section 1915(c) Waiver Data based on the CMS 372 Report, 2013 – 2014 25
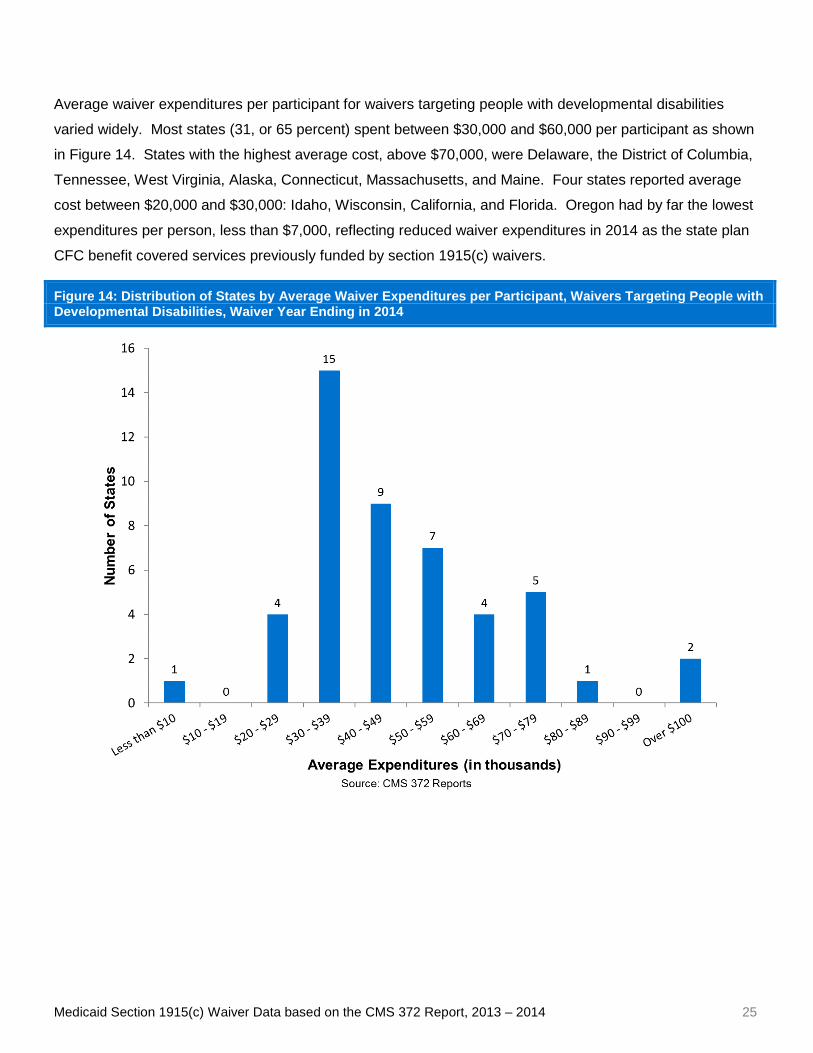
Average waiver expenditures per participant for waivers targeting people with developmental disabilities
varied widely. Most states (31, or 65 percent) spent between $30,000 and $60,000 per participant as shown
in Figure 14. States with the highest average cost, above $70,000, were Delaware, the District of Columbia,
Tennessee, West Virginia, Alaska, Connecticut, Massachusetts, and Maine. Four states reported average
cost between $20,000 and $30,000: Idaho, Wisconsin, California, and Florida. Oregon had by far the lowest
expenditures per person, less than $7,000, reflecting reduced waiver expenditures in 2014 as the state plan
CFC benefit covered services previously funded by section 1915(c) waivers.
Figure 14: Distribution of States by Average Waiver Expenditures per Participant, Waivers Targeting People with Developmental Disabilities, Waiver Year Ending in 2014

Medicaid Section 1915(c) Waiver Data based on the CMS 372 Report, 2013 – 2014 26
As Figure 15 indicates, eight of the 10 states (80 percent) with data for waivers targeting people with serious
mental illness or serious emotional disturbance served fewer than 0.4 participants per 1,000 state residents.
The exceptions, Kansas and Colorado, accounted for 66 percent of all participants for these waivers among
states with CMS 372 data. Missing data from New York affected national data for this population. A separate
report indicated New York accounted for 63 percent of spending for waivers for people with serious mental
illness or serious emotional disturbance in federal fiscal year 2014.13
Figure 15: Participants per 1,000 State Residents, Waivers Targeting People with Serious Mental Illness or Serious Emotional Disturbance, Waiver Year Ending in 2014
* Data for two New York waivers are excluded because there was not a CMS 372 report accepted by CMS for 2011 through 2014. ** CMS 372 reports for the Massachusetts waivers for this population indicated no participants were served in 2014.
13 Eiken S, Sredl K, Woodward R, and Saucier P. Medicaid Expenditures for Section 1915(c) Waivers in FY 2015 CMS, July 10, 2017. Available on-line at https://www.medicaid.gov/medicaid/ltss/reports-and-evaluations/index.html.
Medicaid Section 1915(c) Waiver Data based on the CMS 372 Report, 2013 – 2014 27
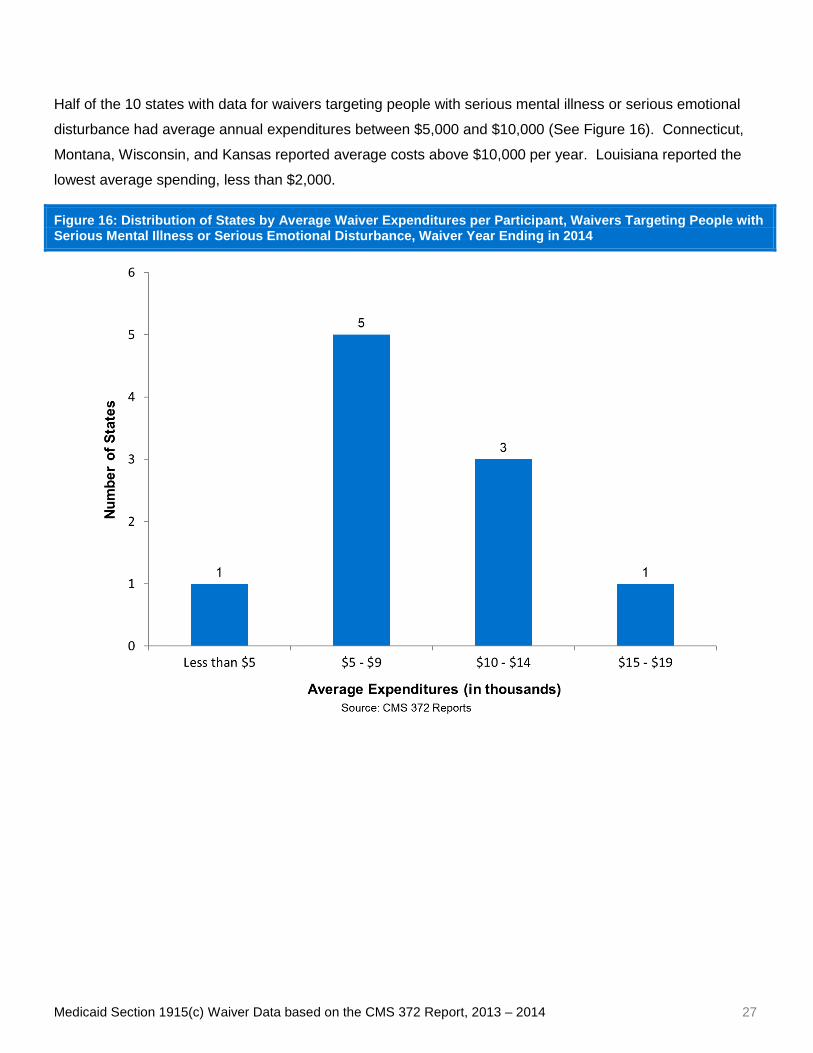
Half of the 10 states with data for waivers targeting people with serious mental illness or serious emotional
disturbance had average annual expenditures between $5,000 and $10,000 (See Figure 16). Connecticut,
Montana, Wisconsin, and Kansas reported average costs above $10,000 per year. Louisiana reported the
lowest average spending, less than $2,000.
Figure 16: Distribution of States by Average Waiver Expenditures per Participant, Waivers Targeting People with Serious Mental Illness or Serious Emotional Disturbance, Waiver Year Ending in 2014

Medicaid Section 1915(c) Waiver Data based on the CMS 372 Report, 2013 – 2014 28
Seven of the 10 states with waivers targeting people with HIV/AIDS (70 percent) served fewer than 0.1
participants per 1,000 state residents, as shown in Figure 17 below. The exceptions—Florida, South
Carolina, and Illinois—comprised 79 percent of all HIV/AIDS waiver participants. Florida alone accounted for
61 percent of participants.
Figure 17: Participants per 1,000 State Residents, Waivers Targeting People with HIV/AIDS, Waiver Year Ending in 2014
* Data from the most recent year available (2013 for Iowa and Colorado; 2011 for New Jersey) were used for one or more waivers because the state did not submit a CMS 372 or CMS did not accept a submitted CMS 372. See Table 7 for more information.
Medicaid Section 1915(c) Waiver Data based on the CMS 372 Report, 2013 – 2014 29
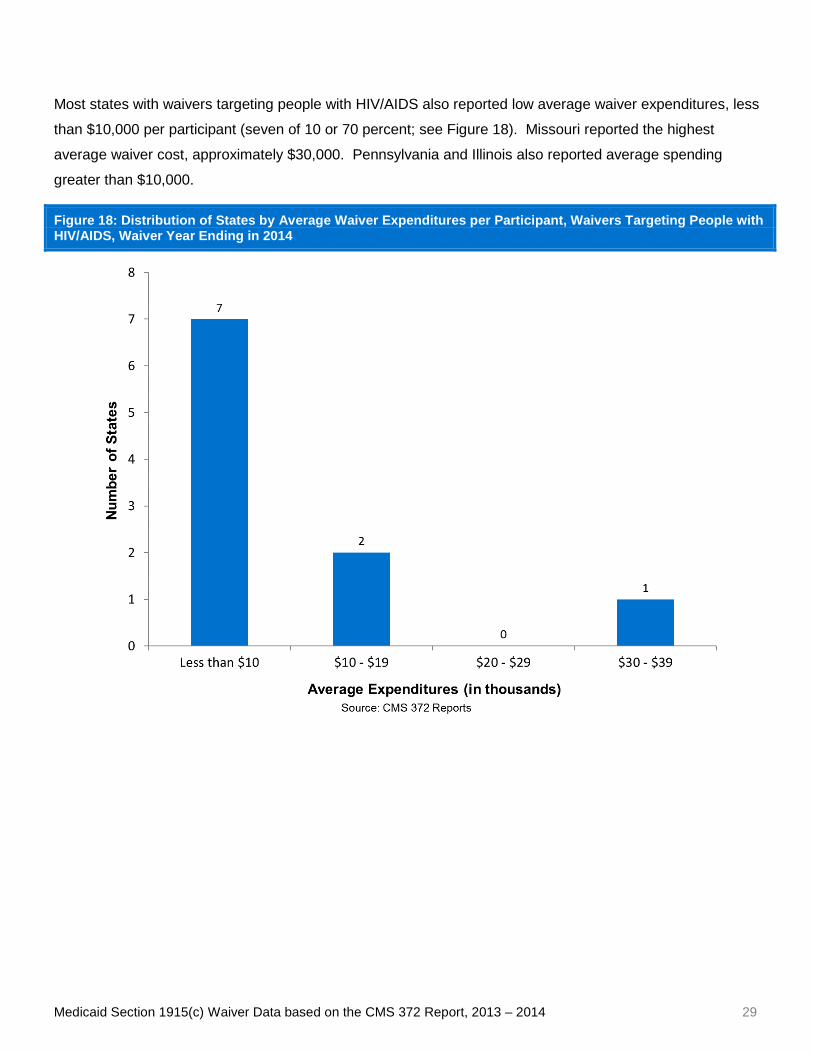
Most states with waivers targeting people with HIV/AIDS also reported low average waiver expenditures, less
than $10,000 per participant (seven of 10 or 70 percent; see Figure 18). Missouri reported the highest
average waiver cost, approximately $30,000. Pennsylvania and Illinois also reported average spending
greater than $10,000.
Figure 18: Distribution of States by Average Waiver Expenditures per Participant, Waivers Targeting People with HIV/AIDS, Waiver Year Ending in 2014
Medicaid Section 1915(c) Waiver Data based on the CMS 372 Report, 2013 – 2014 30
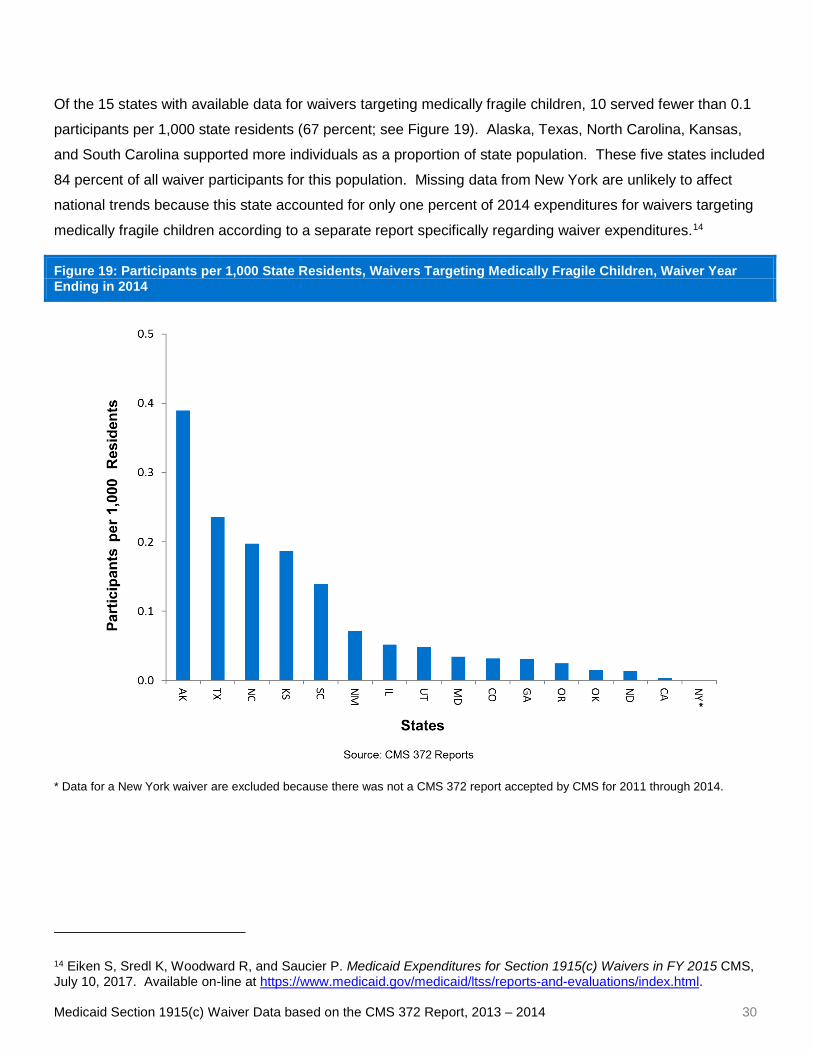
Of the 15 states with available data for waivers targeting medically fragile children, 10 served fewer than 0.1
participants per 1,000 state residents (67 percent; see Figure 19). Alaska, Texas, North Carolina, Kansas,
and South Carolina supported more individuals as a proportion of state population. These five states included
84 percent of all waiver participants for this population. Missing data from New York are unlikely to affect
national trends because this state accounted for only one percent of 2014 expenditures for waivers targeting
medically fragile children according to a separate report specifically regarding waiver expenditures.14
Figure 19: Participants per 1,000 State Residents, Waivers Targeting Medically Fragile Children, Waiver Year Ending in 2014
* Data for a New York waiver are excluded because there was not a CMS 372 report accepted by CMS for 2011 through 2014.
14 Eiken S, Sredl K, Woodward R, and Saucier P. Medicaid Expenditures for Section 1915(c) Waivers in FY 2015 CMS, July 10, 2017. Available on-line at https://www.medicaid.gov/medicaid/ltss/reports-and-evaluations/index.html.

Medicaid Section 1915(c) Waiver Data based on the CMS 372 Report, 2013 – 2014 31
Nine of 15 states with waivers targeting medically fragile children (60 percent) reported average wavier
expenditures per participant of less than $20,000, as shown in Figure 20. The six states with greater average
expenditures were Kansas, Oklahoma, North Carolina, Alaska, Georgia, and Utah.
Figure 20: Distribution of States by Average Waiver Expenditures per Participant, Waivers Targeting Medically Fragile Children, Waiver Year Ending in 2014

Medicaid Section 1915(c) Waiver Data based on the CMS 372 Report, 2013 – 2014 32
A majority of states with waivers targeting people with brain injuries (11 of 18 or 61 percent) supported fewer
than 0.1 participants per 1,000 state residents, as indicated on Figure 21. The five states with the highest
proportion of state residents—Iowa, Wyoming, Illinois, Minnesota, and Kansas—accounted for 70 percent of
all waiver participants from states with CMS 372 data for this population. Missing data from New York may
affect national data for this population. New York spent 27 percent of all expenditures nationwide for waivers
targeting people with brain injuries in federal fiscal year 2014.15
Figure 21: Participants per 1,000 State Residents, Waivers Targeting People with Brain Injuries, Waiver Year Ending in 2014
* Data from the most recent year available (2013 for Kentucky, 2012 for Wisconsin, 2011 for New Jersey) were used for one or more waivers because the state did not submit a CMS 372 or CMS did not accept a submitted CMS 372. See Table 9 for more information. ** Data for a New York waiver are excluded because there was not a CMS 372 report accepted by CMS for 2011 through 2014.
15 Eiken S, Sredl K, Woodward R, and Saucier P. Medicaid Expenditures for Section 1915(c) Waivers in FY 2015 CMS, July 10, 2017. Available on-line at https://www.medicaid.gov/medicaid/ltss/reports-and-evaluations/index.html.
Medicaid Section 1915(c) Waiver Data based on the CMS 372 Report, 2013 – 2014 33
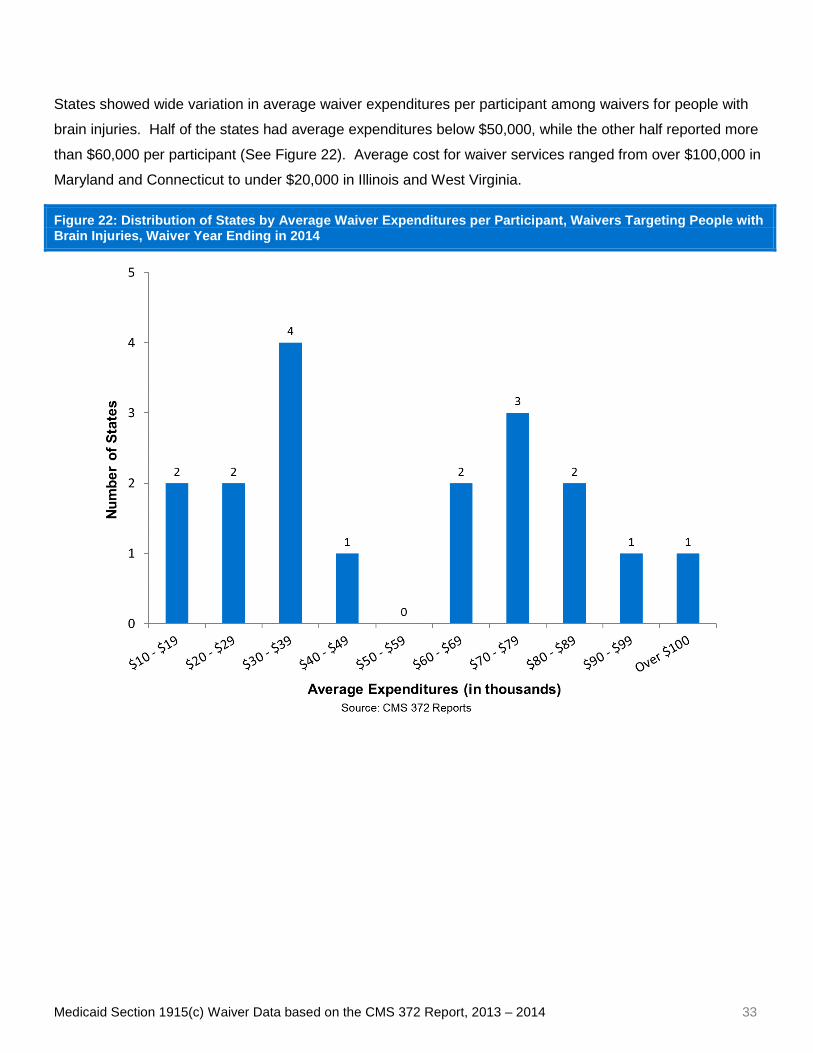
States showed wide variation in average waiver expenditures per participant among waivers for people with
brain injuries. Half of the states had average expenditures below $50,000, while the other half reported more
than $60,000 per participant (See Figure 22). Average cost for waiver services ranged from over $100,000 in
Maryland and Connecticut to under $20,000 in Illinois and West Virginia.
Figure 22: Distribution of States by Average Waiver Expenditures per Participant, Waivers Targeting People with Brain Injuries, Waiver Year Ending in 2014

Medicaid Section 1915(c) Waiver Data based on the CMS 372 Report, 2013 – 2014 34
Comparison to the Section 1915(c) Waiver Expenditures Report We compared 2014 expenditures reported on the CMS 372 to a separate report focused on section 1915(c)
waiver expenditures that used different data sources, hereafter referred to as the waiver expenditures
report.16 The latter report used quarterly state submissions to claim Medicaid federal financial participation
using the CMS-64 form, supplemented by data reported by states that have managed care programs with
long-term services and supports expenditures that are not completely described on the CMS-64.
Table 10 compares data between the two sources for each waiver and state. Nationally, the two sources
differed by only one percent, with more spending reported on the CMS 372 ($41.8 billion) than in the waiver
expenditures report ($41.4 billion). Minor differences between the sources are expected because data
requirements vary. First, the CMS 372 requires reporting based on date of service (the date a participant
received services), while the waiver expenditures report is based on the date of payment (the date a state
paid for services). Second, the CMS 372 defines a year based on the waiver’s effective date, while the waiver
expenditures report shows data by federal fiscal year.
While national totals were similar, significant differences between the two sources occur for a minority of
states and for many individual waivers. Cumulative state data were more likely than individual waiver data to
be consistent across the two sources. One reason is that occasionally states have reported CMS-64
expenditures under the wrong waiver, which would create inconsistencies for the particular waivers but not for
statewide totals.
Most states had similar section 1915(c) waiver expenditures reported in both sources. The two sources were
within five percent of each other in 32 states, 67 percent of the 48 states with section 1915(c) waivers in 2014.
An additional nine states (19 percent) had a five-to-ten percent difference between the two sources. Seven
states had more than a 10 percent variance.
The two sources had greater variation for individual waivers. CMS 372 expenditures were within five percent
of waiver expenditures report data for fewer than half of waivers for which a CMS 372 was required in 2014
(135 of 295 waivers or 46 percent). An additional 47 waivers (16 percent) had a five-to-ten percent difference.
The two sources disagreed by 10 percent or more for 113 waivers (38 percent), including 50 waivers (17
percent) with a discrepancy of 50 percent or more.
16 Eiken S, Sredl K, Woodward R, and Saucier P. Medicaid Expenditures for Section 1915(c) Waivers in FY 2015 CMS, July 10, 2017. Available on-line at https://www.medicaid.gov/medicaid/ltss/reports-and-evaluations/index.html.

Medicaid Section 1915(c) Waiver Data based on the CMS 372 Report, 2013 – 2014 35
Conclusion The CMS 372 report includes useful data for policymakers regarding the number of section 1915(c) waiver
participants, the amount of time a person received services, waiver expenditures per participant, and total
Medicaid expenditures per participant. This report presents some of these data, including the following
national totals for 2014:
• The number of waiver participants: 1.6 million
• The average number of months participants received services: 10 months
• Average annual expenditures per participant: $26,055
• Average total Medicaid expenditures per participant: $36,039
The number of participants increased four percent from 2013, continuing a trend of an increased number of
people served in section 1915(c) waivers. Since the first year of CMS 372 data in this series of reports
(2009), the number of participants has increased four percent per year. When adjusting for growth in the U.S.
population, waiver participation has risen three percent per year. Other national trends changed by one
percent per year or less since 2009.
In preparing this report, two issues emerged that affect the data’s potential usefulness. First, the data are not
complete. For example, CMS 372 reports for 33 waivers had either not been submitted for 2014 or were not
accepted by CMS as of July 14, 2017, more than a full year after the latest possible deadline for submitting a
CMS 372 report that year (June 30, 2016).17 This report used the most recent year available from 2011
through 2013 for waivers with missing data. For six New York waivers, no data were used for this report
because no report had been submitted and accepted for any year from 2011 through 2014. Since missing
data involved a large state, it could affect national totals, especially for smaller population groups.
Second, there are some discrepancies between the CMS 372 report and the annual waiver expenditures
report that raise data accuracy concerns. Without further research, it is uncertain which report is more
accurate. Further work could be done to ensure CMS is receiving accurate and timely information about
section 1915(c) waiver participation and Medicaid expenditures for waiver participants.
17 CMS 372 reports are due 18 months after the end of the waiver year. The latest possible end of a waiver year for a 2014 report was the last day of the year, December 31, 2014.

Medicaid Section 1915(c) Waiver Data based on the CMS 372 Report, 2013 – 2014 36
Appendix A: Data Sources, Methods and Limitations
Sources
Most data are from the CMS 372(S) report, typically called the CMS 372, which states submit to the Centers
for Medicare & Medicaid Services (CMS) to document that the section 1915(c) waiver meets federal cost
effectiveness requirements. The U.S. Census Bureau Current Population Estimates were used for state
population data to calculate waiver participants per 1,000 state residents.18 Waiver target population data
were obtained from an annual report on Medicaid section 1915(c) waiver expenditures, hereafter called the
waiver expenditures report.19 One data table (Table 10) compares data from the CMS 372 to waiver
expenditures report data.
Methods
Truven Health extracted CMS 372 data for all section 1915(c) waivers from the CMS Waiver Management
System (WMS). Data are presented as they appear in the WMS except obvious data entry errors, typically an
expired waiver number or entry of the average days of service instead of total days, were fixed when the error
was unambiguous.
Limitations
CMS reviews the CMS 372 report for consistency with the state’s approved waiver, but the report is not
subject to audit like the CMS-64 report. Also, CMS 372 data are not as timely as the CMS-64 because the
CMS 372 is based on date of service. States may pay a provider several months after a service is provided
and need additional time to aggregate and report data. As a result, CMS 372 data are not as timely as the
CMS-64, which is based on date of payment.
There are two limitations to aggregating the CMS 372 for multiple waivers. First, states must submit the CMS
372 based on the anniversary of the approved waiver, so the time period used for a year of data varies across
waivers. Second, participants in more than one waiver during a year are double-counted. Many people can
be double-counted if a state starts a new waiver and moves participants from an old waiver to the new one.
18 U.S. Census Bureau, Population Division “Table 1. Annual Estimates of the Resident Population for the United States, Regions, States, and Puerto Rico: April 1, 2010 to July 1, 2016 (NST-EST2016-01)” December 2016. Available on-line at https://www.census.gov/data/tables/2016/demo/popest/state-total.html. 19 Eiken S, Sredl K, Woodward R, and Saucier P. Medicaid Expenditures for Section 1915(c) Waivers in FY 2015 CMS, July 10, 2017. Available on-line at https://www.medicaid.gov/medicaid/ltss/reports-and-evaluations/index.html.
Medicaid Section 1915(c) Waiver Data based on the CMS 372 Report, 2013 – 2014 37
Appendix B: Data Tables
List of Data Tables
Table 1: CMS 372 Data by State and Waiver, 2014
Table 2: CMS 372 Data by State and Waiver, 2013
Table 3: State Totals: Waiver Participants, Participant Months, and Expenditures,
2014
Table 4: State Totals: Data for Waivers Targeting Older Adults and/or People with Physical Disabilities,
2014
Table 5: State Totals: Data for Waivers Targeting People with Developmental Disabilities, 2014
Table 6: State Totals: Data for Waivers Targeting Adults with Serious Mental
Illness or Children with Serious Emotional Disturbance, 2014
Table 7: State Totals: Data for Waivers Targeting People with HIV/AIDS, 2014
Table 8: State Totals: Data for Waivers Targeting Medically Fragile Children, 2014
Table 9: State Totals: Data for Waivers Targeting People with Brain Injuries, 2014
Table 10: Comparison of 2014 Expenditures Data: CMS 372 and Waiver
Expenditures Report
Abbreviations in Data Tables
ASD – autism spectrum disorder
DD – developmental disabilities
HIV/AIDS – human immunodeficiency virus or acquired immunodeficiency syndrome
ID – intellectual disability
PD – physical disabilities
SED – serious emotional disturbance

CMS 372 Data by State and Waiver, 2014 Table 1
Medicaid Section 1915(c) Waiver Data based on the CMS 372 Report, 2013 – 2014 38
State Waiver Number Target Population Total
Participants Total Days of
Service
Total Participant
Months
Average Participant
Months
Total Waiver Expenditures
Average Waiver Expenditures
Average Non-waiver Medicaid
Expenditures
Average Total Medicaid Expenditures for Waiver
Participants
Alabama 0001 Intellectual Disability 5,022 1,782,841 58,614 11.7 $313,168,523 $62,359 $4,787 $67,146 Alabama 0068 Aging/Physical Disabilities 8,323 2,464,922 81,039 9.7 $59,711,061 $7,174 $6,154 $13,328 Alabama 0241 Physical Disabilities 473 158,577 5,213 11.0 $5,043,237 $10,662 $4,868 $15,530 Alabama 0391 ID-Child 468 162,108 5,330 11.4 $5,539,554 $11,837 $3,932 $15,769 Alabama 0407 Physical Disabilities 24 7,679 252 10.5 $1,576,282 $65,678 $10,238 $75,916 Alabama 0878 Aging/Physical Disabilities 23 6,338 208 9.1 $549,961 $23,911 $7,943 $31,854 Alabama 40382 HIV/AIDS 92 29,100 957 10.4 $508,294 $5,525 $12,225 $17,750 Alabama Total All 14,425 4,611,565 151,613 10.5 $386,096,912 $26,766 $5,612 $32,378 Alaska1 0260 DD-incl. ID & ASD 1,940 675,120 22,196 11.4 $147,681,413 $76,124 $10,983 $87,107 Alaska 0261 Aging 2,907 909,381 29,897 10.3 $77,949,211 $26,814 $25,799 $52,613 Alaska 0262 Physical Disabilities 169 46,388 1,525 9.0 $8,617,373 $50,990 $38,051 $89,041 Alaska 0263 Medically Fragile 287 98,631 3,243 11.3 $11,602,293 $40,426 $46,047 $86,473 Alaska Total All 5,303 1,729,520 56,861 10.7 $245,850,290 $46,361 $21,865 $68,225 Arkansas2 0188 DD-incl. ID & ASD 4,152 1,472,146 48,399 11.7 $178,617,018 $43,020 $16,146 $59,166
Arkansas2 0195 Aging 6,792 1,960,753 64,463 9.5 $59,176,879 $8,713 $8,261 $16,974
Arkansas2 0312 Physical Disabilities 2,582 630,945 20,743 8.0 $43,598,712 $16,886 $7,215 $24,101 Arkansas3 0400 Aging/Physical Disabilities 951 242,955 7,988 8.4 $13,584,396 $14,284 $2,134 $16,418 Arkansas2 0936 ASD-Child 81 17,496 575 7.1 $874,401 $10,795 $15,665 $26,460 Arkansas Total All 14,558 4,324,295 142,169 9.8 $295,851,406 $20,322 $9,966 $30,288 California 0139 Physical Disabilities 3,162 1,043,058 34,292 10.8 $130,441,644 $41,253 $45,749 $87,002 California 0141 Aging 11,266 3,330,935 109,510 9.7 $39,046,818 $3,466 $14,223 $17,689 California 0183 HIV/AIDS 1,812 546,140 17,955 9.9 $8,413,253 $4,643 $21,313 $25,956 California 0336 DD-incl. ID & ASD 103,814 34,667,811 1,139,764 11.0 $2,590,002,145 $24,948 $13,473 $38,421
California 0431 Aging/Physical Disabilities 2,617 570,939 18,771 7.2 $49,753,788 $19,012 $6,238 $25,250
California 0457 Physical Disabilities 128 45,984 1,512 11.8 $10,774,768 $84,178 $28,589 $112,767 California 0486 Medically Fragile 119 33,427 1,099 9.2 $609,609 $5,123 $93,585 $98,708 California 0855 Aging/Physical Disabilities 25 5,023 165 6.6 $488,445 $19,538 $14,111 $33,649 California Total All 122,943 40,243,317 1,323,068 10.8 $2,829,530,470 $23,015 $14,426 $37,441 Colorado 0006 Aging/Physical Disabilities 24,770 7,210,085 237,044 9.6 $269,179,118 $10,867 $7,595 $18,462 Colorado 0007 DD-incl. ID & ASD 4,861 1,646,079 54,118 11.1 $307,164,487 $63,190 $8,328 $71,518 Colorado2 0211 HIV/AIDS 54 15,620 514 9.5 $420,026 $7,778 $7,570 $15,348 Colorado 0268 Serious Mental Illness 3,449 1,016,005 33,403 9.7 $31,477,254 $9,126 $7,773 $16,899 Colorado 0288 Brain Injuries 314 90,379 2,971 9.5 $14,335,775 $45,655 $9,499 $55,154 Colorado 0293 DD-incl. ID & ASD 3,550 1,131,650 37,205 10.5 $38,987,011 $10,982 $11,379 $22,361 Colorado 0305 DD-Child (incl. ID & ASD) 82 23,636 777 9.5 $3,037,994 $37,049 $29,116 $66,165 Colorado 0434 ASD-Child 81 11,937 392 4.8 $669,622 $8,267 $3,693 $11,960 Colorado 0450 Medically Fragile 168 33,510 1,102 6.6 $223,309 $1,329 $51,131 $52,460 Colorado 0961 Aging/Physical Disabilities 66 19,297 634 9.6 $1,706,674 $25,859 $27,403 $53,262
CMS 372 Data by State and Waiver, 2014 Table 1
Medicaid Section 1915(c) Waiver Data based on the CMS 372 Report, 2013 – 2014 39
State Waiver Number Target Population Total
Participants Total Days of
Service
Total Participant
Months
Average Participant
Months
Total Waiver Expenditures
Average Waiver Expenditures
Average Non-waiver Medicaid
Expenditures
Average Total Medicaid Expenditures for Waiver
Participants
Colorado 4157 PD-Child 1,235 364,647 11,988 9.7 $8,205,004 $6,644 $28,811 $35,455 Colorado 4180 DD-Child (incl. ID & ASD) 825 202,516 6,658 8.1 $9,719,210 $11,781 $41,337 $53,118 Colorado Total All 39,455 11,765,361 386,806 9.8 $685,125,484 $17,365 $9,681 $27,046 Connecticut 0140 Aging 13,688 4,064,836 133,638 9.8 $213,769,241 $15,617 $5,876 $21,493 Connecticut 0301 Physical Disabilities 1,033 328,083 10,786 10.4 $28,466,790 $27,557 $14,339 $41,896 Connecticut 0302 Brain Injuries 452 162,445 5,341 11.8 $43,939,213 $97,211 $10,361 $107,572 Connecticut 0426 DD-incl. ID & ASD 3,966 1,392,436 45,779 11.5 $115,629,193 $29,155 $9,084 $38,239 Connecticut 0437 DD-incl. ID & ASD 4,915 1,748,481 57,484 11.7 $623,834,909 $126,925 $7,617 $134,542 Connecticut 0653 Serious Mental Illness 300 76,105 2,502 8.3 $5,269,215 $17,564 $18,474 $36,038 Connecticut 0881 DD-incl. ID & ASD 627 195,649 6,432 10.3 $9,167,478 $14,621 $6,605 $21,226 Connecticut 0993 Autism Spectrum Disorder 96 31,396 1,032 10.8 $1,247,773 $12,998 $10,405 $23,403 Connecticut 40110 DD-Child (incl. ID & ASD) 283 78,048 2,566 9.1 $43,920 $155 $19,039 $19,194 Connecticut Total All 25,360 8,077,479 265,561 10.5 $1,041,367,732 $41,063 $7,471 $48,534 Delaware 0009 DD-incl. ID & ASD 984 344,990 11,342 11.5 $104,303,024 $105,999 $4,276 $110,275 Delaware Total All 984 344,990 11,342 11.5 $104,303,024 $105,999 $4,276 $110,275 Dist. of Columbia 0307 DD-incl. ID & ASD 1,642 592,806 19,490 11.9 $167,817,691 $102,203 $11,883 $114,086 Dist. of Columbia 0334 Aging/Physical Disabilities 2,950 847,878 27,875 9.4 $29,861,828 $10,123 $44,610 $54,733 Dist. of Columbia Total All 4,592 1,440,684 47,365 10.3 $197,679,518 $43,049 $32,908 $75,956 Florida4 0010 Aging/Physical Disabilities 11,550 1,639,283 53,894 4.7 $61,942,419 $5,363 $1,410 $6,773 Florida4 0116 Aging 1,225 187,417 6,162 5.0 $6,909,154 $5,640 $330 $5,970 Florida 0194 HIV/AIDS 7,559 2,247,553 73,892 9.8 $10,731,791 $1,420 $16,664 $18,084 Florida4 0280 Aging/Physical Disabilities 1,523 65,317 2,147 1.4 $2,189,420 $1,438 $2,313 $3,751 Florida4 0315 Aging 12,846 1,646,119 54,119 4.2 $74,404,991 $5,792 $421 $6,213 Florida 0342 Physical Disabilities 419 128,372 4,220 10.1 $13,251,796 $31,627 $15,263 $46,890 Florida 0392 DD-other specific diagnoses 128 41,343 1,359 10.6 $785,617 $6,138 $31,273 $37,411 Florida 0867 DD-incl. ID & ASD 30,058 9,889,044 325,119 10.8 $735,681,732 $24,475 $11,511 $35,986 Florida 0962 Aging/Physical Disabilities 54,277 9,219,363 303,102 5.6 $264,494,421 $4,873 $18,621 $23,494 Florida 40166 Physical Disabilities 4 733 24 6.0 $17,034 $4,259 $252,077 $256,336 Florida 40205 DD-other specific diagnoses 9 3,285 108 12.0 $59,237 $6,582 $22,946 $29,528 Florida4 Total All 119,598 25,067,829 824,148 6.9 $1,170,467,612 $9,787 $12,708 $22,495 Georgia 0112 Aging/Physical Disabilities 30,057 9,076,556 298,407 9.9 $403,584,810 $13,427 $6,514 $19,941 Georgia 0175 DD-incl. ID & ASD 5,040 1,743,983 57,336 11.4 $67,533,018 $13,399 $2,445 $15,844 Georgia5 0323 DD-incl. ID & ASD 6,916 2,380,874 78,275 11.3 $377,985,228 $54,654 $4,196 $58,850 Georgia 4116 Medically Fragile 314 72,892 2,396 7.6 $7,767,535 $24,737 $31,002 $55,739 Georgia 4170 Physical Disabilities 1,234 418,408 13,756 11.1 $46,015,522 $37,290 $7,770 $45,060 Georgia Total All 43,561 13,692,713 450,171 10.3 $902,886,114 $20,727 $5,887 $26,614 Hawaii 0013 DD-incl. ID & ASD 2,623 933,184 30,680 11.7 $105,903,418 $40,375 $5,563 $45,938 Hawaii Total All 2,623 933,184 30,680 11.7 $105,903,418 $40,375 $5,563 $45,938

CMS 372 Data by State and Waiver, 2014 Table 1
Medicaid Section 1915(c) Waiver Data based on the CMS 372 Report, 2013 – 2014 40
State Waiver Number Target Population Total
Participants Total Days of
Service
Total Participant
Months
Average Participant
Months
Total Waiver Expenditures
Average Waiver Expenditures
Average Non-waiver Medicaid
Expenditures
Average Total Medicaid Expenditures for Waiver
Participants
Idaho 0076 DD-incl. ID & ASD 3,631 1,251,618 41,149 11.3 $145,834,094 $40,164 $9,662 $49,826 Idaho 0859 DD-Child (incl. ID & ASD) 2,408 707,867 23,272 9.7 $17,196,081 $7,141 $9,355 $16,496 Idaho 0887 DD-Child (incl. ID & ASD) 598 165,696 5,448 9.1 $8,644,790 $14,456 $7,322 $21,778 Idaho 1076 Aging/Physical Disabilities 10,269 2,560,487 84,180 8.2 $78,186,301 $7,614 $9,369 $16,983 Idaho Total All 16,906 4,685,668 154,049 9.1 $249,861,267 $14,779 $9,358 $24,137 Illinois 0142 Physical Disabilities 18,743 5,119,090 168,299 9.0 $258,954,174 $13,816 $4,809 $18,625 Illinois 0143 Aging/Physical Disabilities 61,909 16,861,200 554,341 9.0 $468,701,151 $7,571 $1,799 $9,370 Illinois 0202 HIV/AIDS 1,308 345,808 11,369 8.7 $13,930,503 $10,650 $9,476 $20,126 Illinois 0278 Medically Fragile 666 205,465 6,755 10.1 $2,059,773 $3,093 $133,087 $136,180 Illinois 0326 Aging/Physical Disabilities 9,699 2,332,394 76,681 7.9 $142,516,651 $14,694 $1,320 $16,014 Illinois 0329 Brain Injuries 3,802 1,086,540 35,722 9.4 $66,389,418 $17,462 $21,258 $38,720 Illinois6 0350 DD-incl. ID & ASD 19,487 6,608,478 217,265 11.1 $654,584,102 $33,591 $36,017 $69,608 Illinois 0464 DD-Child (incl. ID & ASD) 1,428 458,390 15,070 10.6 $18,024,620 $12,622 $15,049 $27,671 Illinois 0473 DD-Child (incl. ID & ASD) 300 90,898 2,988 10.0 $23,492,188 $78,307 $4,294 $82,601 Illinois Total All 117,342 33,108,263 1,088,491 9.3 $1,648,652,581 $14,050 $9,552 $23,602
Indiana 0210 Aging/Physical Disabilities 14,579 4,142,191 136,182 9.3 $160,763,036 $11,027 $20,092 $31,119
Indiana 0378 DD-incl. ID & ASD 8,553 2,959,116 97,286 11.4 $525,907,108 $61,488 $7,310 $68,798 Indiana 0387 DD-incl. ID & ASD 8,377 2,384,384 78,391 9.4 $61,565,773 $7,349 $3,852 $11,201 Indiana 4197 Brain Injuries 192 63,363 2,083 10.8 $5,143,178 $26,787 $28,380 $55,167 Indiana Total All 31,701 9,549,054 313,942 9.9 $753,379,095 $23,765 $12,402 $36,167 Iowa5 0213 HIV/AIDS 36 11,651 383 10.6 $334,904 $9,303 $10,925 $20,228 Iowa 0242 Intellectual Disability 12,721 4,419,488 145,298 11.4 $441,226,003 $34,685 $12,624 $47,309 Iowa 0299 Brain Injuries 1,296 455,553 14,977 11.6 $31,649,135 $24,421 $19,271 $43,692 Iowa 0345 Physical Disabilities 900 299,964 9,862 11.0 $4,365,862 $4,851 $21,237 $26,088 Iowa 0819 SED 961 307,496 10,109 10.5 $9,149,620 $9,521 $13,538 $23,059 Iowa5 4111 Physical Disabilities 2,564 873,602 28,721 11.2 $20,912,200 $8,156 $20,478 $28,634 Iowa5 4155 Aging 11,053 3,178,303 104,492 9.5 $73,719,366 $6,670 $4,690 $11,360 Iowa Total All 29,531 9,546,057 313,843 10.6 $581,357,090 $19,686 $10,918 $30,605 Kansas7 0224 DD-incl. ID & ASD 9,044 3,125,922 102,770 11.4 $399,432,697 $44,165 $0 $44,165 Kansas7 0303 Aging 6,857 1,941,636 63,835 9.3 $195,462,702 $28,506 $0 $28,506 Kansas7 0304 Physical Disabilities 6,146 1,812,561 59,591 9.7 $229,537,357 $37,347 $0 $37,347 Kansas7 0320 SED 4,517 1,182,308 38,870 8.6 $58,799,898 $13,017 $0 $13,017 Kansas7 0476 ASD-Child 79 22,487 739 9.4 $1,107,993 $14,025 $0 $14,025 Kansas7 4164 Brain Injuries 750 232,501 7,644 10.2 $29,837,765 $39,784 $0 $39,784 Kansas7 4165 Medically Fragile 542 167,337 5,501 10.2 $41,799,166 $77,120 $0 $77,120 Kansas7 Total All 27,935 8,484,752 278,951 10.0 $955,977,577 $34,221 $0 $34,221 Kentucky 0144 Aging/Physical Disabilities 10,573 3,322,892 109,246 10.3 $87,241,015 $8,251 $7,893 $16,144 Kentucky 0314 DD-incl. ID & ASD 4,134 1,163,542 38,253 9.3 $232,333,505 $56,201 $4,773 $60,974

CMS 372 Data by State and Waiver, 2014 Table 1
Medicaid Section 1915(c) Waiver Data based on the CMS 372 Report, 2013 – 2014 41
State Waiver Number Target Population Total
Participants Total Days of
Service
Total Participant
Months
Average Participant
Months
Total Waiver Expenditures
Average Waiver Expenditures
Average Non-waiver Medicaid
Expenditures
Average Total Medicaid Expenditures for Waiver
Participants
Kentucky5 0333 Brain Injuries 190 61,225 2,013 10.6 $21,416,291 $112,717 $5,640 $118,357 Kentucky 0475 DD-incl. ID & ASD 10,062 3,510,307 115,407 11.5 $264,917,533 $26,329 $7,305 $33,634 Kentucky 0477 Brain Injuries 230 81,498 2,679 11.6 $15,803,863 $68,712 $5,906 $74,618 Kentucky5 40146 Physical Disabilities 62 18,884 621 10.0 $5,153,692 $83,124 $67,922 $151,046 Kentucky Total All 25,251 8,158,348 268,220 10.6 $626,865,897 $24,825 $7,260 $32,086 Louisiana 0121 Aging/Physical Disabilities 798 254,365 8,363 10.5 $9,334,728 $11,698 $11,461 $23,159 Louisiana 0361 DD-Child (incl. ID & ASD) 1,189 423,995 13,940 11.7 $12,645,777 $10,636 $17,750 $28,386 Louisiana 0401 DD-incl. ID & ASD 8,612 3,101,605 101,971 11.8 $420,004,711 $48,770 $7,601 $56,371 Louisiana 0453 DD-incl. ID & ASD 1,610 576,135 18,941 11.8 $12,132,411 $7,536 $4,746 $12,282 Louisiana 0472 DD-incl. ID & ASD 30 10,450 344 11.5 $807,401 $26,913 $36,333 $63,246 Louisiana 0866 Aging/Physical Disabilities 4,866 1,545,960 50,826 10.4 $109,035,399 $22,408 $6,418 $28,826 Louisiana 0889 SED 612 87,240 2,868 4.7 $832,539 $1,360 $12,494 $13,854 Louisiana Total All 17,717 5,999,750 197,252 11.1 $564,792,966 $31,879 $8,090 $39,968 Maine 0127 Physical Disabilities 156 51,975 1,709 11.0 $5,159,418 $33,073 $7,498 $40,571 Maine 0159 ID & ASD 2,927 1,004,143 33,013 11.3 $291,699,930 $99,658 $6,777 $106,435 Maine 0276 Aging/Physical Disabilities 1,550 389,954 12,820 8.3 $30,152,119 $19,453 $6,915 $26,368 Maine2 0467 ID & ASD 1,393 474,148 15,588 11.2 $24,132,609 $17,324 $13,730 $31,054 Maine 0995 DD - non-ID 7 722 24 3.4 $167,711 $23,959 $15,459 $39,418 Maine Total All 6,033 1,920,942 63,154 10.5 $351,311,786 $58,232 $8,446 $66,678 Maryland 0023 DD-incl. ID & ASD 13,757 4,852,048 159,519 11.6 $765,926,370 $55,675 $8,605 $64,280 Maryland8 0265 Aging/Physical Disabilities 4,713 1,346,864 44,280 9.4 $83,089,767 $17,630 $18,782 $36,412 Maryland 0339 ASD-Child 1,003 351,304 11,550 11.5 $31,255,856 $31,162 $12,518 $43,680 Maryland8 0353 Physical Disabilities 1,035 168,686 5,546 5.4 $23,283,539 $22,496 $6,649 $29,145 Maryland 0645 Aging/Physical Disabilities 4,900 1,496,899 49,213 10.0 $71,155,998 $14,522 $9,964 $24,486 Maryland 40118 Medically Fragile 203 69,521 2,286 11.3 $2,305,686 $11,358 $131,050 $142,408 Maryland 40198 Brain Injuries 63 20,707 681 10.8 $6,415,051 $101,826 $7,239 $109,065 Maryland8 Total All 25,674 8,306,029 273,075 10.6 $983,432,267 $38,305 $11,771 $50,076 Massachusetts 0059 Aging/Physical Disabilities 14,260 3,996,388 131,388 9.2 $142,151,265 $9,969 $12,109 $22,078 Massachusetts 0359 Brain Injuries 99 32,429 1,066 10.8 $6,832,172 $69,012 $32,137 $101,149 Massachusetts 0826 Intellectual Disability 1,758 565,822 18,602 10.6 $40,942,882 $23,289 $24,843 $48,132 Massachusetts 0827 Intellectual Disability 8,447 2,949,407 96,967 11.5 $876,039,475 $103,710 $25,208 $128,918 Massachusetts 0828 Intellectual Disability 2,663 905,687 29,776 11.2 $41,043,153 $15,412 $21,157 $36,569 Massachusetts9 1027 Serious Mental Illness 0 0 0 0.0 $0 $0 $0 $0 Massachusetts9 1028 Serious Mental Illness 0 0 0 0.0 $0 $0 $0 $0 Massachusetts2 40207 ASD-Child 211 49,108 1,615 7.7 $2,298,042 $10,891 $11,616 $22,507 Massachusetts 40701 Brain Injuries 79 21,387 703 8.9 $8,955,812 $113,365 $15,298 $128,663 Massachusetts 40702 Brain Injuries 83 20,949 689 8.3 $2,867,695 $34,551 $20,508 $55,059 Massachusetts Total All 27,600 8,541,177 280,806 10.2 $1,121,130,495 $40,621 $17,905 $58,525
CMS 372 Data by State and Waiver, 2014 Table 1
Medicaid Section 1915(c) Waiver Data based on the CMS 372 Report, 2013 – 2014 42
State Waiver Number Target Population Total
Participants Total Days of
Service
Total Participant
Months
Average Participant
Months
Total Waiver Expenditures
Average Waiver Expenditures
Average Non-waiver Medicaid
Expenditures
Average Total Medicaid Expenditures for Waiver
Participants
Michigan 0167 DD-incl. ID & ASD 8,121 2,841,812 93,429 11.5 $442,626,984 $54,504 $11,715 $66,219 Michigan 0233 Aging/Physical Disabilities 13,107 3,545,119 116,552 8.9 $274,221,684 $20,922 $4,190 $25,112 Michigan 0438 SED 515 100,805 3,314 6.4 $3,282,940 $6,375 $6,274 $12,649 Michigan 4119 DD-Child (incl. ID & ASD) 462 148,227 4,873 10.5 $11,534,304 $24,966 $14,981 $39,947 Michigan Total All 22,205 6,635,963 218,169 9.8 $731,665,912 $32,951 $7,215 $40,166 Minnesota 0025 Aging 28,936 8,841,722 290,687 10.0 $334,498,038 $11,560 $8,127 $19,687 Minnesota 0061 DD-incl. ID & ASD 16,459 5,827,013 191,573 11.6 $1,082,168,890 $65,749 $8,119 $73,868 Minnesota 0166 Physical Disabilities 20,495 6,586,671 216,548 10.6 $598,480,236 $29,201 $16,479 $45,680 Minnesota 4128 Physical Disabilities 429 136,275 4,480 10.4 $26,001,572 $60,610 $115,427 $176,037 Minnesota 4169 Brain Injuries 1,497 496,741 16,331 10.9 $97,593,787 $65,193 $11,672 $76,865 Minnesota Total All 67,816 21,888,422 719,619 10.6 $2,138,742,523 $31,537 $11,406 $42,943 Mississippi 0255 Physical Disabilities 2,534 804,460 26,448 10.4 $46,997,195 $18,547 $4,721 $23,268 Mississippi 0272 Aging/Physical Disabilities 18,758 5,592,832 183,874 9.8 $158,604,458 $8,455 $3,852 $12,307 Mississippi 0282 DD-incl. ID & ASD 2,211 744,415 24,474 11.1 $69,963,569 $31,643 $4,617 $36,260 Mississippi 0355 Aging/Physical Disabilities 729 205,939 6,771 9.3 $10,376,066 $14,233 $5,800 $20,033 Mississippi 0366 Physical Disabilities 892 299,293 9,840 11.0 $20,446,641 $22,922 $8,475 $31,397 Mississippi Total All 25,124 7,646,939 251,406 10.0 $306,387,929 $12,195 $4,227 $16,422 Missouri 0026 Aging/Physical Disabilities 16,343 5,698,464 187,347 11.5 $95,538,881 $5,846 $10,676 $16,522 Missouri 0178 DD-incl. ID & ASD 8,461 2,627,989 86,400 10.2 $621,552,421 $73,461 $8,666 $82,127 Missouri 0197 HIV/AIDS 57 13,798 454 8.0 $1,712,485 $30,044 $19,447 $49,491 Missouri10 0346 Aging/Physical Disabilities 152 46,931 1,543 10.2 $1,628,840 $10,716 $39,866 $50,582 Missouri 0404 DD-incl. ID & ASD 1,560 235,336 7,737 5.0 $23,113,796 $14,817 $12,986 $27,803 Missouri 0698 ASD-Child 128 15,841 521 4.1 $1,449,290 $11,323 $12,693 $24,016 Missouri 0841 DD-incl. ID & ASD 2,373 644,970 21,204 8.9 $13,263,202 $5,589 $9,817 $15,406 Missouri 1021 Physical Disabilities 1,543 381,450 12,541 8.1 $14,408,156 $9,338 $14,271 $23,609 Missouri 40185 DD-Child (incl. ID & ASD) 312 97,610 3,209 10.3 $3,689,752 $11,826 $28,519 $40,345 Missouri 40190 Physical Disabilities 148 49,769 1,636 11.1 $14,493,314 $97,928 $19,231 $117,159 Missouri Total All 31,077 9,812,158 322,591 10.4 $790,850,138 $25,448 $10,745 $36,193 Montana 0148 Aging/Physical Disabilities 2,427 731,259 24,041 9.9 $36,406,937 $15,001 $12,671 $27,672 Montana 0208 DD-incl. ID & ASD 2,597 794,062 26,106 10.1 $96,760,303 $37,258 $8,409 $45,667 Montana 0455 Serious Mental Illness 222 64,746 2,129 9.6 $3,267,164 $14,717 $14,000 $28,717 Montana 0667 ASD-Child 64 10,244 337 5.3 $1,582,289 $24,723 $6,123 $30,846 Montana 1037 DD-incl. ID & ASD 20 2,670 88 4.4 $38,570 $1,929 $2,442 $4,371 Montana Total All 5,330 1,602,981 52,701 9.9 $138,055,263 $25,902 $10,533 $36,434 Nebraska 0187 Aging/Physical Disabilities 5,918 1,656,293 54,453 9.2 $72,694,418 $12,284 $6,932 $19,216 Nebraska5 0394 DD-incl. ID & ASD 894 296,570 9,750 10.9 $10,824,436 $12,108 $4,466 $16,574 Nebraska5 0396 DD-incl. ID & ASD 3,581 1,266,503 41,638 11.6 $206,959,936 $57,794 $5,872 $63,666 Nebraska5 4154 DD-Child (incl. ID & ASD) 327 100,650 3,309 10.1 $19,824,559 $60,626 $15,056 $75,682
CMS 372 Data by State and Waiver, 2014 Table 1
Medicaid Section 1915(c) Waiver Data based on the CMS 372 Report, 2013 – 2014 43
State Waiver Number Target Population Total
Participants Total Days of
Service
Total Participant
Months
Average Participant
Months
Total Waiver Expenditures
Average Waiver Expenditures
Average Non-waiver Medicaid
Expenditures
Average Total Medicaid Expenditures for Waiver
Participants
Nebraska 40199 Brain Injuries 21 7,451 245 11.7 $689,711 $32,843 $2,841 $35,684 Nebraska Total All 10,741 3,327,467 109,396 10.2 $310,993,060 $28,954 $6,613 $35,567 Nevada 0125 DD-incl. ID & ASD 1,883 641,273 21,083 11.2 $89,324,937 $47,438 $9,756 $57,194 Nevada 0152 Aging 2,294 623,003 20,482 8.9 $10,305,153 $4,492 $6,058 $10,550 Nevada3 0452 Aging/Physical Disabilities 37 10,559 347 9.4 $266,816 $7,211 $630 $7,841 Nevada 4150 Physical Disabilities 702 220,306 7,243 10.3 $3,777,251 $5,381 $23,913 $29,294 Nevada Total All 4,916 1,495,141 49,155 10.0 $103,674,156 $21,089 $9,983 $31,073 New Hampshire 0053 DD-incl. ID & ASD 4,556 1,438,488 47,293 10.4 $203,065,424 $44,571 $4,302 $48,873 New Hampshire 0060 Aging/Physical Disabilities 3,426 996,219 32,752 9.6 $45,646,057 $13,323 $10,494 $23,817 New Hampshire 0397 DD-Child (incl. ID & ASD) 336 92,181 3,031 9.0 $4,680,603 $13,930 $22,954 $36,884 New Hampshire 4177 Brain Injuries 246 80,055 2,632 10.7 $20,978,426 $85,278 $239 $85,517 New Hampshire Total All 8,564 2,606,943 85,708 10.0 $274,370,510 $32,038 $7,394 $39,432 New Jersey11 0031 DD-incl. ID & ASD 10,716 3,752,062 123,355 11.5 $604,997,705 $56,457 $7,613 $64,070 New Jersey11 0032 Aging/Physical Disabilities 13,995 4,082,751 134,227 9.6 $168,441,873 $12,036 $8,691 $20,727 New Jersey11 0160 HIV/AIDS 249 83,819 2,756 11.1 $580,651 $2,332 $17,520 $19,852 New Jersey3 4133 Physical Disabilities 301 96,099 3,159 10.5 $16,784,149 $55,761 $13,498 $69,259 New Jersey11 4174 Brain Injuries 342 118,965 3,911 11.4 $25,948,003 $75,871 $9,167 $85,038 New Jersey Total All 25,603 8,133,696 267,409 10.4 $816,752,381 $31,901 $8,389 $40,289 New Mexico 0173 DD-incl. ID & ASD 4,003 1,347,191 44,291 11.1 $268,436,667 $67,059 $5,521 $72,580 New Mexico 0223 Medically Fragile 148 43,447 1,428 9.7 $1,596,927 $10,790 $12,805 $23,595 New Mexico 0448 DD-incl. ID & ASD 785 223,309 7,342 9.4 $25,424,526 $32,388 $7,290 $39,678 New Mexico Total All 4,936 1,613,947 53,061 10.7 $295,458,120 $59,858 $6,021 $65,879
New York2 0034 Aging/Physical Disabilities 22,174 5,302,598 174,332 7.9 $26,923,490 $1,214 $27,000 $28,214
New York 0238 DD-incl. ID & ASD 72,719 25,833,350 849,316 11.7 $4,919,512,736 $67,651 $11,820 $79,471
New York12 0269 Brain Injuries 0 0 0 0.0 $0 $0 $0 $0
New York12 0296 SED 0 0 0 0.0 $0 $0 $0 $0 New York 0444 Aging/Physical Disabilities 2,491 745,554 24,511 9.8 $113,208,388 $45,447 $25,402 $70,849 New York12 0469 SED 0 0 0 0.0 $0 $0 $0 $0 New York12 0470 DD-Child (incl. ID & ASD) 0 0 0 0.0 $0 $0 $0 $0 New York12 0471 Medically Fragile 0 0 0 0.0 $0 $0 $0 $0 New York12 4125 PD-Child 0 0 0 0.0 $0 $0 $0 $0 New York 40163 DD-Child (incl. ID & ASD) 139 47,883 1,574 11.3 $1,110,460 $7,989 $52,415 $60,404 New York 40176 DD-Child (incl. ID & ASD) 228 73,468 2,415 10.6 $1,532,694 $6,722 $39,371 $46,093 New York 40200 DD-Child (incl. ID & ASD) 174 58,436 1,921 11.0 $1,118,122 $6,426 $50,436 $56,862 New York Total All 97,925 32,061,289 1,054,070 10.8 $5,063,405,890 $51,707 $15,793 $67,500 North Carolina 0132 Aging/Physical Disabilities 12,189 3,736,615 122,848 10.1 $234,651,265 $19,251 $7,254 $26,505 North Carolina 0423 DD-incl. ID & ASD 11,989 3,301,182 108,532 9.1 $504,436,754 $42,075 $4,270 $46,345 North Carolina 4141 Medically Fragile 1,961 591,769 19,455 9.9 $79,618,023 $40,601 $28,363 $68,964
CMS 372 Data by State and Waiver, 2014 Table 1
Medicaid Section 1915(c) Waiver Data based on the CMS 372 Report, 2013 – 2014 44
State Waiver Number Target Population Total
Participants Total Days of
Service
Total Participant
Months
Average Participant
Months
Total Waiver Expenditures
Average Waiver Expenditures
Average Non-waiver Medicaid
Expenditures
Average Total Medicaid Expenditures for Waiver
Participants
North Carolina Total All 26,139 7,629,566 250,835 9.6 $818,706,042 $31,321 $7,469 $38,790
North Dakota 0037 DD-incl. ID & ASD 4,342 1,341,955 44,119 10.2 $162,198,869 $37,356 $4,813 $42,169 North Dakota 0273 Aging/Physical Disabilities 372 105,281 3,461 9.3 $5,199,916 $13,978 $21,382 $35,360 North Dakota13 0468 Physical Disabilities 1 365 12 12.0 $166,973 $166,973 $48,672 $215,645 North Dakota 0568 Medically Fragile 10 3,552 117 11.7 $89,797 $8,980 $21,774 $30,754 North Dakota9 0834 Medically Fragile 0 0 0 0.0 $0 $0 $0 $0 North Dakota 0842 ASD-Child 30 7,019 231 7.7 $966,333 $32,211 $16,726 $48,937 North Dakota Total All 4,755 1,458,172 47,940 10.1 $168,621,888 $35,462 $6,229 $41,691 Ohio 0198 Aging/Physical Disabilities 41,175 11,847,281 389,500 9.5 $372,000,086 $9,035 $7,775 $16,810 Ohio 0231 DD-incl. ID & ASD 17,856 6,268,715 206,095 11.5 $1,138,789,140 $63,776 $9,687 $73,463 Ohio 0337 Physical Disabilities 9,500 2,940,328 96,668 10.2 $186,325,508 $19,613 $27,622 $47,235 Ohio 0380 DD-incl. ID & ASD 13,114 4,444,404 146,117 11.1 $157,551,591 $12,014 $7,388 $19,402 Ohio 0383 DD-incl. ID & ASD 2,920 1,028,835 33,825 11.6 $63,269,903 $21,668 $42,741 $64,409 Ohio 0440 Aging/Physical Disabilities 2,693 848,116 27,883 10.4 $58,251,790 $21,631 $19,019 $40,650 Ohio 0446 Aging/Physical Disabilities 5,503 1,445,630 47,528 8.6 $72,243,908 $13,128 $3,551 $16,679 Ohio 0877 DD-incl. ID & ASD 248 69,143 2,273 9.2 $2,344,655 $9,454 $14,893 $24,347 Ohio 4196 Aging/Physical Disabilities 560 150,109 4,935 8.8 $6,633,918 $11,846 $9,278 $21,124 Ohio Total All 93,569 29,042,561 954,824 10.2 $2,057,410,499 $21,988 $11,295 $33,283 Oklahoma 0179 Intellectual Disability 2,869 1,008,880 33,169 11.6 $175,452,031 $61,154 $10,877 $72,031 Oklahoma 0256 Aging/Physical Disabilities 20,731 6,125,294 201,380 9.7 $192,282,173 $9,275 $6,756 $16,031 Oklahoma 0343 Intellectual Disability 1,534 523,373 17,207 11.2 $23,219,908 $15,137 $9,839 $24,976 Oklahoma 0351 ID-Child 284 90,722 2,983 10.5 $2,269,254 $7,990 $21,235 $29,225 Oklahoma 0399 Intellectual Disability 688 247,377 8,133 11.8 $91,052,600 $132,344 $9,127 $141,471 Oklahoma 0809 Aging 53 11,982 394 7.4 $400,518 $7,557 $4,170 $11,727 Oklahoma 0810 Physical Disabilities 101 27,437 902 8.9 $1,140,347 $11,291 $11,277 $22,568 Oklahoma 0811 Medically Fragile 57 2,381 78 1.4 $3,328,847 $58,401 $13,120 $71,521 Oklahoma Total All 26,317 8,037,446 264,245 10.0 $489,145,677 $18,587 $7,629 $26,216 Oregon14 0117 DD-incl. ID & ASD 8,343 2,628,000 86,400 10.4 $80,631,780 $9,665 $7,641 $17,306 Oregon14 0185 Aging/Physical Disabilities 31,508 8,748,848 287,633 9.1 $24,931,530 $791 $8,610 $9,401 Oregon14 0375 DD-incl. ID & ASD 7,976 2,732,532 89,837 11.3 $27,197,904 $3,410 $8,030 $11,440 Oregon14 0565 PD-Child 200 61,584 2,025 10.1 $250,568 $1,253 $29,257 $30,510 Oregon14 40193 Medically Fragile 97 29,289 963 9.9 $77,537 $799 $75,795 $76,594 Oregon14 40194 DD-Child (incl. ID & ASD) 145 44,291 1,456 10.0 $293,822 $2,026 $29,982 $32,008 Oregon14 Total All 48,269 14,244,544 468,314 9.7 $133,383,141 $2,763 $8,631 $11,395 Pennsylvania 0147 Intellectual Disability 17,209 6,009,633 197,577 11.5 $1,769,969,115 $102,851 $6,557 $109,408 Pennsylvania 0192 HIV/AIDS 257 81,989 2,696 10.5 $2,762,050 $10,747 $2,528 $13,275 Pennsylvania 0235 DD - non-ID 1,427 514,455 16,914 11.9 $79,847,467 $55,955 $6,878 $62,833 Pennsylvania 0277 Physical Disabilities 10,471 3,481,591 114,463 10.9 $226,988,358 $21,678 $7,653 $29,331
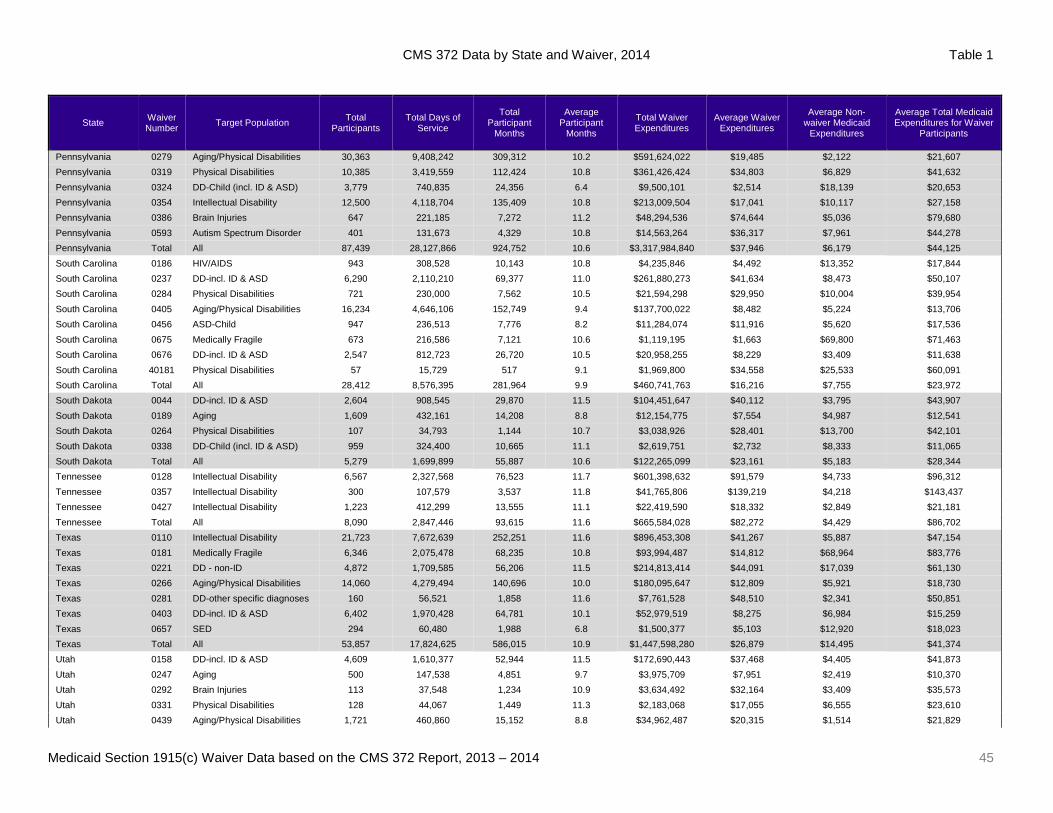
CMS 372 Data by State and Waiver, 2014 Table 1
Medicaid Section 1915(c) Waiver Data based on the CMS 372 Report, 2013 – 2014 45
State Waiver Number Target Population Total
Participants Total Days of
Service
Total Participant
Months
Average Participant
Months
Total Waiver Expenditures
Average Waiver Expenditures
Average Non-waiver Medicaid
Expenditures
Average Total Medicaid Expenditures for Waiver
Participants
Pennsylvania 0279 Aging/Physical Disabilities 30,363 9,408,242 309,312 10.2 $591,624,022 $19,485 $2,122 $21,607 Pennsylvania 0319 Physical Disabilities 10,385 3,419,559 112,424 10.8 $361,426,424 $34,803 $6,829 $41,632 Pennsylvania 0324 DD-Child (incl. ID & ASD) 3,779 740,835 24,356 6.4 $9,500,101 $2,514 $18,139 $20,653 Pennsylvania 0354 Intellectual Disability 12,500 4,118,704 135,409 10.8 $213,009,504 $17,041 $10,117 $27,158 Pennsylvania 0386 Brain Injuries 647 221,185 7,272 11.2 $48,294,536 $74,644 $5,036 $79,680 Pennsylvania 0593 Autism Spectrum Disorder 401 131,673 4,329 10.8 $14,563,264 $36,317 $7,961 $44,278 Pennsylvania Total All 87,439 28,127,866 924,752 10.6 $3,317,984,840 $37,946 $6,179 $44,125 South Carolina 0186 HIV/AIDS 943 308,528 10,143 10.8 $4,235,846 $4,492 $13,352 $17,844 South Carolina 0237 DD-incl. ID & ASD 6,290 2,110,210 69,377 11.0 $261,880,273 $41,634 $8,473 $50,107 South Carolina 0284 Physical Disabilities 721 230,000 7,562 10.5 $21,594,298 $29,950 $10,004 $39,954 South Carolina 0405 Aging/Physical Disabilities 16,234 4,646,106 152,749 9.4 $137,700,022 $8,482 $5,224 $13,706 South Carolina 0456 ASD-Child 947 236,513 7,776 8.2 $11,284,074 $11,916 $5,620 $17,536 South Carolina 0675 Medically Fragile 673 216,586 7,121 10.6 $1,119,195 $1,663 $69,800 $71,463 South Carolina 0676 DD-incl. ID & ASD 2,547 812,723 26,720 10.5 $20,958,255 $8,229 $3,409 $11,638 South Carolina 40181 Physical Disabilities 57 15,729 517 9.1 $1,969,800 $34,558 $25,533 $60,091 South Carolina Total All 28,412 8,576,395 281,964 9.9 $460,741,763 $16,216 $7,755 $23,972 South Dakota 0044 DD-incl. ID & ASD 2,604 908,545 29,870 11.5 $104,451,647 $40,112 $3,795 $43,907 South Dakota 0189 Aging 1,609 432,161 14,208 8.8 $12,154,775 $7,554 $4,987 $12,541 South Dakota 0264 Physical Disabilities 107 34,793 1,144 10.7 $3,038,926 $28,401 $13,700 $42,101 South Dakota 0338 DD-Child (incl. ID & ASD) 959 324,400 10,665 11.1 $2,619,751 $2,732 $8,333 $11,065 South Dakota Total All 5,279 1,699,899 55,887 10.6 $122,265,099 $23,161 $5,183 $28,344 Tennessee 0128 Intellectual Disability 6,567 2,327,568 76,523 11.7 $601,398,632 $91,579 $4,733 $96,312 Tennessee 0357 Intellectual Disability 300 107,579 3,537 11.8 $41,765,806 $139,219 $4,218 $143,437 Tennessee 0427 Intellectual Disability 1,223 412,299 13,555 11.1 $22,419,590 $18,332 $2,849 $21,181 Tennessee Total All 8,090 2,847,446 93,615 11.6 $665,584,028 $82,272 $4,429 $86,702 Texas 0110 Intellectual Disability 21,723 7,672,639 252,251 11.6 $896,453,308 $41,267 $5,887 $47,154 Texas 0181 Medically Fragile 6,346 2,075,478 68,235 10.8 $93,994,487 $14,812 $68,964 $83,776 Texas 0221 DD - non-ID 4,872 1,709,585 56,206 11.5 $214,813,414 $44,091 $17,039 $61,130 Texas 0266 Aging/Physical Disabilities 14,060 4,279,494 140,696 10.0 $180,095,647 $12,809 $5,921 $18,730 Texas 0281 DD-other specific diagnoses 160 56,521 1,858 11.6 $7,761,528 $48,510 $2,341 $50,851 Texas 0403 DD-incl. ID & ASD 6,402 1,970,428 64,781 10.1 $52,979,519 $8,275 $6,984 $15,259 Texas 0657 SED 294 60,480 1,988 6.8 $1,500,377 $5,103 $12,920 $18,023 Texas Total All 53,857 17,824,625 586,015 10.9 $1,447,598,280 $26,879 $14,495 $41,374 Utah 0158 DD-incl. ID & ASD 4,609 1,610,377 52,944 11.5 $172,690,443 $37,468 $4,405 $41,873 Utah 0247 Aging 500 147,538 4,851 9.7 $3,975,709 $7,951 $2,419 $10,370 Utah 0292 Brain Injuries 113 37,548 1,234 10.9 $3,634,492 $32,164 $3,409 $35,573 Utah 0331 Physical Disabilities 128 44,067 1,449 11.3 $2,183,068 $17,055 $6,555 $23,610 Utah 0439 Aging/Physical Disabilities 1,721 460,860 15,152 8.8 $34,962,487 $20,315 $1,514 $21,829

CMS 372 Data by State and Waiver, 2014 Table 1
Medicaid Section 1915(c) Waiver Data based on the CMS 372 Report, 2013 – 2014 46
State Waiver Number Target Population Total
Participants Total Days of
Service
Total Participant
Months
Average Participant
Months
Total Waiver Expenditures
Average Waiver Expenditures
Average Non-waiver Medicaid
Expenditures
Average Total Medicaid Expenditures for Waiver
Participants
Utah 1029 ASD-Child 326 106,696 3,508 10.8 $5,493,755 $16,852 $3,411 $20,263 Utah 40183 Medically Fragile 143 42,944 1,412 9.9 $3,099,743 $21,677 $34,479 $56,156 Utah Total All 7,540 2,450,030 80,549 10.7 $226,039,698 $29,979 $4,162 $34,141 Virginia 0321 Aging/Physical Disabilities 32,077 9,884,923 324,984 10.1 $596,412,099 $18,593 $6,791 $25,384 Virginia 0358 DD - non-ID 860 299,846 9,858 11.5 $26,015,953 $30,251 $9,276 $39,527 Virginia 0372 Intellectual Disability 9,995 3,502,750 115,159 11.5 $657,884,138 $65,821 $10,392 $76,213 Virginia 0430 Intellectual Disability 249 88,395 2,906 11.7 $3,437,763 $13,806 $8,618 $22,424 Virginia 4149 Physical Disabilities 373 112,949 3,713 10.0 $31,330,351 $83,996 $55,480 $139,476 Virginia 40206 Aging/Physical Disabilities 59 15,178 499 8.5 $587,913 $9,965 $752 $10,717 Virginia Total All 43,613 13,904,041 457,119 10.5 $1,315,668,217 $30,167 $8,084 $38,251 Washington 0049 Aging/Physical Disabilities 41,489 12,748,704 419,135 10.1 $649,103,599 $15,645 $3,957 $19,602 Washington 0409 DD-incl. ID & ASD 7,850 2,558,650 84,120 10.7 $196,889,261 $25,081 $4,103 $29,184 Washington 0410 DD-incl. ID & ASD 4,598 1,525,700 50,160 10.9 $379,825,384 $82,607 $3,573 $86,180 Washington 0411 DD-incl. ID & ASD 456 150,380 4,944 10.8 $52,625,406 $115,407 $3,245 $118,652 Washington 0443 Aging/Physical Disabilities 788 256,217 8,424 10.7 $6,068,058 $7,701 $5,201 $12,902 Washington 40669 DD-incl. ID & ASD 104 29,200 960 9.2 $6,035,659 $58,035 $7,265 $65,300 Washington Total All 55,285 17,268,851 567,743 10.3 $1,290,547,367 $23,344 $3,964 $27,307 West Virginia 0133 DD-incl. ID & ASD 4,526 1,628,734 53,547 11.8 $355,331,328 $78,509 $6,887 $85,396 West Virginia 0134 Aging/Physical Disabilities 5,862 1,892,296 62,212 10.6 $105,367,312 $17,975 $7,297 $25,272 West Virginia 0876 Brain Injuries 30 6,812 224 7.5 $506,060 $16,869 $11,711 $28,580 West Virginia Total All 10,418 3,527,842 115,984 11.1 $461,204,700 $44,270 $7,132 $51,402 Wisconsin 0154 Aging/Physical Disabilities 3,561 1,052,084 34,589 9.7 $67,218,950 $18,876 $9,394 $28,270 Wisconsin2 0229 DD-incl. ID & ASD 3,428 1,194,433 39,269 11.5 $152,536,084 $44,497 $13,135 $57,632 Wisconsin3 0275 Brain Injuries 86 30,719 1,010 11.7 $5,845,148 $67,967 $22,423 $90,390 Wisconsin15 0367 Aging/Physical Disabilities 31,722 9,301,495 305,803 9.6 $873,940,310 $27,550 $2,564 $30,114 Wisconsin15 0368 DD-incl. ID & ASD 15,154 5,155,125 169,484 11.2 $513,751,801 $33,902 $2,735 $36,637 Wisconsin 0413 PD-Child 507 156,589 5,148 10.2 $4,487,562 $8,851 $32,147 $40,998 Wisconsin 0414 DD-Child (incl. ID & ASD) 4,739 1,477,922 48,589 10.3 $52,291,034 $11,034 $11,406 $22,440 Wisconsin 0415 SED 1,094 308,307 10,136 9.3 $15,807,713 $14,449 $6,689 $21,138 Wisconsin 0484 DD-incl. ID & ASD 12,258 3,861,167 126,942 10.4 $200,877,335 $16,387 $17,562 $33,949 Wisconsin3 0485 Aging/Physical Disabilities 5,073 1,320,644 43,418 8.6 $47,841,816 $9,431 $19,410 $28,841 Wisconsin Total All 77,622 23,858,485 784,389 10.1 $1,934,597,753 $24,923 $7,660 $32,584 Wyoming 0226 DD-incl. ID & ASD 1,406 489,104 16,080 11.4 $82,315,832 $58,546 $6,780 $65,326 Wyoming 0236 Aging/Physical Disabilities 1,686 488,007 16,044 9.5 $12,909,869 $7,657 $8,160 $15,817 Wyoming 0253 DD-Child (incl. ID & ASD) 713 231,079 7,597 10.7 $11,460,110 $16,073 $10,637 $26,710 Wyoming 0369 Aging/Physical Disabilities 197 56,135 1,846 9.4 $2,579,571 $13,094 $3,100 $16,194 Wyoming 0370 Brain Injuries 179 61,538 2,023 11.3 $5,682,457 $31,746 $6,954 $38,700 Wyoming 0451 SED 63 14,330 471 7.5 $565,764 $8,980 $10,080 $19,060
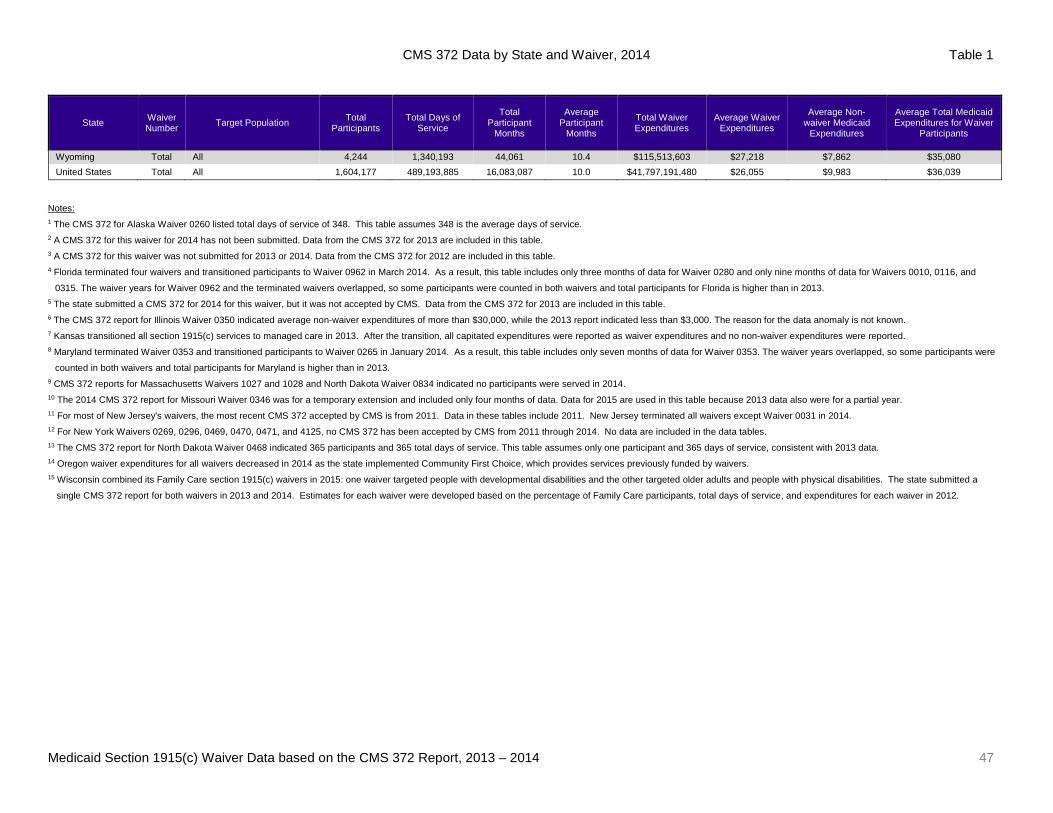
CMS 372 Data by State and Waiver, 2014 Table 1
Medicaid Section 1915(c) Waiver Data based on the CMS 372 Report, 2013 – 2014 47
State Waiver Number Target Population Total
Participants Total Days of
Service
Total Participant
Months
Average Participant
Months
Total Waiver Expenditures
Average Waiver Expenditures
Average Non-waiver Medicaid
Expenditures
Average Total Medicaid Expenditures for Waiver
Participants
Wyoming Total All 4,244 1,340,193 44,061 10.4 $115,513,603 $27,218 $7,862 $35,080 United States Total All 1,604,177 489,193,885 16,083,087 10.0 $41,797,191,480 $26,055 $9,983 $36,039
Notes: 1 The CMS 372 for Alaska Waiver 0260 listed total days of service of 348. This table assumes 348 is the average days of service. 2 A CMS 372 for this waiver for 2014 has not been submitted. Data from the CMS 372 for 2013 are included in this table. 3 A CMS 372 for this waiver was not submitted for 2013 or 2014. Data from the CMS 372 for 2012 are included in this table. 4 Florida terminated four waivers and transitioned participants to Waiver 0962 in March 2014. As a result, this table includes only three months of data for Waiver 0280 and only nine months of data for Waivers 0010, 0116, and
0315. The waiver years for Waiver 0962 and the terminated waivers overlapped, so some participants were counted in both waivers and total participants for Florida is higher than in 2013. 5 The state submitted a CMS 372 for 2014 for this waiver, but it was not accepted by CMS. Data from the CMS 372 for 2013 are included in this table. 6 The CMS 372 report for Illinois Waiver 0350 indicated average non-waiver expenditures of more than $30,000, while the 2013 report indicated less than $3,000. The reason for the data anomaly is not known. 7 Kansas transitioned all section 1915(c) services to managed care in 2013. After the transition, all capitated expenditures were reported as waiver expenditures and no non-waiver expenditures were reported. 8 Maryland terminated Waiver 0353 and transitioned participants to Waiver 0265 in January 2014. As a result, this table includes only seven months of data for Waiver 0353. The waiver years overlapped, so some participants were
counted in both waivers and total participants for Maryland is higher than in 2013. 9 CMS 372 reports for Massachusetts Waivers 1027 and 1028 and North Dakota Waiver 0834 indicated no participants were served in 2014. 10 The 2014 CMS 372 report for Missouri Waiver 0346 was for a temporary extension and included only four months of data. Data for 2015 are used in this table because 2013 data also were for a partial year. 11 For most of New Jersey's waivers, the most recent CMS 372 accepted by CMS is from 2011. Data in these tables include 2011. New Jersey terminated all waivers except Waiver 0031 in 2014. 12 For New York Waivers 0269, 0296, 0469, 0470, 0471, and 4125, no CMS 372 has been accepted by CMS from 2011 through 2014. No data are included in the data tables. 13 The CMS 372 report for North Dakota Waiver 0468 indicated 365 participants and 365 total days of service. This table assumes only one participant and 365 days of service, consistent with 2013 data. 14 Oregon waiver expenditures for all waivers decreased in 2014 as the state implemented Community First Choice, which provides services previously funded by waivers. 15 Wisconsin combined its Family Care section 1915(c) waivers in 2015: one waiver targeted people with developmental disabilities and the other targeted older adults and people with physical disabilities. The state submitted a
single CMS 372 report for both waivers in 2013 and 2014. Estimates for each waiver were developed based on the percentage of Family Care participants, total days of service, and expenditures for each waiver in 2012.
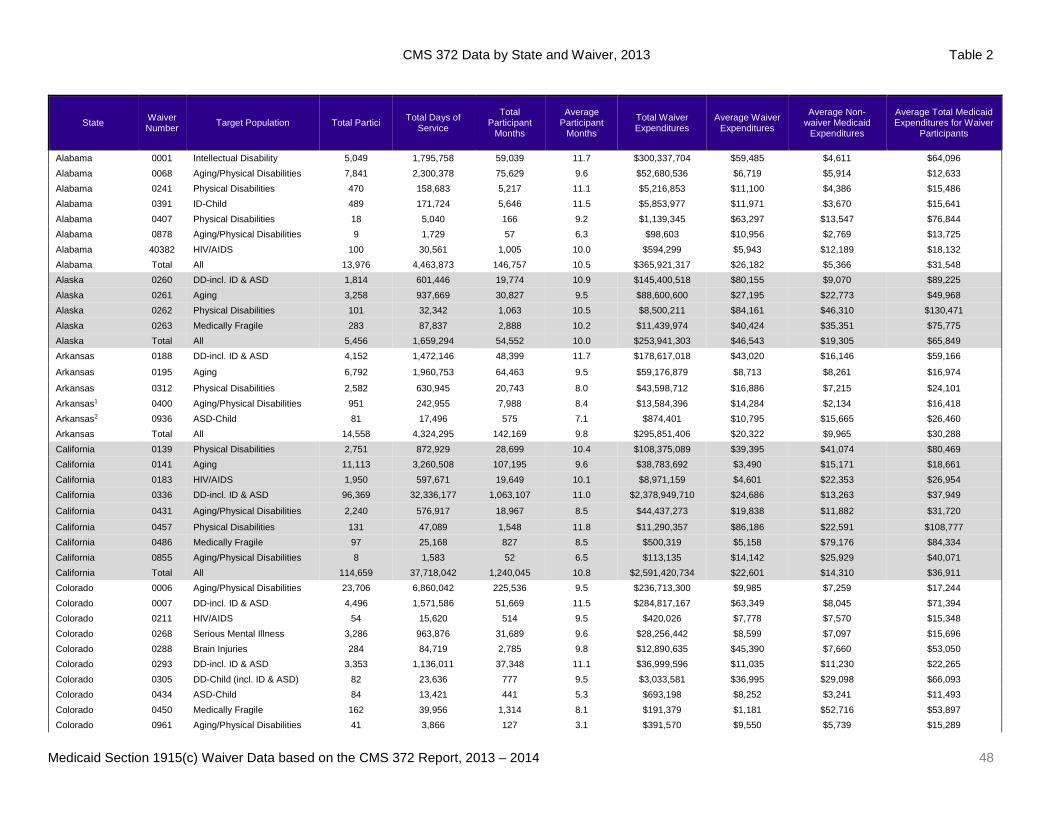
CMS 372 Data by State and Waiver, 2013 Table 2
Medicaid Section 1915(c) Waiver Data based on the CMS 372 Report, 2013 – 2014 48
State Waiver Number Target Population Total Partici Total Days of
Service
Total Participant
Months
Average Participant
Months
Total Waiver Expenditures
Average Waiver Expenditures
Average Non-waiver Medicaid
Expenditures
Average Total Medicaid Expenditures for Waiver
Participants
Alabama 0001 Intellectual Disability 5,049 1,795,758 59,039 11.7 $300,337,704 $59,485 $4,611 $64,096 Alabama 0068 Aging/Physical Disabilities 7,841 2,300,378 75,629 9.6 $52,680,536 $6,719 $5,914 $12,633 Alabama 0241 Physical Disabilities 470 158,683 5,217 11.1 $5,216,853 $11,100 $4,386 $15,486 Alabama 0391 ID-Child 489 171,724 5,646 11.5 $5,853,977 $11,971 $3,670 $15,641 Alabama 0407 Physical Disabilities 18 5,040 166 9.2 $1,139,345 $63,297 $13,547 $76,844 Alabama 0878 Aging/Physical Disabilities 9 1,729 57 6.3 $98,603 $10,956 $2,769 $13,725 Alabama 40382 HIV/AIDS 100 30,561 1,005 10.0 $594,299 $5,943 $12,189 $18,132 Alabama Total All 13,976 4,463,873 146,757 10.5 $365,921,317 $26,182 $5,366 $31,548 Alaska 0260 DD-incl. ID & ASD 1,814 601,446 19,774 10.9 $145,400,518 $80,155 $9,070 $89,225 Alaska 0261 Aging 3,258 937,669 30,827 9.5 $88,600,600 $27,195 $22,773 $49,968 Alaska 0262 Physical Disabilities 101 32,342 1,063 10.5 $8,500,211 $84,161 $46,310 $130,471 Alaska 0263 Medically Fragile 283 87,837 2,888 10.2 $11,439,974 $40,424 $35,351 $75,775 Alaska Total All 5,456 1,659,294 54,552 10.0 $253,941,303 $46,543 $19,305 $65,849 Arkansas 0188 DD-incl. ID & ASD 4,152 1,472,146 48,399 11.7 $178,617,018 $43,020 $16,146 $59,166
Arkansas 0195 Aging 6,792 1,960,753 64,463 9.5 $59,176,879 $8,713 $8,261 $16,974
Arkansas 0312 Physical Disabilities 2,582 630,945 20,743 8.0 $43,598,712 $16,886 $7,215 $24,101 Arkansas1 0400 Aging/Physical Disabilities 951 242,955 7,988 8.4 $13,584,396 $14,284 $2,134 $16,418 Arkansas2 0936 ASD-Child 81 17,496 575 7.1 $874,401 $10,795 $15,665 $26,460 Arkansas Total All 14,558 4,324,295 142,169 9.8 $295,851,406 $20,322 $9,965 $30,288 California 0139 Physical Disabilities 2,751 872,929 28,699 10.4 $108,375,089 $39,395 $41,074 $80,469 California 0141 Aging 11,113 3,260,508 107,195 9.6 $38,783,692 $3,490 $15,171 $18,661 California 0183 HIV/AIDS 1,950 597,671 19,649 10.1 $8,971,159 $4,601 $22,353 $26,954 California 0336 DD-incl. ID & ASD 96,369 32,336,177 1,063,107 11.0 $2,378,949,710 $24,686 $13,263 $37,949
California 0431 Aging/Physical Disabilities 2,240 576,917 18,967 8.5 $44,437,273 $19,838 $11,882 $31,720
California 0457 Physical Disabilities 131 47,089 1,548 11.8 $11,290,357 $86,186 $22,591 $108,777 California 0486 Medically Fragile 97 25,168 827 8.5 $500,319 $5,158 $79,176 $84,334 California 0855 Aging/Physical Disabilities 8 1,583 52 6.5 $113,135 $14,142 $25,929 $40,071 California Total All 114,659 37,718,042 1,240,045 10.8 $2,591,420,734 $22,601 $14,310 $36,911 Colorado 0006 Aging/Physical Disabilities 23,706 6,860,042 225,536 9.5 $236,713,300 $9,985 $7,259 $17,244 Colorado 0007 DD-incl. ID & ASD 4,496 1,571,586 51,669 11.5 $284,817,167 $63,349 $8,045 $71,394 Colorado 0211 HIV/AIDS 54 15,620 514 9.5 $420,026 $7,778 $7,570 $15,348 Colorado 0268 Serious Mental Illness 3,286 963,876 31,689 9.6 $28,256,442 $8,599 $7,097 $15,696 Colorado 0288 Brain Injuries 284 84,719 2,785 9.8 $12,890,635 $45,390 $7,660 $53,050 Colorado 0293 DD-incl. ID & ASD 3,353 1,136,011 37,348 11.1 $36,999,596 $11,035 $11,230 $22,265 Colorado 0305 DD-Child (incl. ID & ASD) 82 23,636 777 9.5 $3,033,581 $36,995 $29,098 $66,093 Colorado 0434 ASD-Child 84 13,421 441 5.3 $693,198 $8,252 $3,241 $11,493 Colorado 0450 Medically Fragile 162 39,956 1,314 8.1 $191,379 $1,181 $52,716 $53,897 Colorado 0961 Aging/Physical Disabilities 41 3,866 127 3.1 $391,570 $9,550 $5,739 $15,289
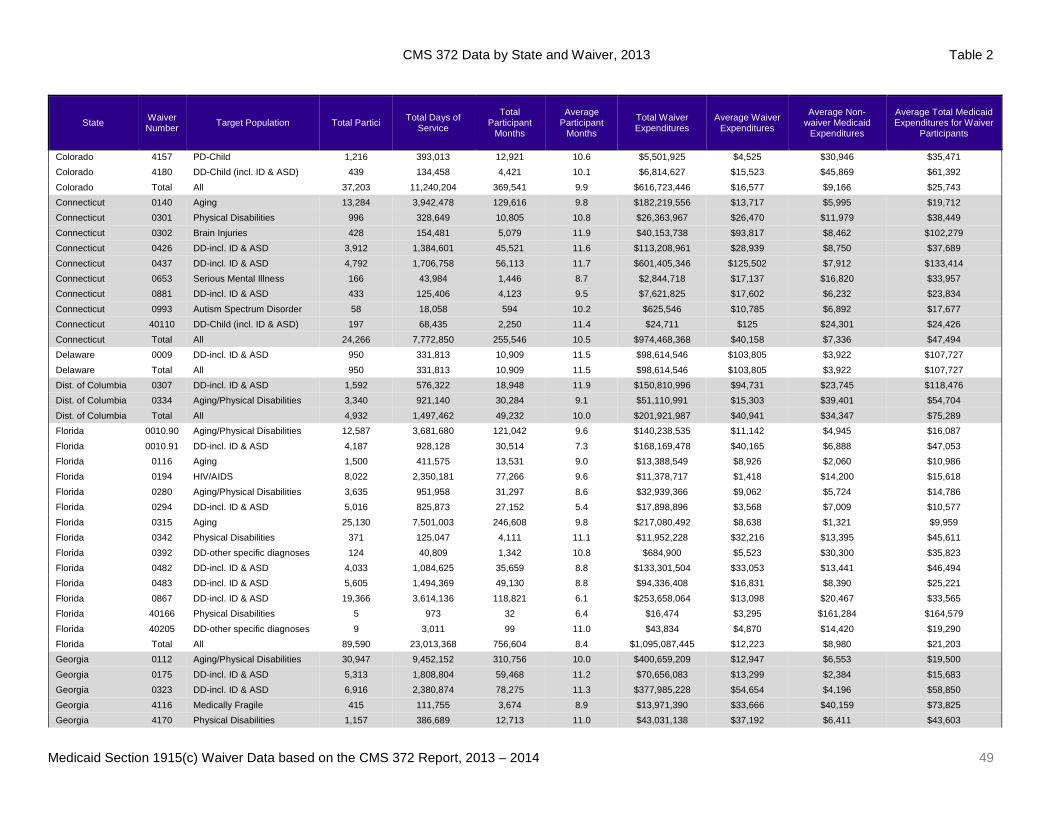
CMS 372 Data by State and Waiver, 2013 Table 2
Medicaid Section 1915(c) Waiver Data based on the CMS 372 Report, 2013 – 2014 49
State Waiver Number Target Population Total Partici Total Days of
Service
Total Participant
Months
Average Participant
Months
Total Waiver Expenditures
Average Waiver Expenditures
Average Non-waiver Medicaid
Expenditures
Average Total Medicaid Expenditures for Waiver
Participants
Colorado 4157 PD-Child 1,216 393,013 12,921 10.6 $5,501,925 $4,525 $30,946 $35,471 Colorado 4180 DD-Child (incl. ID & ASD) 439 134,458 4,421 10.1 $6,814,627 $15,523 $45,869 $61,392 Colorado Total All 37,203 11,240,204 369,541 9.9 $616,723,446 $16,577 $9,166 $25,743 Connecticut 0140 Aging 13,284 3,942,478 129,616 9.8 $182,219,556 $13,717 $5,995 $19,712 Connecticut 0301 Physical Disabilities 996 328,649 10,805 10.8 $26,363,967 $26,470 $11,979 $38,449 Connecticut 0302 Brain Injuries 428 154,481 5,079 11.9 $40,153,738 $93,817 $8,462 $102,279 Connecticut 0426 DD-incl. ID & ASD 3,912 1,384,601 45,521 11.6 $113,208,961 $28,939 $8,750 $37,689 Connecticut 0437 DD-incl. ID & ASD 4,792 1,706,758 56,113 11.7 $601,405,346 $125,502 $7,912 $133,414 Connecticut 0653 Serious Mental Illness 166 43,984 1,446 8.7 $2,844,718 $17,137 $16,820 $33,957 Connecticut 0881 DD-incl. ID & ASD 433 125,406 4,123 9.5 $7,621,825 $17,602 $6,232 $23,834 Connecticut 0993 Autism Spectrum Disorder 58 18,058 594 10.2 $625,546 $10,785 $6,892 $17,677 Connecticut 40110 DD-Child (incl. ID & ASD) 197 68,435 2,250 11.4 $24,711 $125 $24,301 $24,426 Connecticut Total All 24,266 7,772,850 255,546 10.5 $974,468,368 $40,158 $7,336 $47,494 Delaware 0009 DD-incl. ID & ASD 950 331,813 10,909 11.5 $98,614,546 $103,805 $3,922 $107,727 Delaware Total All 950 331,813 10,909 11.5 $98,614,546 $103,805 $3,922 $107,727 Dist. of Columbia 0307 DD-incl. ID & ASD 1,592 576,322 18,948 11.9 $150,810,996 $94,731 $23,745 $118,476 Dist. of Columbia 0334 Aging/Physical Disabilities 3,340 921,140 30,284 9.1 $51,110,991 $15,303 $39,401 $54,704 Dist. of Columbia Total All 4,932 1,497,462 49,232 10.0 $201,921,987 $40,941 $34,347 $75,289 Florida 0010.90 Aging/Physical Disabilities 12,587 3,681,680 121,042 9.6 $140,238,535 $11,142 $4,945 $16,087 Florida 0010.91 DD-incl. ID & ASD 4,187 928,128 30,514 7.3 $168,169,478 $40,165 $6,888 $47,053 Florida 0116 Aging 1,500 411,575 13,531 9.0 $13,388,549 $8,926 $2,060 $10,986 Florida 0194 HIV/AIDS 8,022 2,350,181 77,266 9.6 $11,378,717 $1,418 $14,200 $15,618 Florida 0280 Aging/Physical Disabilities 3,635 951,958 31,297 8.6 $32,939,366 $9,062 $5,724 $14,786 Florida 0294 DD-incl. ID & ASD 5,016 825,873 27,152 5.4 $17,898,896 $3,568 $7,009 $10,577 Florida 0315 Aging 25,130 7,501,003 246,608 9.8 $217,080,492 $8,638 $1,321 $9,959 Florida 0342 Physical Disabilities 371 125,047 4,111 11.1 $11,952,228 $32,216 $13,395 $45,611 Florida 0392 DD-other specific diagnoses 124 40,809 1,342 10.8 $684,900 $5,523 $30,300 $35,823 Florida 0482 DD-incl. ID & ASD 4,033 1,084,625 35,659 8.8 $133,301,504 $33,053 $13,441 $46,494 Florida 0483 DD-incl. ID & ASD 5,605 1,494,369 49,130 8.8 $94,336,408 $16,831 $8,390 $25,221 Florida 0867 DD-incl. ID & ASD 19,366 3,614,136 118,821 6.1 $253,658,064 $13,098 $20,467 $33,565 Florida 40166 Physical Disabilities 5 973 32 6.4 $16,474 $3,295 $161,284 $164,579 Florida 40205 DD-other specific diagnoses 9 3,011 99 11.0 $43,834 $4,870 $14,420 $19,290 Florida Total All 89,590 23,013,368 756,604 8.4 $1,095,087,445 $12,223 $8,980 $21,203 Georgia 0112 Aging/Physical Disabilities 30,947 9,452,152 310,756 10.0 $400,659,209 $12,947 $6,553 $19,500 Georgia 0175 DD-incl. ID & ASD 5,313 1,808,804 59,468 11.2 $70,656,083 $13,299 $2,384 $15,683 Georgia 0323 DD-incl. ID & ASD 6,916 2,380,874 78,275 11.3 $377,985,228 $54,654 $4,196 $58,850 Georgia 4116 Medically Fragile 415 111,755 3,674 8.9 $13,971,390 $33,666 $40,159 $73,825 Georgia 4170 Physical Disabilities 1,157 386,689 12,713 11.0 $43,031,138 $37,192 $6,411 $43,603
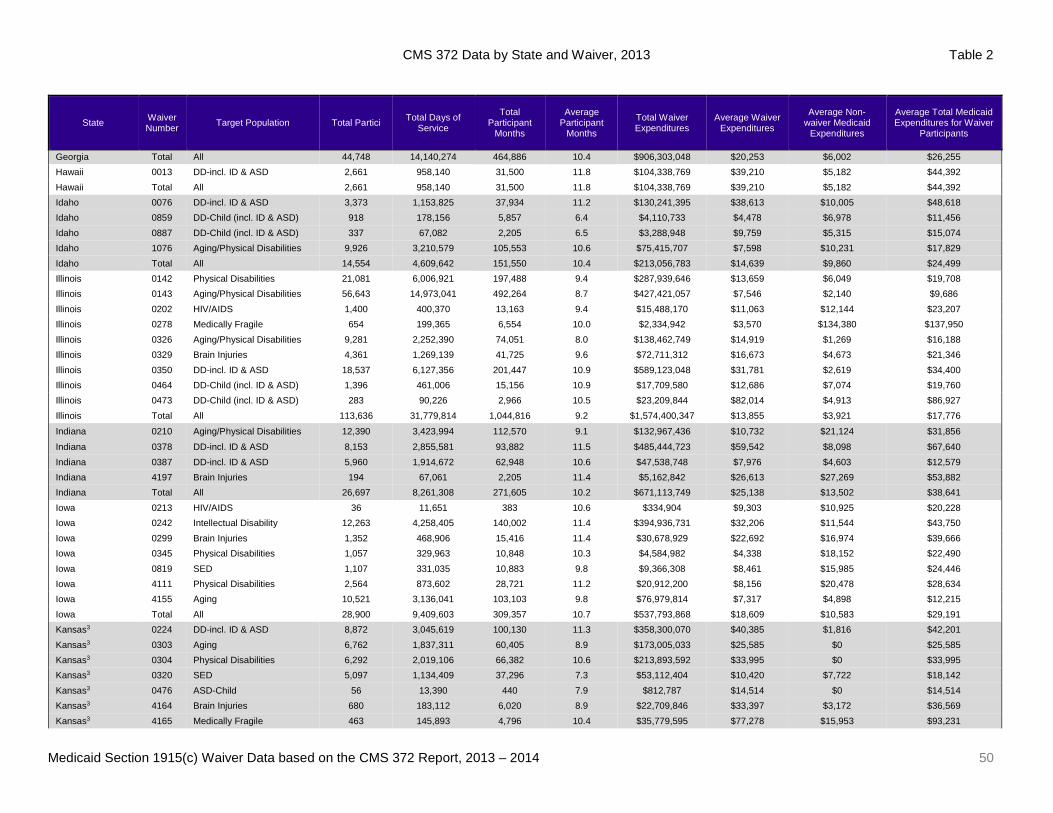
CMS 372 Data by State and Waiver, 2013 Table 2
Medicaid Section 1915(c) Waiver Data based on the CMS 372 Report, 2013 – 2014 50
State Waiver Number Target Population Total Partici Total Days of
Service
Total Participant
Months
Average Participant
Months
Total Waiver Expenditures
Average Waiver Expenditures
Average Non-waiver Medicaid
Expenditures
Average Total Medicaid Expenditures for Waiver
Participants
Georgia Total All 44,748 14,140,274 464,886 10.4 $906,303,048 $20,253 $6,002 $26,255 Hawaii 0013 DD-incl. ID & ASD 2,661 958,140 31,500 11.8 $104,338,769 $39,210 $5,182 $44,392 Hawaii Total All 2,661 958,140 31,500 11.8 $104,338,769 $39,210 $5,182 $44,392 Idaho 0076 DD-incl. ID & ASD 3,373 1,153,825 37,934 11.2 $130,241,395 $38,613 $10,005 $48,618 Idaho 0859 DD-Child (incl. ID & ASD) 918 178,156 5,857 6.4 $4,110,733 $4,478 $6,978 $11,456 Idaho 0887 DD-Child (incl. ID & ASD) 337 67,082 2,205 6.5 $3,288,948 $9,759 $5,315 $15,074 Idaho 1076 Aging/Physical Disabilities 9,926 3,210,579 105,553 10.6 $75,415,707 $7,598 $10,231 $17,829 Idaho Total All 14,554 4,609,642 151,550 10.4 $213,056,783 $14,639 $9,860 $24,499 Illinois 0142 Physical Disabilities 21,081 6,006,921 197,488 9.4 $287,939,646 $13,659 $6,049 $19,708 Illinois 0143 Aging/Physical Disabilities 56,643 14,973,041 492,264 8.7 $427,421,057 $7,546 $2,140 $9,686 Illinois 0202 HIV/AIDS 1,400 400,370 13,163 9.4 $15,488,170 $11,063 $12,144 $23,207 Illinois 0278 Medically Fragile 654 199,365 6,554 10.0 $2,334,942 $3,570 $134,380 $137,950 Illinois 0326 Aging/Physical Disabilities 9,281 2,252,390 74,051 8.0 $138,462,749 $14,919 $1,269 $16,188 Illinois 0329 Brain Injuries 4,361 1,269,139 41,725 9.6 $72,711,312 $16,673 $4,673 $21,346 Illinois 0350 DD-incl. ID & ASD 18,537 6,127,356 201,447 10.9 $589,123,048 $31,781 $2,619 $34,400 Illinois 0464 DD-Child (incl. ID & ASD) 1,396 461,006 15,156 10.9 $17,709,580 $12,686 $7,074 $19,760 Illinois 0473 DD-Child (incl. ID & ASD) 283 90,226 2,966 10.5 $23,209,844 $82,014 $4,913 $86,927 Illinois Total All 113,636 31,779,814 1,044,816 9.2 $1,574,400,347 $13,855 $3,921 $17,776
Indiana 0210 Aging/Physical Disabilities 12,390 3,423,994 112,570 9.1 $132,967,436 $10,732 $21,124 $31,856
Indiana 0378 DD-incl. ID & ASD 8,153 2,855,581 93,882 11.5 $485,444,723 $59,542 $8,098 $67,640 Indiana 0387 DD-incl. ID & ASD 5,960 1,914,672 62,948 10.6 $47,538,748 $7,976 $4,603 $12,579 Indiana 4197 Brain Injuries 194 67,061 2,205 11.4 $5,162,842 $26,613 $27,269 $53,882 Indiana Total All 26,697 8,261,308 271,605 10.2 $671,113,749 $25,138 $13,502 $38,641 Iowa 0213 HIV/AIDS 36 11,651 383 10.6 $334,904 $9,303 $10,925 $20,228 Iowa 0242 Intellectual Disability 12,263 4,258,405 140,002 11.4 $394,936,731 $32,206 $11,544 $43,750 Iowa 0299 Brain Injuries 1,352 468,906 15,416 11.4 $30,678,929 $22,692 $16,974 $39,666 Iowa 0345 Physical Disabilities 1,057 329,963 10,848 10.3 $4,584,982 $4,338 $18,152 $22,490 Iowa 0819 SED 1,107 331,035 10,883 9.8 $9,366,308 $8,461 $15,985 $24,446 Iowa 4111 Physical Disabilities 2,564 873,602 28,721 11.2 $20,912,200 $8,156 $20,478 $28,634 Iowa 4155 Aging 10,521 3,136,041 103,103 9.8 $76,979,814 $7,317 $4,898 $12,215 Iowa Total All 28,900 9,409,603 309,357 10.7 $537,793,868 $18,609 $10,583 $29,191 Kansas3 0224 DD-incl. ID & ASD 8,872 3,045,619 100,130 11.3 $358,300,070 $40,385 $1,816 $42,201 Kansas3 0303 Aging 6,762 1,837,311 60,405 8.9 $173,005,033 $25,585 $0 $25,585 Kansas3 0304 Physical Disabilities 6,292 2,019,106 66,382 10.6 $213,893,592 $33,995 $0 $33,995 Kansas3 0320 SED 5,097 1,134,409 37,296 7.3 $53,112,404 $10,420 $7,722 $18,142 Kansas3 0476 ASD-Child 56 13,390 440 7.9 $812,787 $14,514 $0 $14,514 Kansas3 4164 Brain Injuries 680 183,112 6,020 8.9 $22,709,846 $33,397 $3,172 $36,569 Kansas3 4165 Medically Fragile 463 145,893 4,796 10.4 $35,779,595 $77,278 $15,953 $93,231
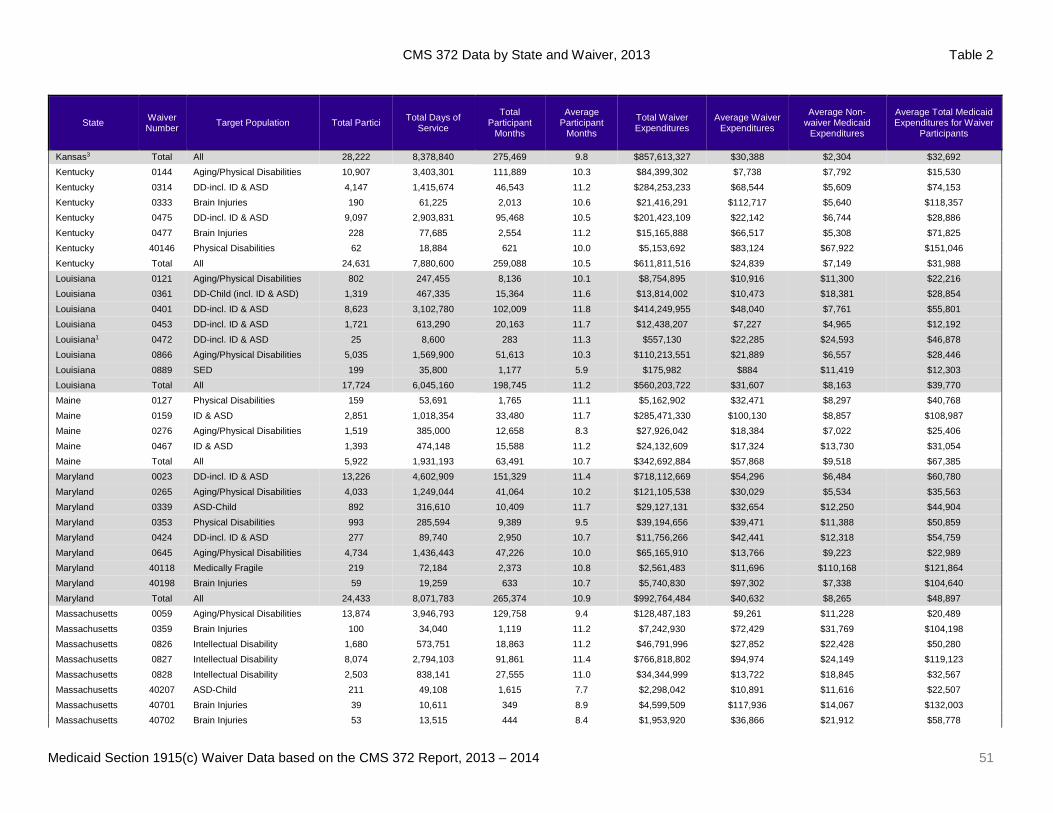
CMS 372 Data by State and Waiver, 2013 Table 2
Medicaid Section 1915(c) Waiver Data based on the CMS 372 Report, 2013 – 2014 51
State Waiver Number Target Population Total Partici Total Days of
Service
Total Participant
Months
Average Participant
Months
Total Waiver Expenditures
Average Waiver Expenditures
Average Non-waiver Medicaid
Expenditures
Average Total Medicaid Expenditures for Waiver
Participants
Kansas3 Total All 28,222 8,378,840 275,469 9.8 $857,613,327 $30,388 $2,304 $32,692 Kentucky 0144 Aging/Physical Disabilities 10,907 3,403,301 111,889 10.3 $84,399,302 $7,738 $7,792 $15,530 Kentucky 0314 DD-incl. ID & ASD 4,147 1,415,674 46,543 11.2 $284,253,233 $68,544 $5,609 $74,153 Kentucky 0333 Brain Injuries 190 61,225 2,013 10.6 $21,416,291 $112,717 $5,640 $118,357 Kentucky 0475 DD-incl. ID & ASD 9,097 2,903,831 95,468 10.5 $201,423,109 $22,142 $6,744 $28,886 Kentucky 0477 Brain Injuries 228 77,685 2,554 11.2 $15,165,888 $66,517 $5,308 $71,825 Kentucky 40146 Physical Disabilities 62 18,884 621 10.0 $5,153,692 $83,124 $67,922 $151,046 Kentucky Total All 24,631 7,880,600 259,088 10.5 $611,811,516 $24,839 $7,149 $31,988 Louisiana 0121 Aging/Physical Disabilities 802 247,455 8,136 10.1 $8,754,895 $10,916 $11,300 $22,216 Louisiana 0361 DD-Child (incl. ID & ASD) 1,319 467,335 15,364 11.6 $13,814,002 $10,473 $18,381 $28,854 Louisiana 0401 DD-incl. ID & ASD 8,623 3,102,780 102,009 11.8 $414,249,955 $48,040 $7,761 $55,801 Louisiana 0453 DD-incl. ID & ASD 1,721 613,290 20,163 11.7 $12,438,207 $7,227 $4,965 $12,192 Louisiana1 0472 DD-incl. ID & ASD 25 8,600 283 11.3 $557,130 $22,285 $24,593 $46,878 Louisiana 0866 Aging/Physical Disabilities 5,035 1,569,900 51,613 10.3 $110,213,551 $21,889 $6,557 $28,446 Louisiana 0889 SED 199 35,800 1,177 5.9 $175,982 $884 $11,419 $12,303 Louisiana Total All 17,724 6,045,160 198,745 11.2 $560,203,722 $31,607 $8,163 $39,770 Maine 0127 Physical Disabilities 159 53,691 1,765 11.1 $5,162,902 $32,471 $8,297 $40,768 Maine 0159 ID & ASD 2,851 1,018,354 33,480 11.7 $285,471,330 $100,130 $8,857 $108,987 Maine 0276 Aging/Physical Disabilities 1,519 385,000 12,658 8.3 $27,926,042 $18,384 $7,022 $25,406 Maine 0467 ID & ASD 1,393 474,148 15,588 11.2 $24,132,609 $17,324 $13,730 $31,054 Maine Total All 5,922 1,931,193 63,491 10.7 $342,692,884 $57,868 $9,518 $67,385 Maryland 0023 DD-incl. ID & ASD 13,226 4,602,909 151,329 11.4 $718,112,669 $54,296 $6,484 $60,780 Maryland 0265 Aging/Physical Disabilities 4,033 1,249,044 41,064 10.2 $121,105,538 $30,029 $5,534 $35,563 Maryland 0339 ASD-Child 892 316,610 10,409 11.7 $29,127,131 $32,654 $12,250 $44,904 Maryland 0353 Physical Disabilities 993 285,594 9,389 9.5 $39,194,656 $39,471 $11,388 $50,859 Maryland 0424 DD-incl. ID & ASD 277 89,740 2,950 10.7 $11,756,266 $42,441 $12,318 $54,759 Maryland 0645 Aging/Physical Disabilities 4,734 1,436,443 47,226 10.0 $65,165,910 $13,766 $9,223 $22,989 Maryland 40118 Medically Fragile 219 72,184 2,373 10.8 $2,561,483 $11,696 $110,168 $121,864 Maryland 40198 Brain Injuries 59 19,259 633 10.7 $5,740,830 $97,302 $7,338 $104,640 Maryland Total All 24,433 8,071,783 265,374 10.9 $992,764,484 $40,632 $8,265 $48,897 Massachusetts 0059 Aging/Physical Disabilities 13,874 3,946,793 129,758 9.4 $128,487,183 $9,261 $11,228 $20,489 Massachusetts 0359 Brain Injuries 100 34,040 1,119 11.2 $7,242,930 $72,429 $31,769 $104,198 Massachusetts 0826 Intellectual Disability 1,680 573,751 18,863 11.2 $46,791,996 $27,852 $22,428 $50,280 Massachusetts 0827 Intellectual Disability 8,074 2,794,103 91,861 11.4 $766,818,802 $94,974 $24,149 $119,123 Massachusetts 0828 Intellectual Disability 2,503 838,141 27,555 11.0 $34,344,999 $13,722 $18,845 $32,567 Massachusetts 40207 ASD-Child 211 49,108 1,615 7.7 $2,298,042 $10,891 $11,616 $22,507 Massachusetts 40701 Brain Injuries 39 10,611 349 8.9 $4,599,509 $117,936 $14,067 $132,003 Massachusetts 40702 Brain Injuries 53 13,515 444 8.4 $1,953,920 $36,866 $21,912 $58,778
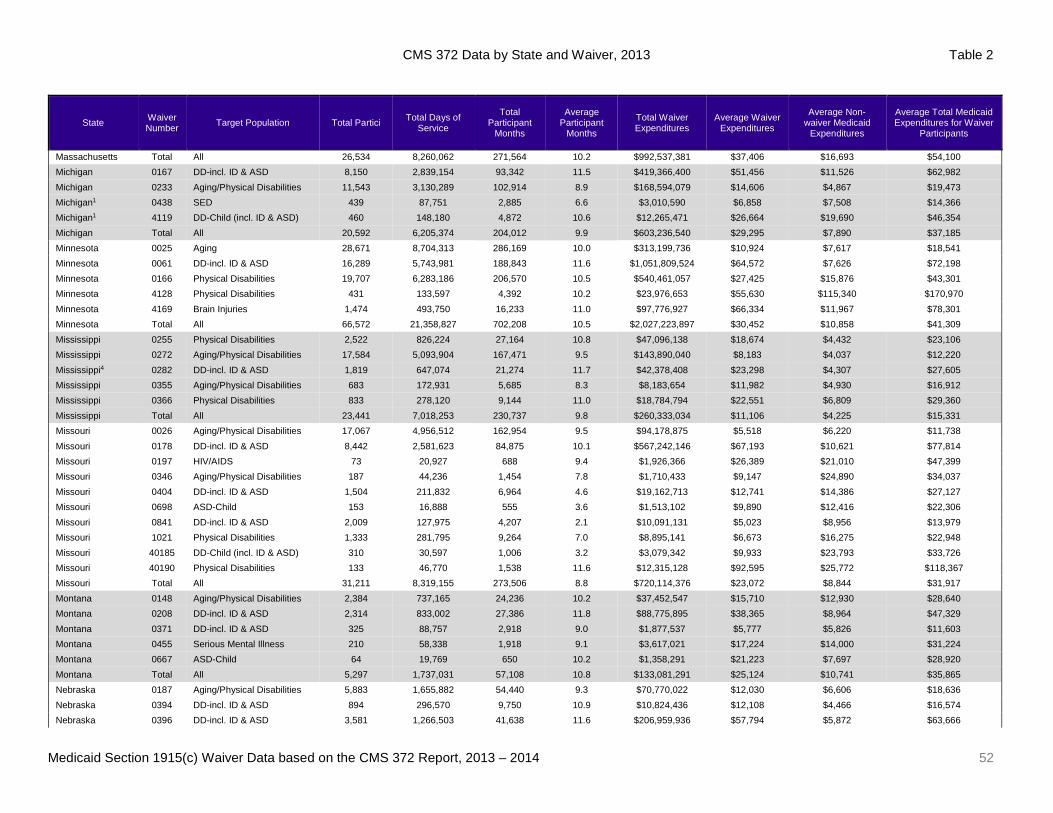
CMS 372 Data by State and Waiver, 2013 Table 2
Medicaid Section 1915(c) Waiver Data based on the CMS 372 Report, 2013 – 2014 52
State Waiver Number Target Population Total Partici Total Days of
Service
Total Participant
Months
Average Participant
Months
Total Waiver Expenditures
Average Waiver Expenditures
Average Non-waiver Medicaid
Expenditures
Average Total Medicaid Expenditures for Waiver
Participants
Massachusetts Total All 26,534 8,260,062 271,564 10.2 $992,537,381 $37,406 $16,693 $54,100 Michigan 0167 DD-incl. ID & ASD 8,150 2,839,154 93,342 11.5 $419,366,400 $51,456 $11,526 $62,982 Michigan 0233 Aging/Physical Disabilities 11,543 3,130,289 102,914 8.9 $168,594,079 $14,606 $4,867 $19,473 Michigan1 0438 SED 439 87,751 2,885 6.6 $3,010,590 $6,858 $7,508 $14,366 Michigan1 4119 DD-Child (incl. ID & ASD) 460 148,180 4,872 10.6 $12,265,471 $26,664 $19,690 $46,354 Michigan Total All 20,592 6,205,374 204,012 9.9 $603,236,540 $29,295 $7,890 $37,185 Minnesota 0025 Aging 28,671 8,704,313 286,169 10.0 $313,199,736 $10,924 $7,617 $18,541 Minnesota 0061 DD-incl. ID & ASD 16,289 5,743,981 188,843 11.6 $1,051,809,524 $64,572 $7,626 $72,198 Minnesota 0166 Physical Disabilities 19,707 6,283,186 206,570 10.5 $540,461,057 $27,425 $15,876 $43,301 Minnesota 4128 Physical Disabilities 431 133,597 4,392 10.2 $23,976,653 $55,630 $115,340 $170,970 Minnesota 4169 Brain Injuries 1,474 493,750 16,233 11.0 $97,776,927 $66,334 $11,967 $78,301 Minnesota Total All 66,572 21,358,827 702,208 10.5 $2,027,223,897 $30,452 $10,858 $41,309 Mississippi 0255 Physical Disabilities 2,522 826,224 27,164 10.8 $47,096,138 $18,674 $4,432 $23,106 Mississippi 0272 Aging/Physical Disabilities 17,584 5,093,904 167,471 9.5 $143,890,040 $8,183 $4,037 $12,220 Mississippi4 0282 DD-incl. ID & ASD 1,819 647,074 21,274 11.7 $42,378,408 $23,298 $4,307 $27,605 Mississippi 0355 Aging/Physical Disabilities 683 172,931 5,685 8.3 $8,183,654 $11,982 $4,930 $16,912 Mississippi 0366 Physical Disabilities 833 278,120 9,144 11.0 $18,784,794 $22,551 $6,809 $29,360 Mississippi Total All 23,441 7,018,253 230,737 9.8 $260,333,034 $11,106 $4,225 $15,331 Missouri 0026 Aging/Physical Disabilities 17,067 4,956,512 162,954 9.5 $94,178,875 $5,518 $6,220 $11,738 Missouri 0178 DD-incl. ID & ASD 8,442 2,581,623 84,875 10.1 $567,242,146 $67,193 $10,621 $77,814 Missouri 0197 HIV/AIDS 73 20,927 688 9.4 $1,926,366 $26,389 $21,010 $47,399 Missouri 0346 Aging/Physical Disabilities 187 44,236 1,454 7.8 $1,710,433 $9,147 $24,890 $34,037 Missouri 0404 DD-incl. ID & ASD 1,504 211,832 6,964 4.6 $19,162,713 $12,741 $14,386 $27,127 Missouri 0698 ASD-Child 153 16,888 555 3.6 $1,513,102 $9,890 $12,416 $22,306 Missouri 0841 DD-incl. ID & ASD 2,009 127,975 4,207 2.1 $10,091,131 $5,023 $8,956 $13,979 Missouri 1021 Physical Disabilities 1,333 281,795 9,264 7.0 $8,895,141 $6,673 $16,275 $22,948 Missouri 40185 DD-Child (incl. ID & ASD) 310 30,597 1,006 3.2 $3,079,342 $9,933 $23,793 $33,726 Missouri 40190 Physical Disabilities 133 46,770 1,538 11.6 $12,315,128 $92,595 $25,772 $118,367 Missouri Total All 31,211 8,319,155 273,506 8.8 $720,114,376 $23,072 $8,844 $31,917 Montana 0148 Aging/Physical Disabilities 2,384 737,165 24,236 10.2 $37,452,547 $15,710 $12,930 $28,640 Montana 0208 DD-incl. ID & ASD 2,314 833,002 27,386 11.8 $88,775,895 $38,365 $8,964 $47,329 Montana 0371 DD-incl. ID & ASD 325 88,757 2,918 9.0 $1,877,537 $5,777 $5,826 $11,603 Montana 0455 Serious Mental Illness 210 58,338 1,918 9.1 $3,617,021 $17,224 $14,000 $31,224 Montana 0667 ASD-Child 64 19,769 650 10.2 $1,358,291 $21,223 $7,697 $28,920 Montana Total All 5,297 1,737,031 57,108 10.8 $133,081,291 $25,124 $10,741 $35,865 Nebraska 0187 Aging/Physical Disabilities 5,883 1,655,882 54,440 9.3 $70,770,022 $12,030 $6,606 $18,636 Nebraska 0394 DD-incl. ID & ASD 894 296,570 9,750 10.9 $10,824,436 $12,108 $4,466 $16,574 Nebraska 0396 DD-incl. ID & ASD 3,581 1,266,503 41,638 11.6 $206,959,936 $57,794 $5,872 $63,666
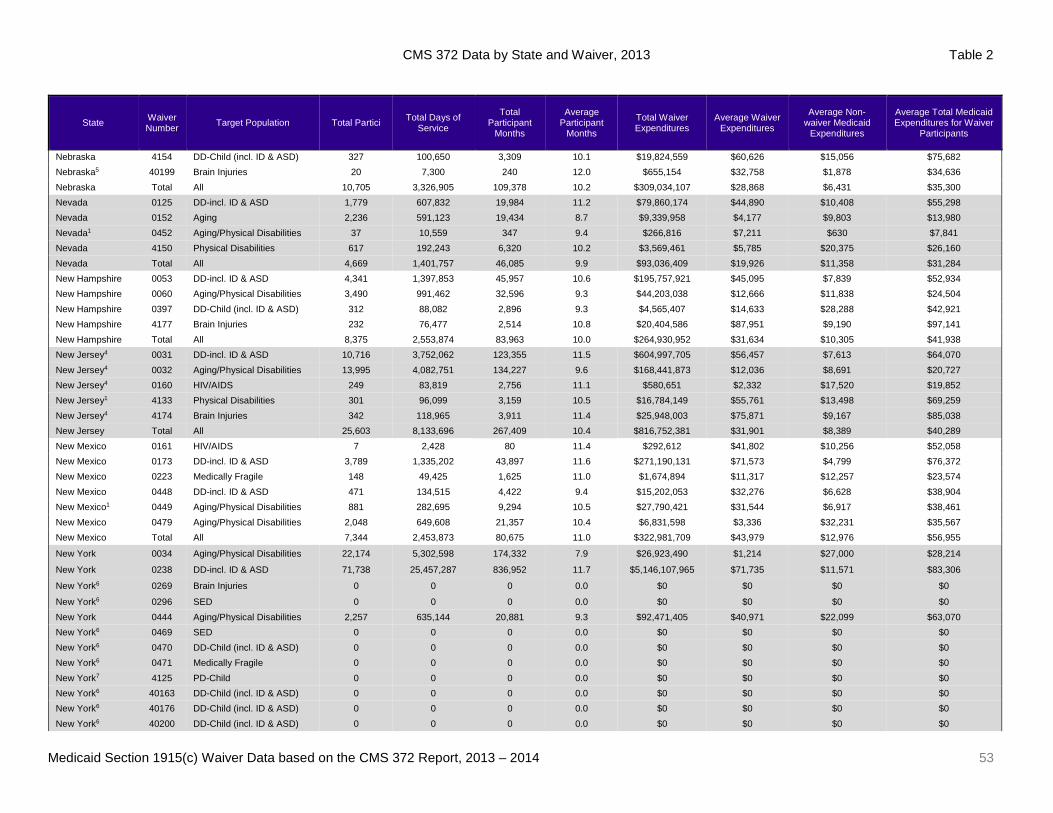
CMS 372 Data by State and Waiver, 2013 Table 2
Medicaid Section 1915(c) Waiver Data based on the CMS 372 Report, 2013 – 2014 53
State Waiver Number Target Population Total Partici Total Days of
Service
Total Participant
Months
Average Participant
Months
Total Waiver Expenditures
Average Waiver Expenditures
Average Non-waiver Medicaid
Expenditures
Average Total Medicaid Expenditures for Waiver
Participants
Nebraska 4154 DD-Child (incl. ID & ASD) 327 100,650 3,309 10.1 $19,824,559 $60,626 $15,056 $75,682 Nebraska5 40199 Brain Injuries 20 7,300 240 12.0 $655,154 $32,758 $1,878 $34,636 Nebraska Total All 10,705 3,326,905 109,378 10.2 $309,034,107 $28,868 $6,431 $35,300 Nevada 0125 DD-incl. ID & ASD 1,779 607,832 19,984 11.2 $79,860,174 $44,890 $10,408 $55,298 Nevada 0152 Aging 2,236 591,123 19,434 8.7 $9,339,958 $4,177 $9,803 $13,980 Nevada1 0452 Aging/Physical Disabilities 37 10,559 347 9.4 $266,816 $7,211 $630 $7,841 Nevada 4150 Physical Disabilities 617 192,243 6,320 10.2 $3,569,461 $5,785 $20,375 $26,160 Nevada Total All 4,669 1,401,757 46,085 9.9 $93,036,409 $19,926 $11,358 $31,284 New Hampshire 0053 DD-incl. ID & ASD 4,341 1,397,853 45,957 10.6 $195,757,921 $45,095 $7,839 $52,934 New Hampshire 0060 Aging/Physical Disabilities 3,490 991,462 32,596 9.3 $44,203,038 $12,666 $11,838 $24,504 New Hampshire 0397 DD-Child (incl. ID & ASD) 312 88,082 2,896 9.3 $4,565,407 $14,633 $28,288 $42,921 New Hampshire 4177 Brain Injuries 232 76,477 2,514 10.8 $20,404,586 $87,951 $9,190 $97,141 New Hampshire Total All 8,375 2,553,874 83,963 10.0 $264,930,952 $31,634 $10,305 $41,938 New Jersey4 0031 DD-incl. ID & ASD 10,716 3,752,062 123,355 11.5 $604,997,705 $56,457 $7,613 $64,070 New Jersey4 0032 Aging/Physical Disabilities 13,995 4,082,751 134,227 9.6 $168,441,873 $12,036 $8,691 $20,727 New Jersey4 0160 HIV/AIDS 249 83,819 2,756 11.1 $580,651 $2,332 $17,520 $19,852 New Jersey1 4133 Physical Disabilities 301 96,099 3,159 10.5 $16,784,149 $55,761 $13,498 $69,259 New Jersey4 4174 Brain Injuries 342 118,965 3,911 11.4 $25,948,003 $75,871 $9,167 $85,038 New Jersey Total All 25,603 8,133,696 267,409 10.4 $816,752,381 $31,901 $8,389 $40,289 New Mexico 0161 HIV/AIDS 7 2,428 80 11.4 $292,612 $41,802 $10,256 $52,058 New Mexico 0173 DD-incl. ID & ASD 3,789 1,335,202 43,897 11.6 $271,190,131 $71,573 $4,799 $76,372 New Mexico 0223 Medically Fragile 148 49,425 1,625 11.0 $1,674,894 $11,317 $12,257 $23,574 New Mexico 0448 DD-incl. ID & ASD 471 134,515 4,422 9.4 $15,202,053 $32,276 $6,628 $38,904 New Mexico1 0449 Aging/Physical Disabilities 881 282,695 9,294 10.5 $27,790,421 $31,544 $6,917 $38,461 New Mexico 0479 Aging/Physical Disabilities 2,048 649,608 21,357 10.4 $6,831,598 $3,336 $32,231 $35,567 New Mexico Total All 7,344 2,453,873 80,675 11.0 $322,981,709 $43,979 $12,976 $56,955
New York 0034 Aging/Physical Disabilities 22,174 5,302,598 174,332 7.9 $26,923,490 $1,214 $27,000 $28,214
New York 0238 DD-incl. ID & ASD 71,738 25,457,287 836,952 11.7 $5,146,107,965 $71,735 $11,571 $83,306
New York6 0269 Brain Injuries 0 0 0 0.0 $0 $0 $0 $0
New York6 0296 SED 0 0 0 0.0 $0 $0 $0 $0 New York 0444 Aging/Physical Disabilities 2,257 635,144 20,881 9.3 $92,471,405 $40,971 $22,099 $63,070 New York6 0469 SED 0 0 0 0.0 $0 $0 $0 $0 New York6 0470 DD-Child (incl. ID & ASD) 0 0 0 0.0 $0 $0 $0 $0 New York6 0471 Medically Fragile 0 0 0 0.0 $0 $0 $0 $0 New York7 4125 PD-Child 0 0 0 0.0 $0 $0 $0 $0 New York6 40163 DD-Child (incl. ID & ASD) 0 0 0 0.0 $0 $0 $0 $0 New York6 40176 DD-Child (incl. ID & ASD) 0 0 0 0.0 $0 $0 $0 $0 New York6 40200 DD-Child (incl. ID & ASD) 0 0 0 0.0 $0 $0 $0 $0
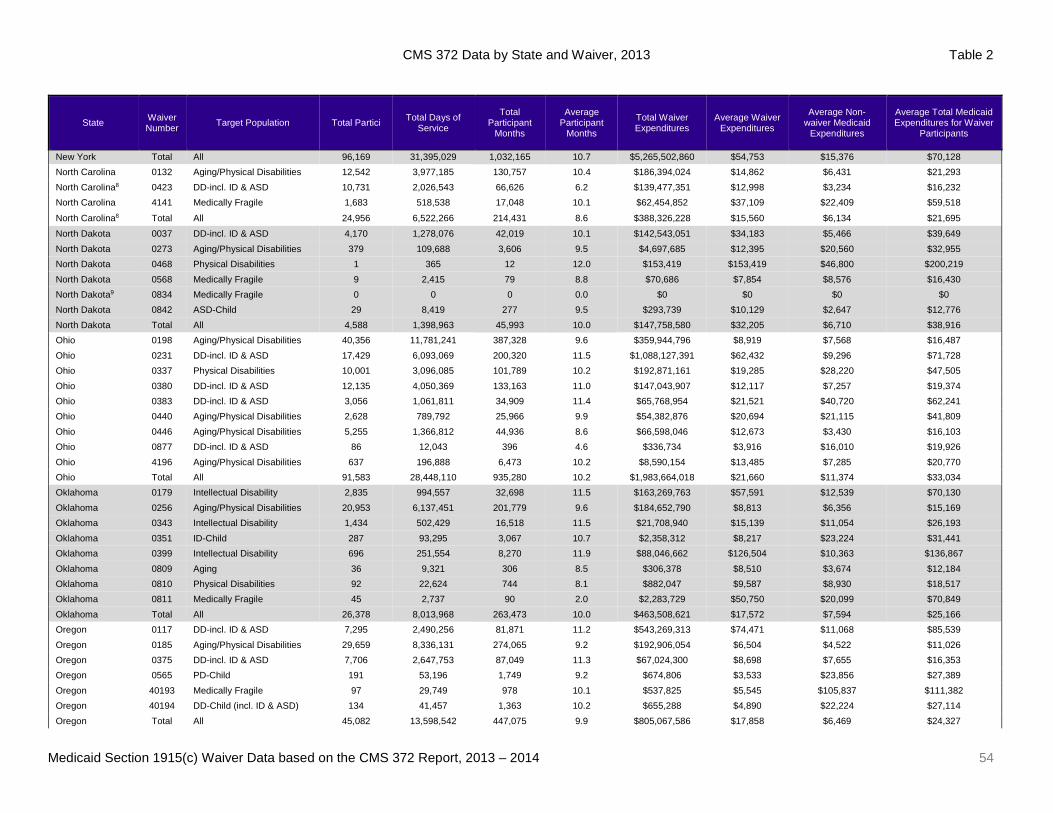
CMS 372 Data by State and Waiver, 2013 Table 2
Medicaid Section 1915(c) Waiver Data based on the CMS 372 Report, 2013 – 2014 54
State Waiver Number Target Population Total Partici Total Days of
Service
Total Participant
Months
Average Participant
Months
Total Waiver Expenditures
Average Waiver Expenditures
Average Non-waiver Medicaid
Expenditures
Average Total Medicaid Expenditures for Waiver
Participants
New York Total All 96,169 31,395,029 1,032,165 10.7 $5,265,502,860 $54,753 $15,376 $70,128 North Carolina 0132 Aging/Physical Disabilities 12,542 3,977,185 130,757 10.4 $186,394,024 $14,862 $6,431 $21,293 North Carolina8 0423 DD-incl. ID & ASD 10,731 2,026,543 66,626 6.2 $139,477,351 $12,998 $3,234 $16,232 North Carolina 4141 Medically Fragile 1,683 518,538 17,048 10.1 $62,454,852 $37,109 $22,409 $59,518
North Carolina8 Total All 24,956 6,522,266 214,431 8.6 $388,326,228 $15,560 $6,134 $21,695
North Dakota 0037 DD-incl. ID & ASD 4,170 1,278,076 42,019 10.1 $142,543,051 $34,183 $5,466 $39,649 North Dakota 0273 Aging/Physical Disabilities 379 109,688 3,606 9.5 $4,697,685 $12,395 $20,560 $32,955 North Dakota 0468 Physical Disabilities 1 365 12 12.0 $153,419 $153,419 $46,800 $200,219 North Dakota 0568 Medically Fragile 9 2,415 79 8.8 $70,686 $7,854 $8,576 $16,430 North Dakota9 0834 Medically Fragile 0 0 0 0.0 $0 $0 $0 $0 North Dakota 0842 ASD-Child 29 8,419 277 9.5 $293,739 $10,129 $2,647 $12,776 North Dakota Total All 4,588 1,398,963 45,993 10.0 $147,758,580 $32,205 $6,710 $38,916 Ohio 0198 Aging/Physical Disabilities 40,356 11,781,241 387,328 9.6 $359,944,796 $8,919 $7,568 $16,487 Ohio 0231 DD-incl. ID & ASD 17,429 6,093,069 200,320 11.5 $1,088,127,391 $62,432 $9,296 $71,728 Ohio 0337 Physical Disabilities 10,001 3,096,085 101,789 10.2 $192,871,161 $19,285 $28,220 $47,505 Ohio 0380 DD-incl. ID & ASD 12,135 4,050,369 133,163 11.0 $147,043,907 $12,117 $7,257 $19,374 Ohio 0383 DD-incl. ID & ASD 3,056 1,061,811 34,909 11.4 $65,768,954 $21,521 $40,720 $62,241 Ohio 0440 Aging/Physical Disabilities 2,628 789,792 25,966 9.9 $54,382,876 $20,694 $21,115 $41,809 Ohio 0446 Aging/Physical Disabilities 5,255 1,366,812 44,936 8.6 $66,598,046 $12,673 $3,430 $16,103 Ohio 0877 DD-incl. ID & ASD 86 12,043 396 4.6 $336,734 $3,916 $16,010 $19,926 Ohio 4196 Aging/Physical Disabilities 637 196,888 6,473 10.2 $8,590,154 $13,485 $7,285 $20,770 Ohio Total All 91,583 28,448,110 935,280 10.2 $1,983,664,018 $21,660 $11,374 $33,034 Oklahoma 0179 Intellectual Disability 2,835 994,557 32,698 11.5 $163,269,763 $57,591 $12,539 $70,130 Oklahoma 0256 Aging/Physical Disabilities 20,953 6,137,451 201,779 9.6 $184,652,790 $8,813 $6,356 $15,169 Oklahoma 0343 Intellectual Disability 1,434 502,429 16,518 11.5 $21,708,940 $15,139 $11,054 $26,193 Oklahoma 0351 ID-Child 287 93,295 3,067 10.7 $2,358,312 $8,217 $23,224 $31,441 Oklahoma 0399 Intellectual Disability 696 251,554 8,270 11.9 $88,046,662 $126,504 $10,363 $136,867 Oklahoma 0809 Aging 36 9,321 306 8.5 $306,378 $8,510 $3,674 $12,184 Oklahoma 0810 Physical Disabilities 92 22,624 744 8.1 $882,047 $9,587 $8,930 $18,517 Oklahoma 0811 Medically Fragile 45 2,737 90 2.0 $2,283,729 $50,750 $20,099 $70,849 Oklahoma Total All 26,378 8,013,968 263,473 10.0 $463,508,621 $17,572 $7,594 $25,166 Oregon 0117 DD-incl. ID & ASD 7,295 2,490,256 81,871 11.2 $543,269,313 $74,471 $11,068 $85,539 Oregon 0185 Aging/Physical Disabilities 29,659 8,336,131 274,065 9.2 $192,906,054 $6,504 $4,522 $11,026 Oregon 0375 DD-incl. ID & ASD 7,706 2,647,753 87,049 11.3 $67,024,300 $8,698 $7,655 $16,353 Oregon 0565 PD-Child 191 53,196 1,749 9.2 $674,806 $3,533 $23,856 $27,389 Oregon 40193 Medically Fragile 97 29,749 978 10.1 $537,825 $5,545 $105,837 $111,382 Oregon 40194 DD-Child (incl. ID & ASD) 134 41,457 1,363 10.2 $655,288 $4,890 $22,224 $27,114 Oregon Total All 45,082 13,598,542 447,075 9.9 $805,067,586 $17,858 $6,469 $24,327
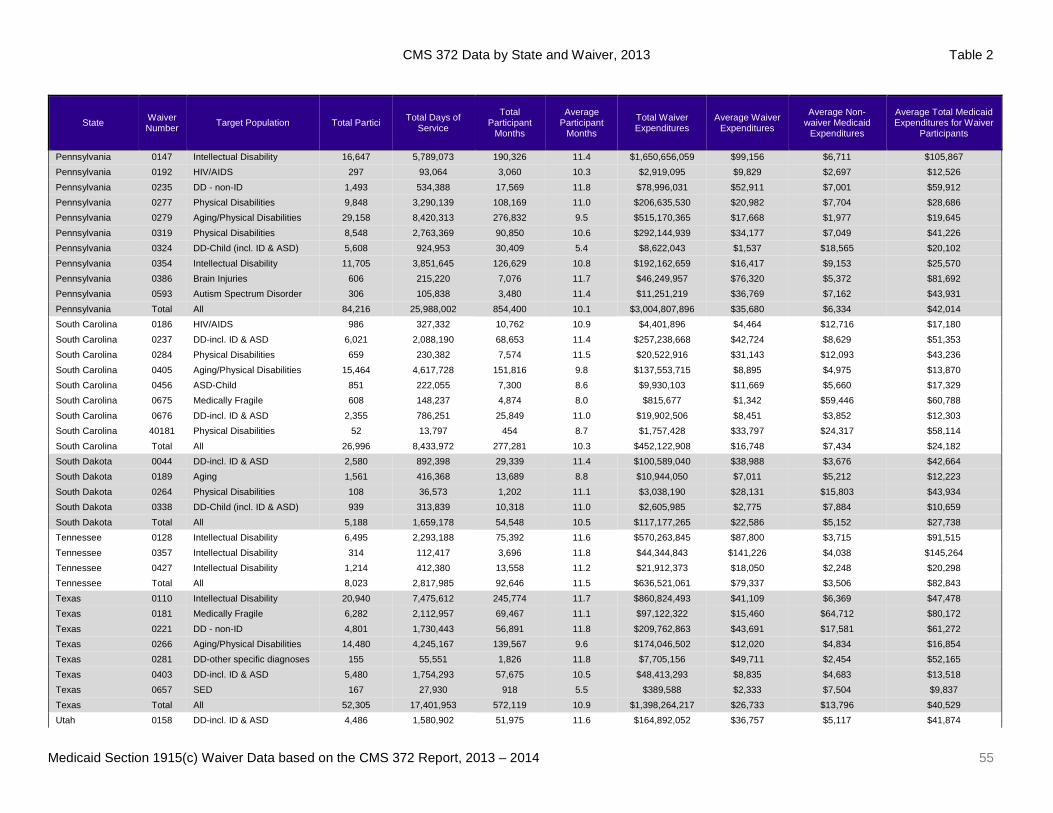
CMS 372 Data by State and Waiver, 2013 Table 2
Medicaid Section 1915(c) Waiver Data based on the CMS 372 Report, 2013 – 2014 55
State Waiver Number Target Population Total Partici Total Days of
Service
Total Participant
Months
Average Participant
Months
Total Waiver Expenditures
Average Waiver Expenditures
Average Non-waiver Medicaid
Expenditures
Average Total Medicaid Expenditures for Waiver
Participants
Pennsylvania 0147 Intellectual Disability 16,647 5,789,073 190,326 11.4 $1,650,656,059 $99,156 $6,711 $105,867 Pennsylvania 0192 HIV/AIDS 297 93,064 3,060 10.3 $2,919,095 $9,829 $2,697 $12,526 Pennsylvania 0235 DD - non-ID 1,493 534,388 17,569 11.8 $78,996,031 $52,911 $7,001 $59,912 Pennsylvania 0277 Physical Disabilities 9,848 3,290,139 108,169 11.0 $206,635,530 $20,982 $7,704 $28,686 Pennsylvania 0279 Aging/Physical Disabilities 29,158 8,420,313 276,832 9.5 $515,170,365 $17,668 $1,977 $19,645 Pennsylvania 0319 Physical Disabilities 8,548 2,763,369 90,850 10.6 $292,144,939 $34,177 $7,049 $41,226 Pennsylvania 0324 DD-Child (incl. ID & ASD) 5,608 924,953 30,409 5.4 $8,622,043 $1,537 $18,565 $20,102 Pennsylvania 0354 Intellectual Disability 11,705 3,851,645 126,629 10.8 $192,162,659 $16,417 $9,153 $25,570 Pennsylvania 0386 Brain Injuries 606 215,220 7,076 11.7 $46,249,957 $76,320 $5,372 $81,692 Pennsylvania 0593 Autism Spectrum Disorder 306 105,838 3,480 11.4 $11,251,219 $36,769 $7,162 $43,931 Pennsylvania Total All 84,216 25,988,002 854,400 10.1 $3,004,807,896 $35,680 $6,334 $42,014 South Carolina 0186 HIV/AIDS 986 327,332 10,762 10.9 $4,401,896 $4,464 $12,716 $17,180 South Carolina 0237 DD-incl. ID & ASD 6,021 2,088,190 68,653 11.4 $257,238,668 $42,724 $8,629 $51,353 South Carolina 0284 Physical Disabilities 659 230,382 7,574 11.5 $20,522,916 $31,143 $12,093 $43,236 South Carolina 0405 Aging/Physical Disabilities 15,464 4,617,728 151,816 9.8 $137,553,715 $8,895 $4,975 $13,870 South Carolina 0456 ASD-Child 851 222,055 7,300 8.6 $9,930,103 $11,669 $5,660 $17,329 South Carolina 0675 Medically Fragile 608 148,237 4,874 8.0 $815,677 $1,342 $59,446 $60,788 South Carolina 0676 DD-incl. ID & ASD 2,355 786,251 25,849 11.0 $19,902,506 $8,451 $3,852 $12,303 South Carolina 40181 Physical Disabilities 52 13,797 454 8.7 $1,757,428 $33,797 $24,317 $58,114 South Carolina Total All 26,996 8,433,972 277,281 10.3 $452,122,908 $16,748 $7,434 $24,182 South Dakota 0044 DD-incl. ID & ASD 2,580 892,398 29,339 11.4 $100,589,040 $38,988 $3,676 $42,664 South Dakota 0189 Aging 1,561 416,368 13,689 8.8 $10,944,050 $7,011 $5,212 $12,223 South Dakota 0264 Physical Disabilities 108 36,573 1,202 11.1 $3,038,190 $28,131 $15,803 $43,934 South Dakota 0338 DD-Child (incl. ID & ASD) 939 313,839 10,318 11.0 $2,605,985 $2,775 $7,884 $10,659 South Dakota Total All 5,188 1,659,178 54,548 10.5 $117,177,265 $22,586 $5,152 $27,738 Tennessee 0128 Intellectual Disability 6,495 2,293,188 75,392 11.6 $570,263,845 $87,800 $3,715 $91,515 Tennessee 0357 Intellectual Disability 314 112,417 3,696 11.8 $44,344,843 $141,226 $4,038 $145,264 Tennessee 0427 Intellectual Disability 1,214 412,380 13,558 11.2 $21,912,373 $18,050 $2,248 $20,298 Tennessee Total All 8,023 2,817,985 92,646 11.5 $636,521,061 $79,337 $3,506 $82,843 Texas 0110 Intellectual Disability 20,940 7,475,612 245,774 11.7 $860,824,493 $41,109 $6,369 $47,478 Texas 0181 Medically Fragile 6,282 2,112,957 69,467 11.1 $97,122,322 $15,460 $64,712 $80,172 Texas 0221 DD - non-ID 4,801 1,730,443 56,891 11.8 $209,762,863 $43,691 $17,581 $61,272 Texas 0266 Aging/Physical Disabilities 14,480 4,245,167 139,567 9.6 $174,046,502 $12,020 $4,834 $16,854 Texas 0281 DD-other specific diagnoses 155 55,551 1,826 11.8 $7,705,156 $49,711 $2,454 $52,165 Texas 0403 DD-incl. ID & ASD 5,480 1,754,293 57,675 10.5 $48,413,293 $8,835 $4,683 $13,518 Texas 0657 SED 167 27,930 918 5.5 $389,588 $2,333 $7,504 $9,837 Texas Total All 52,305 17,401,953 572,119 10.9 $1,398,264,217 $26,733 $13,796 $40,529 Utah 0158 DD-incl. ID & ASD 4,486 1,580,902 51,975 11.6 $164,892,052 $36,757 $5,117 $41,874
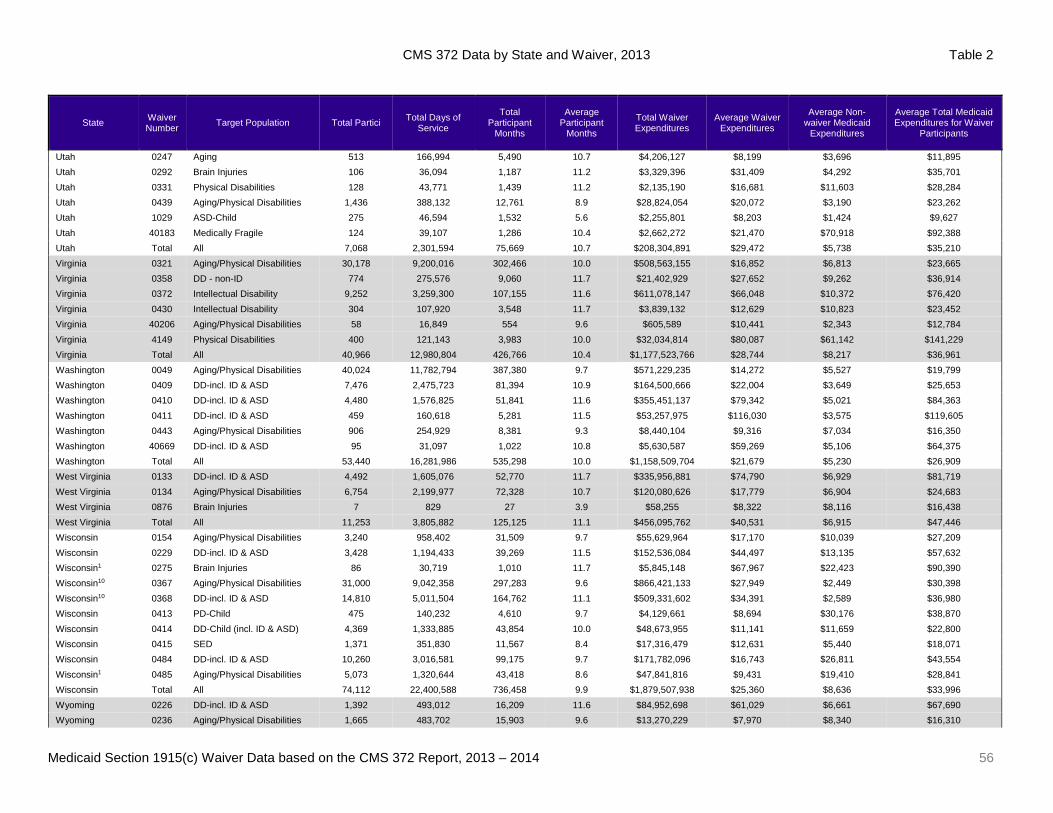
CMS 372 Data by State and Waiver, 2013 Table 2
Medicaid Section 1915(c) Waiver Data based on the CMS 372 Report, 2013 – 2014 56
State Waiver Number Target Population Total Partici Total Days of
Service
Total Participant
Months
Average Participant
Months
Total Waiver Expenditures
Average Waiver Expenditures
Average Non-waiver Medicaid
Expenditures
Average Total Medicaid Expenditures for Waiver
Participants
Utah 0247 Aging 513 166,994 5,490 10.7 $4,206,127 $8,199 $3,696 $11,895 Utah 0292 Brain Injuries 106 36,094 1,187 11.2 $3,329,396 $31,409 $4,292 $35,701 Utah 0331 Physical Disabilities 128 43,771 1,439 11.2 $2,135,190 $16,681 $11,603 $28,284 Utah 0439 Aging/Physical Disabilities 1,436 388,132 12,761 8.9 $28,824,054 $20,072 $3,190 $23,262 Utah 1029 ASD-Child 275 46,594 1,532 5.6 $2,255,801 $8,203 $1,424 $9,627 Utah 40183 Medically Fragile 124 39,107 1,286 10.4 $2,662,272 $21,470 $70,918 $92,388 Utah Total All 7,068 2,301,594 75,669 10.7 $208,304,891 $29,472 $5,738 $35,210 Virginia 0321 Aging/Physical Disabilities 30,178 9,200,016 302,466 10.0 $508,563,155 $16,852 $6,813 $23,665 Virginia 0358 DD - non-ID 774 275,576 9,060 11.7 $21,402,929 $27,652 $9,262 $36,914 Virginia 0372 Intellectual Disability 9,252 3,259,300 107,155 11.6 $611,078,147 $66,048 $10,372 $76,420 Virginia 0430 Intellectual Disability 304 107,920 3,548 11.7 $3,839,132 $12,629 $10,823 $23,452 Virginia 40206 Aging/Physical Disabilities 58 16,849 554 9.6 $605,589 $10,441 $2,343 $12,784 Virginia 4149 Physical Disabilities 400 121,143 3,983 10.0 $32,034,814 $80,087 $61,142 $141,229 Virginia Total All 40,966 12,980,804 426,766 10.4 $1,177,523,766 $28,744 $8,217 $36,961 Washington 0049 Aging/Physical Disabilities 40,024 11,782,794 387,380 9.7 $571,229,235 $14,272 $5,527 $19,799 Washington 0409 DD-incl. ID & ASD 7,476 2,475,723 81,394 10.9 $164,500,666 $22,004 $3,649 $25,653 Washington 0410 DD-incl. ID & ASD 4,480 1,576,825 51,841 11.6 $355,451,137 $79,342 $5,021 $84,363 Washington 0411 DD-incl. ID & ASD 459 160,618 5,281 11.5 $53,257,975 $116,030 $3,575 $119,605 Washington 0443 Aging/Physical Disabilities 906 254,929 8,381 9.3 $8,440,104 $9,316 $7,034 $16,350 Washington 40669 DD-incl. ID & ASD 95 31,097 1,022 10.8 $5,630,587 $59,269 $5,106 $64,375 Washington Total All 53,440 16,281,986 535,298 10.0 $1,158,509,704 $21,679 $5,230 $26,909 West Virginia 0133 DD-incl. ID & ASD 4,492 1,605,076 52,770 11.7 $335,956,881 $74,790 $6,929 $81,719 West Virginia 0134 Aging/Physical Disabilities 6,754 2,199,977 72,328 10.7 $120,080,626 $17,779 $6,904 $24,683 West Virginia 0876 Brain Injuries 7 829 27 3.9 $58,255 $8,322 $8,116 $16,438 West Virginia Total All 11,253 3,805,882 125,125 11.1 $456,095,762 $40,531 $6,915 $47,446 Wisconsin 0154 Aging/Physical Disabilities 3,240 958,402 31,509 9.7 $55,629,964 $17,170 $10,039 $27,209 Wisconsin 0229 DD-incl. ID & ASD 3,428 1,194,433 39,269 11.5 $152,536,084 $44,497 $13,135 $57,632 Wisconsin1 0275 Brain Injuries 86 30,719 1,010 11.7 $5,845,148 $67,967 $22,423 $90,390 Wisconsin10 0367 Aging/Physical Disabilities 31,000 9,042,358 297,283 9.6 $866,421,133 $27,949 $2,449 $30,398 Wisconsin10 0368 DD-incl. ID & ASD 14,810 5,011,504 164,762 11.1 $509,331,602 $34,391 $2,589 $36,980 Wisconsin 0413 PD-Child 475 140,232 4,610 9.7 $4,129,661 $8,694 $30,176 $38,870 Wisconsin 0414 DD-Child (incl. ID & ASD) 4,369 1,333,885 43,854 10.0 $48,673,955 $11,141 $11,659 $22,800 Wisconsin 0415 SED 1,371 351,830 11,567 8.4 $17,316,479 $12,631 $5,440 $18,071 Wisconsin 0484 DD-incl. ID & ASD 10,260 3,016,581 99,175 9.7 $171,782,096 $16,743 $26,811 $43,554 Wisconsin1 0485 Aging/Physical Disabilities 5,073 1,320,644 43,418 8.6 $47,841,816 $9,431 $19,410 $28,841 Wisconsin Total All 74,112 22,400,588 736,458 9.9 $1,879,507,938 $25,360 $8,636 $33,996 Wyoming 0226 DD-incl. ID & ASD 1,392 493,012 16,209 11.6 $84,952,698 $61,029 $6,661 $67,690 Wyoming 0236 Aging/Physical Disabilities 1,665 483,702 15,903 9.6 $13,270,229 $7,970 $8,340 $16,310
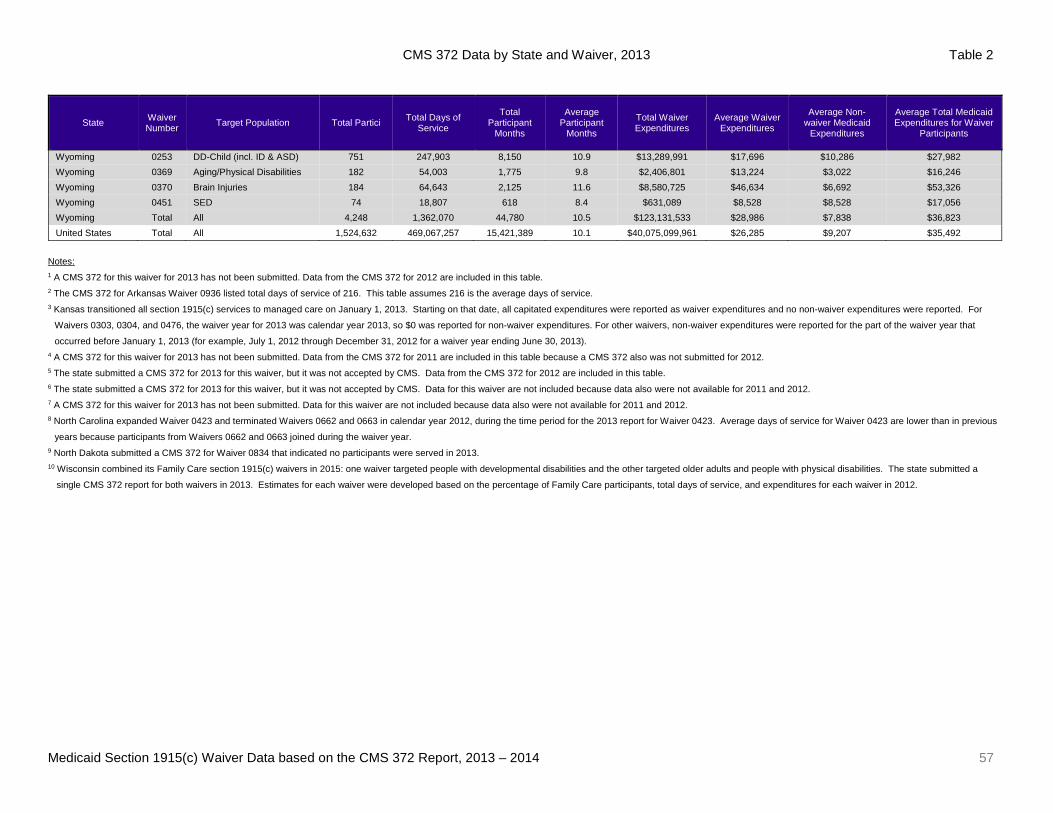
CMS 372 Data by State and Waiver, 2013 Table 2
Medicaid Section 1915(c) Waiver Data based on the CMS 372 Report, 2013 – 2014 57
State Waiver Number Target Population Total Partici Total Days of
Service
Total Participant
Months
Average Participant
Months
Total Waiver Expenditures
Average Waiver Expenditures
Average Non-waiver Medicaid
Expenditures
Average Total Medicaid Expenditures for Waiver
Participants
Wyoming 0253 DD-Child (incl. ID & ASD) 751 247,903 8,150 10.9 $13,289,991 $17,696 $10,286 $27,982 Wyoming 0369 Aging/Physical Disabilities 182 54,003 1,775 9.8 $2,406,801 $13,224 $3,022 $16,246 Wyoming 0370 Brain Injuries 184 64,643 2,125 11.6 $8,580,725 $46,634 $6,692 $53,326 Wyoming 0451 SED 74 18,807 618 8.4 $631,089 $8,528 $8,528 $17,056 Wyoming Total All 4,248 1,362,070 44,780 10.5 $123,131,533 $28,986 $7,838 $36,823 United States Total All 1,524,632 469,067,257 15,421,389 10.1 $40,075,099,961 $26,285 $9,207 $35,492
Notes: 1 A CMS 372 for this waiver for 2013 has not been submitted. Data from the CMS 372 for 2012 are included in this table. 2 The CMS 372 for Arkansas Waiver 0936 listed total days of service of 216. This table assumes 216 is the average days of service. 3 Kansas transitioned all section 1915(c) services to managed care on January 1, 2013. Starting on that date, all capitated expenditures were reported as waiver expenditures and no non-waiver expenditures were reported. For
Waivers 0303, 0304, and 0476, the waiver year for 2013 was calendar year 2013, so $0 was reported for non-waiver expenditures. For other waivers, non-waiver expenditures were reported for the part of the waiver year that
occurred before January 1, 2013 (for example, July 1, 2012 through December 31, 2012 for a waiver year ending June 30, 2013). 4 A CMS 372 for this waiver for 2013 has not been submitted. Data from the CMS 372 for 2011 are included in this table because a CMS 372 also was not submitted for 2012. 5 The state submitted a CMS 372 for 2013 for this waiver, but it was not accepted by CMS. Data from the CMS 372 for 2012 are included in this table. 6 The state submitted a CMS 372 for 2013 for this waiver, but it was not accepted by CMS. Data for this waiver are not included because data also were not available for 2011 and 2012. 7 A CMS 372 for this waiver for 2013 has not been submitted. Data for this waiver are not included because data also were not available for 2011 and 2012. 8 North Carolina expanded Waiver 0423 and terminated Waivers 0662 and 0663 in calendar year 2012, during the time period for the 2013 report for Waiver 0423. Average days of service for Waiver 0423 are lower than in previous
years because participants from Waivers 0662 and 0663 joined during the waiver year. 9 North Dakota submitted a CMS 372 for Waiver 0834 that indicated no participants were served in 2013. 10 Wisconsin combined its Family Care section 1915(c) waivers in 2015: one waiver targeted people with developmental disabilities and the other targeted older adults and people with physical disabilities. The state submitted a
single CMS 372 report for both waivers in 2013. Estimates for each waiver were developed based on the percentage of Family Care participants, total days of service, and expenditures for each waiver in 2012.

State Totals: Waiver Participants, Participant Months, and Expenditures, 2014 Table 3
Medicaid Section 1915(c) Waiver Data based on the CMS 372 Report, 2013 – 2014 58
State
Participants per 1,000
State Residents
Rank Total Participants
Percent Change
Participants 2013-14
Total Participant
Months
Percent Change Participant
Months 2013-14
Average Participant
Months
Percent Change Average
Participant Months 2013-14
Average Waiver
Expenditures
Percent Change Average Waiver
Expenditures 2013-14
Average Total Medicaid
Expenditures for Waiver Participants
Percent Change Average Medicaid
Expenditures 2013-14
Wisconsin1, 2 13.48 1 77,622 4.7% 784,389 6.5% 10.1 1.7% $24,923 -1.7% $32,584 -4.2% Minnesota 12.44 2 67,816 1.9% 719,619 2.5% 10.6 0.6% $31,537 3.6% $42,943 4.0% Oregon3 12.16 3 48,269 7.1% 468,314 4.8% 9.7 -2.2% $2,763 -84.5% $11,395 -53.2% Idaho 10.35 4 16,906 16.2% 154,049 1.6% 9.1 -12.5% $14,779 1.0% $24,137 -1.5% Kansas4 9.63 5 27,935 -1.0% 278,951 1.3% 10.0 2.3% $34,221 12.6% $34,221 4.7% Iowa5 9.50 6 29,531 2.2% 313,843 1.5% 10.6 -0.7% $19,686 5.8% $30,605 4.8% Illinois6 9.12 7 117,342 3.3% 1,088,491 4.2% 9.3 0.9% $14,050 1.4% $23,602 32.8% Mississippi7 8.40 8 25,124 7.2% 251,406 9.0% 10.0 1.7% $12,195 9.8% $16,422 7.1% Ohio 8.07 9 93,569 2.2% 954,824 2.1% 10.2 -0.1% $21,988 1.5% $33,283 0.8% Washington 7.84 10 55,285 3.5% 567,743 6.1% 10.3 2.5% $23,344 7.7% $27,307 1.5% Colorado 7.38 11 39,455 6.1% 386,806 4.7% 9.8 -1.3% $17,365 4.8% $27,046 5.1% Wyoming 7.27 12 4,244 -0.1% 44,061 -1.6% 10.4 -1.5% $27,218 -6.1% $35,080 -4.7% Alaska8 7.20 13 5,303 -2.8% 56,861 4.2% 10.7 7.2% $46,361 -0.4% $68,225 3.6% Connecticut 7.06 14 25,360 4.5% 265,561 3.9% 10.5 -0.6% $41,063 2.3% $48,534 2.2% Dist. of Columbia 6.97 15 4,592 -6.9% 47,365 -3.8% 10.3 3.3% $43,049 5.1% $75,956 0.9% Pennsylvania 6.84 16 87,439 3.8% 924,752 8.2% 10.6 4.2% $37,946 6.4% $44,125 5.0%
Oklahoma 6.79 17 26,317 -0.2% 264,245 0.3% 10.0 0.5% $18,587 5.8% $26,216 4.2%
New Hampshire 6.45 18 8,564 2.3% 85,708 2.1% 10.0 -0.2% $32,038 1.3% $39,432 -6.0% North Dakota9 6.43 19 4,755 3.6% 47,940 4.2% 10.1 0.6% $35,462 10.1% $41,691 7.1% South Dakota 6.19 20 5,279 1.8% 55,887 2.5% 10.6 0.7% $23,161 2.5% $28,344 2.2% Florida10 6.01 21 119,598 33.5% 824,148 8.9% 6.9 -18.4% $9,787 -19.9% $22,495 6.1% South Carolina 5.88 22 28,412 5.2% 281,964 1.7% 9.9 -3.4% $16,216 -3.2% $23,972 -0.9% Kentucky5 5.72 23 25,251 2.5% 268,220 3.5% 10.6 1.0% $24,825 -0.1% $32,086 0.3% Nebraska5, 11 5.71 24 10,741 0.3% 109,396 0.0% 10.2 -0.3% $28,954 0.3% $35,567 0.8% West Virginia 5.64 25 10,418 -7.4% 115,984 -7.3% 11.1 0.1% $44,270 9.2% $51,402 8.3% Virginia 5.24 26 43,613 6.5% 457,119 7.1% 10.5 0.6% $30,167 5.0% $38,251 3.5% Montana 5.21 27 5,330 0.6% 52,701 -7.7% 9.9 -8.3% $25,902 3.1% $36,434 1.6% Missouri12 5.13 28 31,077 -0.4% 322,591 17.9% 10.4 18.5% $25,448 10.3% $36,193 13.4% New York1, 13 4.97 29 97,925 1.8% 1,054,070 2.1% 10.8 0.3% $51,707 -5.6% $67,500 -3.7% Arkansas1, 2, 14 4.91 30 14,558 0.0% 142,169 0.0% 9.8 0.0% $20,322 0.0% $30,288 0.0% Indiana 4.81 31 31,701 18.7% 313,942 15.6% 9.9 -2.7% $23,765 -5.5% $36,167 -6.4% Maine1 4.53 32 6,033 1.9% 63,154 -0.5% 10.5 -2.4% $58,232 0.6% $66,678 -1.0% Georgia5 4.32 33 43,561 -2.7% 450,171 -3.2% 10.3 -0.5% $20,727 2.3% $26,614 1.4% Maryland15 4.30 34 25,674 5.1% 273,075 2.9% 10.6 -2.1% $38,305 -5.7% $50,076 2.4% Massachusetts 4.09 35 27,600 4.0% 280,806 3.4% 10.2 -0.6% $40,621 8.6% $58,525 8.2% Louisiana7 3.81 36 17,717 0.0% 197,252 -0.8% 11.1 -0.7% $31,879 0.9% $39,968 0.5% California 3.18 37 122,943 7.2% 1,323,068 6.7% 10.8 -0.5% $23,015 1.8% $37,441 1.4% Alabama 2.98 38 14,425 3.2% 151,613 3.3% 10.5 0.1% $26,766 2.2% $32,378 2.6%
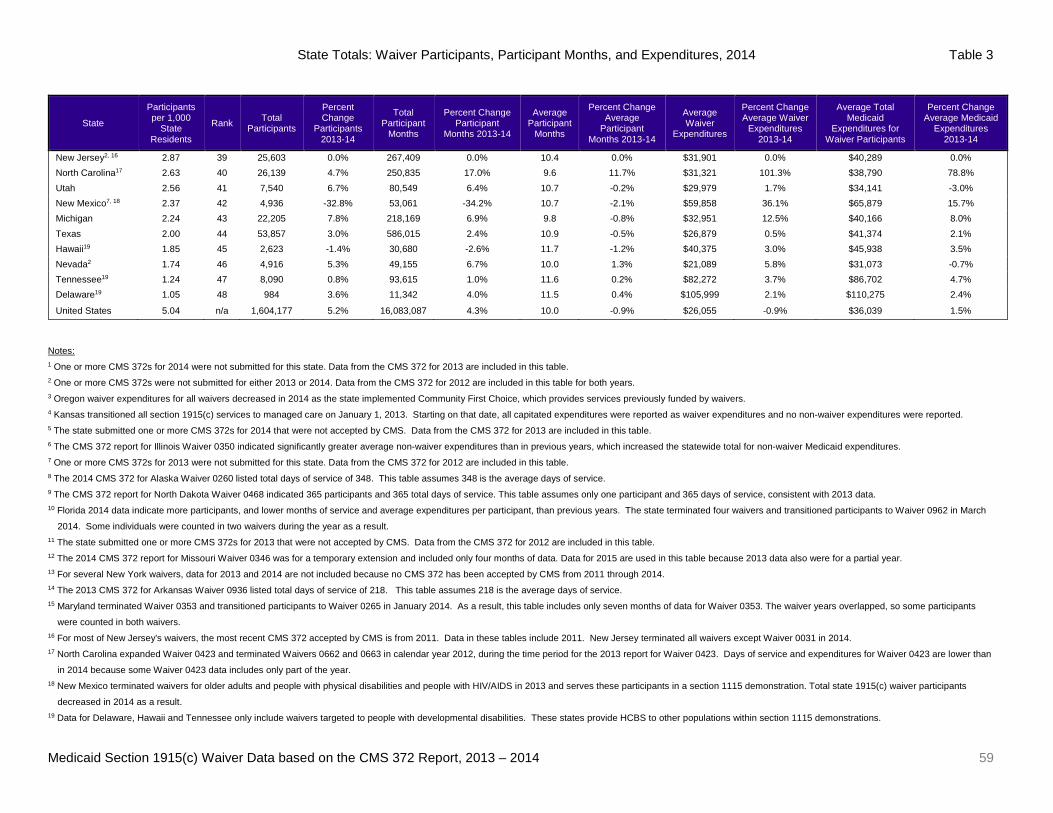
State Totals: Waiver Participants, Participant Months, and Expenditures, 2014 Table 3
Medicaid Section 1915(c) Waiver Data based on the CMS 372 Report, 2013 – 2014 59
State
Participants per 1,000
State Residents
Rank Total Participants
Percent Change
Participants 2013-14
Total Participant
Months
Percent Change Participant
Months 2013-14
Average Participant
Months
Percent Change Average
Participant Months 2013-14
Average Waiver
Expenditures
Percent Change Average Waiver
Expenditures 2013-14
Average Total Medicaid
Expenditures for Waiver Participants
Percent Change Average Medicaid
Expenditures 2013-14
New Jersey2, 16 2.87 39 25,603 0.0% 267,409 0.0% 10.4 0.0% $31,901 0.0% $40,289 0.0% North Carolina17 2.63 40 26,139 4.7% 250,835 17.0% 9.6 11.7% $31,321 101.3% $38,790 78.8% Utah 2.56 41 7,540 6.7% 80,549 6.4% 10.7 -0.2% $29,979 1.7% $34,141 -3.0% New Mexico7, 18 2.37 42 4,936 -32.8% 53,061 -34.2% 10.7 -2.1% $59,858 36.1% $65,879 15.7% Michigan 2.24 43 22,205 7.8% 218,169 6.9% 9.8 -0.8% $32,951 12.5% $40,166 8.0% Texas 2.00 44 53,857 3.0% 586,015 2.4% 10.9 -0.5% $26,879 0.5% $41,374 2.1% Hawaii19 1.85 45 2,623 -1.4% 30,680 -2.6% 11.7 -1.2% $40,375 3.0% $45,938 3.5% Nevada2 1.74 46 4,916 5.3% 49,155 6.7% 10.0 1.3% $21,089 5.8% $31,073 -0.7% Tennessee19 1.24 47 8,090 0.8% 93,615 1.0% 11.6 0.2% $82,272 3.7% $86,702 4.7% Delaware19 1.05 48 984 3.6% 11,342 4.0% 11.5 0.4% $105,999 2.1% $110,275 2.4%
United States 5.04 n/a 1,604,177 5.2% 16,083,087 4.3% 10.0 -0.9% $26,055 -0.9% $36,039 1.5% Notes: 1 One or more CMS 372s for 2014 were not submitted for this state. Data from the CMS 372 for 2013 are included in this table. 2 One or more CMS 372s were not submitted for either 2013 or 2014. Data from the CMS 372 for 2012 are included in this table for both years. 3 Oregon waiver expenditures for all waivers decreased in 2014 as the state implemented Community First Choice, which provides services previously funded by waivers. 4 Kansas transitioned all section 1915(c) services to managed care on January 1, 2013. Starting on that date, all capitated expenditures were reported as waiver expenditures and no non-waiver expenditures were reported. 5 The state submitted one or more CMS 372s for 2014 that were not accepted by CMS. Data from the CMS 372 for 2013 are included in this table. 6 The CMS 372 report for Illinois Waiver 0350 indicated significantly greater average non-waiver expenditures than in previous years, which increased the statewide total for non-waiver Medicaid expenditures. 7 One or more CMS 372s for 2013 were not submitted for this state. Data from the CMS 372 for 2012 are included in this table. 8 The 2014 CMS 372 for Alaska Waiver 0260 listed total days of service of 348. This table assumes 348 is the average days of service. 9 The CMS 372 report for North Dakota Waiver 0468 indicated 365 participants and 365 total days of service. This table assumes only one participant and 365 days of service, consistent with 2013 data. 10 Florida 2014 data indicate more participants, and lower months of service and average expenditures per participant, than previous years. The state terminated four waivers and transitioned participants to Waiver 0962 in March
2014. Some individuals were counted in two waivers during the year as a result. 11 The state submitted one or more CMS 372s for 2013 that were not accepted by CMS. Data from the CMS 372 for 2012 are included in this table. 12 The 2014 CMS 372 report for Missouri Waiver 0346 was for a temporary extension and included only four months of data. Data for 2015 are used in this table because 2013 data also were for a partial year. 13 For several New York waivers, data for 2013 and 2014 are not included because no CMS 372 has been accepted by CMS from 2011 through 2014. 14 The 2013 CMS 372 for Arkansas Waiver 0936 listed total days of service of 218. This table assumes 218 is the average days of service. 15 Maryland terminated Waiver 0353 and transitioned participants to Waiver 0265 in January 2014. As a result, this table includes only seven months of data for Waiver 0353. The waiver years overlapped, so some participants
were counted in both waivers. 16 For most of New Jersey's waivers, the most recent CMS 372 accepted by CMS is from 2011. Data in these tables include 2011. New Jersey terminated all waivers except Waiver 0031 in 2014. 17 North Carolina expanded Waiver 0423 and terminated Waivers 0662 and 0663 in calendar year 2012, during the time period for the 2013 report for Waiver 0423. Days of service and expenditures for Waiver 0423 are lower than
in 2014 because some Waiver 0423 data includes only part of the year. 18 New Mexico terminated waivers for older adults and people with physical disabilities and people with HIV/AIDS in 2013 and serves these participants in a section 1115 demonstration. Total state 1915(c) waiver participants
decreased in 2014 as a result. 19 Data for Delaware, Hawaii and Tennessee only include waivers targeted to people with developmental disabilities. These states provide HCBS to other populations within section 1115 demonstrations.
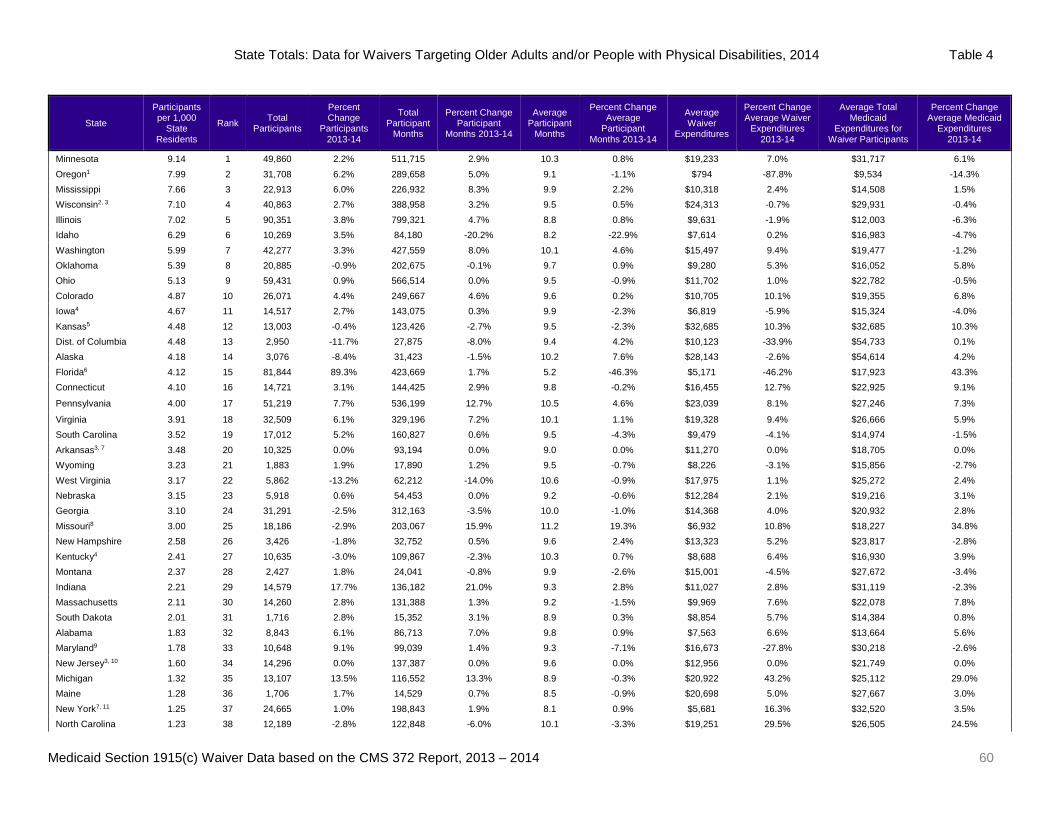
State Totals: Data for Waivers Targeting Older Adults and/or People with Physical Disabilities, 2014 Table 4
Medicaid Section 1915(c) Waiver Data based on the CMS 372 Report, 2013 – 2014 60
State
Participants per 1,000
State Residents
Rank Total Participants
Percent Change
Participants 2013-14
Total Participant
Months
Percent Change Participant
Months 2013-14
Average Participant
Months
Percent Change Average
Participant Months 2013-14
Average Waiver
Expenditures
Percent Change Average Waiver
Expenditures 2013-14
Average Total Medicaid
Expenditures for Waiver Participants
Percent Change Average Medicaid
Expenditures 2013-14
Minnesota 9.14 1 49,860 2.2% 511,715 2.9% 10.3 0.8% $19,233 7.0% $31,717 6.1% Oregon1 7.99 2 31,708 6.2% 289,658 5.0% 9.1 -1.1% $794 -87.8% $9,534 -14.3% Mississippi 7.66 3 22,913 6.0% 226,932 8.3% 9.9 2.2% $10,318 2.4% $14,508 1.5% Wisconsin2, 3 7.10 4 40,863 2.7% 388,958 3.2% 9.5 0.5% $24,313 -0.7% $29,931 -0.4% Illinois 7.02 5 90,351 3.8% 799,321 4.7% 8.8 0.8% $9,631 -1.9% $12,003 -6.3% Idaho 6.29 6 10,269 3.5% 84,180 -20.2% 8.2 -22.9% $7,614 0.2% $16,983 -4.7% Washington 5.99 7 42,277 3.3% 427,559 8.0% 10.1 4.6% $15,497 9.4% $19,477 -1.2% Oklahoma 5.39 8 20,885 -0.9% 202,675 -0.1% 9.7 0.9% $9,280 5.3% $16,052 5.8% Ohio 5.13 9 59,431 0.9% 566,514 0.0% 9.5 -0.9% $11,702 1.0% $22,782 -0.5% Colorado 4.87 10 26,071 4.4% 249,667 4.6% 9.6 0.2% $10,705 10.1% $19,355 6.8% Iowa4 4.67 11 14,517 2.7% 143,075 0.3% 9.9 -2.3% $6,819 -5.9% $15,324 -4.0% Kansas5 4.48 12 13,003 -0.4% 123,426 -2.7% 9.5 -2.3% $32,685 10.3% $32,685 10.3% Dist. of Columbia 4.48 13 2,950 -11.7% 27,875 -8.0% 9.4 4.2% $10,123 -33.9% $54,733 0.1% Alaska 4.18 14 3,076 -8.4% 31,423 -1.5% 10.2 7.6% $28,143 -2.6% $54,614 4.2% Florida6 4.12 15 81,844 89.3% 423,669 1.7% 5.2 -46.3% $5,171 -46.2% $17,923 43.3% Connecticut 4.10 16 14,721 3.1% 144,425 2.9% 9.8 -0.2% $16,455 12.7% $22,925 9.1%
Pennsylvania 4.00 17 51,219 7.7% 536,199 12.7% 10.5 4.6% $23,039 8.1% $27,246 7.3%
Virginia 3.91 18 32,509 6.1% 329,196 7.2% 10.1 1.1% $19,328 9.4% $26,666 5.9% South Carolina 3.52 19 17,012 5.2% 160,827 0.6% 9.5 -4.3% $9,479 -4.1% $14,974 -1.5% Arkansas3, 7 3.48 20 10,325 0.0% 93,194 0.0% 9.0 0.0% $11,270 0.0% $18,705 0.0% Wyoming 3.23 21 1,883 1.9% 17,890 1.2% 9.5 -0.7% $8,226 -3.1% $15,856 -2.7% West Virginia 3.17 22 5,862 -13.2% 62,212 -14.0% 10.6 -0.9% $17,975 1.1% $25,272 2.4% Nebraska 3.15 23 5,918 0.6% 54,453 0.0% 9.2 -0.6% $12,284 2.1% $19,216 3.1% Georgia 3.10 24 31,291 -2.5% 312,163 -3.5% 10.0 -1.0% $14,368 4.0% $20,932 2.8% Missouri8 3.00 25 18,186 -2.9% 203,067 15.9% 11.2 19.3% $6,932 10.8% $18,227 34.8% New Hampshire 2.58 26 3,426 -1.8% 32,752 0.5% 9.6 2.4% $13,323 5.2% $23,817 -2.8% Kentucky4 2.41 27 10,635 -3.0% 109,867 -2.3% 10.3 0.7% $8,688 6.4% $16,930 3.9% Montana 2.37 28 2,427 1.8% 24,041 -0.8% 9.9 -2.6% $15,001 -4.5% $27,672 -3.4% Indiana 2.21 29 14,579 17.7% 136,182 21.0% 9.3 2.8% $11,027 2.8% $31,119 -2.3% Massachusetts 2.11 30 14,260 2.8% 131,388 1.3% 9.2 -1.5% $9,969 7.6% $22,078 7.8% South Dakota 2.01 31 1,716 2.8% 15,352 3.1% 8.9 0.3% $8,854 5.7% $14,384 0.8% Alabama 1.83 32 8,843 6.1% 86,713 7.0% 9.8 0.9% $7,563 6.6% $13,664 5.6% Maryland9 1.78 33 10,648 9.1% 99,039 1.4% 9.3 -7.1% $16,673 -27.8% $30,218 -2.6% New Jersey3, 10 1.60 34 14,296 0.0% 137,387 0.0% 9.6 0.0% $12,956 0.0% $21,749 0.0% Michigan 1.32 35 13,107 13.5% 116,552 13.3% 8.9 -0.3% $20,922 43.2% $25,112 29.0% Maine 1.28 36 1,706 1.7% 14,529 0.7% 8.5 -0.9% $20,698 5.0% $27,667 3.0% New York7, 11 1.25 37 24,665 1.0% 198,843 1.9% 8.1 0.9% $5,681 16.3% $32,520 3.5% North Carolina 1.23 38 12,189 -2.8% 122,848 -6.0% 10.1 -3.3% $19,251 29.5% $26,505 24.5%
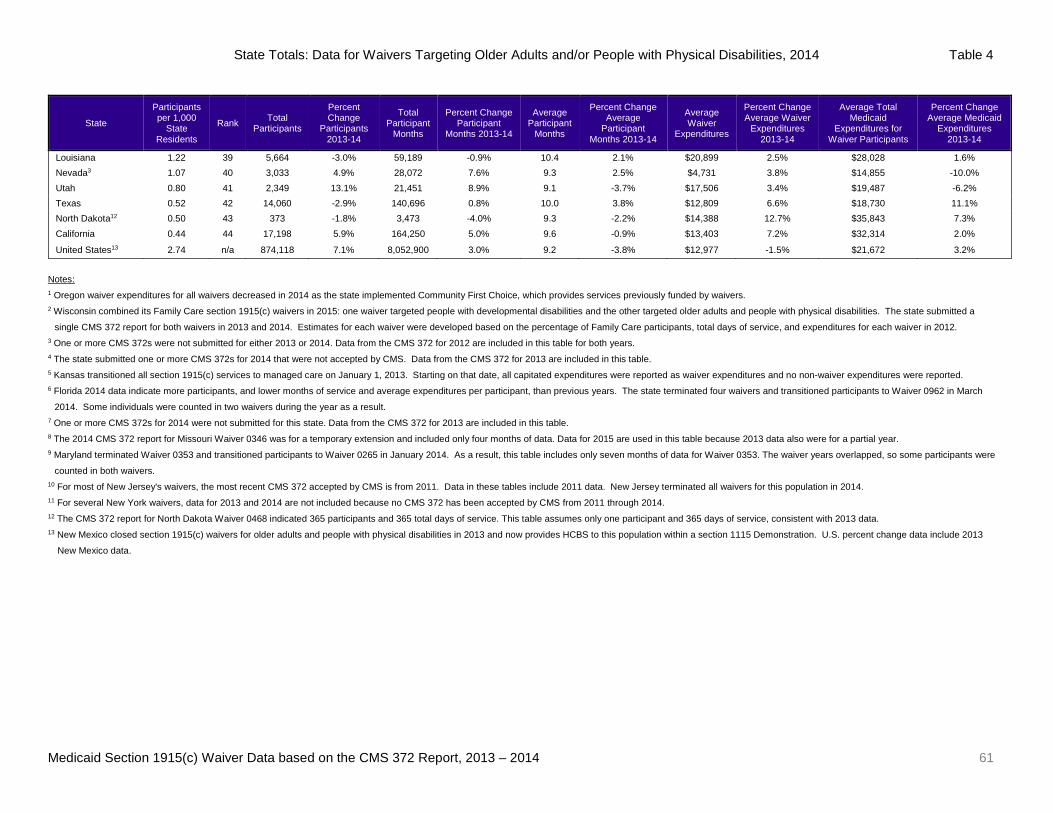
State Totals: Data for Waivers Targeting Older Adults and/or People with Physical Disabilities, 2014 Table 4
Medicaid Section 1915(c) Waiver Data based on the CMS 372 Report, 2013 – 2014 61
State
Participants per 1,000
State Residents
Rank Total Participants
Percent Change
Participants 2013-14
Total Participant
Months
Percent Change Participant
Months 2013-14
Average Participant
Months
Percent Change Average
Participant Months 2013-14
Average Waiver
Expenditures
Percent Change Average Waiver
Expenditures 2013-14
Average Total Medicaid
Expenditures for Waiver Participants
Percent Change Average Medicaid
Expenditures 2013-14
Louisiana 1.22 39 5,664 -3.0% 59,189 -0.9% 10.4 2.1% $20,899 2.5% $28,028 1.6% Nevada3 1.07 40 3,033 4.9% 28,072 7.6% 9.3 2.5% $4,731 3.8% $14,855 -10.0% Utah 0.80 41 2,349 13.1% 21,451 8.9% 9.1 -3.7% $17,506 3.4% $19,487 -6.2% Texas 0.52 42 14,060 -2.9% 140,696 0.8% 10.0 3.8% $12,809 6.6% $18,730 11.1% North Dakota12 0.50 43 373 -1.8% 3,473 -4.0% 9.3 -2.2% $14,388 12.7% $35,843 7.3% California 0.44 44 17,198 5.9% 164,250 5.0% 9.6 -0.9% $13,403 7.2% $32,314 2.0%
United States13 2.74 n/a 874,118 7.1% 8,052,900 3.0% 9.2 -3.8% $12,977 -1.5% $21,672 3.2% Notes: 1 Oregon waiver expenditures for all waivers decreased in 2014 as the state implemented Community First Choice, which provides services previously funded by waivers. 2 Wisconsin combined its Family Care section 1915(c) waivers in 2015: one waiver targeted people with developmental disabilities and the other targeted older adults and people with physical disabilities. The state submitted a
single CMS 372 report for both waivers in 2013 and 2014. Estimates for each waiver were developed based on the percentage of Family Care participants, total days of service, and expenditures for each waiver in 2012. 3 One or more CMS 372s were not submitted for either 2013 or 2014. Data from the CMS 372 for 2012 are included in this table for both years. 4 The state submitted one or more CMS 372s for 2014 that were not accepted by CMS. Data from the CMS 372 for 2013 are included in this table. 5 Kansas transitioned all section 1915(c) services to managed care on January 1, 2013. Starting on that date, all capitated expenditures were reported as waiver expenditures and no non-waiver expenditures were reported. 6 Florida 2014 data indicate more participants, and lower months of service and average expenditures per participant, than previous years. The state terminated four waivers and transitioned participants to Waiver 0962 in March
2014. Some individuals were counted in two waivers during the year as a result. 7 One or more CMS 372s for 2014 were not submitted for this state. Data from the CMS 372 for 2013 are included in this table. 8 The 2014 CMS 372 report for Missouri Waiver 0346 was for a temporary extension and included only four months of data. Data for 2015 are used in this table because 2013 data also were for a partial year. 9 Maryland terminated Waiver 0353 and transitioned participants to Waiver 0265 in January 2014. As a result, this table includes only seven months of data for Waiver 0353. The waiver years overlapped, so some participants were
counted in both waivers. 10 For most of New Jersey's waivers, the most recent CMS 372 accepted by CMS is from 2011. Data in these tables include 2011 data. New Jersey terminated all waivers for this population in 2014. 11 For several New York waivers, data for 2013 and 2014 are not included because no CMS 372 has been accepted by CMS from 2011 through 2014. 12 The CMS 372 report for North Dakota Waiver 0468 indicated 365 participants and 365 total days of service. This table assumes only one participant and 365 days of service, consistent with 2013 data. 13 New Mexico closed section 1915(c) waivers for older adults and people with physical disabilities in 2013 and now provides HCBS to this population within a section 1115 Demonstration. U.S. percent change data include 2013
New Mexico data.

State Totals: Data for Waivers Targeting People with Developmental Disabilities, 2014 Table 5
Medicaid Section 1915(c) Waiver Data based on the CMS 372 Report, 2013 – 2014 62
State
Participants per 1,000
State Residents
Rank Total Participants
Percent Change
Participants 2013-14
Total Participant
Months
Percent Change Participant Months
2013-14
Average Participant
Months
Percent Change Average
Participant Months 2013-14
Average Waiver
Expenditures
Percent Change Average Waiver
Expenditures 2013-14
Average Total Medicaid
Expenditures for Waiver Participants
Percent Change Average Medicaid
Expenditures 2013-14
Wisconsin1, 2 6.18 1 35,579 8.3% 384,284 10.7% 10.8 2.3% $25,843 -3.7% $35,843 -8.8% North Dakota 5.91 2 4,372 4.1% 44,350 4.9% 10.1 0.7% $37,320 9.7% $42,215 7.0% South Dakota 4.18 3 3,563 1.3% 40,535 2.2% 11.4 1.0% $30,051 2.5% $35,067 2.8% Oregon3 4.15 4 16,464 8.8% 177,693 4.4% 10.8 -4.1% $6,567 -83.7% $14,594 -70.7% Iowa 4.09 5 12,721 3.7% 145,298 3.8% 11.4 0.0% $34,685 7.7% $47,309 8.1% Idaho 4.06 6 6,637 43.4% 69,869 51.9% 10.5 5.9% $25,866 -13.0% $35,206 -9.3% New York4 3.72 7 73,260 2.1% 855,226 2.2% 11.7 0.1% $67,203 -6.3% $79,277 -4.8% New Hampshire 3.68 8 4,892 5.1% 50,323 3.0% 0.0 -100.0% $42,466 -1.4% $48,050 -8.1% Wyoming 3.63 9 2,119 -1.1% 23,677 -2.8% 11.2 -1.7% $44,255 -3.5% $52,333 -2.7% Maine2 3.25 10 4,327 2.0% 48,625 -0.9% 11.2 -2.8% $73,030 0.1% $82,059 -1.6% Kentucky 3.22 11 14,196 7.2% 153,661 8.2% 10.8 0.9% $35,028 -4.5% $41,596 -3.4% Kansas5 3.15 12 9,123 2.2% 103,509 2.9% 11.3 0.7% $43,904 9.2% $43,904 4.5% Minnesota 3.02 13 16,459 1.0% 191,573 1.4% 11.6 0.4% $65,749 1.8% $73,868 2.3% Ohio 2.94 14 34,138 4.4% 388,310 5.3% 11.4 0.9% $39,896 0.3% $51,564 0.6% Pennsylvania 2.76 15 35,316 -1.2% 378,585 2.8% 10.7 4.1% $59,092 8.8% $68,177 7.1% Connecticut 2.75 16 9,887 5.3% 113,293 4.3% 11.5 -0.9% $75,849 -1.5% $84,345 -1.3% California 2.68 17 103,814 7.7% 1,139,764 7.2% 11.0 -0.5% $24,948 1.1% $38,421 1.2% Alaska6 2.63 18 1,940 6.9% 22,196 12.2% 11.4 5.0% $76,124 -5.0% $87,107 -2.4%
Montana 2.62 19 2,681 -0.8% 26,531 -14.3% 9.9 -13.6% $36,696 7.8% $45,005 5.7%
Indiana 2.57 20 16,930 20.0% 175,677 12.0% 10.4 -6.6% $34,700 -8.1% $40,299 -9.2% Nebraska7 2.55 21 4,802 0.0% 54,698 0.0% 11.4 0.0% $49,481 0.0% $55,717 0.0% Dist. of Columbia 2.49 22 1,642 3.1% 19,490 2.9% 11.9 -0.3% $102,203 7.9% $114,086 -3.7% Maryland 2.47 23 14,760 2.5% 171,069 3.9% 11.6 1.3% $54,010 2.4% $62,880 5.4% Louisiana8 2.46 24 11,441 -2.1% 135,195 -1.9% 11.8 0.2% $38,947 3.2% $47,276 2.1% West Virginia 2.45 25 4,526 0.8% 53,547 1.5% 11.8 0.7% $78,509 5.0% $85,396 4.5% New Mexico 2.30 26 4,788 12.4% 51,633 6.9% 10.8 -4.9% $61,375 -8.7% $67,186 -7.0% Missouri 2.12 27 12,834 3.3% 119,071 22.0% 9.3 18.0% $51,665 6.7% $61,592 3.4% South Carolina 2.03 28 9,784 6.0% 103,872 2.0% 10.6 -3.8% $30,062 -3.4% $36,940 -3.4% Massachusetts2 1.94 29 13,079 4.9% 146,960 5.1% 11.2 0.1% $73,425 7.7% $97,539 7.4% Hawaii 1.85 30 2,623 -1.4% 30,680 -2.6% 11.7 -1.2% $40,375 3.0% $45,938 3.5% Washington 1.84 31 13,008 4.0% 140,184 0.5% 10.8 -3.4% $48,845 5.6% $52,756 4.6% Colorado 1.76 32 9,399 11.2% 99,150 4.7% 10.5 -5.8% $38,257 -2.7% $50,776 0.1% Utah 1.68 33 4,935 3.7% 56,452 5.5% 11.4 1.8% $36,106 2.8% $40,445 1.1% Illinois9 1.65 34 21,215 4.9% 235,324 7.2% 11.1 2.1% $32,812 5.3% $66,969 96.2% Florida10 1.52 35 30,195 -21.2% 326,586 24.3% 10.8 57.8% $24,392 40.0% $35,990 11.9% Arkansas2, 11 1.43 36 4,233 0.0% 48,975 0.0% 11.6 0.0% $42,403 0.0% $58,540 0.0% Oklahoma 1.39 37 5,375 2.3% 61,491 1.5% 11.4 -0.8% $54,324 3.6% $65,228 0.6% Virginia 1.34 38 11,104 7.5% 127,923 6.8% 11.5 -0.6% $61,900 0.5% $72,166 0.4%

State Totals: Data for Waivers Targeting People with Developmental Disabilities, 2014 Table 5
Medicaid Section 1915(c) Waiver Data based on the CMS 372 Report, 2013 – 2014 63
State
Participants per 1,000
State Residents
Rank Total Participants
Percent Change
Participants 2013-14
Total Participant
Months
Percent Change Participant Months
2013-14
Average Participant
Months
Percent Change Average
Participant Months 2013-14
Average Waiver
Expenditures
Percent Change Average Waiver
Expenditures 2013-14
Average Total Medicaid
Expenditures for Waiver Participants
Percent Change Average Medicaid
Expenditures 2013-14
Tennessee 1.24 39 8,090 0.8% 93,615 1.0% 11.6 0.2% $82,272 3.7% $86,702 4.7% Texas 1.23 40 33,157 5.7% 375,096 3.6% 11.3 -2.0% $35,347 -1.6% $43,067 -1.4% North Carolina12 1.21 41 11,989 11.7% 108,532 62.9% 9.1 45.8% $42,075 223.7% $46,345 185.5% New Jersey13 1.20 42 10,716 0.0% 123,355 0.0% 11.5 0.0% $56,457 0.0% $64,070 0.0% Georgia7 1.19 43 11,956 -2.2% 135,612 -1.5% 11.3 0.7% $37,263 1.6% $40,721 1.6% Alabama 1.13 44 5,490 -0.9% 63,944 -1.1% 11.6 -0.3% $58,052 5.0% $62,766 4.9% Delaware 1.05 45 984 3.6% 11,342 4.0% 11.5 0.4% $105,999 2.1% $110,275 2.4% Michigan 0.87 46 8,583 -0.3% 98,303 0.1% 11.5 0.4% $52,914 5.6% $64,805 4.4% Mississippi8 0.74 47 2,211 21.6% 24,474 15.0% 11.1 -5.4% $31,643 35.8% $36,260 31.4% Nevada 0.66 48 1,883 5.8% 21,083 5.5% 11.2 -0.3% $47,438 5.7% $57,194 3.4%
United States 2.14 n/a 683,220 3.4% 7,570,635 6.1% 11.1 2.6% $43,278 0.4% $53,928 1.6%
Notes: 1 Wisconsin combined its Family Care section 1915(c) waivers in 2015: one waiver targeted people with developmental disabilities and the other targeted older adults and people with physical disabilities. The state submitted a
single CMS 372 report for both waivers in 2013 and 2014. Estimates for each waiver were developed based on the percentage of Family Care participants, total days of service, and expenditures for each waiver in 2012. 2 One or more CMS 372s for 2014 were not submitted for this state. Data from the CMS 372 for 2013 are included in this table. 3 Oregon waiver expenditures for all waivers decreased in 2014 as the state implemented Community First Choice, which provides services previously funded by waivers. 4 For several New York waivers, data for 2013 and 2014 are not included because no CMS 372 has been accepted by CMS from 2011 through 2014. 5 Kansas transitioned all section 1915(c) services to managed care on January 1, 2013. Starting on that date, all capitated expenditures were reported as waiver expenditures and no non-waiver expenditures were reported. 6 The 2014 CMS 372 for Alaska Waiver 0260 listed total days of service of 348. This table assumes 348 is the average days of service. 7 The state submitted one or more CMS 372s for 2014 that were not accepted by CMS. Data from the CMS 372 for 2013 are included in this table. 8 One or more CMS 372s for 2013 were not submitted for this state. Data from the CMS 372 for 2012 are included in this table. 9 The CMS 372 report for Illinois Waiver 0350 indicated significantly greater average non-waiver expenditures than in previous years, which increased the statewide total for non-waiver Medicaid expenditures. 10 Florida 2013 data indicate more participants, and lower months of service and lower average expenditures per participant, than 2014 and years before 2013. The state terminated four waivers and transitioned participants to
Waiver 0867 in June 2013. Some individuals were counted in two waivers during the year as a result. 11 The 2013 CMS 372 for Arkansas Waiver 0936 listed total days of service of 218. This table assumes 218 is the average days of service. 12 North Carolina expanded Waiver 0423 and terminated Waivers 0662 and 0663 in calendar year 2012, during the time period for the 2013 report for Waiver 0423. Days of service and expenditures for Waiver 0423 are lower than
in 2014 because some Waiver 0423 data includes only part of the year. 13 For New Jersey's waivers for this population, the most recent CMS 372 accepted by CMS is from 2011. Data in these tables include 2011 data.
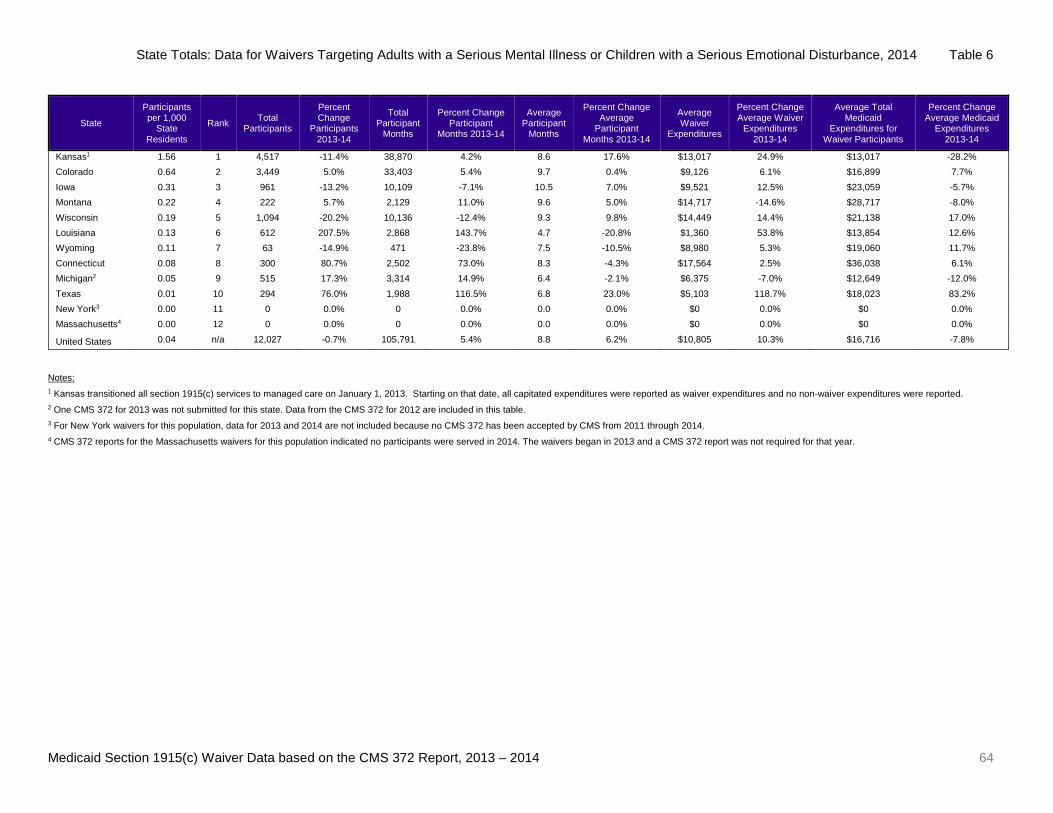
State Totals: Data for Waivers Targeting Adults with a Serious Mental Illness or Children with a Serious Emotional Disturbance, 2014 Table 6
Medicaid Section 1915(c) Waiver Data based on the CMS 372 Report, 2013 – 2014 64
State
Participants per 1,000
State Residents
Rank Total Participants
Percent Change
Participants 2013-14
Total Participant
Months
Percent Change Participant
Months 2013-14
Average Participant
Months
Percent Change Average
Participant Months 2013-14
Average Waiver
Expenditures
Percent Change Average Waiver
Expenditures 2013-14
Average Total Medicaid
Expenditures for Waiver Participants
Percent Change Average Medicaid
Expenditures 2013-14
Kansas1 1.56 1 4,517 -11.4% 38,870 4.2% 8.6 17.6% $13,017 24.9% $13,017 -28.2% Colorado 0.64 2 3,449 5.0% 33,403 5.4% 9.7 0.4% $9,126 6.1% $16,899 7.7% Iowa 0.31 3 961 -13.2% 10,109 -7.1% 10.5 7.0% $9,521 12.5% $23,059 -5.7% Montana 0.22 4 222 5.7% 2,129 11.0% 9.6 5.0% $14,717 -14.6% $28,717 -8.0% Wisconsin 0.19 5 1,094 -20.2% 10,136 -12.4% 9.3 9.8% $14,449 14.4% $21,138 17.0% Louisiana 0.13 6 612 207.5% 2,868 143.7% 4.7 -20.8% $1,360 53.8% $13,854 12.6% Wyoming 0.11 7 63 -14.9% 471 -23.8% 7.5 -10.5% $8,980 5.3% $19,060 11.7% Connecticut 0.08 8 300 80.7% 2,502 73.0% 8.3 -4.3% $17,564 2.5% $36,038 6.1% Michigan2 0.05 9 515 17.3% 3,314 14.9% 6.4 -2.1% $6,375 -7.0% $12,649 -12.0% Texas 0.01 10 294 76.0% 1,988 116.5% 6.8 23.0% $5,103 118.7% $18,023 83.2% New York3 0.00 11 0 0.0% 0 0.0% 0.0 0.0% $0 0.0% $0 0.0% Massachusetts4 0.00 12 0 0.0% 0 0.0% 0.0 0.0% $0 0.0% $0 0.0%
United States 0.04 n/a 12,027 -0.7% 105,791 5.4% 8.8 6.2% $10,805 10.3% $16,716 -7.8%
Notes: 1 Kansas transitioned all section 1915(c) services to managed care on January 1, 2013. Starting on that date, all capitated expenditures were reported as waiver expenditures and no non-waiver expenditures were reported. 2 One CMS 372 for 2013 was not submitted for this state. Data from the CMS 372 for 2012 are included in this table. 3 For New York waivers for this population, data for 2013 and 2014 are not included because no CMS 372 has been accepted by CMS from 2011 through 2014. 4 CMS 372 reports for the Massachusetts waivers for this population indicated no participants were served in 2014. The waivers began in 2013 and a CMS 372 report was not required for that year.
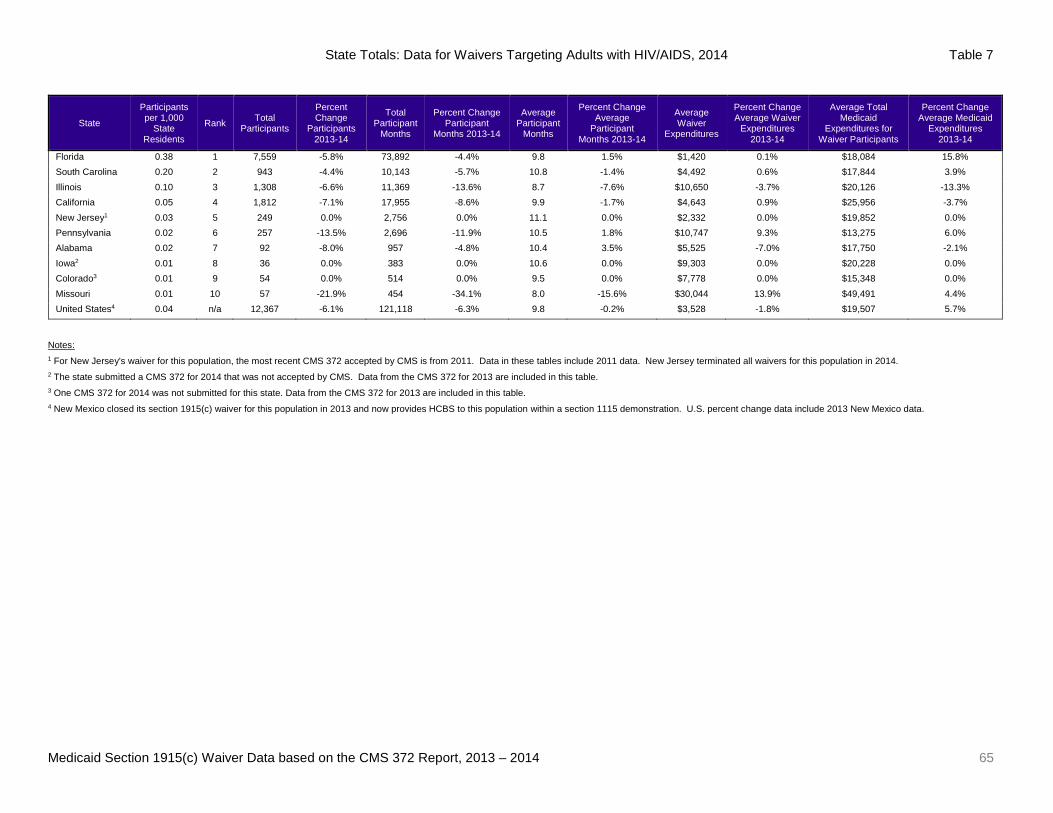
State Totals: Data for Waivers Targeting Adults with HIV/AIDS, 2014 Table 7
Medicaid Section 1915(c) Waiver Data based on the CMS 372 Report, 2013 – 2014 65
State
Participants per 1,000
State Residents
Rank Total Participants
Percent Change
Participants 2013-14
Total Participant
Months
Percent Change Participant
Months 2013-14
Average Participant
Months
Percent Change Average
Participant Months 2013-14
Average Waiver
Expenditures
Percent Change Average Waiver
Expenditures 2013-14
Average Total Medicaid
Expenditures for Waiver Participants
Percent Change Average Medicaid
Expenditures 2013-14
Florida 0.38 1 7,559 -5.8% 73,892 -4.4% 9.8 1.5% $1,420 0.1% $18,084 15.8% South Carolina 0.20 2 943 -4.4% 10,143 -5.7% 10.8 -1.4% $4,492 0.6% $17,844 3.9% Illinois 0.10 3 1,308 -6.6% 11,369 -13.6% 8.7 -7.6% $10,650 -3.7% $20,126 -13.3% California 0.05 4 1,812 -7.1% 17,955 -8.6% 9.9 -1.7% $4,643 0.9% $25,956 -3.7% New Jersey1 0.03 5 249 0.0% 2,756 0.0% 11.1 0.0% $2,332 0.0% $19,852 0.0% Pennsylvania 0.02 6 257 -13.5% 2,696 -11.9% 10.5 1.8% $10,747 9.3% $13,275 6.0% Alabama 0.02 7 92 -8.0% 957 -4.8% 10.4 3.5% $5,525 -7.0% $17,750 -2.1% Iowa2 0.01 8 36 0.0% 383 0.0% 10.6 0.0% $9,303 0.0% $20,228 0.0% Colorado3 0.01 9 54 0.0% 514 0.0% 9.5 0.0% $7,778 0.0% $15,348 0.0% Missouri 0.01 10 57 -21.9% 454 -34.1% 8.0 -15.6% $30,044 13.9% $49,491 4.4% United States4 0.04 n/a 12,367 -6.1% 121,118 -6.3% 9.8 -0.2% $3,528 -1.8% $19,507 5.7%
Notes: 1 For New Jersey's waiver for this population, the most recent CMS 372 accepted by CMS is from 2011. Data in these tables include 2011 data. New Jersey terminated all waivers for this population in 2014. 2 The state submitted a CMS 372 for 2014 that was not accepted by CMS. Data from the CMS 372 for 2013 are included in this table. 3 One CMS 372 for 2014 was not submitted for this state. Data from the CMS 372 for 2013 are included in this table. 4 New Mexico closed its section 1915(c) waiver for this population in 2013 and now provides HCBS to this population within a section 1115 demonstration. U.S. percent change data include 2013 New Mexico data.
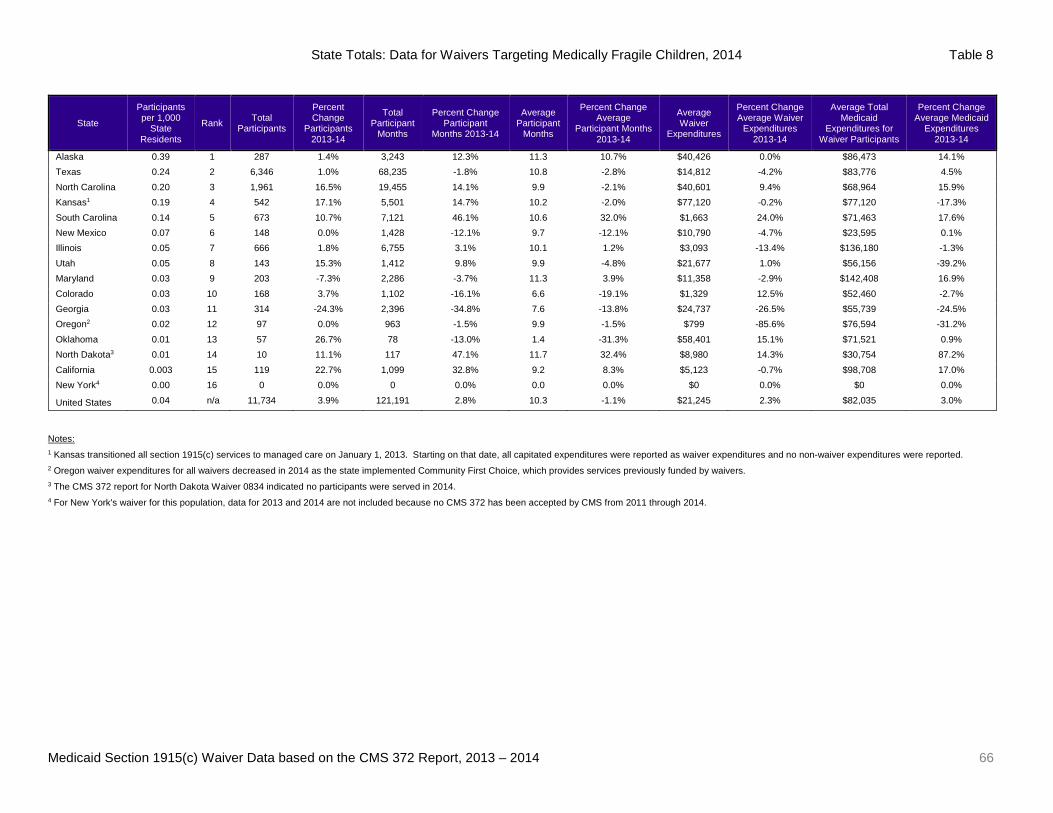
State Totals: Data for Waivers Targeting Medically Fragile Children, 2014 Table 8
Medicaid Section 1915(c) Waiver Data based on the CMS 372 Report, 2013 – 2014 66
State
Participants per 1,000
State Residents
Rank Total Participants
Percent Change
Participants 2013-14
Total Participant
Months
Percent Change Participant
Months 2013-14
Average Participant
Months
Percent Change Average
Participant Months 2013-14
Average Waiver
Expenditures
Percent Change Average Waiver
Expenditures 2013-14
Average Total Medicaid
Expenditures for Waiver Participants
Percent Change Average Medicaid
Expenditures 2013-14
Alaska 0.39 1 287 1.4% 3,243 12.3% 11.3 10.7% $40,426 0.0% $86,473 14.1% Texas 0.24 2 6,346 1.0% 68,235 -1.8% 10.8 -2.8% $14,812 -4.2% $83,776 4.5% North Carolina 0.20 3 1,961 16.5% 19,455 14.1% 9.9 -2.1% $40,601 9.4% $68,964 15.9% Kansas1 0.19 4 542 17.1% 5,501 14.7% 10.2 -2.0% $77,120 -0.2% $77,120 -17.3% South Carolina 0.14 5 673 10.7% 7,121 46.1% 10.6 32.0% $1,663 24.0% $71,463 17.6% New Mexico 0.07 6 148 0.0% 1,428 -12.1% 9.7 -12.1% $10,790 -4.7% $23,595 0.1% Illinois 0.05 7 666 1.8% 6,755 3.1% 10.1 1.2% $3,093 -13.4% $136,180 -1.3% Utah 0.05 8 143 15.3% 1,412 9.8% 9.9 -4.8% $21,677 1.0% $56,156 -39.2% Maryland 0.03 9 203 -7.3% 2,286 -3.7% 11.3 3.9% $11,358 -2.9% $142,408 16.9% Colorado 0.03 10 168 3.7% 1,102 -16.1% 6.6 -19.1% $1,329 12.5% $52,460 -2.7% Georgia 0.03 11 314 -24.3% 2,396 -34.8% 7.6 -13.8% $24,737 -26.5% $55,739 -24.5% Oregon2 0.02 12 97 0.0% 963 -1.5% 9.9 -1.5% $799 -85.6% $76,594 -31.2% Oklahoma 0.01 13 57 26.7% 78 -13.0% 1.4 -31.3% $58,401 15.1% $71,521 0.9% North Dakota3 0.01 14 10 11.1% 117 47.1% 11.7 32.4% $8,980 14.3% $30,754 87.2% California 0.003 15 119 22.7% 1,099 32.8% 9.2 8.3% $5,123 -0.7% $98,708 17.0% New York4 0.00 16 0 0.0% 0 0.0% 0.0 0.0% $0 0.0% $0 0.0%
United States 0.04 n/a 11,734 3.9% 121,191 2.8% 10.3 -1.1% $21,245 2.3% $82,035 3.0%
Notes: 1 Kansas transitioned all section 1915(c) services to managed care on January 1, 2013. Starting on that date, all capitated expenditures were reported as waiver expenditures and no non-waiver expenditures were reported. 2 Oregon waiver expenditures for all waivers decreased in 2014 as the state implemented Community First Choice, which provides services previously funded by waivers. 3 The CMS 372 report for North Dakota Waiver 0834 indicated no participants were served in 2014. 4 For New York's waiver for this population, data for 2013 and 2014 are not included because no CMS 372 has been accepted by CMS from 2011 through 2014.

State Totals: Data for Waivers Targeting People with Brain Injuries, 2014 Table 9
Medicaid Section 1915(c) Waiver Data based on the CMS 372 Report, 2013 – 2014 67
State
Participants per 1,000
State Residents
Rank Total Participants
Percent Change
Participants 2013-14
Total Participant
Months
Percent Change Participant
Months 2013-14
Average Participant
Months
Percent Change Average
Participant Months 2013-14
Average Waiver
Expenditures
Percent Change Average Waiver
Expenditures 2013-14
Average Total Medicaid
Expenditures for Waiver Participants
Percent Change Average Medicaid
Expenditures 2013-14
Iowa 0.42 1 1,296 -4.1% 14,977 -2.8% 11.6 1.4% $24,421 7.6% $43,692 10.1% Wyoming 0.31 2 179 -2.7% 2,023 -4.8% 11.3 -2.1% $31,746 -31.9% $38,700 -27.4% Illinois 0.30 3 3,802 -12.8% 35,722 -14.4% 9.4 -1.8% $17,462 4.7% $38,720 81.4% Minnesota 0.27 4 1,497 1.6% 16,331 0.6% 10.9 -0.9% $65,193 -1.7% $76,865 -1.8% Kansas1 0.26 5 750 10.3% 7,644 27.0% 10.2 15.1% $39,784 19.1% $39,784 8.8% New Hampshire 0.19 6 246 6.0% 2,632 4.7% 10.7 -1.3% $85,278 -3.0% $85,517 -12.0% Connecticut 0.13 7 452 5.6% 5,341 5.2% 11.8 -0.4% $97,211 3.6% $107,572 5.2% Kentucky2 0.10 8 420 0.5% 4,692 2.7% 11.2 2.3% $88,619 1.3% $94,405 1.5% Colorado 0.06 9 314 10.6% 2,971 6.7% 9.5 -3.5% $45,655 0.6% $55,154 4.0% Pennsylvania 0.05 10 647 6.8% 7,272 2.8% 11.2 -3.7% $74,644 -2.2% $79,680 -2.5% Massachusetts 0.04 11 261 35.9% 2,458 28.5% 9.4 -5.4% $71,478 -0.5% $94,820 -2.6% Utah 0.04 12 113 6.6% 1,234 4.0% 10.9 -2.4% $32,164 2.4% $35,573 -0.4% New Jersey3 0.04 13 342 0.0% 3,911 0.0% 11.4 0.0% $75,871 0.0% $85,038 0.0% Indiana 0.03 14 192 -1.0% 2,083 -5.5% 10.8 -4.5% $26,787 0.7% $55,167 2.4% West Virginia 0.02 15 30 328.6% 224 721.7% 7.5 91.7% $16,869 102.7% $28,580 73.9% Wisconsin4 0.01 16 86 0.0% 1,010 0.0% 11.7 0.0% $67,967 0.0% $90,390 0.0% Nebraska5 0.01 17 21 5.0% 245 2.1% 11.7 -2.8% $32,843 0.3% $35,684 3.0% Maryland 0.01 18 63 6.8% 681 7.5% 10.8 0.7% $101,826 4.6% $109,065 4.2% New York6 0.00 19 0 0.0% 0 0.0% 0.0 0.0% $0 0.0% $0 0.0%
United States 0.03 n/a 10,711 -2.8% 111,452 -2.8% 10.4 0.0% $43,204 6.0% $57,749 17.2%
Notes: 1 Kansas transitioned all section 1915(c) services to managed care on January 1, 2013. Starting on that date, all capitated expenditures were reported as waiver expenditures and no non-waiver expenditures were reported. 2 The state submitted a CMS 372 for 2014 that was not accepted by CMS. Data from the CMS 372 for 2013 are included in this table. 3 For New Jersey's waiver for this population, the most recent CMS 372 accepted by CMS is from 2011. Data in these tables include 2011 data. New Jersey terminated all waivers for this population in 2014. 4 One or more CMS 372s were not submitted for either 2013 or 2014. Data from the CMS 372 for 2012 are included in this table for both years. 5 The state's 2013 CMS 372 for the waiver for this population was submitted but not accepted by CMS. Data from the CMS 372 for 2012 are included in this table. 6 For New York's waiver for this population, data for 2013 and 2014 are not included because no CMS 372 has been accepted by CMS from 2011 through 2014.

Comparison of 2014 Expenditures Data: CMS 372 and Waiver Expenditures Report Based on CMS-64 Data Table 10
Medicaid Section 1915(c) Waiver Data based on the CMS 372 Report, 2013 – 2014 68
State Waiver Number Target Population CMS 372 Report
Period Begin Date CMS 372 Report Period End Date
CMS 372 Total Waiver Expenditures
Waiver Expenditures Report for Fiscal Year
2014
CMS 372 Percentage Difference from Waiver Expenditures Report
Alabama 0001 Intellectual Disability 10/1/2013 9/30/2014 $313,168,523 $317,547,606 -1% Alabama 0068 Aging/Physical Disabilities 10/1/2013 9/30/2014 $59,711,061 $64,308,015 -7% Alabama 0241 Physical Disabilities 4/1/2013 3/31/2014 $5,043,237 $4,960,107 2% Alabama 0391 ID-Child 10/1/2013 9/30/2014 $5,539,554 $5,496,296 1% Alabama 0407 Physical Disabilities 2/22/2013 2/21/2014 $1,576,282 $1,923,541 -18% Alabama 0878 Aging/Physical Disabilities 4/1/2013 3/31/2014 $549,961 $771,546 -29% Alabama 40382 HIV/AIDS 10/1/2013 9/30/2014 $508,294 $512,804 -1% Alabama Total All n/a n/a $386,096,912 $395,519,915 -2% Alaska 0260 DD-incl. ID & ASD 7/1/2013 6/30/2014 $147,681,413 $138,732,700 6% Alaska 0261 Aging 7/1/2013 6/30/2014 $77,949,211 $72,475,368 8% Alaska 0262 Physical Disabilities 7/1/2013 6/3/2014 $8,617,373 $9,776,493 -12% Alaska 0263 Medically Fragile 7/1/2013 6/30/2014 $11,602,293 $9,742,556 19% Alaska Total All n/a n/a $245,850,290 $230,727,117 7% Arkansas1 0188 DD-incl. ID & ASD 7/1/2012 6/30/2013 $178,617,018 $184,697,983 -3% Arkansas1 0195 Aging 7/1/2012 6/30/2013 $59,176,879 $52,809,580 12% Arkansas1 0312 Physical Disabilities 7/1/2012 6/30/2013 $43,598,712 $44,876,614 -3% Arkansas1 0400 Aging/Physical Disabilities 12/1/2011 11/30/2012 $13,584,396 $16,759,028 -19% Arkansas1 0936 ASD-Child 10/1/2012 9/30/2013 $874,401 $2,522,585 -65% Arkansas1 Total All n/a n/a $295,851,406 $301,665,790 -2% California 0139 Physical Disabilities 1/1/2014 12/31/2014 $130,441,644 $85,240,615 53% California 0141 Aging 7/1/2013 6/30/2014 $39,046,818 $39,353,446 -1% California 0183 HIV/AIDS 1/1/2014 12/31/2014 $8,413,253 $19,199,840 -56% California 0336 DD-incl. ID & ASD 3/29/2013 3/28/2014 $2,590,002,145 $2,733,411,406 -5% California 0431 Aging/Physical Disabilities 3/1/2013 2/28/2014 $49,753,788 $46,229,015 8% California 0457 Physical Disabilities 1/1/2014 12/31/2014 $10,774,768 $42,330,522 -75% California 0486 Medically Fragile 12/27/2013 12/26/2014 $609,609 $758,791 -20% California 0855 Aging/Physical Disabilities 7/1/2013 6/30/2014 $488,445 $511,649 -5% California Total All n/a n/a $2,829,530,470 $2,967,035,284 -5% Colorado 0006 Aging/Physical Disabilities 7/1/2013 6/30/2014 $269,179,118 $278,000,702 -3% Colorado 0007 DD-incl. ID & ASD 7/1/2013 6/30/2014 $307,164,487 $308,632,554 0% Colorado1 0211 HIV/AIDS 1/1/2013 12/31/2013 $420,026 $120,561 248% Colorado 0268 Serious Mental Illness 7/1/2013 6/30/2014 $31,477,254 $32,164,647 -2% Colorado 0288 Brain Injuries 7/1/2013 6/30/2014 $14,335,775 $14,422,854 -1% Colorado 0293 DD-incl. ID & ASD 7/1/2013 6/30/2014 $38,987,011 $39,023,669 0% Colorado 0305 DD-Child (incl. ID & ASD) 7/1/2013 6/30/2014 $3,037,994 $3,052,286 0% Colorado 0434 ASD-Child 1/1/2014 12/31/2014 $669,622 $791,704 -15% Colorado 0450 Medically Fragile 7/1/2013 6/30/2014 $223,309 $230,780 -3%
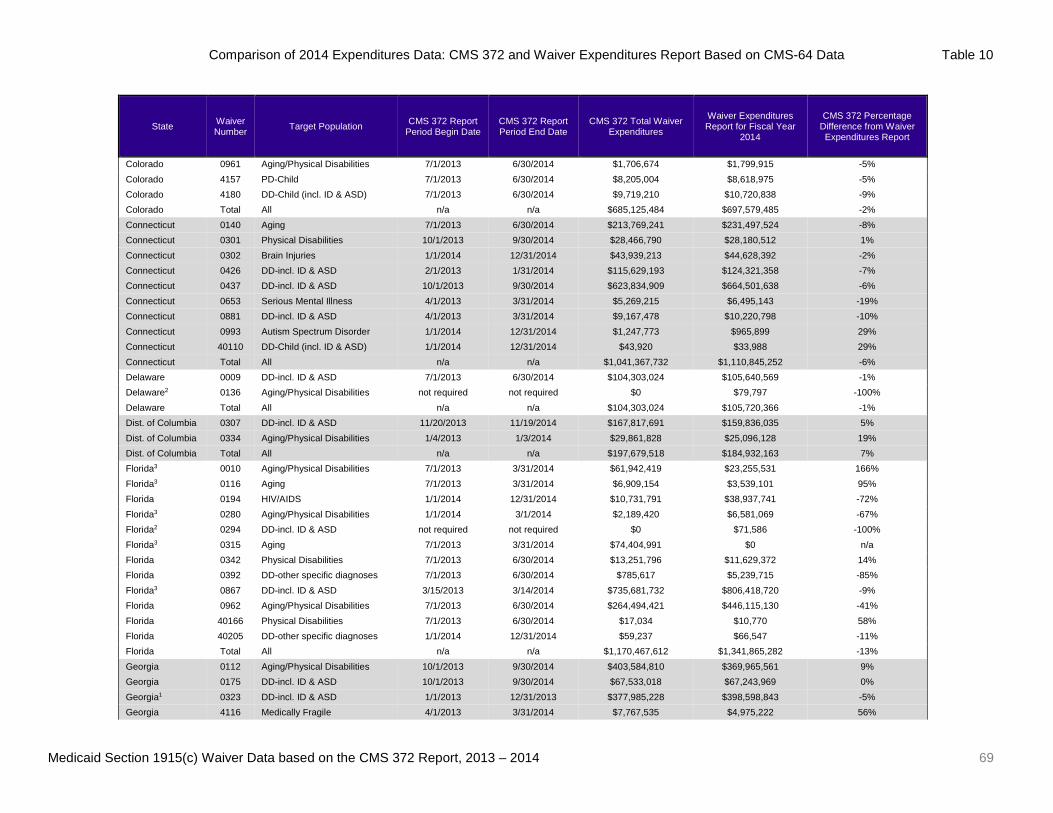
Comparison of 2014 Expenditures Data: CMS 372 and Waiver Expenditures Report Based on CMS-64 Data Table 10
Medicaid Section 1915(c) Waiver Data based on the CMS 372 Report, 2013 – 2014 69
State Waiver Number Target Population CMS 372 Report
Period Begin Date CMS 372 Report Period End Date
CMS 372 Total Waiver Expenditures
Waiver Expenditures Report for Fiscal Year
2014
CMS 372 Percentage Difference from Waiver Expenditures Report
Colorado 0961 Aging/Physical Disabilities 7/1/2013 6/30/2014 $1,706,674 $1,799,915 -5% Colorado 4157 PD-Child 7/1/2013 6/30/2014 $8,205,004 $8,618,975 -5% Colorado 4180 DD-Child (incl. ID & ASD) 7/1/2013 6/30/2014 $9,719,210 $10,720,838 -9% Colorado Total All n/a n/a $685,125,484 $697,579,485 -2% Connecticut 0140 Aging 7/1/2013 6/30/2014 $213,769,241 $231,497,524 -8% Connecticut 0301 Physical Disabilities 10/1/2013 9/30/2014 $28,466,790 $28,180,512 1% Connecticut 0302 Brain Injuries 1/1/2014 12/31/2014 $43,939,213 $44,628,392 -2% Connecticut 0426 DD-incl. ID & ASD 2/1/2013 1/31/2014 $115,629,193 $124,321,358 -7% Connecticut 0437 DD-incl. ID & ASD 10/1/2013 9/30/2014 $623,834,909 $664,501,638 -6% Connecticut 0653 Serious Mental Illness 4/1/2013 3/31/2014 $5,269,215 $6,495,143 -19% Connecticut 0881 DD-incl. ID & ASD 4/1/2013 3/31/2014 $9,167,478 $10,220,798 -10% Connecticut 0993 Autism Spectrum Disorder 1/1/2014 12/31/2014 $1,247,773 $965,899 29% Connecticut 40110 DD-Child (incl. ID & ASD) 1/1/2014 12/31/2014 $43,920 $33,988 29% Connecticut Total All n/a n/a $1,041,367,732 $1,110,845,252 -6% Delaware 0009 DD-incl. ID & ASD 7/1/2013 6/30/2014 $104,303,024 $105,640,569 -1% Delaware2 0136 Aging/Physical Disabilities not required not required $0 $79,797 -100% Delaware Total All n/a n/a $104,303,024 $105,720,366 -1% Dist. of Columbia 0307 DD-incl. ID & ASD 11/20/2013 11/19/2014 $167,817,691 $159,836,035 5% Dist. of Columbia 0334 Aging/Physical Disabilities 1/4/2013 1/3/2014 $29,861,828 $25,096,128 19% Dist. of Columbia Total All n/a n/a $197,679,518 $184,932,163 7% Florida3 0010 Aging/Physical Disabilities 7/1/2013 3/31/2014 $61,942,419 $23,255,531 166% Florida3 0116 Aging 7/1/2013 3/31/2014 $6,909,154 $3,539,101 95% Florida 0194 HIV/AIDS 1/1/2014 12/31/2014 $10,731,791 $38,937,741 -72% Florida3 0280 Aging/Physical Disabilities 1/1/2014 3/1/2014 $2,189,420 $6,581,069 -67% Florida2 0294 DD-incl. ID & ASD not required not required $0 $71,586 -100% Florida3 0315 Aging 7/1/2013 3/31/2014 $74,404,991 $0 n/a Florida 0342 Physical Disabilities 7/1/2013 6/30/2014 $13,251,796 $11,629,372 14% Florida 0392 DD-other specific diagnoses 7/1/2013 6/30/2014 $785,617 $5,239,715 -85% Florida3 0867 DD-incl. ID & ASD 3/15/2013 3/14/2014 $735,681,732 $806,418,720 -9% Florida 0962 Aging/Physical Disabilities 7/1/2013 6/30/2014 $264,494,421 $446,115,130 -41% Florida 40166 Physical Disabilities 7/1/2013 6/30/2014 $17,034 $10,770 58% Florida 40205 DD-other specific diagnoses 1/1/2014 12/31/2014 $59,237 $66,547 -11% Florida Total All n/a n/a $1,170,467,612 $1,341,865,282 -13% Georgia 0112 Aging/Physical Disabilities 10/1/2013 9/30/2014 $403,584,810 $369,965,561 9% Georgia 0175 DD-incl. ID & ASD 10/1/2013 9/30/2014 $67,533,018 $67,243,969 0% Georgia1 0323 DD-incl. ID & ASD 1/1/2013 12/31/2013 $377,985,228 $398,598,843 -5% Georgia 4116 Medically Fragile 4/1/2013 3/31/2014 $7,767,535 $4,975,222 56%
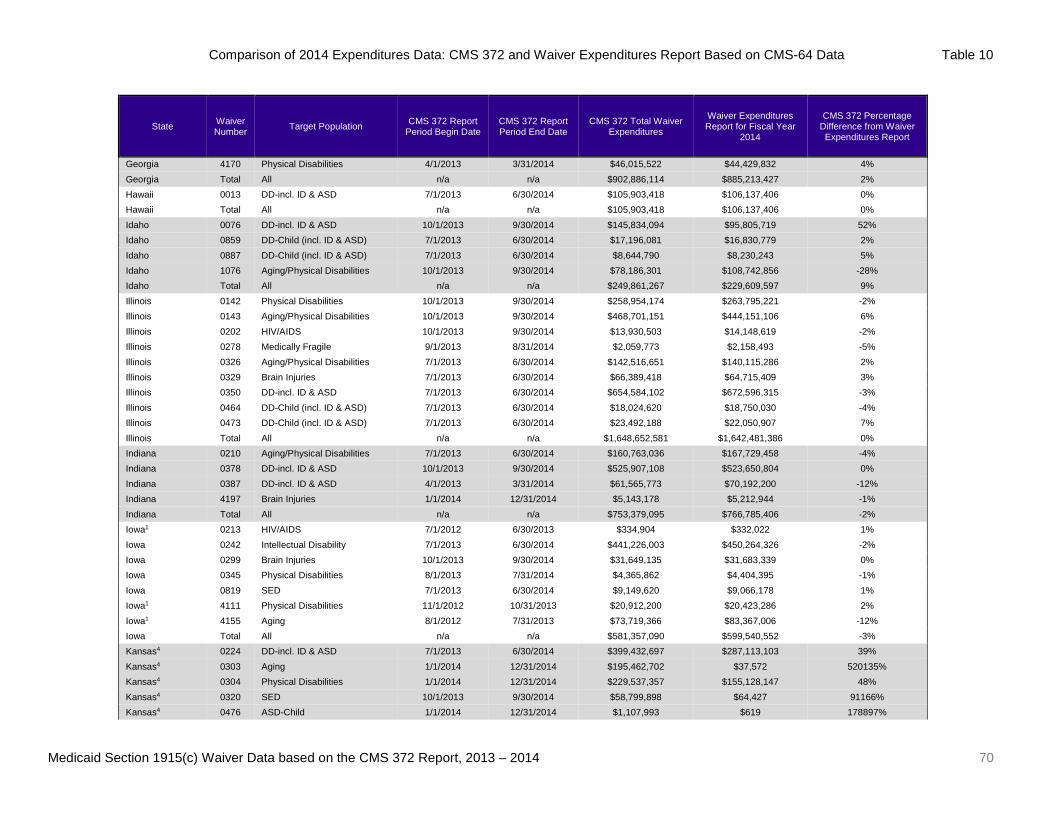
Comparison of 2014 Expenditures Data: CMS 372 and Waiver Expenditures Report Based on CMS-64 Data Table 10
Medicaid Section 1915(c) Waiver Data based on the CMS 372 Report, 2013 – 2014 70
State Waiver Number Target Population CMS 372 Report
Period Begin Date CMS 372 Report Period End Date
CMS 372 Total Waiver Expenditures
Waiver Expenditures Report for Fiscal Year
2014
CMS 372 Percentage Difference from Waiver Expenditures Report
Georgia 4170 Physical Disabilities 4/1/2013 3/31/2014 $46,015,522 $44,429,832 4% Georgia Total All n/a n/a $902,886,114 $885,213,427 2% Hawaii 0013 DD-incl. ID & ASD 7/1/2013 6/30/2014 $105,903,418 $106,137,406 0% Hawaii Total All n/a n/a $105,903,418 $106,137,406 0% Idaho 0076 DD-incl. ID & ASD 10/1/2013 9/30/2014 $145,834,094 $95,805,719 52% Idaho 0859 DD-Child (incl. ID & ASD) 7/1/2013 6/30/2014 $17,196,081 $16,830,779 2% Idaho 0887 DD-Child (incl. ID & ASD) 7/1/2013 6/30/2014 $8,644,790 $8,230,243 5% Idaho 1076 Aging/Physical Disabilities 10/1/2013 9/30/2014 $78,186,301 $108,742,856 -28% Idaho Total All n/a n/a $249,861,267 $229,609,597 9% Illinois 0142 Physical Disabilities 10/1/2013 9/30/2014 $258,954,174 $263,795,221 -2% Illinois 0143 Aging/Physical Disabilities 10/1/2013 9/30/2014 $468,701,151 $444,151,106 6% Illinois 0202 HIV/AIDS 10/1/2013 9/30/2014 $13,930,503 $14,148,619 -2% Illinois 0278 Medically Fragile 9/1/2013 8/31/2014 $2,059,773 $2,158,493 -5% Illinois 0326 Aging/Physical Disabilities 7/1/2013 6/30/2014 $142,516,651 $140,115,286 2% Illinois 0329 Brain Injuries 7/1/2013 6/30/2014 $66,389,418 $64,715,409 3% Illinois 0350 DD-incl. ID & ASD 7/1/2013 6/30/2014 $654,584,102 $672,596,315 -3% Illinois 0464 DD-Child (incl. ID & ASD) 7/1/2013 6/30/2014 $18,024,620 $18,750,030 -4% Illinois 0473 DD-Child (incl. ID & ASD) 7/1/2013 6/30/2014 $23,492,188 $22,050,907 7% Illinois Total All n/a n/a $1,648,652,581 $1,642,481,386 0% Indiana 0210 Aging/Physical Disabilities 7/1/2013 6/30/2014 $160,763,036 $167,729,458 -4% Indiana 0378 DD-incl. ID & ASD 10/1/2013 9/30/2014 $525,907,108 $523,650,804 0% Indiana 0387 DD-incl. ID & ASD 4/1/2013 3/31/2014 $61,565,773 $70,192,200 -12% Indiana 4197 Brain Injuries 1/1/2014 12/31/2014 $5,143,178 $5,212,944 -1% Indiana Total All n/a n/a $753,379,095 $766,785,406 -2% Iowa1 0213 HIV/AIDS 7/1/2012 6/30/2013 $334,904 $332,022 1% Iowa 0242 Intellectual Disability 7/1/2013 6/30/2014 $441,226,003 $450,264,326 -2% Iowa 0299 Brain Injuries 10/1/2013 9/30/2014 $31,649,135 $31,683,339 0% Iowa 0345 Physical Disabilities 8/1/2013 7/31/2014 $4,365,862 $4,404,395 -1% Iowa 0819 SED 7/1/2013 6/30/2014 $9,149,620 $9,066,178 1% Iowa1 4111 Physical Disabilities 11/1/2012 10/31/2013 $20,912,200 $20,423,286 2% Iowa1 4155 Aging 8/1/2012 7/31/2013 $73,719,366 $83,367,006 -12% Iowa Total All n/a n/a $581,357,090 $599,540,552 -3% Kansas4 0224 DD-incl. ID & ASD 7/1/2013 6/30/2014 $399,432,697 $287,113,103 39% Kansas4 0303 Aging 1/1/2014 12/31/2014 $195,462,702 $37,572 520135% Kansas4 0304 Physical Disabilities 1/1/2014 12/31/2014 $229,537,357 $155,128,147 48% Kansas4 0320 SED 10/1/2013 9/30/2014 $58,799,898 $64,427 91166% Kansas4 0476 ASD-Child 1/1/2014 12/31/2014 $1,107,993 $619 178897%

Comparison of 2014 Expenditures Data: CMS 372 and Waiver Expenditures Report Based on CMS-64 Data Table 10
Medicaid Section 1915(c) Waiver Data based on the CMS 372 Report, 2013 – 2014 71
State Waiver Number Target Population CMS 372 Report
Period Begin Date CMS 372 Report Period End Date
CMS 372 Total Waiver Expenditures
Waiver Expenditures Report for Fiscal Year
2014
CMS 372 Percentage Difference from Waiver Expenditures Report
Kansas4 4164 Brain Injuries 7/1/2013 6/30/2014 $29,837,765 $59,626 49942% Kansas4 4165 Medically Fragile 8/1/2013 7/31/2014 $41,799,166 $76,011,014 -45% Kansas4 Total All n/a n/a $955,977,577 $518,414,508 84% Kentucky 0144 Aging/Physical Disabilities 7/1/2013 6/30/2014 $87,241,015 $93,392,796 -7% Kentucky 0314 DD-incl. ID & ASD 9/1/2013 8/31/2014 $232,333,505 $295,142,226 -21% Kentucky1 0333 Brain Injuries 1/1/2013 12/31/2013 $21,416,291 $23,806,566 -10% Kentucky 0475 DD-incl. ID & ASD 9/1/2013 8/31/2014 $264,917,533 $265,931,833 0% Kentucky 0477 Brain Injuries 7/1/2013 6/30/2014 $15,803,863 $16,000,172 -1% Kentucky1 40146 Physical Disabilities 10/1/2012 9/30/2013 $5,153,692 $4,649,244 11% Kentucky Total All n/a n/a $626,865,897 $698,922,837 -10% Louisiana 0121 Aging/Physical Disabilities 7/1/2013 6/30/2014 $9,334,728 $9,400,520 -1% Louisiana 0361 DD-Child (incl. ID & ASD) 2/21/2013 2/20/2014 $12,645,777 $12,296,872 3% Louisiana 0401 DD-incl. ID & ASD 7/1/2013 6/30/2014 $420,004,711 $427,083,691 -2% Louisiana 0453 DD-incl. ID & ASD 7/1/2013 6/30/2014 $12,132,411 $12,098,612 0% Louisiana 0472 DD-incl. ID & ASD 7/1/2013 6/30/2014 $807,401 $850,798 -5% Louisiana 0866 Aging/Physical Disabilities 7/1/2013 6/30/2014 $109,035,399 $101,028,791 8% Louisiana 0889 SED 3/1/2013 2/28/2014 $832,539 $0 n/a Louisiana Total All n/a n/a $564,792,966 $562,759,284 0% Maine 0127 Physical Disabilities 7/1/2013 6/30/2014 $5,159,418 $9,385,853 -45% Maine 0159 ID & ASD 7/1/2013 6/30/2014 $291,699,930 $325,851,026 -10% Maine 0276 Aging/Physical Disabilities 7/1/2013 6/30/2014 $30,152,119 $20,212,097 49% Maine1 0467 ID & ASD 1/1/2013 12/31/2013 $24,132,609 ($1,214) -1987959% Maine 0995 DD - non-ID 7/1/2013 6/30/2014 $167,711 $159,255 5% Maine Total All n/a n/a $351,311,786 $355,607,017 -1% Maryland 0023 DD-incl. ID & ASD 7/1/2013 6/30/2014 $765,926,370 $767,047,616 0% Maryland5 0265 Aging/Physical Disabilities 7/1/2013 6/30/2014 $83,089,767 $67,536,258 23% Maryland 0339 ASD-Child 7/1/2013 6/30/2014 $31,255,856 $31,655,402 -1% Maryland5 0353 Physical Disabilities 7/1/2013 1/5/2014 $23,283,539 $14,068,141 66% Maryland 0645 Aging/Physical Disabilities 7/1/2013 6/30/2014 $71,155,998 $72,103,786 -1% Maryland 40118 Medically Fragile 7/1/2013 6/30/2014 $2,305,686 $1,201,500 92% Maryland 40198 Brain Injuries 7/1/2013 6/30/2014 $6,415,051 $6,748,980 -5% Maryland Total All n/a n/a $983,432,267 $960,361,683 2% Massachusetts 0059 Aging/Physical Disabilities 1/1/2014 12/31/2014 $142,151,265 $128,678,437 10% Massachusetts2 0064 Intellectual Disability not required not required $0 $203,756 -100% Massachusetts 0359 Brain Injuries 7/1/2013 6/30/2014 $6,832,172 $6,240,548 9% Massachusetts 0826 Intellectual Disability 7/1/2013 6/30/2014 $40,942,882 $40,829,820 0% Massachusetts 0827 Intellectual Disability 7/1/2013 6/30/2014 $876,039,475 $804,318,927 9%
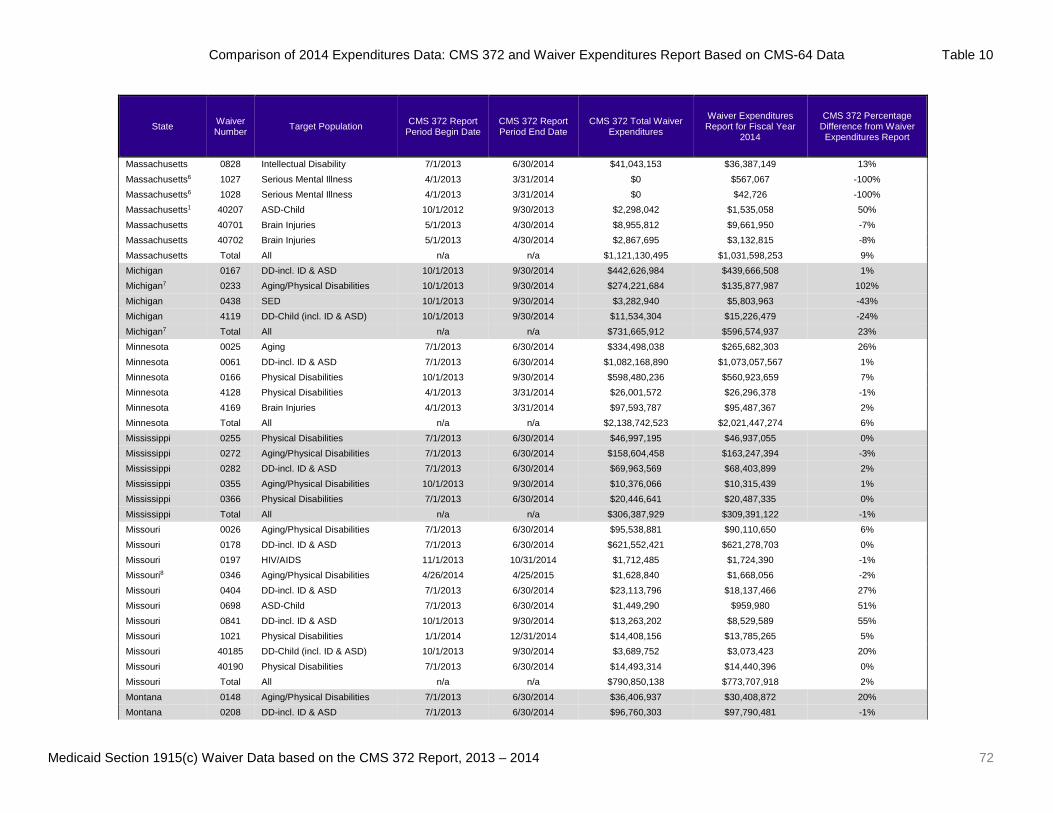
Comparison of 2014 Expenditures Data: CMS 372 and Waiver Expenditures Report Based on CMS-64 Data Table 10
Medicaid Section 1915(c) Waiver Data based on the CMS 372 Report, 2013 – 2014 72
State Waiver Number Target Population CMS 372 Report
Period Begin Date CMS 372 Report Period End Date
CMS 372 Total Waiver Expenditures
Waiver Expenditures Report for Fiscal Year
2014
CMS 372 Percentage Difference from Waiver Expenditures Report
Massachusetts 0828 Intellectual Disability 7/1/2013 6/30/2014 $41,043,153 $36,387,149 13% Massachusetts6 1027 Serious Mental Illness 4/1/2013 3/31/2014 $0 $567,067 -100% Massachusetts6 1028 Serious Mental Illness 4/1/2013 3/31/2014 $0 $42,726 -100% Massachusetts1 40207 ASD-Child 10/1/2012 9/30/2013 $2,298,042 $1,535,058 50% Massachusetts 40701 Brain Injuries 5/1/2013 4/30/2014 $8,955,812 $9,661,950 -7% Massachusetts 40702 Brain Injuries 5/1/2013 4/30/2014 $2,867,695 $3,132,815 -8% Massachusetts Total All n/a n/a $1,121,130,495 $1,031,598,253 9% Michigan 0167 DD-incl. ID & ASD 10/1/2013 9/30/2014 $442,626,984 $439,666,508 1% Michigan7 0233 Aging/Physical Disabilities 10/1/2013 9/30/2014 $274,221,684 $135,877,987 102% Michigan 0438 SED 10/1/2013 9/30/2014 $3,282,940 $5,803,963 -43% Michigan 4119 DD-Child (incl. ID & ASD) 10/1/2013 9/30/2014 $11,534,304 $15,226,479 -24% Michigan7 Total All n/a n/a $731,665,912 $596,574,937 23% Minnesota 0025 Aging 7/1/2013 6/30/2014 $334,498,038 $265,682,303 26% Minnesota 0061 DD-incl. ID & ASD 7/1/2013 6/30/2014 $1,082,168,890 $1,073,057,567 1% Minnesota 0166 Physical Disabilities 10/1/2013 9/30/2014 $598,480,236 $560,923,659 7% Minnesota 4128 Physical Disabilities 4/1/2013 3/31/2014 $26,001,572 $26,296,378 -1% Minnesota 4169 Brain Injuries 4/1/2013 3/31/2014 $97,593,787 $95,487,367 2% Minnesota Total All n/a n/a $2,138,742,523 $2,021,447,274 6% Mississippi 0255 Physical Disabilities 7/1/2013 6/30/2014 $46,997,195 $46,937,055 0% Mississippi 0272 Aging/Physical Disabilities 7/1/2013 6/30/2014 $158,604,458 $163,247,394 -3% Mississippi 0282 DD-incl. ID & ASD 7/1/2013 6/30/2014 $69,963,569 $68,403,899 2% Mississippi 0355 Aging/Physical Disabilities 10/1/2013 9/30/2014 $10,376,066 $10,315,439 1% Mississippi 0366 Physical Disabilities 7/1/2013 6/30/2014 $20,446,641 $20,487,335 0% Mississippi Total All n/a n/a $306,387,929 $309,391,122 -1% Missouri 0026 Aging/Physical Disabilities 7/1/2013 6/30/2014 $95,538,881 $90,110,650 6% Missouri 0178 DD-incl. ID & ASD 7/1/2013 6/30/2014 $621,552,421 $621,278,703 0% Missouri 0197 HIV/AIDS 11/1/2013 10/31/2014 $1,712,485 $1,724,390 -1% Missouri8 0346 Aging/Physical Disabilities 4/26/2014 4/25/2015 $1,628,840 $1,668,056 -2% Missouri 0404 DD-incl. ID & ASD 7/1/2013 6/30/2014 $23,113,796 $18,137,466 27% Missouri 0698 ASD-Child 7/1/2013 6/30/2014 $1,449,290 $959,980 51% Missouri 0841 DD-incl. ID & ASD 10/1/2013 9/30/2014 $13,263,202 $8,529,589 55% Missouri 1021 Physical Disabilities 1/1/2014 12/31/2014 $14,408,156 $13,785,265 5% Missouri 40185 DD-Child (incl. ID & ASD) 10/1/2013 9/30/2014 $3,689,752 $3,073,423 20% Missouri 40190 Physical Disabilities 7/1/2013 6/30/2014 $14,493,314 $14,440,396 0% Missouri Total All n/a n/a $790,850,138 $773,707,918 2% Montana 0148 Aging/Physical Disabilities 7/1/2013 6/30/2014 $36,406,937 $30,408,872 20% Montana 0208 DD-incl. ID & ASD 7/1/2013 6/30/2014 $96,760,303 $97,790,481 -1%

Comparison of 2014 Expenditures Data: CMS 372 and Waiver Expenditures Report Based on CMS-64 Data Table 10
Medicaid Section 1915(c) Waiver Data based on the CMS 372 Report, 2013 – 2014 73
State Waiver Number Target Population CMS 372 Report
Period Begin Date CMS 372 Report Period End Date
CMS 372 Total Waiver Expenditures
Waiver Expenditures Report for Fiscal Year
2014
CMS 372 Percentage Difference from Waiver Expenditures Report
Montana2 0371 DD-incl. ID & ASD not required not required $0 $859 -100% Montana 0455 Serious Mental Illness 7/1/2013 6/30/2014 $3,267,164 $3,306,160 -1% Montana 0667 ASD-Child 1/1/2014 12/31/2014 $1,582,289 $1,770,844 -11% Montana 1037 DD-incl. ID & ASD 10/1/2013 9/30/2014 $38,570 $38,571 0% Montana Total All n/a n/a $138,055,263 $133,315,787 4% Nebraska 0187 Aging/Physical Disabilities 8/1/2013 7/31/2014 $72,694,418 $78,033,299 -7% Nebraska1 0394 DD-incl. ID & ASD 1/1/2013 12/31/2013 $10,824,436 $11,062,407 -2% Nebraska1 0396 DD-incl. ID & ASD 1/1/2013 12/31/2013 $206,959,936 $213,581,258 -3% Nebraska1 4154 DD-Child (incl. ID & ASD) 6/1/2012 5/31/2013 $19,824,559 $19,656,829 1% Nebraska 40199 Brain Injuries 10/1/2013 9/30/2014 $689,711 $661,095 4% Nebraska Total All n/a n/a $310,993,060 $322,994,888 -4% Nevada 0125 DD-incl. ID & ASD 10/1/2013 9/30/2014 $89,324,937 $81,029,536 10% Nevada 0152 Aging 7/1/2013 6/30/2014 $10,305,153 $9,924,286 4% Nevada1 0452 Aging/Physical Disabilities 7/1/2011 6/30/2012 $266,816 $371,156 -28% Nevada 4150 Physical Disabilities 1/1/2014 12/31/2014 $3,777,251 $3,969,853 -5% Nevada Total All n/a n/a $103,674,156 $95,294,831 9% New Hampshire 0053 DD-incl. ID & ASD 9/1/2013 8/31/2014 $203,065,424 $213,259,361 -5% New Hampshire 0060 Aging/Physical Disabilities 7/1/2013 6/30/2014 $45,646,057 $50,130,161 -9% New Hampshire 0397 DD-Child (incl. ID & ASD) 1/1/2014 12/31/2014 $4,680,603 $5,136,464 -9% New Hampshire 4177 Brain Injuries 11/1/2013 10/31/2014 $20,978,426 $22,254,385 -6% New Hampshire Total All n/a n/a $274,370,510 $290,780,371 -6% New Jersey9 0031 DD-incl. ID & ASD 10/1/2010 9/30/2011 $604,997,705 $824,873,688 -27% New Jersey9 0032 Aging/Physical Disabilities 10/1/2010 9/30/2011 $168,441,873 $94,722 177728% New Jersey9 0160 HIV/AIDS 3/1/2010 2/28/2011 $580,651 $0 n/a New Jersey9 4133 Physical Disabilities 4/1/2011 3/31/2012 $16,784,149 $173,684 9564% New Jersey9 4174 Brain Injuries 7/1/2010 6/30/2011 $25,948,003 $56,827 45561% New Jersey9 Total All n/a n/a $816,752,381 $825,198,921 -1% New Mexico2 0161 HIV/AIDS not required not required $0 $65,441 -100% New Mexico 0173 DD-incl. ID & ASD 7/1/2013 6/30/2014 $268,436,667 $272,350,538 -1% New Mexico 0223 Medically Fragile 7/1/2013 6/30/2014 $1,596,927 $1,601,579 0% New Mexico 0448 DD-incl. ID & ASD 10/1/2013 9/30/2014 $25,424,526 $27,586,517 -8% New Mexico2 0449 Aging/Physical Disabilities not required not required $0 $12,973,334 -100% New Mexico Total All n/a n/a $295,458,120 $314,577,409 -6% New York1 0034 Aging/Physical Disabilities 9/1/2012 8/31/2013 $26,923,490 $10,637,417 153% New York 0238 DD-incl. ID & ASD 10/1/2013 9/30/2014 $4,919,512,736 $4,632,874,172 6% New York10 0269 Brain Injuries n/a n/a $0 $155,770,721 -100% New York10 0296 SED n/a n/a $0 $54,904,820 -100%
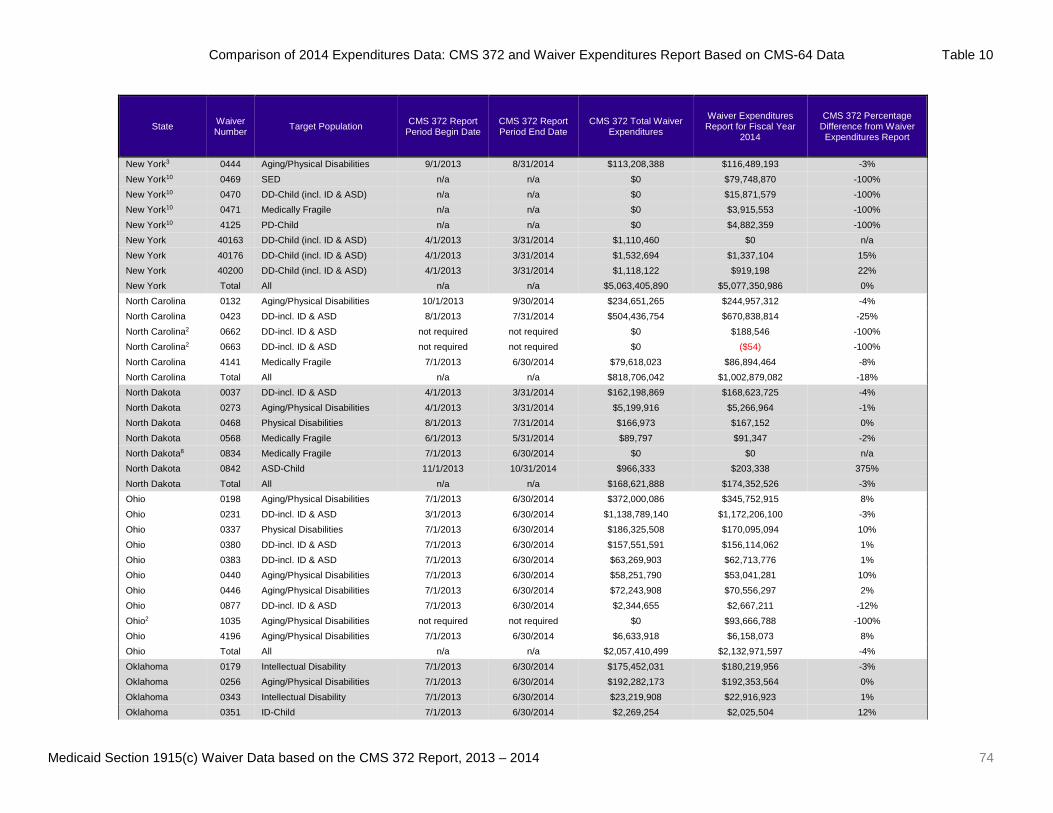
Comparison of 2014 Expenditures Data: CMS 372 and Waiver Expenditures Report Based on CMS-64 Data Table 10
Medicaid Section 1915(c) Waiver Data based on the CMS 372 Report, 2013 – 2014 74
State Waiver Number Target Population CMS 372 Report
Period Begin Date CMS 372 Report Period End Date
CMS 372 Total Waiver Expenditures
Waiver Expenditures Report for Fiscal Year
2014
CMS 372 Percentage Difference from Waiver Expenditures Report
New York3 0444 Aging/Physical Disabilities 9/1/2013 8/31/2014 $113,208,388 $116,489,193 -3% New York10 0469 SED n/a n/a $0 $79,748,870 -100% New York10 0470 DD-Child (incl. ID & ASD) n/a n/a $0 $15,871,579 -100% New York10 0471 Medically Fragile n/a n/a $0 $3,915,553 -100% New York10 4125 PD-Child n/a n/a $0 $4,882,359 -100% New York 40163 DD-Child (incl. ID & ASD) 4/1/2013 3/31/2014 $1,110,460 $0 n/a New York 40176 DD-Child (incl. ID & ASD) 4/1/2013 3/31/2014 $1,532,694 $1,337,104 15% New York 40200 DD-Child (incl. ID & ASD) 4/1/2013 3/31/2014 $1,118,122 $919,198 22% New York Total All n/a n/a $5,063,405,890 $5,077,350,986 0% North Carolina 0132 Aging/Physical Disabilities 10/1/2013 9/30/2014 $234,651,265 $244,957,312 -4% North Carolina 0423 DD-incl. ID & ASD 8/1/2013 7/31/2014 $504,436,754 $670,838,814 -25% North Carolina2 0662 DD-incl. ID & ASD not required not required $0 $188,546 -100% North Carolina2 0663 DD-incl. ID & ASD not required not required $0 ($54) -100% North Carolina 4141 Medically Fragile 7/1/2013 6/30/2014 $79,618,023 $86,894,464 -8% North Carolina Total All n/a n/a $818,706,042 $1,002,879,082 -18% North Dakota 0037 DD-incl. ID & ASD 4/1/2013 3/31/2014 $162,198,869 $168,623,725 -4% North Dakota 0273 Aging/Physical Disabilities 4/1/2013 3/31/2014 $5,199,916 $5,266,964 -1% North Dakota 0468 Physical Disabilities 8/1/2013 7/31/2014 $166,973 $167,152 0% North Dakota 0568 Medically Fragile 6/1/2013 5/31/2014 $89,797 $91,347 -2% North Dakota8 0834 Medically Fragile 7/1/2013 6/30/2014 $0 $0 n/a North Dakota 0842 ASD-Child 11/1/2013 10/31/2014 $966,333 $203,338 375% North Dakota Total All n/a n/a $168,621,888 $174,352,526 -3% Ohio 0198 Aging/Physical Disabilities 7/1/2013 6/30/2014 $372,000,086 $345,752,915 8% Ohio 0231 DD-incl. ID & ASD 3/1/2013 6/30/2014 $1,138,789,140 $1,172,206,100 -3% Ohio 0337 Physical Disabilities 7/1/2013 6/30/2014 $186,325,508 $170,095,094 10% Ohio 0380 DD-incl. ID & ASD 7/1/2013 6/30/2014 $157,551,591 $156,114,062 1% Ohio 0383 DD-incl. ID & ASD 7/1/2013 6/30/2014 $63,269,903 $62,713,776 1% Ohio 0440 Aging/Physical Disabilities 7/1/2013 6/30/2014 $58,251,790 $53,041,281 10% Ohio 0446 Aging/Physical Disabilities 7/1/2013 6/30/2014 $72,243,908 $70,556,297 2% Ohio 0877 DD-incl. ID & ASD 7/1/2013 6/30/2014 $2,344,655 $2,667,211 -12% Ohio2 1035 Aging/Physical Disabilities not required not required $0 $93,666,788 -100% Ohio 4196 Aging/Physical Disabilities 7/1/2013 6/30/2014 $6,633,918 $6,158,073 8% Ohio Total All n/a n/a $2,057,410,499 $2,132,971,597 -4% Oklahoma 0179 Intellectual Disability 7/1/2013 6/30/2014 $175,452,031 $180,219,956 -3% Oklahoma 0256 Aging/Physical Disabilities 7/1/2013 6/30/2014 $192,282,173 $192,353,564 0% Oklahoma 0343 Intellectual Disability 7/1/2013 6/30/2014 $23,219,908 $22,916,923 1% Oklahoma 0351 ID-Child 7/1/2013 6/30/2014 $2,269,254 $2,025,504 12%

Comparison of 2014 Expenditures Data: CMS 372 and Waiver Expenditures Report Based on CMS-64 Data Table 10
Medicaid Section 1915(c) Waiver Data based on the CMS 372 Report, 2013 – 2014 75
State Waiver Number Target Population CMS 372 Report
Period Begin Date CMS 372 Report Period End Date
CMS 372 Total Waiver Expenditures
Waiver Expenditures Report for Fiscal Year
2014
CMS 372 Percentage Difference from Waiver Expenditures Report
Oklahoma 0399 Intellectual Disability 7/1/2013 6/30/2014 $91,052,600 $91,662,148 -1% Oklahoma 0809 Aging 3/1/2013 2/28/2014 $400,518 $493,703 -19% Oklahoma 0810 Physical Disabilities 10/1/2013 9/30/2014 $1,140,347 $1,173,250 -3% Oklahoma 0811 Medically Fragile 7/1/2013 6/30/2014 $3,328,847 $3,743,859 -11% Oklahoma Total All n/a n/a $489,145,677 $494,588,907 -1% Oregon11 0117 DD-incl. ID & ASD 7/1/2013 6/30/2014 $80,631,780 $38,237,223 111% Oregon11 0185 Aging/Physical Disabilities 1/1/2014 12/31/2014 $24,931,530 ($43,820,308) -157% Oregon11 0375 DD-incl. ID & ASD 7/1/2013 6/30/2014 $27,197,904 $22,382,379 22% Oregon11 0565 PD-Child 3/1/2013 2/28/2014 $250,568 $74,571 236% Oregon11 40193 Medically Fragile 4/1/2013 3/31/2014 $77,537 $2,169,915 -96% Oregon11 40194 DD-Child (incl. ID & ASD) 4/1/2013 3/31/2014 $293,822 $3,825,998 -92% Oregon11 Total All n/a n/a $133,383,141 $22,869,778 483% Pennsylvania 0147 Intellectual Disability 7/1/2013 6/30/2014 $1,769,969,115 $1,837,299,992 -4% Pennsylvania 0192 HIV/AIDS 1/1/2014 12/31/2014 $2,762,050 $1,315,363 110% Pennsylvania 0235 DD - non-ID 7/1/2013 6/30/2014 $79,847,467 $81,696,681 -2% Pennsylvania 0277 Physical Disabilities 7/1/2013 6/30/2014 $226,988,358 $240,648,483 -6% Pennsylvania 0279 Aging/Physical Disabilities 7/1/2013 6/30/2014 $591,624,022 $625,086,228 -5% Pennsylvania 0319 Physical Disabilities 7/1/2013 6/30/2014 $361,426,424 $385,845,889 -6% Pennsylvania 0324 DD-Child (incl. ID & ASD) 7/1/2013 6/30/2014 $9,500,101 $9,549,262 -1% Pennsylvania 0354 Intellectual Disability 7/1/2013 6/30/2014 $213,009,504 $220,868,873 -4% Pennsylvania 0386 Brain Injuries 7/1/2013 6/30/2014 $48,294,536 $50,369,212 -4% Pennsylvania 0593 Autism Spectrum Disorder 7/1/2013 6/30/2014 $14,563,264 $15,929,720 -9% Pennsylvania Total All n/a n/a $3,317,984,840 $3,468,609,703 -4% South Carolina 0186 HIV/AIDS 7/1/2013 6/30/2014 $4,235,846 $4,328,115 -2% South Carolina 0237 DD-incl. ID & ASD 1/1/2014 12/31/2014 $261,880,273 $268,419,813 -2% South Carolina 0284 Physical Disabilities 7/1/2013 6/30/2014 $21,594,298 $22,382,375 -4% South Carolina 0405 Aging/Physical Disabilities 7/1/2013 6/30/2014 $137,700,022 $141,674,010 -3% South Carolina 0456 ASD-Child 1/1/2014 12/31/2014 $11,284,074 $16,935,025 -33% South Carolina 0675 Medically Fragile 1/1/2014 12/31/2014 $1,119,195 $559,616 100% South Carolina 0676 DD-incl. ID & ASD 7/1/2013 6/30/2014 $20,958,255 $21,254,045 -1% South Carolina 40181 Physical Disabilities 12/1/2013 11/30/2014 $1,969,800 $1,949,961 1% South Carolina Total All n/a n/a $460,741,763 $477,502,960 -4% South Dakota 0044 DD-incl. ID & ASD 6/1/2013 5/31/2014 $104,451,647 $105,470,956 -1% South Dakota 0189 Aging 10/1/2013 9/30/2014 $12,154,775 $12,372,460 -2% South Dakota 0264 Physical Disabilities 6/1/2013 5/31/2014 $3,038,926 $3,028,829 0% South Dakota 0338 DD-Child (incl. ID & ASD) 6/1/2013 5/31/2014 $2,619,751 $2,683,741 -2% South Dakota Total All n/a n/a $122,265,099 $123,555,986 -1%

Comparison of 2014 Expenditures Data: CMS 372 and Waiver Expenditures Report Based on CMS-64 Data Table 10
Medicaid Section 1915(c) Waiver Data based on the CMS 372 Report, 2013 – 2014 76
State Waiver Number Target Population CMS 372 Report
Period Begin Date CMS 372 Report Period End Date
CMS 372 Total Waiver Expenditures
Waiver Expenditures Report for Fiscal Year
2014
CMS 372 Percentage Difference from Waiver Expenditures Report
Tennessee 0128 Intellectual Disability 1/1/2014 12/31/2014 $601,398,632 $616,628,157 -2% Tennessee 0357 Intellectual Disability 1/1/2014 12/31/2014 $41,765,806 $44,599,745 -6% Tennessee 0427 Intellectual Disability 1/1/2014 12/31/2014 $22,419,590 $22,944,644 -2% Tennessee Total All n/a n/a $665,584,028 $684,172,546 -3% Texas 0110 Intellectual Disability 9/1/2013 8/31/2014 $896,453,308 $871,203,012 3% Texas 0181 Medically Fragile 9/1/2013 8/31/2014 $93,994,487 $94,538,429 -1% Texas 0221 DD - non-ID 9/1/2013 8/31/2014 $214,813,414 $206,418,522 4% Texas 0266 Aging/Physical Disabilities 9/1/2013 8/31/2014 $180,095,647 $167,492,830 8% Texas 0281 DD-other specific diagnoses 3/1/2013 2/28/2014 $7,761,528 $7,900,177 -2% Texas 0403 DD-incl. ID & ASD 3/1/2013 2/28/2014 $52,979,519 $53,500,702 -1% Texas 0657 SED 4/1/2013 3/31/2014 $1,500,377 $3,402,268 -56% Texas Total All n/a n/a $1,447,598,280 $1,404,455,940 3% Utah 0158 DD-incl. ID & ASD 7/1/2013 6/30/2014 $172,690,443 $172,089,244 0% Utah 0247 Aging 7/1/2013 6/30/2014 $3,975,709 $3,978,502 0% Utah 0292 Brain Injuries 7/1/2013 6/30/2014 $3,634,492 $3,620,139 0% Utah 0331 Physical Disabilities 7/1/2013 6/30/2014 $2,183,068 $2,173,755 0% Utah 0439 Aging/Physical Disabilities 7/1/2013 6/30/2014 $34,962,487 $36,659,850 -5% Utah 1029 ASD-Child 10/1/2013 9/30/2014 $5,493,755 $5,685,745 -3% Utah 40183 Medically Fragile 7/1/2013 6/30/2014 $3,099,743 $3,618,445 -14% Utah Total All n/a n/a $226,039,698 $227,825,680 -1% Virginia 0321 Aging/Physical Disabilities 7/1/2013 6/30/2014 $596,412,099 $672,690,372 -11% Virginia 0358 DD - non-ID 7/1/2013 6/30/2014 $26,015,953 $5,395,560 382% Virginia 0372 Intellectual Disability 7/1/2013 6/30/2014 $657,884,138 $595,511,723 10% Virginia 0430 Intellectual Disability 7/1/2013 6/30/2014 $3,437,763 $3,129,747 10% Virginia 4149 Physical Disabilities 7/1/2013 6/30/2014 $31,330,351 $45,378,571 -31% Virginia 40206 Aging/Physical Disabilities 7/1/2013 6/30/2014 $587,913 $658,498 -11% Virginia Total All n/a n/a $1,315,668,217 $1,322,764,471 -1% Washington 0049 Aging/Physical Disabilities 4/1/2013 3/31/2014 $649,103,599 $660,634,681 -2% Washington2 0408 DD-incl. ID & ASD not required not required $0 $863 -100% Washington 0409 DD-incl. ID & ASD 9/1/2013 8/31/2014 $196,889,261 $196,018,012 0% Washington 0410 DD-incl. ID & ASD 9/1/2013 8/31/2014 $379,825,384 $383,586,095 -1% Washington 0411 DD-incl. ID & ASD 9/1/2013 8/31/2014 $52,625,406 $53,264,087 -1% Washington 0443 Aging/Physical Disabilities 2/15/2013 2/14/2014 $6,068,058 $10,720,079 -43% Washington2 1086 Aging/Physical Disabilities not required not required $0 $450 -100% Washington 40669 DD-incl. ID & ASD 9/1/2013 8/31/2014 $6,035,659 $6,709,348 -10% Washington Total All n/a n/a $1,290,547,367 $1,310,933,615 -2% West Virginia 0133 DD-incl. ID & ASD 7/1/2013 6/30/2014 $355,331,328 $360,653,048 -1%
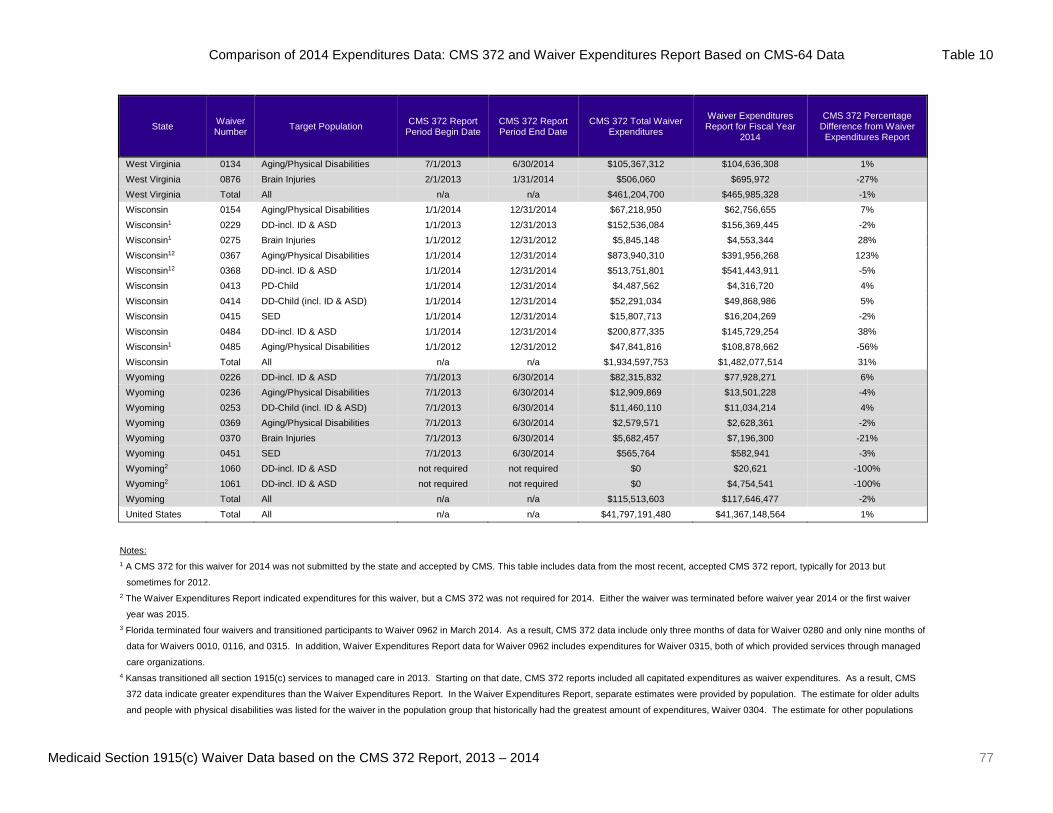
Comparison of 2014 Expenditures Data: CMS 372 and Waiver Expenditures Report Based on CMS-64 Data Table 10
Medicaid Section 1915(c) Waiver Data based on the CMS 372 Report, 2013 – 2014 77
State Waiver Number Target Population CMS 372 Report
Period Begin Date CMS 372 Report Period End Date
CMS 372 Total Waiver Expenditures
Waiver Expenditures Report for Fiscal Year
2014
CMS 372 Percentage Difference from Waiver Expenditures Report
West Virginia 0134 Aging/Physical Disabilities 7/1/2013 6/30/2014 $105,367,312 $104,636,308 1% West Virginia 0876 Brain Injuries 2/1/2013 1/31/2014 $506,060 $695,972 -27% West Virginia Total All n/a n/a $461,204,700 $465,985,328 -1% Wisconsin 0154 Aging/Physical Disabilities 1/1/2014 12/31/2014 $67,218,950 $62,756,655 7% Wisconsin1 0229 DD-incl. ID & ASD 1/1/2013 12/31/2013 $152,536,084 $156,369,445 -2% Wisconsin1 0275 Brain Injuries 1/1/2012 12/31/2012 $5,845,148 $4,553,344 28% Wisconsin12 0367 Aging/Physical Disabilities 1/1/2014 12/31/2014 $873,940,310 $391,956,268 123% Wisconsin12 0368 DD-incl. ID & ASD 1/1/2014 12/31/2014 $513,751,801 $541,443,911 -5% Wisconsin 0413 PD-Child 1/1/2014 12/31/2014 $4,487,562 $4,316,720 4% Wisconsin 0414 DD-Child (incl. ID & ASD) 1/1/2014 12/31/2014 $52,291,034 $49,868,986 5% Wisconsin 0415 SED 1/1/2014 12/31/2014 $15,807,713 $16,204,269 -2% Wisconsin 0484 DD-incl. ID & ASD 1/1/2014 12/31/2014 $200,877,335 $145,729,254 38% Wisconsin1 0485 Aging/Physical Disabilities 1/1/2012 12/31/2012 $47,841,816 $108,878,662 -56% Wisconsin Total All n/a n/a $1,934,597,753 $1,482,077,514 31% Wyoming 0226 DD-incl. ID & ASD 7/1/2013 6/30/2014 $82,315,832 $77,928,271 6% Wyoming 0236 Aging/Physical Disabilities 7/1/2013 6/30/2014 $12,909,869 $13,501,228 -4% Wyoming 0253 DD-Child (incl. ID & ASD) 7/1/2013 6/30/2014 $11,460,110 $11,034,214 4% Wyoming 0369 Aging/Physical Disabilities 7/1/2013 6/30/2014 $2,579,571 $2,628,361 -2% Wyoming 0370 Brain Injuries 7/1/2013 6/30/2014 $5,682,457 $7,196,300 -21% Wyoming 0451 SED 7/1/2013 6/30/2014 $565,764 $582,941 -3% Wyoming2 1060 DD-incl. ID & ASD not required not required $0 $20,621 -100% Wyoming2 1061 DD-incl. ID & ASD not required not required $0 $4,754,541 -100% Wyoming Total All n/a n/a $115,513,603 $117,646,477 -2% United States Total All n/a n/a $41,797,191,480 $41,367,148,564 1%
Notes: 1 A CMS 372 for this waiver for 2014 was not submitted by the state and accepted by CMS. This table includes data from the most recent, accepted CMS 372 report, typically for 2013 but
sometimes for 2012. 2 The Waiver Expenditures Report indicated expenditures for this waiver, but a CMS 372 was not required for 2014. Either the waiver was terminated before waiver year 2014 or the first waiver
year was 2015. 3 Florida terminated four waivers and transitioned participants to Waiver 0962 in March 2014. As a result, CMS 372 data include only three months of data for Waiver 0280 and only nine months of
data for Waivers 0010, 0116, and 0315. In addition, Waiver Expenditures Report data for Waiver 0962 includes expenditures for Waiver 0315, both of which provided services through managed
care organizations. 4 Kansas transitioned all section 1915(c) services to managed care in 2013. Starting on that date, CMS 372 reports included all capitated expenditures as waiver expenditures. As a result, CMS
372 data indicate greater expenditures than the Waiver Expenditures Report. In the Waiver Expenditures Report, separate estimates were provided by population. The estimate for older adults
and people with physical disabilities was listed for the waiver in the population group that historically had the greatest amount of expenditures, Waiver 0304. The estimate for other populations

Comparison of 2014 Expenditures Data: CMS 372 and Waiver Expenditures Report Based on CMS-64 Data Table 10
Medicaid Section 1915(c) Waiver Data based on the CMS 372 Report, 2013 – 2014 78
(including people with brain injuries, children with ASD, and medically fragile children) was listed for Waiver 4165, which historically had the greatest amount of expenditures among these
waivers. 5 Maryland terminated Waiver 0353 and transitioned participants to Waiver 0265 in January 2014. As a result, CMS 372 data include only seven months of data for Waiver 0353. 6 CMS 372 reports for Massachusetts Waivers 1027 and 1028 and North Dakota Waiver 0834 indicated no participants were served in 2014 and no expenditures were incurred. 7 Michigan Waiver Expenditures Report data for 2014 were incomplete because the state's transitioned from Waiver 0233 to a new managed care waiver during that year. State estimates, the
source for most managed care data in the report, were included starting in 2015. 8 The 2014 CMS 372 report for Missouri Waiver 0346 was for a temporary extension and included only four months of data. Data for 2015 are used in this table because 2013 data also were for a
partial year. 9 For most of New Jersey's waivers, the most recent CMS 372 accepted by CMS is from 2011. Data in these tables include 2011. New Jersey terminated all waivers except Waiver 0031 in 2014.
The Waiver Expenditures Report does not include state estimates for managed care spending in 2014 because New Jersey reported it within its section 1115 demonstration. 10 For New York Waivers 0269, 0296, 0469, 0470, 0471, and 4125, no CMS 372 has been accepted by CMS from 2011 through 2014. No CMS 372 data are included in the data tables. 11 Oregon waiver expenditures for all waivers decreased in 2014 as the state implemented Community First Choice, which provides services previously funded by waivers. 12 Wisconsin combined its Family Care section 1915(c) waivers in 2015: one waiver targeted people with developmental disabilities and the other targeted older adults and people with physical
disabilities. The state submitted a single CMS 372 report for both waivers in 2013 and 2014. Estimates for each waiver were developed based on the percentage of Family Care participants,
total days of service, and expenditures for each waiver in 2012.