medicaid financing: an overview of the federal medicaid ... · medicaid) , kaiser . kaiser . treet...
TRANSCRIPT
medicaid
kaiser commiss ion o n
PO
L
I
C
Y
BR
I
E
F
a n d t h e uninsured
1 3 3 0 G S T R E E T N W , W A S H I N G T O N , D C 2 0 0 0 5
P H O N E : ( 2 0 2 ) 3 4 7 - 5 2 7 0 , F A X : ( 2 0 2 ) 3 4 7 - 5 2 7 4
W E B S I T E : W W W . K F F . O R G / K C M U
September 2012
Medicaid Financing: An Overview of the Federal Medicaid Matching Rate (FMAP)
Key Findings in Brief
The Federal Medical Assistance Percentage (FMAP) determines the federal share of the cost of Medicaid services in each state. The FMAP is based on a formula in the federal Medicaid statute that is based on state per capita
income. The lower a state’s per capita income, the higher the state’s FMAP, or federal Medicaid matching rate. FMAPs vary from a floor of 50 percent to a high of 74 percent.
There are exceptions to the FMAP formula for certain services and certain populations. The Affordable Care Act (ACA) provides an FMAP of 100 percent for the period 2014-2016 and at least 90 percent thereafter for the cost of covering newly eligible low-income adults.
The costs of administration are generally matched at 50 percent, although some administrative activities receive a higher federal matching rate.
The federal matching rates for the costs of the Children’s Health Insurance Program (CHIP) are enhanced relative to the Medicaid FMAP.
The FMAP has a multiplier effect in state economies. Typically states are required to spend some of their own funds to draw down federal Medicaid
dollars. For every $1 in state funds spent on Medicaid, states can draw down at least $1 additional from the federal government.
States with higher FMAPs can leverage as much as $2.85 in federal matching funds for each $1 they spend.
States that extend Medicaid coverage under the ACA will receive a favorable FMAP for the expansion population. The federal government will pick up the entire cost of coverage for the first three years, which will be scaled down to a matching rate of 9:1 in 2020 and beyond. So, for every $1 a state spends on this population, it will leverage $9 in federal matching funds. This will not vary by per capita income like the basic FMAP.
The FMAP formula has remained basically unchanged throughout the history of the Medicaid program, and temporary adjustments to the formula have resulted in FMAP increases, not decreases. On two separate occasions during the last decade, FMAPs were temporarily increased to provide
fiscal relief to states during economic downturns. Specific-state FMAP adjustments have been made (i.e. for Louisiana following Hurricane Katrina). .
Medicaid is the federal-state program for health and long-term care coverage for low-income Americans. Since its enactment in 1965, the Medicaid program has used the Federal Medical Assistance Percentage (FMAP) to determine the share of the cost of covered services that the federal government will pay in each state. On average, the federal share has been 57 percent. Beginning in 2014, the Affordable Care Act (ACA) establishes enhanced FMAPs for the cost of services to low-income adults with incomes up to 138%1 of the Federal Poverty Level (FPL) who are not currently covered. The expansion FMAPs are 100 percent in 2014 through 2016, and then phase down to 90 percent in 2020 and beyond.2 To place these new FMAPs in context, this policy brief provides an overview of the FMAP and temporary changes to the formula over the history of the program.
2 00
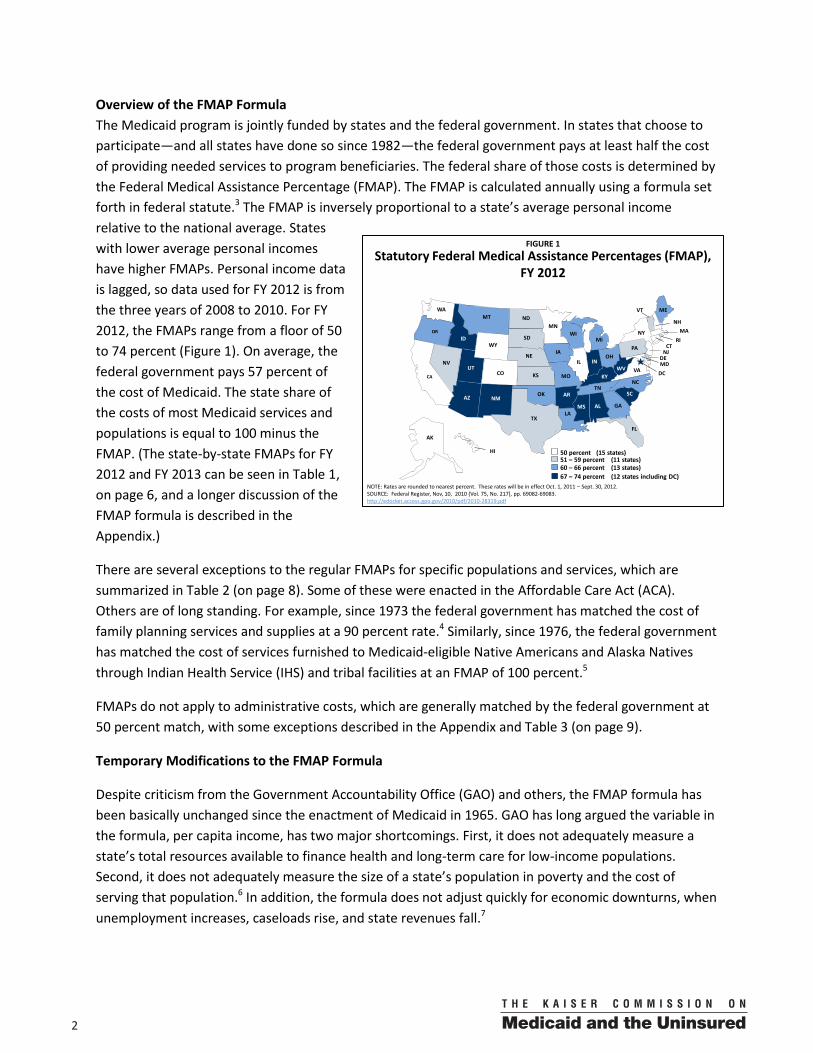
Overview of the FMAP Formula The Medicaid program is jointly funded by states and the federal government. In states that choose to participate—and all states have done so since 1982—the federal government pays at least half the cost of providing needed services to program beneficiaries. The federal share of those costs is determined by the Federal Medical Assistance Percentage (FMAP). The FMAP is calculated annually using a formula set forth in federal statute.3 The FMAP is inversely proportional to a state’s average personal income relative to the national average. States with lower average personal incomes have higher FMAPs. Personal income data is lagged, so data used for FY 2012 is from the three years of 2008 to 2010. For FY 2012, the FMAPs range from a floor of 50 to 74 percent (Figure 1). On average, the federal government pays 57 percent of the cost of Medicaid. The state share of the costs of most Medicaid services and populations is equal to 100 minus the FMAP. (The state-by-state FMAPs for FY 2012 and FY 2013 can be seen in Table 1, on page 6, and a longer discussion of the FMAP formula is described in the Appendix.)
There are several exceptions to the regular FMAPs for specific populations and services, which are summarized in Table 2 (on page 8). Some of these were enacted in the Affordable Care Act (ACA). Others are of long standing. For example, since 1973 the federal government has matched the cost of family planning services and supplies at a 90 percent rate.4 Similarly, since 1976, the federal government has matched the cost of services furnished to Medicaid-eligible Native Americans and Alaska Natives through Indian Health Service (IHS) and tribal facilities at an FMAP of 100 percent.5
FMAPs do not apply to administrative costs, which are generally matched by the federal government at 50 percent match, with some exceptions described in the Appendix and Table 3 (on page 9).
Temporary Modifications to the FMAP Formula
Despite criticism from the Government Accountability Office (GAO) and others, the FMAP formula has been basically unchanged since the enactment of Medicaid in 1965. GAO has long argued the variable in the formula, per capita income, has two major shortcomings. First, it does not adequately measure a state’s total resources available to finance health and long-term care for low-income populations. Second, it does not adequately measure the size of a state’s population in poverty and the cost of serving that population.6 In addition, the formula does not adjust quickly for economic downturns, when unemployment increases, caseloads rise, and state revenues fall.7
FIGURE 1
WY
WI
WV
WA
VA
VT
UT
TX
TN
SD
SC
RIPA
OR
OK
OH
ND
NC
NY
NM
NJ
NH
NVNE
MT
MO
MS
MN
MIMA
MD
ME
LA
KYKS
IAINIL
ID
HI
GA
FL
DC
DE
CT
COCA
ARAZ
AK
AL
NOTE: Rates are rounded to nearest percent. These rates will be in effect Oct. 1, 2011 – Sept. 30, 2012.SOURCE: Federal Register, Nov, 10, 2010 (Vol. 75, No. 217), pp. 69082-69083. http://edocket.access.gpo.gov/2010/pdf/2010-28319.pdf
67 – 74 percent (12 states including DC)60 – 66 percent (13 states)51 – 59 percent (11 states)50 percent (15 states)
Statutory Federal Medical Assistance Percentages (FMAP), FY 2012
300
There have, however, been two occasions on which Congress has temporarily increased FMAPs to provide fiscal relief to state Medicaid programs during recessions. The first occurred in response to the 2001 recession. During the 5-quarter period beginning April 2003 through June 2004, every state’s FMAP was increased by 2.95 percentage points, and every state was held harmless against any decline in its FMAP that would otherwise have occurred under the normal operation of the formula. The resulting additional federal assistance totaled $10 billion.8
The second increase occurred in response to the Great Recession of 2007-2009. As in the case of the 2001 recession, states were held harmless against any decline in their FMAP that would otherwise have occurred, and there was an across-the-board increase in FMAPs, although, in this case, the increase was 6.2 percentage points. In addition, there was an increase in FMAP ranging from 1.88 to 5.39 percentage points, based on the increase in a state’s unemployment rate. This three-part fiscal relief, including a 6-month phase-down, ran from October 2008 through June 3, 2011, and resulted in additional payments to states totaling $103 billion.9
Congress has also temporarily adjusted FMAPs for individual states that confront unusual circumstances. This happened in the cases of Alaska,10 Michigan,11 and, most recently, Louisiana, due to extreme fluctuations in state per capita income in the aftermath of Hurricane Katrina.12 In all of these cases, Congress enacted legislation to increase, not decrease, the FMAP. On one occasion in the early 1980s, legislation was passed to temporarily reduce federal Medicaid matching payments to states over a 3-year period, but this legislation did not alter the FMAP formula.13
Enhanced FMAPs in the ACA
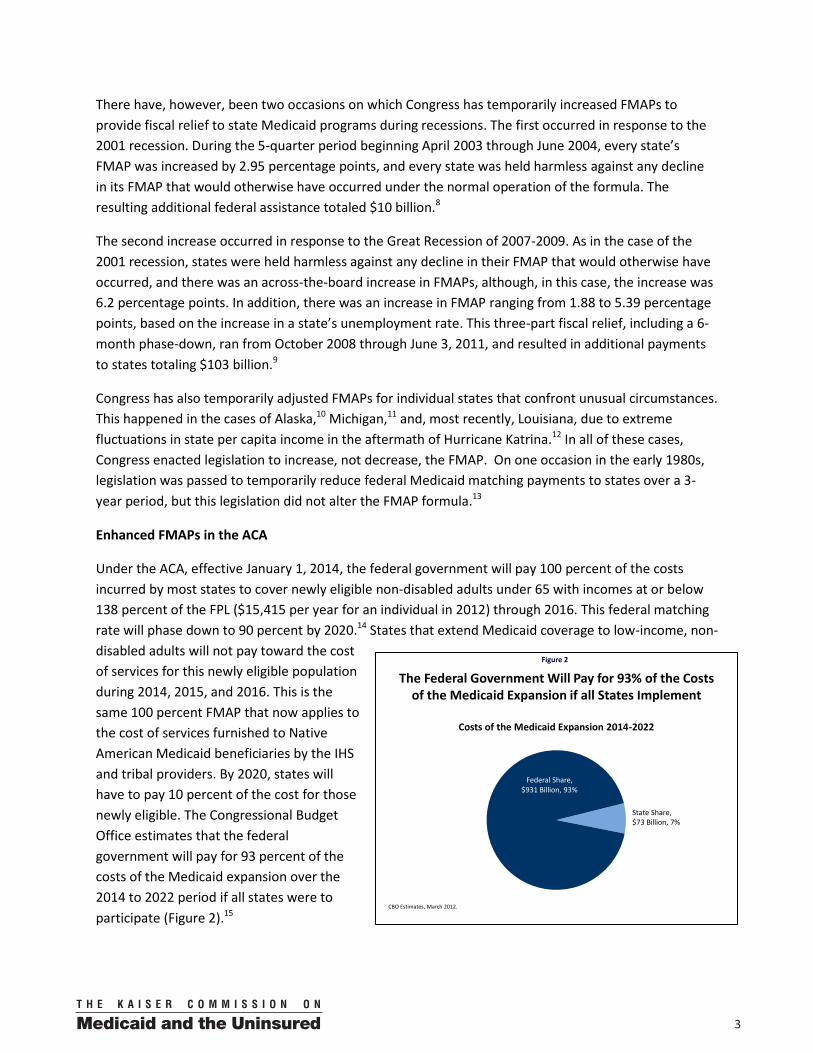
Under the ACA, effective January 1, 2014, the federal government will pay 100 percent of the costs incurred by most states to cover newly eligible non-disabled adults under 65 with incomes at or below 138 percent of the FPL ($15,415 per year for an individual in 2012) through 2016. This federal matching rate will phase down to 90 percent by 2020.14 States that extend Medicaid coverage to low-income, non-disabled adults will not pay toward the cost of services for this newly eligible population during 2014, 2015, and 2016. This is the same 100 percent FMAP that now applies to the cost of services furnished to Native American Medicaid beneficiaries by the IHS and tribal providers. By 2020, states will have to pay 10 percent of the cost for those newly eligible. The Congressional Budget Office estimates that the federal government will pay for 93 percent of the costs of the Medicaid expansion over the 2014 to 2022 period if all states were to participate (Figure 2).15
Figure 2
The Federal Government Will Pay for 93% of the Costs of the Medicaid Expansion if all States Implement
Federal Share, $931 Billion, 93%
Costs of the Medicaid Expansion 2014-2022
State Share, $73 Billion, 7%
CBO Estimates, March 2012.
4 00
In addition, federal regulations provide for a temporary increase in the federal administrative matching rate to 90 percent for the costs of upgrading eligibility and enrollment systems to prepare for implementation of coverage expansions under health reform.16
FMAP Multiplier
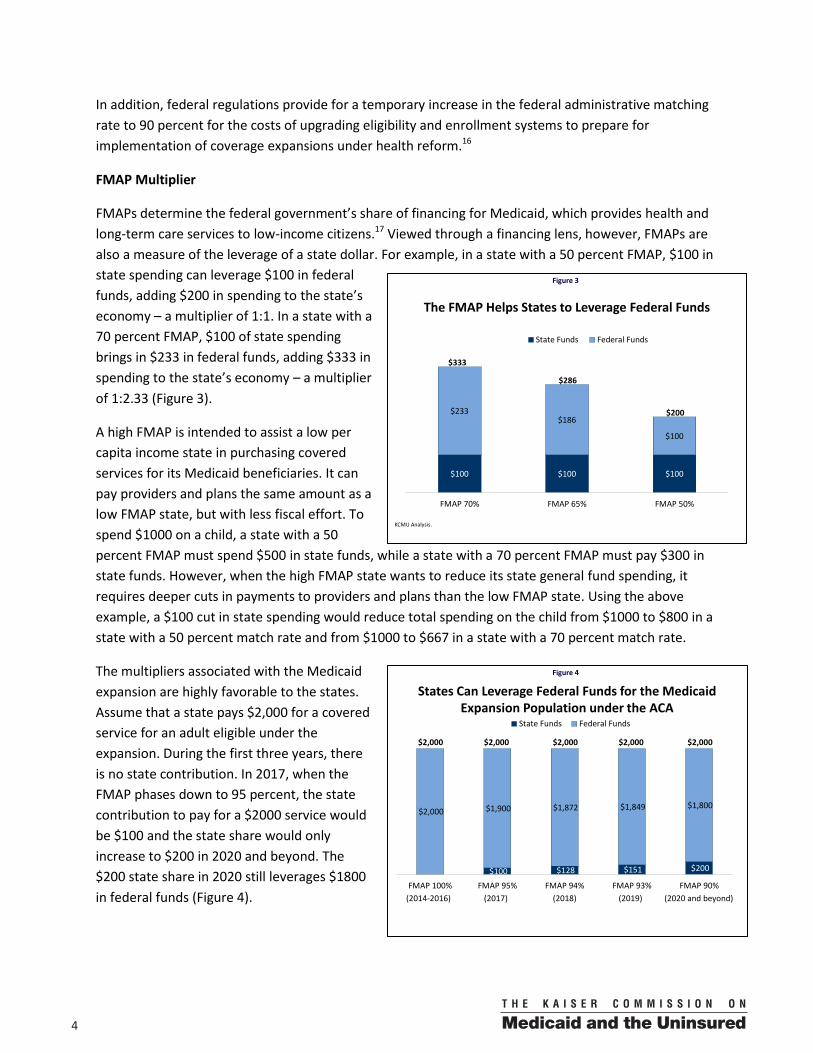
FMAPs determine the federal government’s share of financing for Medicaid, which provides health and long-term care services to low-income citizens.17 Viewed through a financing lens, however, FMAPs are also a measure of the leverage of a state dollar. For example, in a state with a 50 percent FMAP, $100 in state spending can leverage $100 in federal funds, adding $200 in spending to the state’s economy – a multiplier of 1:1. In a state with a 70 percent FMAP, $100 of state spending brings in $233 in federal funds, adding $333 in spending to the state’s economy – a multiplier of 1:2.33 (Figure 3).
A high FMAP is intended to assist a low per capita income state in purchasing covered services for its Medicaid beneficiaries. It can pay providers and plans the same amount as a low FMAP state, but with less fiscal effort. To spend $1000 on a child, a state with a 50 percent FMAP must spend $500 in state funds, while a state with a 70 percent FMAP must pay $300 in state funds. However, when the high FMAP state wants to reduce its state general fund spending, it requires deeper cuts in payments to providers and plans than the low FMAP state. Using the above example, a $100 cut in state spending would reduce total spending on the child from $1000 to $800 in a state with a 50 percent match rate and from $1000 to $667 in a state with a 70 percent match rate.
The multipliers associated with the Medicaid expansion are highly favorable to the states. Assume that a state pays $2,000 for a covered service for an adult eligible under the expansion. During the first three years, there is no state contribution. In 2017, when the FMAP phases down to 95 percent, the state contribution to pay for a $2000 service would be $100 and the state share would only increase to $200 in 2020 and beyond. The $200 state share in 2020 still leverages $1800 in federal funds (Figure 4).
Figure 3
The FMAP Helps States to Leverage Federal Funds
$100 $100 $100
$233 $186
$100
FMAP 70% FMAP 65% FMAP 50%
State Funds Federal Funds
KCMU Analysis.
$333
$286
$200
Figure 4
States Can Leverage Federal Funds for the Medicaid Expansion Population under the ACA
$100 $128 $151 $200
$2,000 $1,900 $1,872 $1,849 $1,800
FMAP 100% FMAP 95% FMAP 94% FMAP 93% FMAP 90%
State Funds Federal Funds
(2014-2016) (2017) (2018) (2019) (2020 and beyond)
$2,000 $2,000$2,000$2,000$2,000
500
Conclusion
The FMAP formula governs the relative share of the cost of Medicaid services that the federal government pays. This formula has been basically unchanged since the enactment of the program in 1965. There are some exceptions to the formula for particular services and populations—i.e., 100% for services furnished through IHS and tribal facilities and 90% for family planning services and supplies. Those exceptions are higher than any state’s regular FMAP, apply uniformly to all states, and have been unchanged since their enactment in the 1970s. In recent years, Congress has twice increased FMAPs across the board to provide temporary fiscal relief to states during recessions. The historical record, which shows stability in availability of federal funds over time, can help inform states as they consider whether to move forward with the Medicaid expansion.
6 00
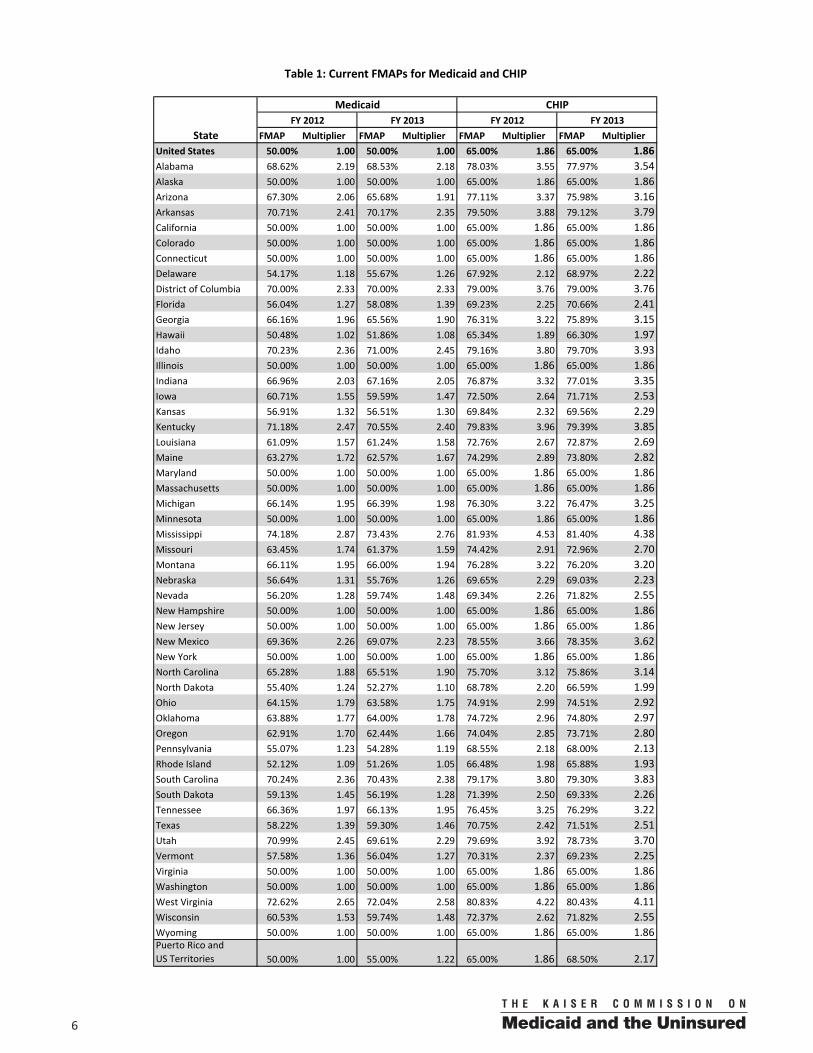
FMAP Multiplier FMAP Multiplier FMAP Multiplier FMAP MultiplierUnited States 50.00% 1.00 50.00% 1.00 65.00% 1.86 65.00% 1.86Alabama 68.62% 2.19 68.53% 2.18 78.03% 3.55 77.97% 3.54Alaska 50.00% 1.00 50.00% 1.00 65.00% 1.86 65.00% 1.86Arizona 67.30% 2.06 65.68% 1.91 77.11% 3.37 75.98% 3.16Arkansas 70.71% 2.41 70.17% 2.35 79.50% 3.88 79.12% 3.79California 50.00% 1.00 50.00% 1.00 65.00% 1.86 65.00% 1.86Colorado 50.00% 1.00 50.00% 1.00 65.00% 1.86 65.00% 1.86Connecticut 50.00% 1.00 50.00% 1.00 65.00% 1.86 65.00% 1.86Delaware 54.17% 1.18 55.67% 1.26 67.92% 2.12 68.97% 2.22District of Columbia 70.00% 2.33 70.00% 2.33 79.00% 3.76 79.00% 3.76Florida 56.04% 1.27 58.08% 1.39 69.23% 2.25 70.66% 2.41Georgia 66.16% 1.96 65.56% 1.90 76.31% 3.22 75.89% 3.15Hawaii 50.48% 1.02 51.86% 1.08 65.34% 1.89 66.30% 1.97Idaho 70.23% 2.36 71.00% 2.45 79.16% 3.80 79.70% 3.93Illinois 50.00% 1.00 50.00% 1.00 65.00% 1.86 65.00% 1.86Indiana 66.96% 2.03 67.16% 2.05 76.87% 3.32 77.01% 3.35Iowa 60.71% 1.55 59.59% 1.47 72.50% 2.64 71.71% 2.53Kansas 56.91% 1.32 56.51% 1.30 69.84% 2.32 69.56% 2.29Kentucky 71.18% 2.47 70.55% 2.40 79.83% 3.96 79.39% 3.85Louisiana 61.09% 1.57 61.24% 1.58 72.76% 2.67 72.87% 2.69Maine 63.27% 1.72 62.57% 1.67 74.29% 2.89 73.80% 2.82Maryland 50.00% 1.00 50.00% 1.00 65.00% 1.86 65.00% 1.86Massachusetts 50.00% 1.00 50.00% 1.00 65.00% 1.86 65.00% 1.86Michigan 66.14% 1.95 66.39% 1.98 76.30% 3.22 76.47% 3.25Minnesota 50.00% 1.00 50.00% 1.00 65.00% 1.86 65.00% 1.86Mississippi 74.18% 2.87 73.43% 2.76 81.93% 4.53 81.40% 4.38Missouri 63.45% 1.74 61.37% 1.59 74.42% 2.91 72.96% 2.70Montana 66.11% 1.95 66.00% 1.94 76.28% 3.22 76.20% 3.20Nebraska 56.64% 1.31 55.76% 1.26 69.65% 2.29 69.03% 2.23Nevada 56.20% 1.28 59.74% 1.48 69.34% 2.26 71.82% 2.55New Hampshire 50.00% 1.00 50.00% 1.00 65.00% 1.86 65.00% 1.86New Jersey 50.00% 1.00 50.00% 1.00 65.00% 1.86 65.00% 1.86New Mexico 69.36% 2.26 69.07% 2.23 78.55% 3.66 78.35% 3.62New York 50.00% 1.00 50.00% 1.00 65.00% 1.86 65.00% 1.86North Carolina 65.28% 1.88 65.51% 1.90 75.70% 3.12 75.86% 3.14North Dakota 55.40% 1.24 52.27% 1.10 68.78% 2.20 66.59% 1.99Ohio 64.15% 1.79 63.58% 1.75 74.91% 2.99 74.51% 2.92Oklahoma 63.88% 1.77 64.00% 1.78 74.72% 2.96 74.80% 2.97Oregon 62.91% 1.70 62.44% 1.66 74.04% 2.85 73.71% 2.80Pennsylvania 55.07% 1.23 54.28% 1.19 68.55% 2.18 68.00% 2.13Rhode Island 52.12% 1.09 51.26% 1.05 66.48% 1.98 65.88% 1.93South Carolina 70.24% 2.36 70.43% 2.38 79.17% 3.80 79.30% 3.83South Dakota 59.13% 1.45 56.19% 1.28 71.39% 2.50 69.33% 2.26Tennessee 66.36% 1.97 66.13% 1.95 76.45% 3.25 76.29% 3.22Texas 58.22% 1.39 59.30% 1.46 70.75% 2.42 71.51% 2.51Utah 70.99% 2.45 69.61% 2.29 79.69% 3.92 78.73% 3.70Vermont 57.58% 1.36 56.04% 1.27 70.31% 2.37 69.23% 2.25Virginia 50.00% 1.00 50.00% 1.00 65.00% 1.86 65.00% 1.86Washington 50.00% 1.00 50.00% 1.00 65.00% 1.86 65.00% 1.86West Virginia 72.62% 2.65 72.04% 2.58 80.83% 4.22 80.43% 4.11Wisconsin 60.53% 1.53 59.74% 1.48 72.37% 2.62 71.82% 2.55Wyoming 50.00% 1.00 50.00% 1.00 65.00% 1.86 65.00% 1.86Puerto Rico and US Territories 50.00% 1.00 55.00% 1.22 65.00% 1.86 68.50% 2.17
FY 2013CHIP
State
Table 1: Current FMAPs for Medicaid and CHIP
FY 2012 FY 2013Medicaid
FY 2012
700
APPENDIX
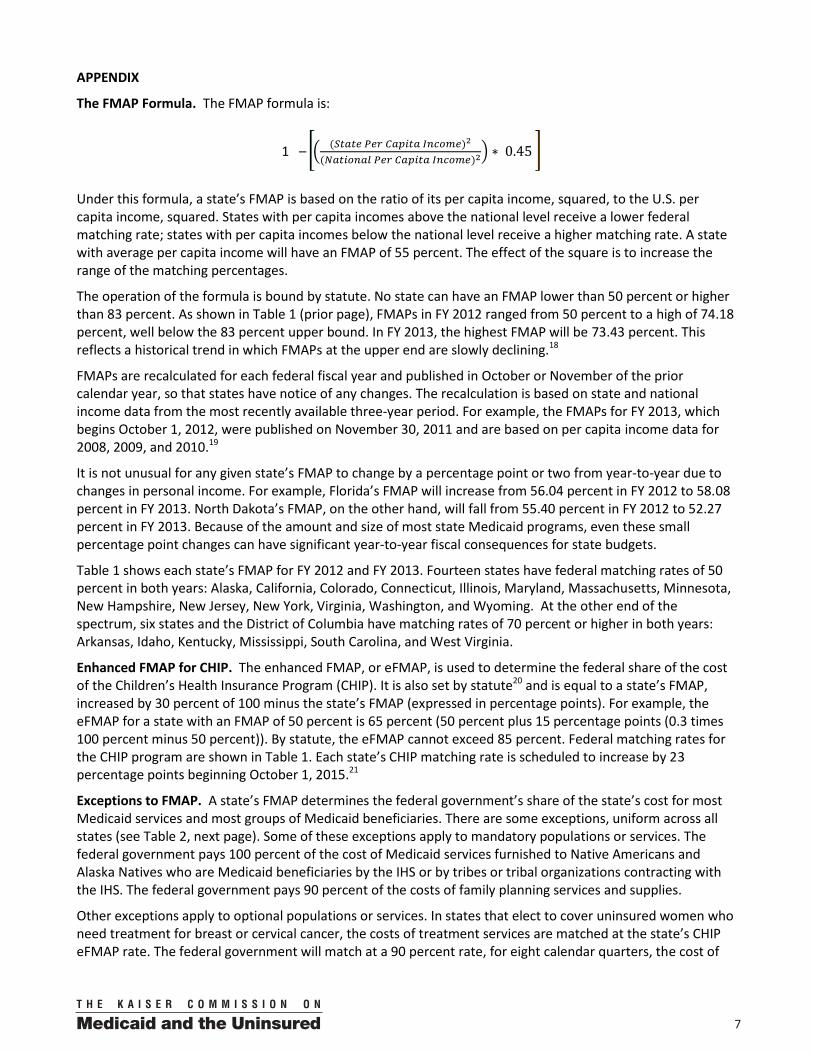
The FMAP Formula. The FMAP formula is:
1 – ( )
Under this formula, a state’s FMAP is based on the ratio of its per capita income, squared, to the U.S. per capita income, squared. States with per capita incomes above the national level receive a lower federal matching rate; states with per capita incomes below the national level receive a higher matching rate. A state with average per capita income will have an FMAP of 55 percent. The effect of the square is to increase the range of the matching percentages.
The operation of the formula is bound by statute. No state can have an FMAP lower than 50 percent or higher than 83 percent. As shown in Table 1 (prior page), FMAPs in FY 2012 ranged from 50 percent to a high of 74.18 percent, well below the 83 percent upper bound. In FY 2013, the highest FMAP will be 73.43 percent. This reflects a historical trend in which FMAPs at the upper end are slowly declining.18
FMAPs are recalculated for each federal fiscal year and published in October or November of the prior calendar year, so that states have notice of any changes. The recalculation is based on state and national income data from the most recently available three-year period. For example, the FMAPs for FY 2013, which begins October 1, 2012, were published on November 30, 2011 and are based on per capita income data for 2008, 2009, and 2010.19
It is not unusual for any given state’s FMAP to change by a percentage point or two from year-to-year due to changes in personal income. For example, Florida’s FMAP will increase from 56.04 percent in FY 2012 to 58.08 percent in FY 2013. North Dakota’s FMAP, on the other hand, will fall from 55.40 percent in FY 2012 to 52.27 percent in FY 2013. Because of the amount and size of most state Medicaid programs, even these small percentage point changes can have significant year-to-year fiscal consequences for state budgets.
Table 1 shows each state’s FMAP for FY 2012 and FY 2013. Fourteen states have federal matching rates of 50 percent in both years: Alaska, California, Colorado, Connecticut, Illinois, Maryland, Massachusetts, Minnesota, New Hampshire, New Jersey, New York, Virginia, Washington, and Wyoming. At the other end of the spectrum, six states and the District of Columbia have matching rates of 70 percent or higher in both years: Arkansas, Idaho, Kentucky, Mississippi, South Carolina, and West Virginia.
Enhanced FMAP for CHIP. The enhanced FMAP, or eFMAP, is used to determine the federal share of the cost of the Children’s Health Insurance Program (CHIP). It is also set by statute20 and is equal to a state’s FMAP, increased by 30 percent of 100 minus the state’s FMAP (expressed in percentage points). For example, the eFMAP for a state with an FMAP of 50 percent is 65 percent (50 percent plus 15 percentage points (0.3 times 100 percent minus 50 percent)). By statute, the eFMAP cannot exceed 85 percent. Federal matching rates for the CHIP program are shown in Table 1. Each state’s CHIP matching rate is scheduled to increase by 23 percentage points beginning October 1, 2015.21
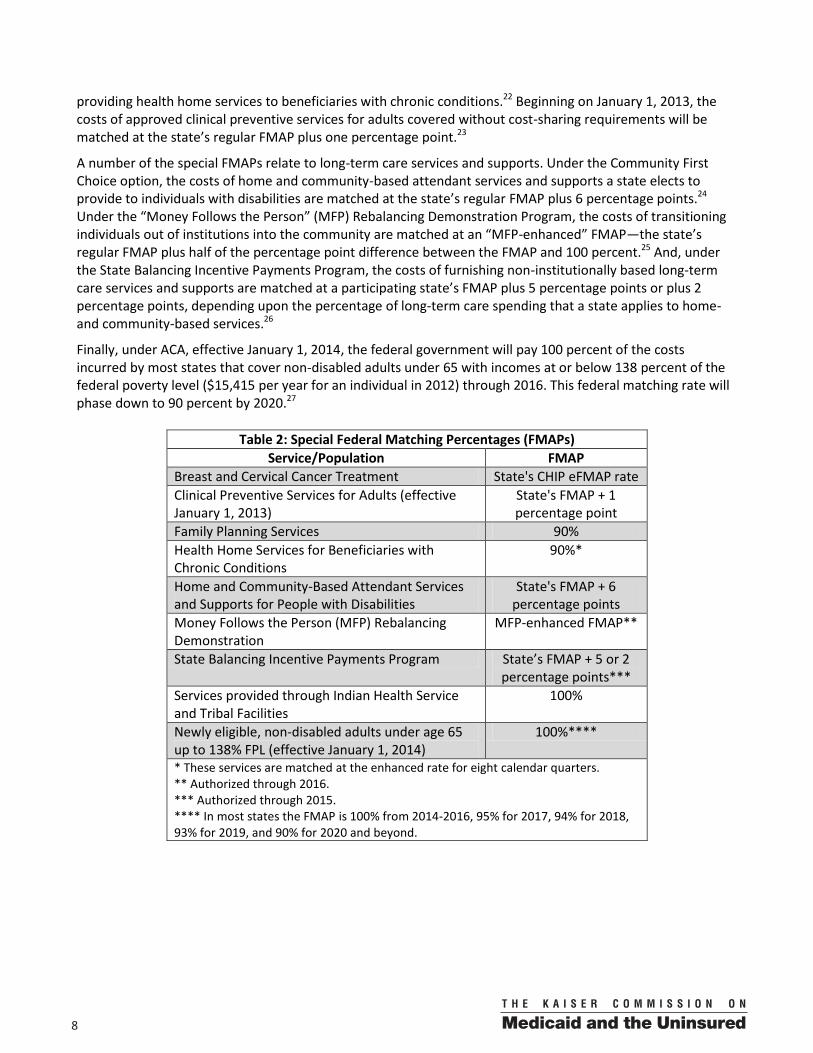
Exceptions to FMAP. A state’s FMAP determines the federal government’s share of the state’s cost for most Medicaid services and most groups of Medicaid beneficiaries. There are some exceptions, uniform across all states (see Table 2, next page). Some of these exceptions apply to mandatory populations or services. The federal government pays 100 percent of the cost of Medicaid services furnished to Native Americans and Alaska Natives who are Medicaid beneficiaries by the IHS or by tribes or tribal organizations contracting with the IHS. The federal government pays 90 percent of the costs of family planning services and supplies.
Other exceptions apply to optional populations or services. In states that elect to cover uninsured women who need treatment for breast or cervical cancer, the costs of treatment services are matched at the state’s CHIP eFMAP rate. The federal government will match at a 90 percent rate, for eight calendar quarters, the cost of
8 00
providing health home services to beneficiaries with chronic conditions.22 Beginning on January 1, 2013, the costs of approved clinical preventive services for adults covered without cost-sharing requirements will be matched at the state’s regular FMAP plus one percentage point.23
A number of the special FMAPs relate to long-term care services and supports. Under the Community First Choice option, the costs of home and community-based attendant services and supports a state elects to provide to individuals with disabilities are matched at the state’s regular FMAP plus 6 percentage points.24 Under the “Money Follows the Person” (MFP) Rebalancing Demonstration Program, the costs of transitioning individuals out of institutions into the community are matched at an “MFP-enhanced” FMAP—the state’s regular FMAP plus half of the percentage point difference between the FMAP and 100 percent.25 And, under the State Balancing Incentive Payments Program, the costs of furnishing non-institutionally based long-term care services and supports are matched at a participating state’s FMAP plus 5 percentage points or plus 2 percentage points, depending upon the percentage of long-term care spending that a state applies to home- and community-based services.26
Finally, under ACA, effective January 1, 2014, the federal government will pay 100 percent of the costs incurred by most states that cover non-disabled adults under 65 with incomes at or below 138 percent of the federal poverty level ($15,415 per year for an individual in 2012) through 2016. This federal matching rate will phase down to 90 percent by 2020.27
Table 2: Special Federal Matching Percentages (FMAPs) Service/Population FMAP
Breast and Cervical Cancer Treatment State's CHIP eFMAP rate Clinical Preventive Services for Adults (effective January 1, 2013)
State's FMAP + 1 percentage point
Family Planning Services 90% Health Home Services for Beneficiaries with Chronic Conditions
90%*
Home and Community-Based Attendant Services and Supports for People with Disabilities
State's FMAP + 6 percentage points
Money Follows the Person (MFP) Rebalancing Demonstration
MFP-enhanced FMAP**
State Balancing Incentive Payments Program State’s FMAP + 5 or 2 percentage points***
Services provided through Indian Health Service and Tribal Facilities
100%
Newly eligible, non-disabled adults under age 65 up to 138% FPL (effective January 1, 2014)
100%****
* These services are matched at the enhanced rate for eight calendar quarters. ** Authorized through 2016. *** Authorized through 2015. **** In most states the FMAP is 100% from 2014-2016, 95% for 2017, 94% for 2018, 93% for 2019, and 90% for 2020 and beyond.
900
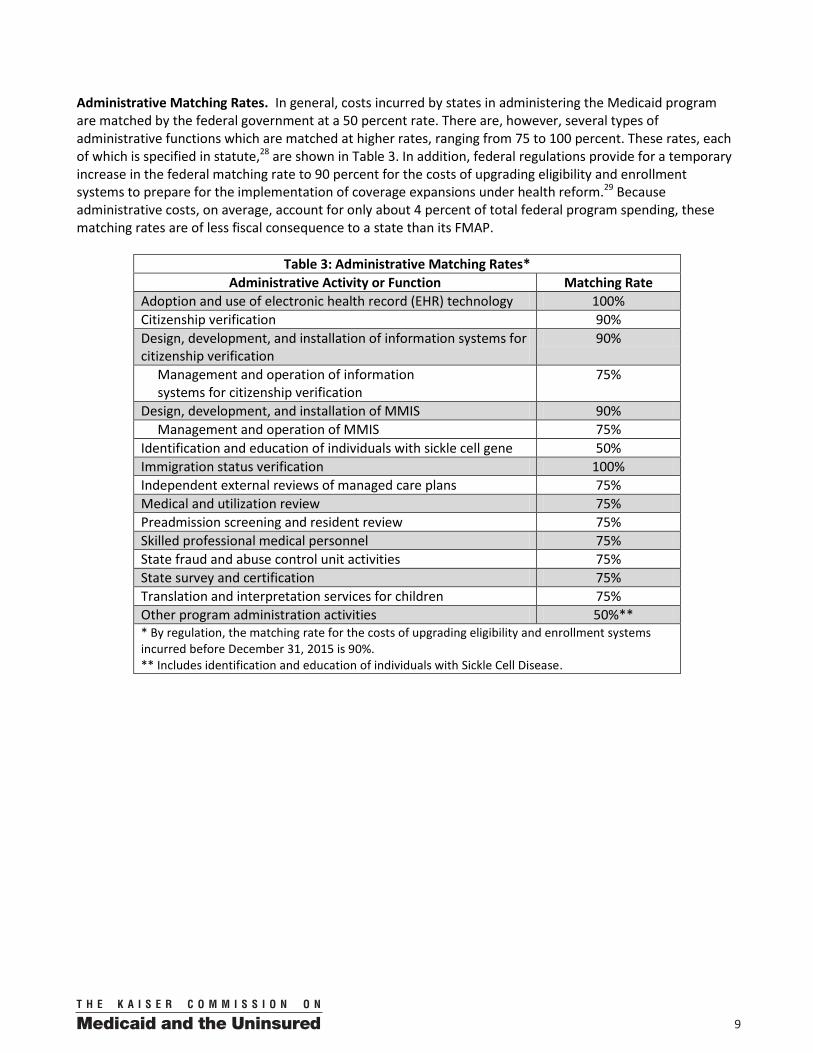
Administrative Matching Rates. In general, costs incurred by states in administering the Medicaid program are matched by the federal government at a 50 percent rate. There are, however, several types of administrative functions which are matched at higher rates, ranging from 75 to 100 percent. These rates, each of which is specified in statute,28 are shown in Table 3. In addition, federal regulations provide for a temporary increase in the federal matching rate to 90 percent for the costs of upgrading eligibility and enrollment systems to prepare for the implementation of coverage expansions under health reform.29 Because administrative costs, on average, account for only about 4 percent of total federal program spending, these matching rates are of less fiscal consequence to a state than its FMAP.
Table 3: Administrative Matching Rates* Administrative Activity or Function Matching Rate
Adoption and use of electronic health record (EHR) technology 100% Citizenship verification 90% Design, development, and installation of information systems for citizenship verification
90%
Management and operation of information systems for citizenship verification
75%
Design, development, and installation of MMIS 90% Management and operation of MMIS 75% Identification and education of individuals with sickle cell gene 50% Immigration status verification 100% Independent external reviews of managed care plans 75% Medical and utilization review 75% Preadmission screening and resident review 75% Skilled professional medical personnel 75% State fraud and abuse control unit activities 75% State survey and certification 75% Translation and interpretation services for children 75% Other program administration activities 50%** * By regulation, the matching rate for the costs of upgrading eligibility and enrollment systems incurred before December 31, 2015 is 90%. ** Includes identification and education of individuals with Sickle Cell Disease.
10 00
1 The income standard for the newly eligible low-income adult group is at or below 133% of FPL ($14,856 for an individual, $30,656 for a family of four in 2012). However, in calculating income, the Medicaid statute requires that states disregard an amount of income equal to 5 percent of the FPL, which takes into account family size. As a result, the effective income eligibility level is at or below 138% of FPL ($15,415 for an individual, $31,809 for a family of four in 2012). 2 Kaiser Commission on Medicaid and the Uninsured, How will the Medicaid Expansion for Adults Impact Eligibility and Coverage?, July 2012, available at http://www.kff.org/medicaid/8338.cfm. 3 Sections 1905(b) and 1101(a)(8)(B) of the Social Security Act. The formula does not determine the FMAPs for the District of Columbia, Puerto Rico, the Virgin Islands, Guam, American Samoa, and the Northern Mariana Islands; for these jurisdictions, the FMAPs are fixed in statute. The FMAP for the District of Columbia is set at 70 percent per section 4725(b) of the Balanced Budget Act of 1997, P.L. 105-33. The FMAPS for Puerto Rico and the territories are set at 55% per section 2005(c) of the Patient Protection and Affordable Care Act, P.L. 111-148. 4 Section 299E(a) of the Social Security Amendments of 1972. P.L. 92-603. 5 Section 402(e) of the Indian Health Care Improvement Act of 1976, P.L. 94-437. 6 The Government Accountability Office (GAO) has proposed revising the formula by substituting total taxable resources and people in poverty for per capita income as the factors driving the formula. Government Accountability Office, Medicaid: Matching Formula’s Performance and Potential Modifications (GAO/T-HEHS-95-226), July 27, 1995. Differences in Funding Ability Among States Often are Widened, (GAO-03-620), July 10, 2003. 7 Government Accountability Office, Medicaid: Improving Responsiveness of Federal Assistance to States During Economic Downturns (GAO 11-395), March 31, 2011; Medicaid: Prototype Formula would Provide Automatic, Targeted Assistance to States During Economic Downturns (GAO 12-38), November 2011. 8 V. Wachino, M. O’Malley, R. Rudowitz, Financing Health Coverage: the Fiscal Relief Experience, Kaiser Commission on Medicaid and the Uninsured, November 2005, available at http://www.kff.org/medicaid/7434.cfm. 9 Kaiser Commission on Medicaid and Uninsured, Impact of the Medicaid Fiscal Relief Provisions in the American Recovery and Reinvestment Act (ARRA), October 2011, available at http://www.kff.org/medicaid/8252.cfm. 10 Section 4725(a) of the Balanced Budget Act of 1997, P.L. 105-33, set the FMAP for Alaska at 59.8 percent for fiscal years 1998, 1999, and 2000. 11 Section 614 of the Children’s Health Insurance Program Reauthorization Act of 2009, P.L. 111-3, requires that, in calculating per capita income for a state, the Secretary disregard employer pension and insurance fund contributions made beginning in calendar year 2003 if they exceed 25 percent of the total increase in personal income in the state for the year. The purpose was to adjust for the impact of the one-time auto manufacturer pension distribution on Michigan’s FMAP beginning in FY 2006. 12 Section 2006 of the Patient Protection and Affordable Care Act, P.L. 111-148. This provision was subsequently modified to adjust for an unintentional overpayment by section 3204(b) of the Middle Class Tax Relief and Job Creation Act of 2012, P.L. 112-96, and by section 100123 of the Moving Ahead for Progress in the 21st Century Act (MAP-21), P.L. 112-141. 13 Section 2161(a) of the Omnibus Budget Reconciliation Act of 1981, P. L. 97-35, temporarily reduced federal Medicaid matching payments to states over a 3-year period but it did so without altering the FMAP formula. Instead, it reduced the amount of federal Medicaid matching funds a state would otherwise receive after applying its regular FMAP to its spending on services. The amount of the reduction was determined by a percentage: 3 percent in FY 1982, 4 percent in FY 1983, and 4.5 percent in FY 1984. This percentage was adjusted downward in the case of states with high unemployment, states that adopted specified policies to control hospital costs, states that had high fraud and abuse recoveries, and states that met low spending growth targets. 14 For states that were covering childless adults at their existing federal matching rates prior to March 23, 2010, the ACA phases in an increase in the federal matching rate so that by 2019, federal matching rates for this population will equal the rate for the newly eligible Medicaid expansion population at 93% in 2019 and 90% in 2020 and prospectively. Kaiser Commission on Medicaid and the Uninsured, Medicaid Coverage and Spending in Health Reform: National and State-by-State Results for Adults at or Below 133% FPL, May 2010, available at http://www.kff.org/healthereform/8076.cfm.
1100
15 The CBO revised its estimates for federal and state Medicaid spending in light of the Supreme Court decision in the National Federation of Independent Business (NFIB) case. The revised estimate projects federal Medicaid spending of $642 billion and state Medicaid spending of $41 billion over the 2014 through 2022 period. Table 4 available at http://www.cbo.gov/sites/default/files/cbofiles/attachments/43472-07-24-2012-CoverageEstimates.pdf. 16 76 Fed. Reg. 21949 (April 19, 2012). Enhanced funding at the 90% rate is available for costs of goods and services incurred by December 31, 2015 for design, development and implementation (DDI) that comply with certain defined standards and conditions. Enhanced funding at the 75% rate is available for maintenance and operations (M&O) of systems that were built using enhanced funding during the DDI phase. Available at https://www.federalregister.gov/articles/2011/04/19/2011-9340/medicaid-program-federal-funding-for-medicaid-eligibility-determination-and-enrollment-activities. 17 At least nominally. The effective federal matching rate is also a function of the nature of the state share. D. Rousseau and A. Schneider, Current Issues in Medicaid Financing—An Overview of IGTs, UPLs, and DSH, Kaiser Commission on Medicaid and the Uninsured, April 2004, available at http://www.kff.org/medicaid/7071.cfm. 18 Kaiser Commission on Medicaid and the Uninsured, An Overview of Changes in the Federal Medical Assistance Percentages (FMAPs) for Medicaid, July 2011, available at http://www.kff.org/medicaid/8210.cfm. 19 76 Fed. Reg. 74061 (November 30, 2011), available at http://www.gpo.gov/fdsys/pkg/FR-2011-11-30/pdf/2011-30860.pdf. 20 Section 2105(b) of the Social Security Act. 21 Section 2101(a) of the Patient Protection and Affordable Care Act, P.L. 111-148. This enhanced eFMAP cannot exceed 100 percent and expires on September 30, 2019. Federal allotments for CHIP are fully authorized through FY 2015 only, section 10203 of P.L. 111-148. 22 Section 1945(c)(1) of the Social Security Act, as added by section 2703 of the Patient Protection and Affordable Care Act, P.L. 111-148. 23 Section 1905(b)(5) of the Social Security Act, as added by section 4106 of the Patient Protection and Affordable Care Act, P.L. 111-148. 24 Section 1915(k)(2) of the Social Security Act, as added by Section 2401 of the Patient Protection and Affordable Care Act, P.L. 111-148. 25 The MFP Rebalancing Demonstration program was authorized through 2011 by section 6071 of the Deficit Reduction Act of 2005, P.L. 109-171, and reauthorized through 2016 by section 2403 of the Patient Protection and Accountable Care Act, P.L. 111-148. The “MFP-enhanced” FMAP cannot exceed 90 percent. The total amount of federal matching funds for this demonstration is capped at $450 million per year. 26 The State Balancing Incentive Payments Program is authorized through 2015 by section 10202 of the Patient Protection and Affordable Care Act, P.L. 111-148. The enhanced FMAP is applied to the cost of non-institutional long-term care services and supports, not across-the-board, in states that elect to participate. States in which less than 25 percent of Medicaid long-term care spending was used to pay for home and community-based services (HCBS) in 2009 qualify for a 5 percentage point increase in their FMAP. States in which less than 50 percent of Medicaid long-term care spending was used to pay for HCBS services receive a 2 percentage point increase. Total federal matching funds available through 2015 are capped at $3 billion. 27 Kaiser Family Foundation, A Guide to the Supreme Court’s Affordable Care Act Decision, July 2012, available at http://www.kff.org/healthreform/8332.cfm. For states that were covering childless adults prior to March 23, 2010, the ACA phases in an increase in the federal matching rate so that by 2019, federal matching rates for this population will equal the rate for the newly eligible Medicaid expansion population at 93% in 2019 and 90% in 2020 and beyond. Kaiser Commission on Medicaid and the Uninsured, Medicaid Coverage and Spending in Health Reform: National and State-by-State Results for Adults at or Below 133% FPL, May 2010, available at http://www.kff.org/healthereform/8076.cfm. 28 Section 1903(a)(2) –(7) of the Social Security Act. 29 See footnote 16.
1 3 3 0 G S T R E E T N W , W A S H I N G T O N , D C 2 0 0 0 5
P H O N E : ( 2 0 2 ) 3 4 7 - 5 2 7 0 , F A X : ( 2 0 2 ) 3 4 7 - 5 2 7 4
W E B S I T E : W W W . K F F . O R G / K C M U
A d d i t i o n a l c o p i e s o f t h i s r e p o r t ( # 0000 ) a r e a v a i l a b l e o n t h e K a i s e r F a m i l y F o u n d a t i o n ’ s w e b s i t e a t w w w . k f f . o r g .
The Kaiser Commission on Medicaid a nd the Uninsured provides information a nd a nalys is on health care coverage
a nd access for the low-income populat ion, with a specia l focus on Medicaid's role a nd coverage of the uninsured.
Begun in 1991 a nd based in the Kaiser Family Foundation's Washington, DC off ice , the Commission is the largest
operat ing program of the Foundation . The Commission’s work is conducted by Foundation sta f f under the guida nce
of a bi-part isa n group of nat ional leaders a nd experts in health care a nd publ ic pol icy .
This report (#8352) is available on the Kaiser Family Foundation’s website at www.kff.org.