medicaid provider rate review advisory committee meeting · principles, wrap-up, and next steps...
TRANSCRIPT

Medicaid Provider Rate Review Advisory
Committee Meeting
June 17, 20169am to 4pm
1

AgendaAgenda & Meeting Minutes Review 9:00 – 9:15 AM
Laboratory Services 9:15 – 10:15 AM
Home Health Services 10:15 – 11:15 AM
Private Duty Nursing Services 11:15 AM – 12:15 PM
Lunch 12:15 – 1:15 PM
Non-Emergent & Emergency Medical
Transportation 1:15 – 2:15 PM
Physician-Administered Drugs 2:15 – 3:15 PM
Principles, Wrap-up, and Next Steps 3:15 – 4:00 PM

Agenda & Meeting Minutes Review
3

Laboratory ServicesThe following eight slides were developed by the Laboratory Services/Physician-
Administered Drugs Workgroup.
4

MPRRAC Workgroup Recommendations for Laboratory
Services
Workgroup members: Jeff Perkins, Arthur Schut, Murray Willis
Presented at MPRRAC meeting: June 17, 2016

Data Observations
Much of the data in the RRAR (2016 Rate Review Analysis Report), while no doubt accurate, does not significantly advance the cause of analyzing current rates, nor of devising improved rate structure. There are some interesting facts:
Services are provided by several different types of providers: Large national labs 22%, independent labs 31%, hospital labs 39%, physician offices 8% (RRAR, pg. 22, fig. 14)
6

Data Deficiencies
The workgroup would have appreciated more specific detail related to the 2012 OIG (Office of the Inspector General) report (RRAR, p. 28).
The workgroup feels that more direct access to the rate comparison data provided by the consulting firm Optumas would be helpful.
Data comparing Colorado rates to those in other states was limited (only Texas, West Virginia, Alabama, Kentucky, Washington and Mississippi), and the states seemed to be chosen more from expediency than any other more rigorous selection process (e.g., geographic or demographic similarity to Colorado, or attempt to develop a representative cross-section of states).
7

Impression of overall rate adequacy
• The workgroup agrees with the Department that current reimbursement adequately supports access to laboratory services.
• Based on the 2014 OIG report, it appears that both Medicare and Colorado Medicaid may be paying significantly more than most commercial insurances for laboratory services. Given the presumption that commercially-insured patients typically have adequate access to medical services, Colorado Medicaid is likely reimbursing more than necessary for laboratory services.

Note regarding OIG report and implementation
• The OIG report referenced in RRAR was produced in response to a previously-passed federal law.
• The law also requires that Medicare rates for laboratory services be based on this report, beginning January 1, 2017.
• Final 2017 CMS rates will be available on the CMS Web site by November 1, 2016.
• Thus, a Medicare fee schedule based on this data would potentially be available to use as a template for the 2017-2018 Colorado Medicaid budget.

Potential system-wide effects of reimbursement in this area
• The potential over-reimbursement of laboratory services by Colorado Medicaid, as compared to commercial insurance (RRAR, pp. 28-29), is likely costing the taxpayers of Colorado a significant amount of money without supporting either improved access or increased quality in this area.
• Lowering of laboratory reimbursement to be more in line with commercial insurance reimbursement is unlikely to negatively impact either access or quality in this area.

Applicable Principles
• DON’T REINVENT THE WHEEL. If an established structure for determining rates in a particular area exists, use it at the basis for improving the rate structure for Colorado Medicaid.
Corollary: As applied to laboratory services, Colorado Medicaid rates should be informed by the results of federally funded research in the 2012 OIG report, which will be used beginning in 2017 to set Medicare rates.
High-level Recommendations
• If final 2017 Medicare rates are available in time for the 2017-2018 budget cycle, and assuming that the 2017 Medicare rates are indeed based on the OIG report, Colorado Medicaid rates should be set at 95% of 2017 Medicare rates.
• If final 2017 Medicare rates are not available in a timely fashion, or if Medicare does not reimburse for particular laboratory services, rates should be set based on the median of rates set in other states whose rates are publically available to the Department (per RRAR, p. 28, this includes Texas, West Virginia, Alabama, Kentucky, Washington and Mississippi). If this alternative is used, attempts should be made to expand the range of states used in this analysis.

Home Health ServicesThe following seven slides were developed by the Home Health Services Workgroup.
13

MPRRAC Workgroup Recommendations for Home
Health Services
Workgroup members: Tia Sauceda, Barb Crowder, David Smart, Dixie Melton, Susan Flynn
Presented at MPRRAC meeting: June 17, 2016

Data Observations
• The observations made appear to be based primarily on access and not on market costs. What is the cost of doing business and how does that differ in urban vs. rural areas, for example travel costs in rural areas.
• The financial comparison with other states is not useful due to the lack of clear comparables, ie: the information regarding how the states listed actually bill (e.g. per 15 min vs per session. )
• There is little to no emphasis on quality of care, strictly access. (Does an agency have to continually recruit in order to provide care and therefore have novice employees ongoing?)
• The access issues in areas 11/12 are difficult to evaluate due to minimal information provided.
Impression of overall rate adequacy
• The observations suggest adequate access however they do not reflect quality or the ability for Agencies to retain quality employees.
• Areas 11 and 12 may have less access, however the data is not clear and this may be due to minimal need in those areas.
• Since we have not seen actual rates and/or market rates, it is difficult to determine adequacy.

Potential system-wide effects of reimbursement in this area
• Inadequate reimbursement of Home Health services would result in difficulty retaining trained and knowledgeable employees who must function independently in this service area.
• Quality of provider could affect outcome of services offered. Negative outcomes could result in increased hospitalization.
• If Home Health Services were performed inadequately or were not available, the cost to Medicaid could increase significantly as the alternatives would be the hospital or a SNF.

Applicable Principles
• When setting rates for services that are paid by Medicare, Colorado Medicaid rates should be set proportional to the current Medicare rate or the private insurance market rate where applicable.
• Quality of Care should inform rate setting.

High-level Recommendations
• Rates for Home Health Services may be best paid in 15 minute increments rather than lump sum for up to 2.5 hrs of service.
• Reimbursement of travel time is a necessity, particularly in more rural areas.
• A geographically-based adjustment may be necessary for areas with minimal access to Home Health Services

Private Duty Nursing Services
The following six slides were developed by the Private Duty Nursing Services Workgroup.
20

MPRRAC Workgroup Recommendations for Private
Duty Nursing
Workgroup members: Felicia Foster, Bruce Densley, Tom Rose and Jody Wright
Presented at MPRRAC meeting: June 17, 2016

Data Observations
• PDN received a rate increase in 2015.
• We are requesting further information on chart “Percent of Authorized Services Utilized”.
• Colorado was compared to NC, NE, OH, LA, IL, and ID. We would like a comparison to states that have similar economies that are stable and growing like Colorado. For example WA, OR and MN.
• Majority of the patients seen were between the ages of 0 - 9.

Impression of overall rate adequacy
• RN rate was increase by 10.2% in 2015.
• The LPN rate is too low. It is difficult for agencies to recruit, retain, and meet the increasing demand for PDN.
• There are no other comparable payers that reimburse for PDN. This includes Medicare, Aetna, Anthem, Cigna, Kaiser, UHC, etc.

Potential system-wide effects of reimbursement in this area
• The demand for RNs in local hospitals make it difficult to recruit RNs. Hospitals wages are higher than what agencies are currently being reimbursed.
• Regulatory requirements increase staffing cost.
• As the Medicaid population increases it’s becoming difficult to keep up with the demand for PDN.

Applicable Principles
• Agencies want PDN patients out of the hospital and back into their homes which is the most preferred place for the patient. And least costly.
• Hospitals have financial consequences for readmissions. PDN is an important service in preventing readmissions and is again the least costly alternative.

High-level Recommendations
• Increase the LPN rate to $35 - $37.50 per hour.
• Have a modest yearly increase for both RNs and LPNs. This will allow Agencies to retain and recruit the needed staff.
• By increasing the LPN rate this will allow Agencies to retain and recruit LPNs. By utilizing more LPNs, this will save the State money by reimbursing for more LPNs than RNs.
• Establish a rural and frontier rate for RNs and LPNs to address the challenges of staffing PDN services in the remote areas.
• The goal of this committee is to improve access to PDN services without increasing the cost to the Department. We recommend utilizing more LPNs and having RNs do more case management.

Non-Emergent & Emergency Medical
TransportationThe following ten slides were developed by the NEMT & EMT Workgroup.
27

MPRRAC Workgroup Recommendations for Non-
Emergent Medical Transportation and Emergency Medical
Transportation
Workgroup members: Rob DeHerrera, Tim Dienst, Deborah Hart, Gretchen McGinnis, Jennifer Dunn
Presented at MPRRAC meeting: June 17, 2016

Data Observations: NEMT
• NEMT is 0.23% (less than a quarter of one percent) of expenditures in FY 2014-15, used primarily by adults with disability and dominant chronic conditions;
• Number of NEMT providers increased 17.44%; and,
• Utilization data not available through claims data; however, survey responses (Colorado Health Access Survey) may indicate access issue in region 11 (northeast corner of the state) due to less than 30 clients utilizing this service in a month.

Data Observations: EMT
• EMT is 0.26% (just over a quarter of one percent) of expenditures in FY 2014-15, used primarily by expansion adults with moderate and dominant chronic conditions;
• Number of EMT providers increased 19.91%;
• Utilization based on member to provider ratios and penetration rates were analyzed and shows potential access concern in western slope areas;
• The relationship between NEMT/EMT services may indicate that a higher utilization of more appropriate NEMT services may reduce EMT usage; and
• Aeromedical EMT service data (rotor and fixed wing) appears to comingle with ground EMT service data.

Impression of overall rate adequacy
• NEMT services are paid at approximately 28.19% of the benchmark;
• EMT services are reimbursed at 30.74% of Medicare rates;
• Colorado EMT rate comparisons should also be performed comparing Colorado rates to those rates paid by surrounding states;
• Other currently non-billable and non-reimbursed services and rates should be included in state based comparison studies for potential implementation in Colorado; and
• EMT data and rates should be presented and analyzed separately based on aero and ground service types to avoid confusion and skewing of the data.

Potential system-wide effects of reimbursement in this area
• Because reimbursement rates are significantly below benchmarks, service providers, especially in rural area, are at risk of closing or downsizing and reducing services. Closures and downsizing could create both access and quality issues;
• As demands on providers increase due to growing populations trends and by Medicaid expansion individuals coupled with reimbursement rates below benchmarks will most likely lead to increased response delay and create access and quality concerns;
• Chronic staffing shortages, inability to fund and provide on-going training and education programs, and inability to fund and properly plan for capital improvements.
Applicable Principles
• Colorado Medicaid rates should be paid at least at a level consistent with Medicaid rates paid by surrounding states.
• Consider alternate payment models for alternate care services.
• Research the feasibility of Ground Medical Transport (GMT) and Federal Reimbursement Allowances (FRA) programs similar to that of the Hospital Provider Fee to increase federal matching funds.
High-level Recommendations: Short Term
• Increase current reimbursement rates to levels consistent with the rates paid by surrounding states;
• Consider reimbursing for other applicable services provided by EMT services such as A0998 Ambulance Response and Treatment, No Transport, A0420 Ambulance Waiting Time and increasing amounts paid for A0422 Life Sustaining Supplies; and,
• Separate, analyze and price NEMT, EMT and Aero Medical services separately.

High-level Recommendations: Short/Medium Term
• Consider exploring, developing and implementing a more consistent approach/system for determining ambulance related transport costs. The new system would be used to assist in future analysis of EMT cost data and in determining and applying potential future rate increases.

High-level Recommendations: Medium Term
• Increase EMT reimbursement levels to comparable Medicare rates; and
• Continue to enhance data capabilities to match data across service levels to better monitor and improve access and quality services.
• Explore the potential of geographic payment add-on rates for rural areas.
• There should also be some additional consideration given to a review of the potential for “geographic modifiers”

High-level Recommendations: Long Term
• Research and potentially implement alternative payment models such as the GMT or FRA reimbursement strategies to maximize Federal match and increase payments to EMT providers.

Physician-Administered Drugs
The following 15 slides were developed by the Laboratory Services/Physician-Administered Drugs Workgroup.
38

MPRRAC Workgroup Recommendations for Physician-
Administered Drugs
Workgroup members: Jeff Perkins, Arthur Schut, Murray Willis
Presented at MPRRAC meeting: June 17, 2016
Data Observations
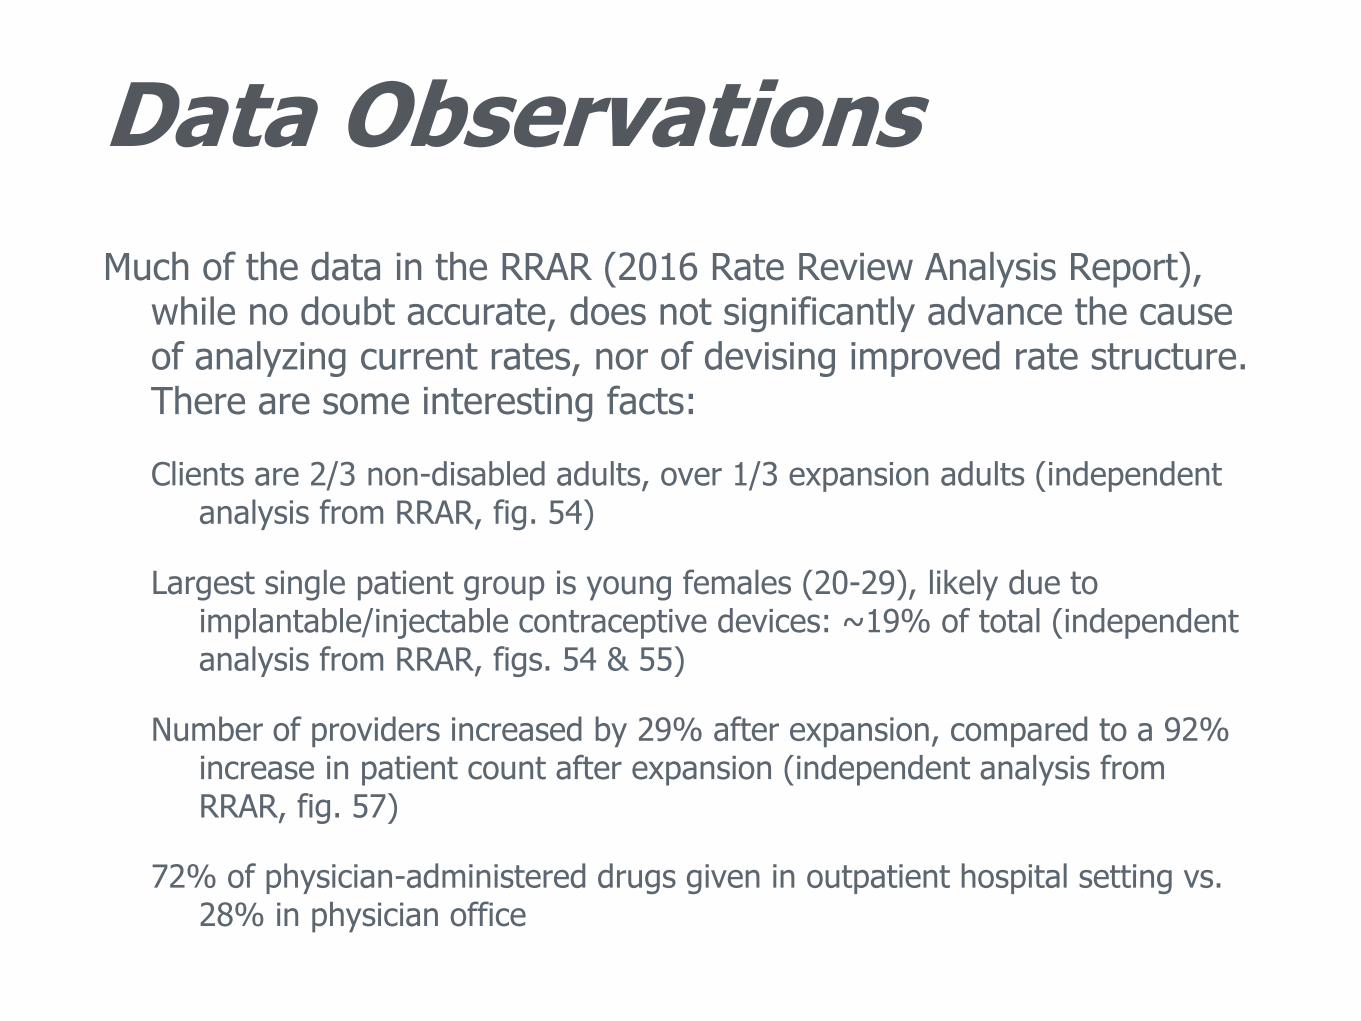
Much of the data in the RRAR (2016 Rate Review Analysis Report), while no doubt accurate, does not significantly advance the cause of analyzing current rates, nor of devising improved rate structure. There are some interesting facts:
Clients are 2/3 non-disabled adults, over 1/3 expansion adults (independent analysis from RRAR, fig. 54)
Largest single patient group is young females (20-29), likely due to implantable/injectable contraceptive devices: ~19% of total (independent analysis from RRAR, figs. 54 & 55)
Number of providers increased by 29% after expansion, compared to a 92% increase in patient count after expansion (independent analysis from RRAR, fig. 57)
72% of physician-administered drugs given in outpatient hospital setting vs. 28% in physician office
40
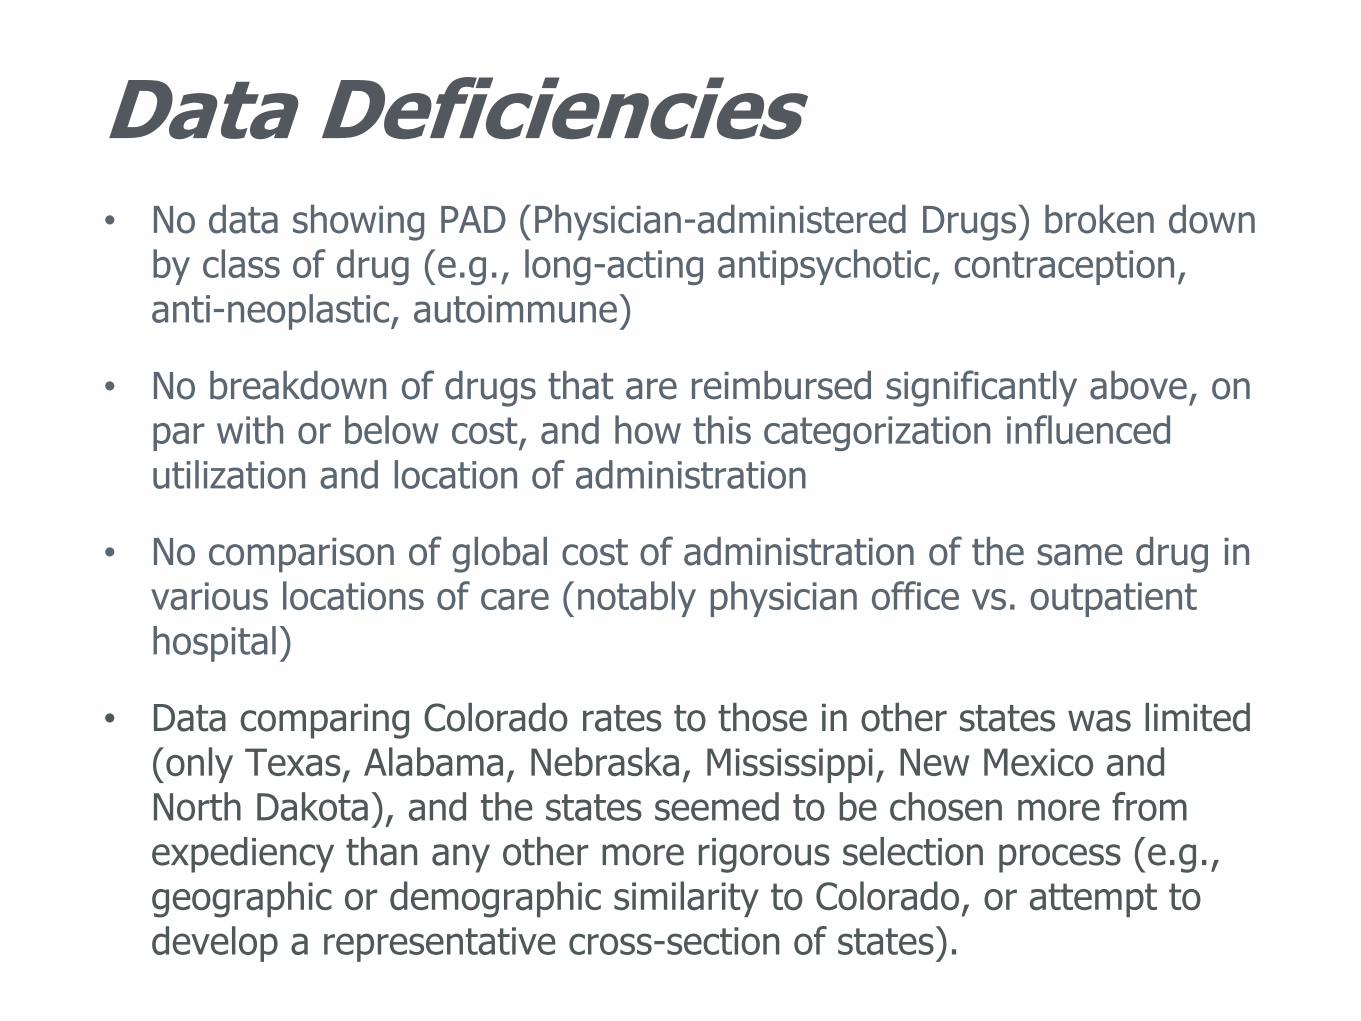
Data Deficiencies• No data showing PAD (Physician-administered Drugs) broken down
by class of drug (e.g., long-acting antipsychotic, contraception, anti-neoplastic, autoimmune)
• No breakdown of drugs that are reimbursed significantly above, on par with or below cost, and how this categorization influenced utilization and location of administration
• No comparison of global cost of administration of the same drug in various locations of care (notably physician office vs. outpatient hospital)
• Data comparing Colorado rates to those in other states was limited (only Texas, Alabama, Nebraska, Mississippi, New Mexico and North Dakota), and the states seemed to be chosen more from expediency than any other more rigorous selection process (e.g., geographic or demographic similarity to Colorado, or attempt to develop a representative cross-section of states).

Data Deficiencies
Class/Drug (% of overall PAD) MA reimbursement as % of
ASP
Change in ASP Q2
2015 vs. Q2 2016
Contraceptive/Gynecology (26.0%)
Levonorgestrel NA NA
Etonogestrel implant system NA NA
Contraceptive pills NA NA
Medroxyprogesterone injection 128% +20%
Intrauterine contraceptive NA NA
Anti-cancer (13.4%)
Bevacizumab 100.4% +3.6%
Trastuzumab 97.7% +5.2%
Rituximab (also autoimmune – assume 80%) 97.5% +5.2%
Oxaliplatin 2779.9% -29.4%
Neurologic (migraine, etc.) (5.1%)
Onabotulinumtoxin A 108.7% +2.6%
Analysis of top 14 PAD, representing 62% of PAD(independent analysis of RRAR, last page of Appendix 10, supplemented by publically-available rate for reimbursement
for Medicare [MC] and Colorado Medicaid [MA]*)

Data Deficiencies
Class/Drug (% of overall PAD) MA reimbursement as % of
ASP
Change in ASP Q2
2015 vs. Q2 2016
Injectable antipsychotic (9.8%)
Paliperidone palmitate 92.7% +6.8%
Risperidone, long acting 85.7% +12.2%
Autoimmune (3.7%)
Rituximab (also anti-cancer – assume 20%) 97.5% +5.2%
Infliximab 78.3% +6.7%
Hematology, not cancer (3.5%)
Eculizumab 94.9% +1.9%

Data Deficiencies
The workgroup feels that more direct access to the rate comparison data provided by the consulting firm Optumas would be helpful.
Along these lines, it would be very helpful to separate out the drugs with ASP data (76% of total, per p. 90 of RRAR) vs. the drugs without ASP data (presumably made up of the 4 contraceptive drugs), and how each of these two categories compare to current Medicare rates and to other states reimbursement rates, respectively.
44

Analysis DeficienciesThe conclusion that “Payments were likely sufficient to allow
for provider retention and client access… [to] most physician-administered drugs…” (RRAR, p. 7, see also p. 93) is based on a common logical fallacy, sometimes termed “fallacy of averages.”
Fallacy of averages example: “The average body temperature of the 20 babies in the newborn nursery is 98.6º. Therefore, the babies in the newborn nursery are healthy.”
Actual data: 10 babies with temperature of 98.6º, 5 babies with temperature 88.6º, 5 babies with temperature 108.6º
Correct conclusion: half of babies are healthy and half of babies are extremely ill.
45

Analysis Deficiencies
As mentioned in the Report, “a great deal of variation exists relative to the benchmark on a drug by drug basis.” (RRAR, p. 92)
The “average” reimbursement of 106.5% compared to Medicare rates is made up of at least two groups of drugs: Drugs that are significantly overpriced relative to cost and drugs that are significantly underpriced relative to cost
These two classes of drugs are, in general, administered by different providers
Thus, the overpayment on one drug in no way balances out underpayment of another drug
46

Analysis DeficienciesLast paragraph of Rate Comparison section (RRAR, p. 92, last ¶):
References a CMS (Center for Medicare and Medicaid Services) PROPOSED rule change, published March 8 by CMS and open for public comment until May 9, 2016 (8 days after RRAR was released). Final rule not due out until early July 2016.
Proposed change would TEST an alternative payment in certain ZIP codes (specific ZIP codes not specified) reduce rates for PAD to ASP (Average Sales Price) + 2.5% + $16.80. The proposed rule DOES NOT propose roll-out of new rates in fall 2016, as implied by RRAR.
47
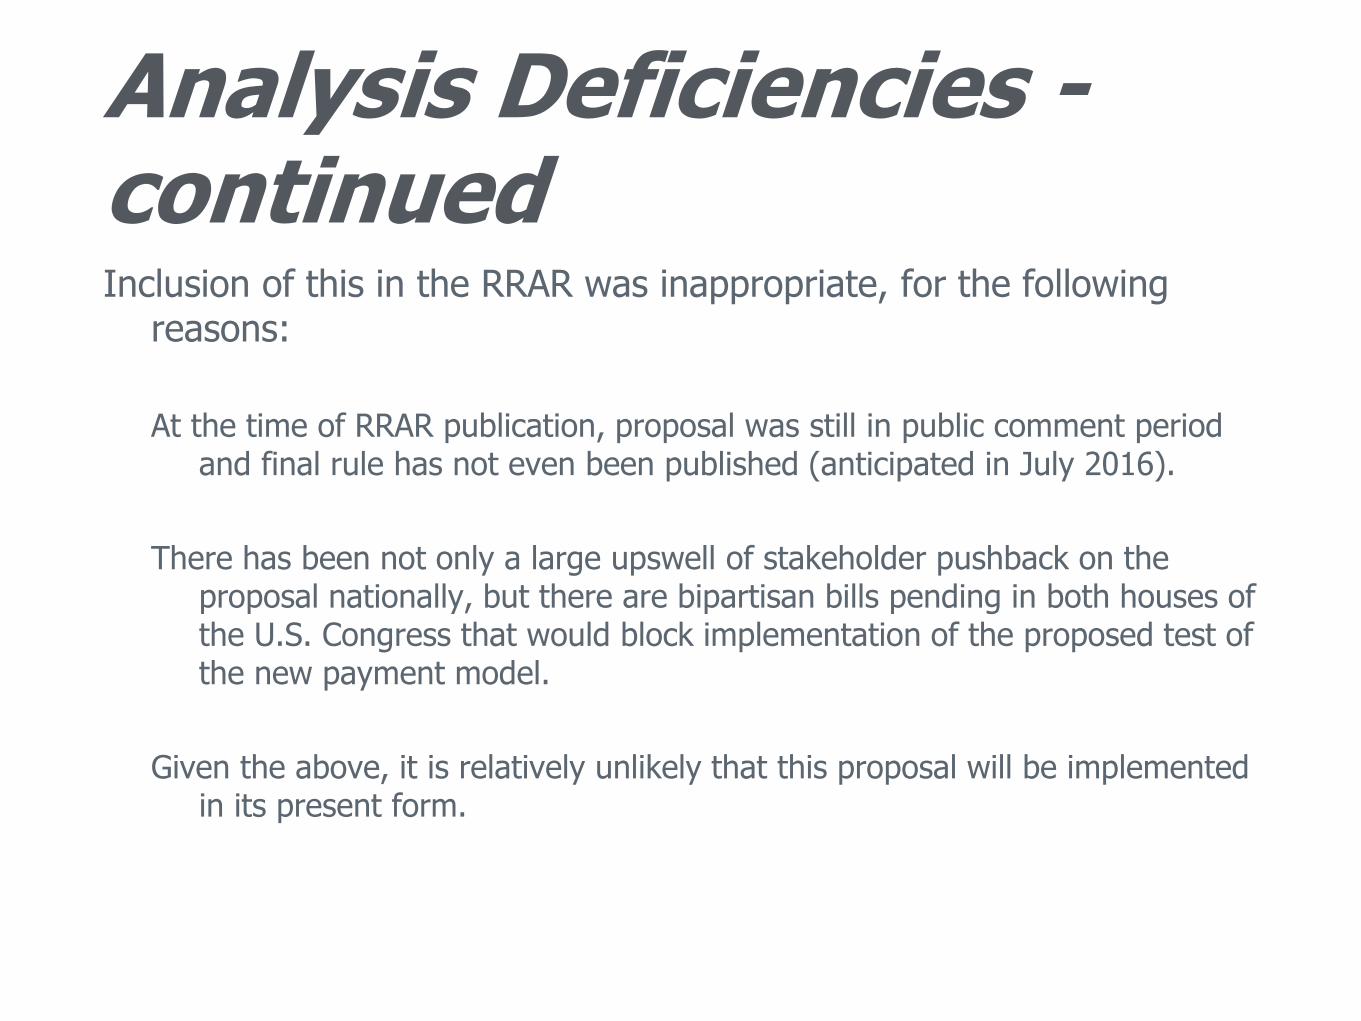
Analysis Deficiencies -continuedInclusion of this in the RRAR was inappropriate, for the following
reasons:
At the time of RRAR publication, proposal was still in public comment period and final rule has not even been published (anticipated in July 2016).
There has been not only a large upswell of stakeholder pushback on the proposal nationally, but there are bipartisan bills pending in both houses of the U.S. Congress that would block implementation of the proposed test of the new payment model.
Given the above, it is relatively unlikely that this proposal will be implemented in its present form.
48
Impression of overall rate adequacy
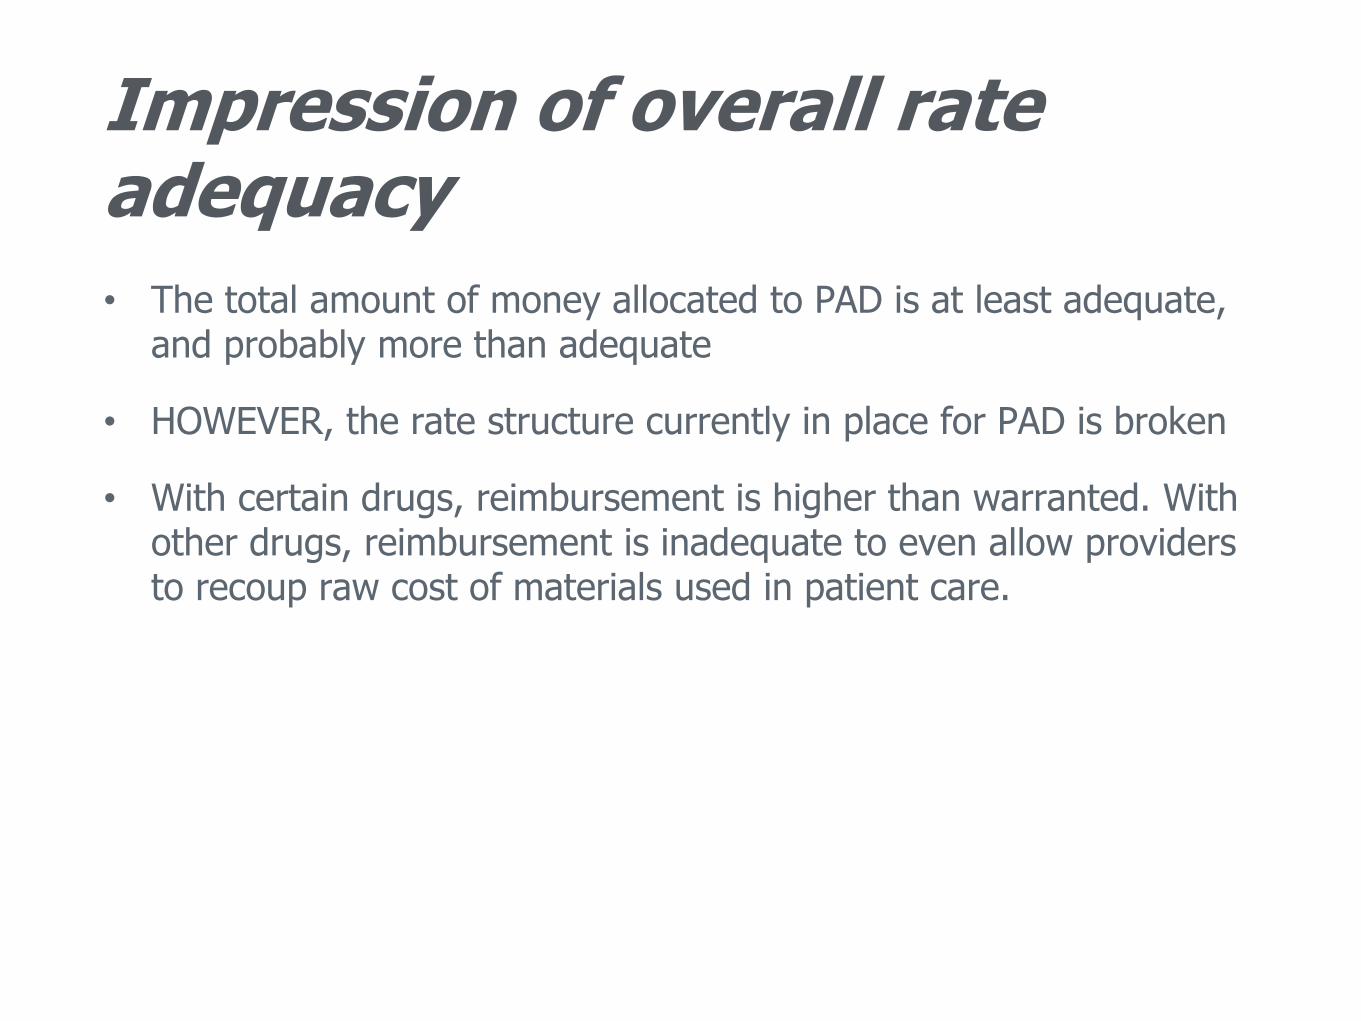
• The total amount of money allocated to PAD is at least adequate, and probably more than adequate
• HOWEVER, the rate structure currently in place for PAD is broken
• With certain drugs, reimbursement is higher than warranted. With other drugs, reimbursement is inadequate to even allow providers to recoup raw cost of materials used in patient care.

Potential system-wide effects of reimbursement in this area
For over-reimbursed drugs, the current rate structure has multiple potential negative effects on the system.
Waste of taxpayer money
May provide financial incentives to provide care that is not the most appropriate for the patient or efficient for the system
For under-reimbursed drugs, the current rate structure has multiple potential negative effects on the system.
Risks negative effects on access and quality of care
Provides incentives to shift services to a location of care that may not serve the patient’s best interest, and may increase the global cost of care
50

Applicable Principles
• DON’T REINVENT THE WHEEL. If an established structure for determining rates in a particular area exists, use it at the basis for improving the rate structure for Colorado Medicaid.
Corollary: When setting rates for services that are paid by Medicare, Colorado Medicaid rates should be set proportional to the current Medicare rate.
• REIMBURSE PROVIDERS FOR SUPPLIES. Rates should at a minimum cover the cost of medical supplies, including a reasonable margin to cover overhead costs.
Corollary: When setting rates for medical supplies whose wholesale cost changes on a frequent basis and is accurately tracked at the national level, rates should be pegged to current wholesale cost data plus a reasonable profit margin, rather than set in absolute dollars.

High-level Recommendations
• When an ASP for PAD is available from CMS, reimbursement for physician-administered drugs should be at ASP + 6%, as is currently used by Medicare, as well as by virtually all commercial insurers.
• For PAD not covered by Medicare, the Department should make every reasonable effort to obtain ASP from CMS or other credible source. Absent that data, prices should be adjusted at least annually based on any available data, including reimbursement rates from other states, or as a last resort, pricing data from the manufacturer.

High-level Recommendations
• Given the need to use comparative data from other states for at least some PAD, it is very important to expand the number of comparator states as much as possible, so as to maximize the chances of developing fare and appropriate reimbursement for these drugs.
• Going forward, it would be extremely helpful to have baseline data on a drug and/or therapeutic category basis for overall utilization, as well as the location of care (e.g., physician office vs. outpatient hospital), so that the response of the system to rate changes can be objectively assessed.

Principles, Wrap-Up, and Next Steps
54

Comments or Questions
• Contact Lila Cummings with additional questions between meetings: [email protected].

Thank You