medical assurance society kiwisaver plan - home - mas · it should be read together with the...
TRANSCRIPT

1
Medical Assurance Society KiwiSaver Plan FUND UPDATE BOOKLET
For the year ended 31 March 2017
Medical Assurance Society New Zealand Limited (MAS) is the issuer of the Medical Assurance Society KiwiSaver Plan. This document gives you important
information about this investment to help you decide whether you want to invest. It should be read together with the Medical Assurance Society
KiwiSaver Product Disclosure Statement (PDS). You can obtain a copy of the PDS from mas.co.nz/savings-and-investment/kiwisaver. There is other useful
information on business.govt.nz/disclose.

2
TABLE OF CONTENTS
Page
Cash Portfolio 3
Defensive Portfolio 6
Conservative Portfolio 9
Balanced Portfolio 12
Growth Portfolio 15
Aggressive Portfolio 18
Global Equities Portfolio 21
Medical Assurance Society KiwiSaver Plan - Fund Update year ending 31 March 2017

3
Medical Assurance Society
KiwiSaver Plan
CASH PORTFOLIO
Fund Update for the year ending 31 March 2017
This fund update was first made publicly available on
27 June 2017.
What is the purpose of this update? This document tells you how the Medical Assurance Society KiwiSaver Plan Cash Portfolio has performed and what fees were charged. The document will help you to compare the fund with other funds. The trustees of the Medical Assurance Society KiwiSaver
Plan prepared this update in accordance with the Financial Markets Conduct Act 2013. This information is not audited and may be
updated.
Description of this fund The Cash Portfolio invests in a range of cash assets. The fund has a very low level of volatility.
Total value of the fund $4,541,074
Number of Members in the fund 297
Date the fund started 22 Dec 2008
What are the risks of investing?
Medical Assurance Society KiwiSaver Plan - Fund Update year ending 31 March 2017
1 2 3 4 5 6 7
Potentially lower returns Potentially higher returns
Lower risk Higher risk
The risk indicator is rated from 1 (low) to 7 (high). The rating reflects how much the value of the fund’s assets goes up and down. A higher risk generally means higher potential returns over time, but more ups and downs along the way.
To help you clarify your own attitude to risk, you can seek financial advice or work out your risk profile at mas.co.nz/savings-and-investment/risk-profiler
Note that even the lowest category does not mean a risk-free investment, and there are other risks that are not captured by
this rating.
This risk indicator is not a guarantee of a fund’s future performance. The risk indicator is based on the returns data for 5 years
to 31 March 2017. While risk indicators are usually relatively stable, they do shift from time to time. The risk indicator will
continue to be updated in future fund updates. See the Product Disclosure Statement (PDS) for more information about the
risks associated with investing in this fund.
How has the fund performed?
The market index comprises the benchmark index returns of each of the asset classes weighted by their benchmark
asset allocations. Additional information about the market
index is available on the offer register at www.business.govt.nz/disclose
RETURN TYPE AVERAGE OVER
PAST 5 YEARS
PAST YEAR
Annual return
(after deductions for
charges and tax)
2.50% 1.79%
Annual return
(after deductions for
charges but before tax)
3.43% 2.49%
Market index annual return
(reflects no deduction for
charges and tax)
2.83% 2.18%
Risk indicator for the Cash Portfolio:

4
Medical Assurance Society KiwiSaver Plan - Fund Update year ending 31 March 2017
Returns since inception of the Cash Portfolio This shows the return after fund charges and tax for each year ending 31 March since the fund started. The last bar
shows the average annual return since the fund started, up
to 31 March 2017. Important: this does not tell you how the
fund will perform in the future.
Returns in this update are after tax at the highest
prescribed investor rate (PIR) of tax for an individual New
Zealand resident. Your tax may be lower.
What fees are investors charged?
Total fund charges: % of net asset value 0.53%
Which are made up of:
Total management and administration
charges
0.53%
Including:
Manager’s basic fee 0.50%
Other management and administration charges
0.03%
Total performance-based fees 0.00%
Investors in the Cash Portfolio are charged fund charges. In the year to 31 March 2017 these were:
Investors may also be charged individual action fees for specific actions or decisions (for example, for switching
funds). See the PDS for more information about those
fees. The annual manager’s basic fee each member
pays is subject to a minimum fee of $50 per annum. Therefore for members with an account balance of less
than $10,000 the actual manager’s basic fee charged
as a percentage of the member’s account balance
may be higher than that stated in the Medical Assurance Society KiwiSaver Plan PDS.
Example of how this applies to an investor Alex had $10,000 in the fund at the start of the year and did not make any further contributions. At the end of the year, Alex
received a return after fund charges were deducted of $179 (that is 1.79% of his initial $10,000). Alex also paid $0 in other charges. This gives Alex a total return after tax of $179 for the year.
What does the fund invest in? ACTUAL INVESTMENT MIX
This shows the type of assets the portfolio invests in as at 31
March 2017.
TARGET INVESTMENT MIX
This shows the mix of assets the portfolio generally intends
to invest in.
Cash and Cash Equivalents 100.0%
New Zealand Fixed Interest 0.0%
International Fixed Interest 0.0%
Australasian Equities 0.0%
International Equities 0.0%
Property 0.0%
Other * 0.0%
Small differences in fees can have a big impact on your investment.
Other charges Dollar amount per investor or description of how charge is calculated
$0

5
Medical Assurance Society KiwiSaver Plan - Fund Update year ending 31 March 2017 5
NO NAME % OF PORTFOLIO
NET ASSETS
TYPE COUNTRY CREDIT RATING
(IF APPLICABLE)
1 JBWere Premium Custody Call Account
48.65% Cash and Cash Equivalents
New Zealand
2 UDC Term deposit 22.63% Cash and Cash Equivalents
New Zealand BBB
3 BNZ Term deposit 17.53% Cash and Cash Equivalents
New Zealand AA-
4 UDC Term deposit 11.19% Cash and Cash Equivalents
New Zealand BBB
TOP 10 INVESTMENTS
The total value of the above investments as a percentage of the net asset value of the Cash Portfolio is 100.00%.
Key personnel
This shows the directors and employees who have the most influence on the investment decisions of the portfolio.
NAME CURRENT POSITION TIME IN CURRENT
POSITION
PREVIOUS OR OTHER POSITION TIME IN PREVIOUS OR
OTHER POSITION
Bruce Robertson Portfolio Manager 20 years and 0 months
Partner - Goldman-Sachs 7 years and 1 month
Tom Phillips Portfolio Manager 12 years and 6 months
Corporate Lawyer 7 years and 8 months
Earl White (Bancorp Treasury Services)
Director 14 years and 2 months
Treasurer - BNP Paribas 8 years and 7 months
Bernard Doyle Strategist 21 years and 0 months
Analyst - Goldman-Sachs 2 years and 0 months
Hayden Griffiths Asset Allocation 20 years and 11 months
Analyst - BZW 2 years and 5 months
Further information
You can also obtain this information, the PDS for Medical Assurance Society KiwiSaver Plan, and some additional information from
the offer register at www.business.govt.nz/disclose.
Notes
* Other is comprised of Alternative Investments. These are mainly hedge funds and private equity investments.

6
Medical Assurance Society
KiwiSaver Plan
DEFENSIVE PORTFOLIO
Fund Update for the year ending 31 March 2017
This fund update was first made publicly available on
27 June 2017.
What is the purpose of this update? This document tells you how the Medical Assurance Society KiwiSaver Plan Defensive Portfolio has performed and what fees were charged. The document will help you to compare the fund with other funds. The trustees of the Medical Assurance Society KiwiSaver
Plan prepared this update in accordance with the Financial Markets Conduct Act 2013. This information is not audited and may be
updated.
Description of this fund The Defensive Portfolio invests mostly in assets with lower risks and returns, with some investment in growth assets that may give higher
returns. The fund has a low level of volatility.
Total value of the fund $43,633,445
Number of Members in the fund 2,282
Date the fund started 01Oct 2007
What are the risks of investing?
Medical Assurance Society KiwiSaver Plan - Fund Update year ending 31 March 2017
1 2 3 4 5 6 7
Potentially lower returns Potentially higher returns
Lower risk Higher risk
The risk indicator is rated from 1 (low) to 7 (high). The rating reflects how much the value of the fund’s assets goes up and down. A higher risk generally means higher potential returns over time, but more ups and downs along the way.
To help you clarify your own attitude to risk, you can seek financial advice or work out your risk profile at mas.co.nz/savings-and-investment/risk-profiler
Note that even the lowest category does not mean a risk-free investment, and there are other risks that are not captured by
this rating.
This risk indicator is not a guarantee of a fund’s future performance. The risk indicator is based on the returns data for 5 years
to 31 March 2017. While risk indicators are usually relatively stable, they do shift from time to time. The risk indicator will
continue to be updated in future fund updates. See the Product Disclosure Statement (PDS) for more information about the
risks associated with investing in this fund.
How has the fund performed?
The market index comprises the benchmark index returns of each of the asset classes weighted by their benchmark
asset allocations. Additional information about the market
index is available on the offer register at www.business.govt.nz/disclose
RETURN TYPE AVERAGE OVER
PAST 5 YEARS
PAST YEAR
Annual return
(after deductions for
charges and tax)
5.24% 4.60%
Annual return
(after deductions for
charges but before tax)
6.58% 5.65%
Market index annual return
(reflects no deduction for
charges and tax)
6.23% 4.73%
Risk indicator for the Defensive Portfolio:

7
Medical Assurance Society KiwiSaver Plan - Fund Update year ending 31 March 2017
Returns since inception of the Defensive Portfolio This shows the return after fund charges and tax for each year ending 31 March since the fund started. The last bar
shows the average annual return since the fund started, up
to 31 March 2017. Important: this does not tell you how the
fund will perform in the future.
Returns in this update are after tax at the highest
prescribed investor rate (PIR) of tax for an individual New
Zealand resident. Your tax may be lower.
What fees are investors charged?
Total fund charges: % of net asset value 1.21%
Which are made up of:
Total management and administration
charges
1.21%
Including:
Manager’s basic fee 1.00%
Other management and administration
charges *ǂ 0.21%
Total performance-based fees 0.00%
Investors in the Defensive Portfolio are charged fund charges. In the year to 31 March 2017 these were:
An estimate has been used to calculate certain under-lying fund performance fees which are included in
‘Other management and administration charges’.
*Please see the note at the end of the fund update.
Investors may also be charged individual action fees for
specific actions or decisions (for example, for switching
funds). See the PDS for more information about those
fees. The annual manager’s basic fee each member pays is subject to a minimum fee of $50 per annum.
Therefore for members with an account balance of less
than $5,000 the actual manager’s basic fee charged as
a percentage of the member’s account balance may be higher than that stated in the Medical Assurance
Society KiwiSaver Plan PDS.
Example of how this applies to an investor Alex had $10,000 in the fund at the start of the year and did not make any further contributions. At the end of the year, Alex
received a return after fund charges were deducted of $460 (that is 4.60% of his initial $10,000). Alex also paid $0 in other charges. This gives Alex a total return after tax of $460 for the year.
What does the fund invest in? ACTUAL INVESTMENT MIX
This shows the type of assets the portfolio invests in as at 31
March 2017
TARGET INVESTMENT MIX
This shows the mix of assets the portfolio generally intends
to invest in.
Cash and Cash Equivalents 10%
New Zealand Fixed Interest 37.5%
International Fixed Interest 37.5%
Australasian Equities 5.0%
International Equities 7.5%
Property 0.0%
Other ** 2.5%
ǂNote: Other management and administrative charges are set to reduce from September 2017. The reduction in fund
charges is expected to be approximately 0.04%.
Small differences in fees can have a big impact on your investment over the long term.
Other charges Dollar amount per investor or description of how charge is calculated
$0

8
Medical Assurance Society KiwiSaver Plan - Fund Update year ending 31 March 2017 5
NO NAME % OF PORTFOLIO
NET ASSETS
TYPE COUNTRY CREDIT RATING
(IF APPLICABLE)
1 Hunter Global Fixed Interest Fund 31.09% International Fixed Interest
New Zealand
2 JBWere Premium Custody Call Account
6.62% Cash and Cash Equivalents
New Zealand
3 ASB Bank Bond 15/06/2024 4.75% New Zealand Fixed Interest
New Zealand AA-
4 IAG Bond 15/06/2043 4.69% International Fixed Interest
Australia AA-
5 ANZ Bank Bond 29/10/2049 4.69% New Zealand Fixed Interest
New Zealand AA-
6 Chorus Bond 06/05/2021 4.59% New Zealand Fixed Interest
New Zealand BBB
7 ANZ Bank Bond 22/03/2021 3.68% New Zealand Fixed Interest
New Zealand AA-
8 BNZ Bank Bond 15/06/2023 3.42% New Zealand Fixed Interest
New Zealand AA-
9 ASB Bank Bond 15/12/2021 2.28% New Zealand Fixed Interest
New Zealand AA-
10 JBWere USD Premium Custody Call Account
2.26% Cash and Cash Equivalents
New Zealand
TOP 10 INVESTMENTS
The total value of the above investments as a percentage of the net asset value of the Defensive Portfolio is 68.07%.
Currency hedging
Currency hedging can apply to some of the asset classes the portfolio invests in. International fixed interest investments are fully
hedged. The level of hedging for Australian equities can be actively managed between 0%-100%. International equities are
normally 50% hedged but this can be actively managed between 0%-100%. Please refer to the Statement of Investment Policy
and Objectives on the scheme register at www.business.govt.nz/disclose for more information.
Key personnel
This shows the directors and employees who have the most influence on the investment decisions of the portfolio.
NAME CURRENT POSITION TIME IN CURRENT
POSITION
PREVIOUS OR OTHER POSITION TIME IN PREVIOUS OR
OTHER POSITION
Bruce Robertson Portfolio Manager 20 years and 0 months
Partner - Goldman-Sachs 7 years and 1 month
Tom Phillips Portfolio Manager 12 years and 6 months
Corporate Lawyer 7 years and 8 months
Bernard Doyle Strategist 21 years and 0 months
Analyst - Goldman-Sachs 2 years and 0 months
Hayden Griffiths Asset Allocation 20 years and 11 months
Analyst - BZW 2 years and 5 months
Earl White (Bancorp Treasury Services)
Director 14 years and 2 months
Treasurer - BNP Paribas 8 years and 7 months
Further information
You can also obtain this information, the PDS for Medical Assurance Society KiwiSaver Plan, and some additional information from
the offer register at www.business.govt.nz/disclose.
Notes
* An estimate has been used to calculate the underlying fund performance fees which are included in ‘Other management and
administration charges’. Underlying fund performance fees have been estimated by the managers for the year to 31 March 2017.
Additional information on fees is available from the offer register under Fund Information at www.business.govt.nz/disclose.
** ‘Other’ is comprised of Alternative Investments. These are mainly hedge funds and private equity investments.

9
Medical Assurance Society
KiwiSaver Plan
CONSERVATIVE PORTFOLIO
Fund Update for the year ending 31 March 2017
This fund update was first made publicly available on
27June 2017.
What is the purpose of this update? This document tells you how the Medical Assurance Society KiwiSaver Plan Conservative Portfolio has performed and what fees were charged. The document will help you to compare the fund with other funds. The trustees of the Medical Assurance Society
KiwiSaver Plan prepared this update in accordance with the Financial Markets Conduct Act 2013. This information is not audited
and may be updated.
Description of this fund The Conservative Portfolio invests mostly in assets with lower risks and returns, with moderate investment in growth assets that may
give higher returns. The fund has a low level of volatility.
Total value of the fund $50,159,126
Number of Members in the fund 2,036
Date the fund started 01 Oct 2007
What are the risks of investing?
Medical Assurance Society KiwiSaver Plan - Fund Update year ending 31 March 2017
1 2 3 4 5 6 7
Potentially lower returns Potentially higher returns
Lower risk Higher risk
The risk indicator is rated from 1 (low) to 7 (high). The rating reflects how much the value of the fund’s assets goes up and down. A higher risk generally means higher potential returns over time, but more ups and downs along the way.
To help you clarify your own attitude to risk, you can seek financial advice or work out your risk profile at mas.co.nz/savings-and-investment/risk-profiler
Note that even the lowest category does not mean a risk-free investment, and there are other risks that are not captured by
this rating.
This risk indicator is not a guarantee of a fund’s future performance. The risk indicator is based on the returns data for 5 years
to 31 March 2017. While risk indicators are usually relatively stable, they do shift from time to time. The risk indicator will
continue to be updated in future fund updates. See the Product Disclosure Statement (PDS) for more information about the
risks associated with investing in this fund.
How has the fund performed?
The market index comprises the benchmark index returns of each of the asset classes weighted by their benchmark
asset allocations. Additional information about the market
index is available on the offer register at www.business.govt.nz/disclose
RETURN TYPE AVERAGE OVER
PAST 5 YEARS
PAST YEAR
Annual return
(after deductions for
charges and tax)
6.50% 6.38%
Annual return
(after deductions for
charges but before tax)
7.77% 7.44%
Market index annual return
(reflects no deduction for
charges and tax)
7.22% 6.75%
Risk indicator for the Conservative Portfolio:

10
Medical Assurance Society KiwiSaver Plan - Fund Update year ending 31 March 2017
Returns since inception of the Conservative
Portfolio This shows the return after fund charges and tax for each year ending 31 March since the fund started. The last bar
shows the average annual return since the fund started, up
to 31 March 2017. Important: this does not tell you how the
fund will perform in the future.
Returns in this update are after tax at the highest
prescribed investor rate (PIR) of tax for an individual New
Zealand resident. Your tax may be lower.
What fees are investors charged?
Total fund charges: % of net asset value 1.27%
Which are made up of:
Total management and administration
charges
1.27%
Including:
Manager’s basic fee 1.00%
Other management and administration charges *ǂ
0.27%
Total performance-based fees 0.00%
Investors in the Conservative Portfolio are charged fund charges. In the year to 31 March 2017 these were:
An estimate has been used to calculate certain under-lying fund performance fees which are included in
‘Other management and administration charges’.
*Please see the note at the end of the fund update.
Investors may also be charged individual action fees for
specific actions or decisions (for example, for switching
funds). See the PDS for more information about those
fees. The annual manager’s basic fee each member pays is subject to a minimum fee of $50 per annum.
Therefore for members with an account balance of less
than $5,000 the actual manager’s basic fee charged as
a percentage of the member’s account balance may be higher than that stated in the Medical Assurance
Society KiwiSaver Plan PDS.
Example of how this applies to an investor Alex had $10,000 in the fund at the start of the year and did not make any further contributions. At the end of the year, Alex
received a return after fund charges were deducted of $638 (that is 6.38% of his initial $10,000). Alex also paid $0 in other charges. This gives Alex a total return after tax of $638 for the year.
What does the fund invest in? ACTUAL INVESTMENT MIX
This shows the type of assets the portfolio invests in as at 31
March 2017.
TARGET INVESTMENT MIX
This shows the mix of assets the portfolio generally intends
to invest in.
Cash and Cash Equivalents 6.0%
New Zealand Fixed Interest 32.0%
International Fixed Interest 32.0%
Australasian Equities 7.0%
International Equities 18.0%
Property 0.0%
Other ** 5.0%
Other charges Dollar amount per investor or description of how charge is calculated
$0
ǂNote: Other management and administrative charges are set to reduce from September 2017. The reduction in
fund charges is expected to be approximately 0.11%.
Small differences in fees can have a big impact on your investment over the long term.
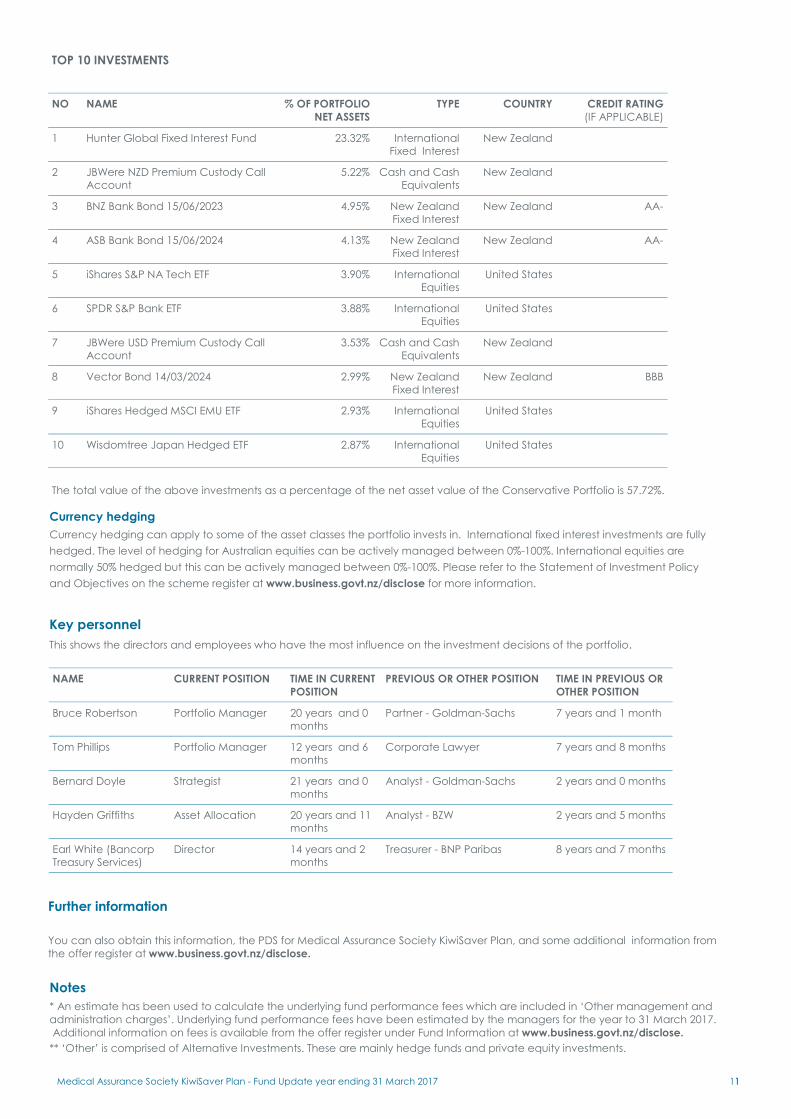
11
Medical Assurance Society KiwiSaver Plan - Fund Update year ending 31 March 2017 1
NO NAME % OF PORTFOLIO
NET ASSETS
TYPE COUNTRY CREDIT RATING
(IF APPLICABLE)
1 Hunter Global Fixed Interest Fund 23.32% International Fixed Interest
New Zealand
2 JBWere NZD Premium Custody Call Account
5.22% Cash and Cash Equivalents
New Zealand
3 BNZ Bank Bond 15/06/2023 4.95% New Zealand Fixed Interest
New Zealand AA-
4 ASB Bank Bond 15/06/2024 4.13% New Zealand Fixed Interest
New Zealand AA-
5 iShares S&P NA Tech ETF 3.90% International Equities
United States
6 SPDR S&P Bank ETF 3.88% International Equities
United States
7 JBWere USD Premium Custody Call Account
3.53% Cash and Cash Equivalents
New Zealand
8 Vector Bond 14/03/2024 2.99% New Zealand Fixed Interest
New Zealand BBB
9 iShares Hedged MSCI EMU ETF 2.93% International Equities
United States
10 Wisdomtree Japan Hedged ETF 2.87% International Equities
United States
TOP 10 INVESTMENTS
The total value of the above investments as a percentage of the net asset value of the Conservative Portfolio is 57.72%.
Currency hedging
Currency hedging can apply to some of the asset classes the portfolio invests in. International fixed interest investments are fully
hedged. The level of hedging for Australian equities can be actively managed between 0%-100%. International equities are
normally 50% hedged but this can be actively managed between 0%-100%. Please refer to the Statement of Investment Policy
and Objectives on the scheme register at www.business.govt.nz/disclose for more information.
Key personnel
This shows the directors and employees who have the most influence on the investment decisions of the portfolio.
NAME CURRENT POSITION TIME IN CURRENT
POSITION
PREVIOUS OR OTHER POSITION TIME IN PREVIOUS OR
OTHER POSITION
Bruce Robertson Portfolio Manager 20 years and 0 months
Partner - Goldman-Sachs 7 years and 1 month
Tom Phillips Portfolio Manager 12 years and 6 months
Corporate Lawyer 7 years and 8 months
Bernard Doyle Strategist 21 years and 0 months
Analyst - Goldman-Sachs 2 years and 0 months
Hayden Griffiths Asset Allocation 20 years and 11 months
Analyst - BZW 2 years and 5 months
Earl White (Bancorp Treasury Services)
Director 14 years and 2 months
Treasurer - BNP Paribas 8 years and 7 months
Further information
You can also obtain this information, the PDS for Medical Assurance Society KiwiSaver Plan, and some additional information from
the offer register at www.business.govt.nz/disclose.
Notes
* An estimate has been used to calculate the underlying fund performance fees which are included in ‘Other management and
administration charges’. Underlying fund performance fees have been estimated by the managers for the year to 31 March 2017.
Additional information on fees is available from the offer register under Fund Information at www.business.govt.nz/disclose.
** ‘Other’ is comprised of Alternative Investments. These are mainly hedge funds and private equity investments.

12
Medical Assurance Society
KiwiSaver Plan
BALANCED PORTFOLIO
Fund Update for the year ending 31 March 2017
This fund update was first made publicly available on
27 June 2017.
What is the purpose of this update? This document tells you how the Medical Assurance Society KiwiSaver Plan Balanced Portfolio has performed and what fees were charged. The document will help you to compare the fund with other funds. The trustees of the Medical Assurance Society KiwiSaver
Plan prepared this update in accordance with the Financial Markets Conduct Act 2013. This information is not audited and may be
updated.
Description of this fund The Balanced Portfolio invests in a mix of around 50% in income assets and around 50% in growth assets that may give higher returns.
The fund has a moderate level of volatility.
Total value of the fund $183,473,007
Number of Members in the fund 5,950
Date the fund started 01 Oct 2007
What are the risks of investing?
Medical Assurance Society KiwiSaver Plan - Fund Update year ending 31 March 2017
1 2 3 4 5 6 7
Potentially lower returns Potentially higher returns
Lower risk Higher risk
The risk indicator is rated from 1 (low) to 7 (high). The rating reflects how much the value of the fund’s assets goes up and down. A higher risk generally means higher potential returns over time, but more ups and downs along the way.
To help you clarify your own attitude to risk, you can seek financial advice or work out your risk profile at mas.co.nz/savings-and-investment/risk-profiler
Note that even the lowest category does not mean a risk-free investment, and there are other risks that are not captured by
this rating.
This risk indicator is not a guarantee of a fund’s future performance. The risk indicator is based on the returns data for 5 years
to 31 March 2017. While risk indicators are usually relatively stable, they do shift from time to time. The risk indicator will
continue to be updated in future fund updates. See the Product Disclosure Statement (PDS) for more information about the
risks associated with investing in this fund.
How has the fund performed?
The market index comprises the benchmark index returns of each of the asset classes weighted by their benchmark
asset allocations. Additional information about the market
index is available on the offer register at www.business.govt.nz/disclose
RETURN TYPE AVERAGE OVER
PAST 5 YEARS
PAST YEAR
Annual return
(after deductions for
charges and tax)
7.98% 8.31%
Annual return
(after deductions for
charges but before tax)
9.15% 9.23%
Market index annual return
(reflects no deduction for
charges and tax)
8.23% 9.28%
Risk indicator for the Balanced Portfolio:

13
Medical Assurance Society KiwiSaver Plan - Fund Update year ending 31 March 2017
Returns since inception of the Balanced Portfolio This shows the return after fund charges and tax for each year ending 31 March since the fund started. The last bar
shows the average annual return since the fund started, up
to 31 March 2017. Important: this does not tell you how the
fund will perform in the future.
Returns in this update are after tax at the highest
prescribed investor rate (PIR) of tax for an individual New
Zealand resident. Your tax may be lower.
What fees are investors charged?
Total fund charges: % of net asset value 1.30%
Which are made up of:
Total management and administration
charges
1.30%
Including:
Manager’s basic fee 1.00%
Other management and administration charges *ǂ
0.30%
Total performance-based fees 0.00%
Investors in the Balanced Portfolio are charged fund charges. Over the year to 31 March 2017 these were:
An estimate has been used to calculate certain under-lying fund performance fees which are included in
‘Other management and administration charges’.
*Please see the note at the end of the fund update.
Investors may also be charged individual action fees for
specific actions or decisions (for example, for switching
funds). See the PDS for more information about those
fees. The annual manager’s basic fee each member pays is subject to a minimum fee of $50 per annum.
Therefore for members with an account balance of less
than $5,000 the actual manager’s basic fee charged as
a percentage of the member’s account balance may be higher than that stated in the Medical Assurance
Society KiwiSaver Plan PDS.
Example of how this applies to an investor Alex had $10,000 in the fund at the start of the year and did not make any further contributions. At the end of the year, Alex
received a return after fund charges were deducted of $831 (that is 8.31% of his initial $10,000). Alex also paid $0 in other charges. This gives Alex a total return after tax of $831 for the year.
What does the fund invest in? ACTUAL INVESTMENT MIX
This shows the type of assets the portfolio invests in as at 31
March 2017.
TARGET INVESTMENT MIX
This shows the mix of assets the portfolio generally intends
to invest in.
Cash and Cash Equivalents 4.0%
New Zealand Fixed Interest 23.0%
International Fixed Interest 23.0%
Australasian Equities 15.0%
International Equities 27.5%
Property 0.0%
Other ** 7.5%
Other charges Dollar amount per investor or description of how charge is calculated
$0
ǂNote: Other management and administrative charges are set to reduce from September 2017. The reduction in
fund charges is expected to be approximately 0.12%.
Small differences in fees can have a big impact on your investment over the long term.

14
Medical Assurance Society KiwiSaver Plan - Fund Update year ending 31 March 2017 4
NO NAME % OF PORTFOLIO
NET ASSETS
TYPE COUNTRY CREDIT RATING
(IF APPLICABLE)
1 Hunter Global Fixed Interest Fund 13.60% International Fixed Interest
New Zealand
2 iShares S&P NA Tech ETF 5.86% International Equities
United States
3 SPDR S&P Bank ETF 5.80% International Equities
United States
4 JBWere NZD Premium Custody Call Account
4.95% Cash and Cash Equivalents
New Zealand
5 iShares Hedged MSCI EMU ETF 4.42% International Equities
United States
6 Wisdomtree Japan Hedged ETF 4.32% International Equities
United States
7 JBWere USD Premium Custody Call Account
3.94% Cash and Cash Equivalents
New Zealand
8 BNZ Bond 15/06/2023 3.31% New Zealand Fixed Interest
New Zealand AA-
9 Vector Bond 14/03/2024 3.28% New Zealand Fixed Interest
New Zealand BBB
10 iShares US Medical Devices ETF 3.15% International Equities
United States
TOP 10 INVESTMENTS
The total value of the above investments as a percentage of the net asset value of the Balanced Portfolio is 52.63%.
Currency hedging
Currency hedging can apply to some of the asset classes the portfolio invests in. International fixed interest investments are fully
hedged. The level of hedging for Australian equities can be actively managed between 0%-100%. International equities are nor-
mally 50% hedged but this can be actively managed between 0%-100%. Please refer to the Statement of Investment Policy and
Objectives on the scheme register at www.business.govt.nz/disclose for more information.
Key personnel
This shows the directors and employees who have the most influence on the investment decisions of the portfolio.
NAME CURRENT POSITION TIME IN CURRENT
POSITION
PREVIOUS OR OTHER POSITION TIME IN PREVIOUS OR
OTHER POSITION
Bruce Robertson Portfolio Manager 20 years and 0 months
Partner - Goldman-Sachs 7 years and 1 month
Tom Phillips Portfolio Manager 12 years and 6 months
Corporate Lawyer 7 years and 8 months
Bernard Doyle Strategist 21 years and 0 months
Analyst - Goldman-Sachs 2 years and 0 months
Hayden Griffiths Asset Allocation 20 years and 11 months
Analyst - BZW 2 years and 5 months
Earl White (Bancorp Treasury Services)
Director 14 years and 2 months
Treasurer - BNP Paribas 8 years and 7 months
Further information
You can also obtain this information, the PDS for Medical Assurance Society KiwiSaver Plan, and some additional information from
the offer register at www.business.govt.nz/disclose.
Notes
* An estimate has been used to calculate the underlying fund performance fees which are included in ‘Other management and
administration charges’. Underlying fund performance fees have been estimated by the managers for the year to 31 March 2017.
Additional information on fees is available from the offer register under Fund Information at www.business.govt.nz/disclose.
** ‘Other’ is comprised of Alternative Investments. These are mainly hedge funds and private equity investments.

15
Medical Assurance Society
KiwiSaver Plan
GROWTH PORTFOLIO
Fund Update for the year ending 31 March 2017
This fund update was first made publicly available on
27 June 2017.
What is the purpose of this update? This document tells you how the Medical Assurance Society KiwiSaver Plan Growth Portfolio has performed and what fees were charged. The document will help you to compare the fund with other funds. The trustees of the Medical Assurance Society KiwiSaver
Plan prepared this update in accordance with the Financial Markets Conduct Act 2013. This information is not audited and may be
updated.
Description of this fund The Growth Portfolio invests mostly in growth assets with a higher level of risk and returns, and with some investment in income assets
that provide a degree of stability. The fund has a moderate to high level of volatility.
Total value of the fund $163,295,658
Number of Members in the fund 6,217
Date the fund started 01 Oct 2007
What are the risks of investing?
Medical Assurance Society KiwiSaver Plan - Fund Update year ending 31 March 2017
1 2 3 4 5 6 7
Potentially lower returns Potentially higher returns
Lower risk Higher risk
The risk indicator is rated from 1 (low) to 7 (high). The rating reflects how much the value of the fund’s assets goes up and down. A higher risk generally means higher potential returns over time, but more ups and downs along the way.
To help you clarify your own attitude to risk, you can seek financial advice or work out your risk profile at mas.co.nz/savings-and-investment/risk-profiler
Note that even the lowest category does not mean a risk-free investment, and there are other risks that are not captured by
this rating.
This risk indicator is not a guarantee of a fund’s future performance. The risk indicator is based on the returns data for 5 years
to 31 March 2017. While risk indicators are usually relatively stable, they do shift from time to time. The risk indicator will
continue to be updated in future fund updates. See the Product Disclosure Statement (PDS) for more information about the
risks associated with investing in this fund.
How has the fund performed?
The market index comprises the benchmark index returns of each of the asset classes weighted by their benchmark
asset allocations. Additional information about the market
index is available on the offer register at www.business.govt.nz/disclose
RETURN TYPE AVERAGE OVER
PAST 5 YEARS
PAST YEAR
Annual return
(after deductions for
charges and tax)
9.32% 10.64%
Annual return
(after deductions for
charges but before tax)
10.39% 11.51%
Market index annual return
(reflects no deduction for
charges and tax)
9.59% 11.90%
Risk indicator for the Growth Portfolio:

16
Medical Assurance Society KiwiSaver Plan - Fund Update year ending 31 March 2017
Returns since inception of the Growth Portfolio This shows the return after fund charges and tax for each year ending 31 March since the fund started. The last bar
shows the average annual return since the fund started, up
to 31 March 2017. Important: this does not tell you how the
fund will perform in the future.
Returns in this update are after tax at the highest
prescribed investor rate (PIR) of tax for an individual New
Zealand resident. Your tax may be lower.
What fees are investors charged?
Total fund charges: % of net asset value 1.39%
Which are made up of:
Total management and administration
charges
1.39%
Including:
Manager’s basic fee 1.00%
Other management and administration charges *ǂ
0.39%
Total performance-based fees 0.00%
Investors in the Growth Portfolio are charged fund charges. Over the year to 31 March 2017 these were:
An estimate has been used to calculate certain under-lying fund performance fees which are included in
‘Other management and administration charges’.
*Please see the note at the end of the fund update.
Investors may also be charged individual action fees for
specific actions or decisions (for example, for switching
funds). See the PDS for more information about those
fees. The annual manager’s basic fee each member pays is subject to a minimum fee of $50 per annum.
Therefore for members with an account balance of less
than $5,000 the actual manager’s basic fee charged as
a percentage of the member’s account balance may be higher than that stated in the Medical Assurance
Society KiwiSaver Plan PDS.
Example of how this applies to an investor Alex had $10,000 in the fund at the start of the year and did not make any further contributions. At the end of the year, Alex
received a return after fund charges were deducted of $1,064 (that is 10.64% of his initial $10,000). Alex also paid $0 in other charges. This gives Alex a total return after tax of $1,064 for the year.
What does the fund invest in? ACTUAL INVESTMENT MIX
This shows the type of assets the portfolio invests in as at 31
March 2017.
TARGET INVESTMENT MIX
This shows the mix of assets the portfolio generally intends
to invest in.
Cash and Cash Equivalents 2.0%
New Zealand Fixed Interest 14.0%
International Fixed Interest 14.0%
Australasian Equities 20.0%
International Equities 40.0%
Property 0.0%
Other ** 10.0%
Other charges Dollar amount per investor or description of how charge is calculated
$0
ǂNote: Other management and administrative charges are set to reduce from September 2017. The reduction in fund
charges is expected to be approximately 0.21%.
Small differences in fees can have a big impact on your investment over the long term.

17
Medical Assurance Society KiwiSaver Plan - Fund Update year ending 31 March 2017 7
NO NAME % OF PORTFOLIO
NET ASSETS
TYPE COUNTRY CREDIT RATING
(IF APPLICABLE)
1 Hunter Global Fixed Interest Fund 10.30% International Fixed Interest
New Zealand
2 iShares S&P NA Tech ETF 7.97% International Equities
United States
3 SPDR S&P Bank ETF 7.89% International Equities
United States
4 Wisdomtree Japan Hedged ETF 5.87% International Equities
United States
5 iShares MSCI EMU Hedged ETF 5.77% International Equities
United States
6 JBWere NZD Premium Custody Call Account
4.23% Cash and Cash Equivalents
New Zealand
7 iShares US Medical Devices ETF 4.23% International Equities
United States
8 BNZ Bond 17/12/2025 3.20% New Zealand Fixed Interest
New Zealand AA-
9 iShares STOXX Europe 600 Tele-comms ETF
2.56% International Equities
European Union
10 iShares MSCI India ETF 2.13% International Equities
United States
TOP 10 INVESTMENTS
The total value of the above investments as a percentage of the net asset value of the Growth Portfolio is 54.15%.
Currency hedging
Currency hedging can apply to some of the asset classes the portfolio invests in. All international fixed interest investments are
fully hedged. The level of hedging for Australian equities can be actively managed between 0%-100%. International equities are
normally 50% hedged but this can be actively managed between 0%-100%. Please refer to the Statement of Investment Policy
and Objectives on the scheme register at www.business.govt.nz/disclose for more information.
Key personnel
This shows the directors and employees who have the most influence on the investment decisions of the portfolio.
NAME CURRENT POSITION TIME IN CURRENT
POSITION
PREVIOUS OR OTHER POSITION TIME IN PREVIOUS OR
OTHER POSITION
Bruce Robertson Portfolio Manager 20 years and 0 months
Partner - Goldman-Sachs 7 years and 1 month
Tom Phillips Portfolio Manager 12 years and 6 months
Corporate Lawyer 7 years and 8 months
Bernard Doyle Strategist 21 years and 0 months
Analyst - Goldman-Sachs 2 years and 0 months
Hayden Griffiths Asset Allocation 20 years and 11 months
Analyst - BZW 2 years and 5 months
Earl White (Bancorp Treasury Services)
Director 14 years and 2 months
Treasurer - BNP Paribas 8 years and 7 months
Further information
You can also obtain this information, the PDS for Medical Assurance Society KiwiSaver Plan, and some additional information from
the offer register at www.business.govt.nz/disclose
Notes
* An estimate has been used to calculate the underlying fund performance fees which are included in ‘Other management and
administration charges’. Underlying fund performance fees have been estimated by the managers for the year to 31 March 2017.
Additional information on fees is available from the offer register under Fund Information at www.business.govt.nz/disclose.
** ‘Other’ is comprised of Alternative Investments. These are mainly hedge funds and private equity investments.
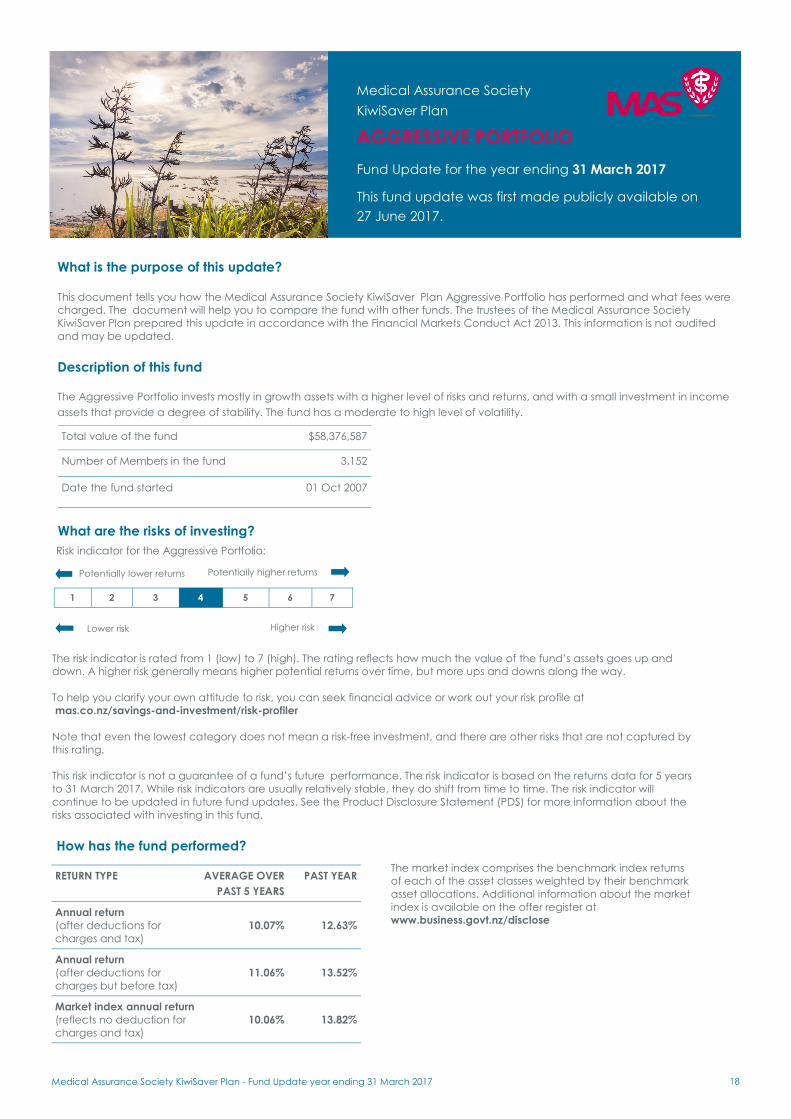
18
Medical Assurance Society
KiwiSaver Plan
AGGRESSIVE PORTFOLIO
Fund Update for the year ending 31 March 2017
This fund update was first made publicly available on
27 June 2017.
What is the purpose of this update? This document tells you how the Medical Assurance Society KiwiSaver Plan Aggressive Portfolio has performed and what fees were charged. The document will help you to compare the fund with other funds. The trustees of the Medical Assurance Society
KiwiSaver Plan prepared this update in accordance with the Financial Markets Conduct Act 2013. This information is not audited
and may be updated.
Description of this fund The Aggressive Portfolio invests mostly in growth assets with a higher level of risks and returns, and with a small investment in income
assets that provide a degree of stability. The fund has a moderate to high level of volatility.
Total value of the fund $58,376,587
Number of Members in the fund 3,152
Date the fund started 01 Oct 2007
What are the risks of investing?
Medical Assurance Society KiwiSaver Plan - Fund Update year ending 31 March 2017
1 2 3 4 5 6 7
Potentially lower returns Potentially higher returns
Lower risk Higher risk
The risk indicator is rated from 1 (low) to 7 (high). The rating reflects how much the value of the fund’s assets goes up and down. A higher risk generally means higher potential returns over time, but more ups and downs along the way.
To help you clarify your own attitude to risk, you can seek financial advice or work out your risk profile at mas.co.nz/savings-and-investment/risk-profiler
Note that even the lowest category does not mean a risk-free investment, and there are other risks that are not captured by
this rating.
This risk indicator is not a guarantee of a fund’s future performance. The risk indicator is based on the returns data for 5 years
to 31 March 2017. While risk indicators are usually relatively stable, they do shift from time to time. The risk indicator will
continue to be updated in future fund updates. See the Product Disclosure Statement (PDS) for more information about the
risks associated with investing in this fund.
How has the fund performed?
The market index comprises the benchmark index returns of each of the asset classes weighted by their benchmark
asset allocations. Additional information about the market
index is available on the offer register at www.business.govt.nz/disclose
RETURN TYPE AVERAGE OVER
PAST 5 YEARS
PAST YEAR
Annual return
(after deductions for
charges and tax)
10.07% 12.63%
Annual return
(after deductions for
charges but before tax)
11.06% 13.52%
Market index annual return
(reflects no deduction for
charges and tax)
10.06% 13.82%
Risk indicator for the Aggressive Portfolio:

19
Medical Assurance Society KiwiSaver Plan - Fund Update year ending 31 March 2017
Returns since inception of the Aggressive Portfolio
This shows the return after fund charges and tax for each year ending 31 March since the fund started. The last bar
shows the average annual return since the fund started, up
to 31 March 2017. Important: this doesn’t tell you how the
fund will perform in the future.
Returns in this update are after tax at the highest
prescribed investor rate (PIR) of tax for an individual New
Zealand resident. Your tax may be lower.
What fees are investors charged?
Total fund charges: % of net asset value 1.42%
Which are made up of:
Total management and administration
charges
1.42%
Including:
Manager’s basic fee 1.00%
Other management and administration charges *ǂ
0.42%
Total performance-based fees 0.00%
Investors in the Aggressive Portfolio are charged fund charges. Over the year to 31 March 2017 these were:
An estimate has been used to calculate certain under-lying fund performance fees which are included in
‘Other management and administration charges’.
*Please see the note at the end of the fund update.
Investors may also be charged individual action fees for
specific actions or decisions (for example, for switching
funds). See the PDS for more information about those
fees. The annual manager’s basic fee each member pays is subject to a minimum fee of $50 per annum.
Therefore for members with an account balance of less
than $5,000 the actual manager’s basic fee charged as
a percentage of the member’s account balance may be higher than that stated in the Medical Assurance
Society KiwiSaver Plan PDS.
Example of how this applies to an investor Alex had $10,000 in the fund at the start of the year and did not make any further contributions. At the end of the year, Alex
received a return after fund charges were deducted of $1,263 (that is 12.63% of his initial $10,000). Alex also paid $0 in other charges. This gives Alex a total return after tax of $1,263 for the year.
What does the fund invest in? ACTUAL INVESTMENT MIX
This shows the type of assets the portfolio invests in as at 31
March 2017
TARGET INVESTMENT MIX
This shows the mix of assets the portfolio generally intends
to invest in.
Cash and Cash Equivalents 0.0%
New Zealand Fixed Interest 7.5%
International Fixed Interest 7.5%
Australasian Equities 25.0%
International Equities 47.5%
Property 0.0%
Other ** 12.5%
Other charges Dollar amount per investor or description of how charge is calculated
$0
ǂNote: Other management and administrative charges are set to reduce from September 2017. The reduction in
fund charges is expected to be approximately 0.23%.
Small differences in fees can have a big impact on your investment over the long term.

20
Medical Assurance Society KiwiSaver Plan - Fund Update year ending 31 March 2017 0
NO NAME % OF PORTFOLIO
NET ASSETS
TYPE COUNTRY CREDIT RATING
(IF APPLICABLE)
1 iShares S&P NA Tech ETF 9.53% International Equities
United States
2 SPDR S&P Bank ETF 9.44% International Equities
United States
3 Wisdomtree Japan Hedged ETF 7.02% International Equities
United States
4 iShares MSCI EMU Hedged ETF 6.82% International Equities
United States
5 iShares US Medical Devices ETF 5.14% International Equities
United States
6 BNZ Bond 17/12/2025 3.79% New Zealand Fixed Interest
New Zealand AA-
7 iShares STOXX Europe 600 Tele-comms ETF
3.06% International Equities
European Union
8 iShares MSCI India ETF 2.50% International Equities
United States
9 iShares St 600 Health Care Devices ETF
2.43% International Equities
European Union
10 iShares DJ US Oil Equipment ETF 2.14% International Equities
United States
TOP 10 INVESTMENTS
The total value of the above investments as a percentage of the net asset value of the Aggressive Portfolio is 51.87%.
Currency hedging
Currency hedging can apply to some of the asset classes the portfolio invests in. International fixed interest investments are fully
hedged. The level of hedging for Australian equities can be actively managed between 0%-100%. International equities are nor-
mally 50% hedged but this can be actively managed between 0%-100%. Please refer to the Statement of Investment Policy and
Objectives on the scheme register at www.business.govt.nz/disclose for more information.
Key personnel
This shows the directors and employees who have the most influence on the investment decisions of the portfolio.
NAME CURRENT POSITION TIME IN CURRENT
POSITION
PREVIOUS OR OTHER POSITION TIME IN PREVIOUS OR
OTHER POSITION
Bruce Robertson Portfolio Manager 20 years and 0 months
Partner - Goldman-Sachs 7 years and 1 month
Tom Phillips Portfolio Manager 12 years and 6 months
Corporate Lawyer 7 years and 8 months
Bernard Doyle Strategist 21 years and 0 months
Analyst - Goldman-Sachs 2 years and 0 months
Hayden Griffiths Asset Allocation 20 years and 11 months
Analyst - BZW 2 years and 5 months
Earl White (Bancorp Treasury Services)
Director 14 years and 2 months
Treasurer - BNP Paribas 8 years and 7 months
Further information
You can also obtain this information, the PDS for Medical Assurance Society KiwiSaver Plan, and some additional information from
the offer register at www.business.govt.nz/disclose.
Notes
* An estimate has been used to calculate the underlying fund performance fees which are included in ‘Other management and
administration charges’. Underlying fund performance fees have been estimated by the managers for the year to 31 March 2017.
Additional information on fees is available from the offer register under Fund Information at www.business.govt.nz/disclose.
** ‘Other’ is comprised of Alternative Investments. These are mainly hedge funds and private equity investments.

21
Medical Assurance Society
KiwiSaver Plan
GLOBAL EQUITIES PORTFOLIO
Fund Update for the year ending 31 March 2017
This fund update was first made publicly available on
27 June 2017.
What is the purpose of this update? This document tells you how the Medical Assurance Society KiwiSaver Plan Global Equities Portfolio has performed and what fees were charged. The document will help you to compare the fund with other funds. The trustees of the Medical Assurance Society
KiwiSaver Plan prepared this update in accordance with the Financial Markets Conduct Act 2013. This information is not audited
and may be updated.
Description of this fund The Global Equities Portfolio invests entirely in growth assets with the potential for very high growth over the long term. The fund has
a potentially high level of volatility.
Total value of the portfolio $34,762,744
Number of Members in the portfolio 1,683
Date the portfolio started 01 Oct 2007
What are the risks of investing?
Medical Assurance Society KiwiSaver Plan - Fund Update year ending 31 March 2017
1 2 3 4 5 6 7
Potentially lower returns Potentially higher returns
Lower risk Higher risk
The risk indicator is rated from 1 (low) to 7 (high). The rating reflects how much the value of the fund’s assets goes up and down. A higher risk generally means higher potential returns over time, but more ups and downs along the way.
To help you clarify your own attitude to risk, you can seek financial advice or work out your risk profile at mas.co.nz/savings-and-investment/risk-profiler
Note that even the lowest category does not mean a risk-free investment, and there are other risks that are not captured by
this rating.
This risk indicator is not a guarantee of a fund’s future performance. The risk indicator is based on the returns data for 5 years
to 31 March 2017. While risk indicators are usually relatively stable, they do shift from time to time. The risk indicator will
continue to be updated in future fund updates. See the Product Disclosure Statement (PDS) for more information about the
risks associated with investing in this fund.
How has the fund performed?
The market index comprises the benchmark index returns of each of the asset classes weighted by their benchmark
asset allocations. Additional information about the market
index is available on the offer register at www.business.govt.nz/disclose
RETURN TYPE AVERAGE OVER
PAST 5 YEARS
PAST YEAR
Annual return
(after deductions for
charges and tax)
10.61% 14.69%
Annual return
(after deductions for
charges but before tax)
11.53% 15.59%
Market index annual return
(reflects no deduction for
charges and tax)
11.01% 15.74%
Risk indicator for the Global Equities Portfolio:

22
Medical Assurance Society KiwiSaver Plan - Fund Update year ending 31 March 2017
Returns since inception of the Global Equities Portfolio This shows the return after fund charges and tax for each year ending 31 March since the fund started. The last bar
shows the average annual return since the fund started, up
to 31 March 2017. Important: this doesn’t tell you how the
fund will perform in the future.
Returns in this update are after tax at the highest
prescribed investor rate (PIR) of tax for an individual New
Zealand resident. Your tax may be lower.
What fees are investors charged?
Total fund charges: % of net asset value 1.48%
Which are made up of:
Total management and administration
charges
1.48%
Including:
Manager’s basic fee 1.00%
Other management and administration charges *ǂ
0.48%
Total performance-based fees 0.00%
Investors in the Global Equities Portfolio are charged fund charges. Over the year to 31 March 2017 these were:
An estimate has been used to calculate certain underlying fund performance fees which are included
in ‘Other management and administration charges’.
*Please see the note at the end of the fund update.
Investors may also be charged individual action fees for
specific actions or decisions (for example, for switching
funds). See the product disclosure statement for more
information about those fees. The annual manager’s basic fee each member pays is subject to a minimum
fee of $50 per annum. Therefore for members with an
account balance of less than $5,000 the actual
manager’s basic fee charged as a percentage of the member’s account balance may be higher than that
stated in the Medical Assurance Society KiwiSaver Plan
PDS.
Example of how this applies to an investor Alex had $10,000 in the fund at the start of the year and did not make any further contributions. At the end of the year, Alex
received a return after fund charges were deducted of $1,469 (that is 14.69% of his initial $10,000). Alex also paid $0 in other charges. This gives Alex a total return after tax of $1,469 for the year.
What does the fund invest in? ACTUAL INVESTMENT MIX
This shows the type of assets the portfolio invests in as at 31
March 2017.
TARGET INVESTMENT MIX
This shows the mix of assets the portfolio generally intends
to invest in.
Cash and Cash Equivalents 0.0%
New Zealand Fixed Interest 0.0%
International Fixed Interest 0.0%
Australasian Equities 30.0%
International Equities 55.0%
Property 0.0%
Other ** 15.0%
Other charges Dollar amount per investor or description of how charge is calculated
$0
ǂNote: Other management and administrative charges are set to reduce from September 2017. The reduction in
fund charges is expected to be approximately 0.28%.
Small differences in fees can have a big impact on your investment over the long term.

23
Medical Assurance Society KiwiSaver Plan - Fund Update year ending 31 March 2017 5
NO NAME % OF PORTFOLIO
NET ASSETS
TYPE COUNTRY CREDIT RATING
(IF APPLICABLE)
1 iShares S&P NA Tech ETF 11.12% International Equities
United States
2 SPDR S&P Bank ETF 11.06% International Equities
United States
3 Wisdomtree Japan Hedged ETF 8.19% International Equities
United States
4 iShares MSCI EMU Hedged ETF 7.81% International Equities
United States
5 iShares US Medical Devices ETF 5.91% International Equities
United States
6 iShares STOXX Europe 600 Tele-comms ETF
3.57% International Equities
European Union
7 iShares MSCI India ETF 2.87% International Equities
United States
8 iShares St 600 Health Care Devices ETF
2.85% International Equities
European Union
9 GMO Macro Trust-B 2.83% Other Australia
10 iShares DJ US Oil Equipment ETF 2.57% International Equities
United States
TOP 10 INVESTMENTS
The total value of the above investments as a percentage of the net asset value of the Global Equities Portfolio is 58.78%.
Currency hedging
Currency hedging can apply to some of the asset classes the portfolio invests in. The level of hedging for Australian equities can
be actively managed between 0%-100%. International equities are normally 50% hedged but this can be actively managed
between 0%-100%. Please refer to the Statement of Investment Policy and Objectives on the scheme register at
www.business.govt.nz/disclose for more information.
Key personnel
This shows the directors and employees who have the most influence on the investment decisions of the portfolio.
NAME CURRENT POSITION TIME IN CURRENT
POSITION
PREVIOUS OR OTHER POSITION TIME IN PREVIOUS OR
OTHER POSITION
Bruce Robertson Portfolio Manager 20 years and 0 months
Partner - Goldman-Sachs 7 years and 1 month
Tom Phillips Portfolio Manager 12 years and 6 months
Corporate Lawyer 7 years and 8 months
Bernard Doyle Strategist 21 years and 0 months
Analyst - Goldman-Sachs 2 years and 0 months
Hayden Griffiths Asset Allocation 20 years and 11 months
Analyst - BZW 2 years and 5 months
Earl White (Bancorp Treasury Services)
Director 14 years and 2 months
Treasurer - BNP Paribas 8 years and 7 months
Further information
You can also obtain this information, the PDS for Medical Assurance Society KiwiSaver Plan, and some additional information from
the offer register at www.business.govt.nz/disclose.
Notes
* An estimate has been used to calculate the underlying fund performance fees which are included in ‘Other management and
administration charges’. Underlying fund performance fees have been estimated by the managers for the year to 31 March 2017.
Additional information on fees is available from the offer register under Fund Information at www.business.govt.nz/disclose.
** ‘Other’ is comprised of Alternative Investments. These are mainly hedge funds and private equity investments.