medicare managed care plan performance: a comparison
TRANSCRIPT

MMRR 2012: Volume 2 (1)
Basu, J., Mobley, L.R. E1
Medicare & Medicaid Research Review 2012: Volume 2, Number 1
A publication of the Centers for Medicare & Medicaid Services,
Center for Strategic Planning
Medicare Managed Care plan Performance: A Comparison across Hospitalization Types
Jayasree Basu¹ & Lee Rivers Mobley² ¹U.S. Department of Health and Human Services, Agency for Healthcare Research and Quality ²Research Triangle Institute (RTI) International, Division for Public Health and Environment
Objective: The study evaluates the performance of Medicare managed care (Medicare Advantage [MA]) Plans in comparison to Medicare fee-for-service (FFS) Plans in three states with historically high Medicare managed care penetration (New York, California, Florida), in terms of lowering the risks of preventable or ambulatory care sensitive conditions (ACSC) hospital admissions and providing increased referrals for admissions for specialty procedures. Study Design/ Methods: Using 2004 hospital discharge files from the Healthcare Cost and Utilization Project (HCUP-SID) of the Agency for Healthcare Research and Quality, ACSC admissions are compared with ‘marker’ admissions and ‘referral-sensitive’ admissions, using a multinomial logistic regression approach. The year 2004 represents a strategic time to test the impact of MA on preventable hospitalizations, because the HMOs dominated the market composition in that time period. Findings: MA enrollees in California experienced 22% lower relative risk (RRR= 0.78, p<0.01), those in Florida experienced 16% lower relative risk (RRR= 0.84, p<0.01), while those in New York experienced 9% lower relative risk (RRR=0.91, p<0.01) of preventable (versus marker) admissions compared to their FFS counterparts. MA enrollees in New York experienced 37% higher relative risk (RRR=1.37, p<0.01) and those in Florida had 41% higher relative risk (RRR=1.41, p<0.01)—while MA enrollees in California had 13% lower relative risk (RRR=0.87, p<0.01)—of referral-sensitive (versus marker) admissions compared to their FFS counterparts. Conclusion: While MA plans were associated with reductions in preventable hospitalizations in all three states, the effects on referral-sensitive admissions varied, with California experiencing lower relative risk of referral-sensitive admissions for MA plan enrollees. The lower relative risk of preventable admissions for MA plan enrollees in New York and Florida became more pronounced after accounting for selection bias.
Key words: Medicare, managed care, primary care quality, hospital admissions, preventable hospitalizations, ambulatory care sensitive admissions, elderly, referral-sensitive admissions, referral patterns
doi: http://dx.doi.org/10.5600/mmrr.002.01.a02

MMRR 2012: Volume 2 (1)
Basu, J., Mobley, L.R. E2
Background
The Medicare Advantage (MA) program allows beneficiaries to receive Medicare benefits through private managed care health plans, rather than through traditional fee-for-service (FFS) Medicare. Though private health plans have been an option for Medicare beneficiaries for many years, legislative changes have been enacted to encourage greater plan and beneficiary participation. The first major changes were mandated in the Balanced Budget Act of 1997, which created the Medicare+ Choice program. In the Medicare Modernization Act (MMA) of 2003, the Medicare+ Choice program was replaced with the MA program, modifying the determination of plan payments and expanding the types of private health plans eligible to participate. As of September 2005 (National Health Policy Forum, 2005), the Centers for Medicare & Medicaid Services (CMS) had approved 464 plans to participate in Medicare Advantage for 2006.
Under MA, many types of managed care health plans are eligible to participate in Medicare. In addition to the types of plans that had been available—health maintenance organizations (HMOs), preferred provider organizations (PPOs), private FFS (PFFS) plans, and medical savings account (MSA) plans—regional PPOs and special needs plans (SNPs) are new options. With the exception of private FFS plans and MSA plans, MA plans must now offer at least one benefit package that includes prescription drug coverage (Medicare Part D) in each area they serve (National Health Policy Forum, 2005).
However, up until at least 2005, drug coverage was an optional benefit (at the plan’s discretion) and HMOs were the most dominant form of managed care (Pope, Olmsted, Kautter, Mobley, & Greenwald, 2005; Exhibit 1). Although the MMA fostered new PPO plans in a special demonstration, these were only made available in urban markets with established Medicare HMO plans (Pope et al., 2005). In these demonstration markets, the PPO demonstration plans had less than 5% share of HMO and PPO plan enrollments in 2004 (Pope et al., 2005; Pope, Greenwald, Kautter, Olmstead, & Mobley, 2006). Our own analysis of the CMS Geographic Service Area file (Exhibit 1) finds that PPO demonstration and other private PPO plans offered to the elderly were only 3.3 percent of managed care (HMO and PPO) enrollment by September 2005, while PFFS plans were only 2.7 percent, with 94 percent of Medicare managed care enrollees still in traditional HMO plans. Private FFS plans saw the most growth among managed care types following the implementation of MMA in 2006 (Pizer, Frakt, & Feldman, 2007), but in 2005 these PFFS plans were a very small proportion of the managed care market. Therefore, 2004 in these three states presents a unique window of opportunity when MA plans were better established, but the MA markets in these states were still dominated by HMOs, arguably the strongest form of management along the spectrum of managed care plan types.
MMRR 2012: Volume 2 (1)
Basu, J., Mobley, L.R. E3
The Study Objective
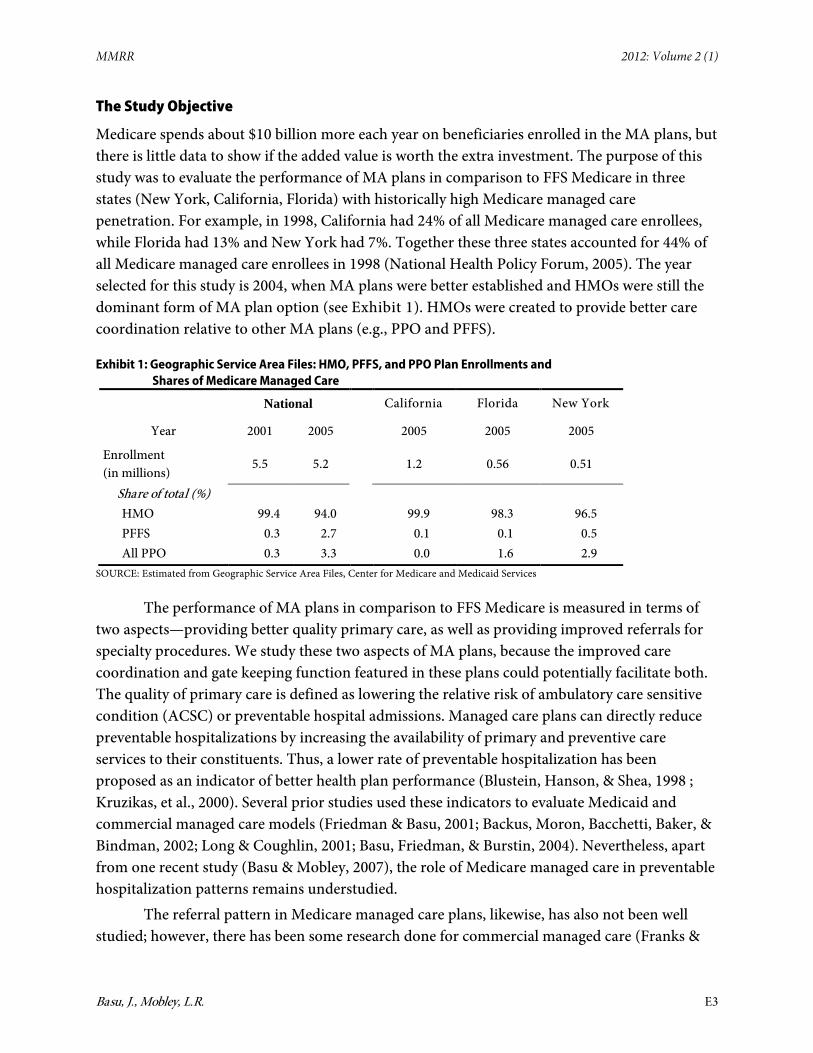
Medicare spends about $10 billion more each year on beneficiaries enrolled in the MA plans, but there is little data to show if the added value is worth the extra investment. The purpose of this study was to evaluate the performance of MA plans in comparison to FFS Medicare in three states (New York, California, Florida) with historically high Medicare managed care penetration. For example, in 1998, California had 24% of all Medicare managed care enrollees, while Florida had 13% and New York had 7%. Together these three states accounted for 44% of all Medicare managed care enrollees in 1998 (National Health Policy Forum, 2005). The year selected for this study is 2004, when MA plans were better established and HMOs were still the dominant form of MA plan option (see Exhibit 1). HMOs were created to provide better care coordination relative to other MA plans (e.g., PPO and PFFS).
Exhibit 1: Geographic Service Area Files: HMO, PFFS, and PPO Plan Enrollments and Shares of Medicare Managed Care
National California Florida New York
Year 2001 2005 2005 2005 2005
Enrollment (in millions)
5.5 5.2 1.2 0.56 0.51
Share of total (%) HMO 99.4 94.0 99.9 98.3 96.5 PFFS 0.3 2.7 0.1 0.1 0.5 All PPO 0.3 3.3 0.0 1.6 2.9
SOURCE: Estimated from Geographic Service Area Files, Center for Medicare and Medicaid Services
The performance of MA plans in comparison to FFS Medicare is measured in terms of two aspects—providing better quality primary care, as well as providing improved referrals for specialty procedures. We study these two aspects of MA plans, because the improved care coordination and gate keeping function featured in these plans could potentially facilitate both. The quality of primary care is defined as lowering the relative risk of ambulatory care sensitive condition (ACSC) or preventable hospital admissions. Managed care plans can directly reduce preventable hospitalizations by increasing the availability of primary and preventive care services to their constituents. Thus, a lower rate of preventable hospitalization has been proposed as an indicator of better health plan performance (Blustein, Hanson, & Shea, 1998 ; Kruzikas, et al., 2000). Several prior studies used these indicators to evaluate Medicaid and commercial managed care models (Friedman & Basu, 2001; Backus, Moron, Bacchetti, Baker, & Bindman, 2002; Long & Coughlin, 2001; Basu, Friedman, & Burstin, 2004). Nevertheless, apart from one recent study (Basu & Mobley, 2007), the role of Medicare managed care in preventable hospitalization patterns remains understudied.
The referral pattern in Medicare managed care plans, likewise, has also not been well studied; however, there has been some research done for commercial managed care (Franks &

MMRR 2012: Volume 2 (1)
Basu, J., Mobley, L.R. E4
Clancy, 1997; Basu & Clancy, 2001). Fournier and McInnes (2002) note that the incentive system for specialty referrals in managed care could work in alternative ways. Under some forms of managed care (the HMO models, which dominate the MA plans during our period of study), patients only see a specialist after obtaining a referral from their primary care provider and may face limitations in choice because the MA plan primary physician's referral list is limited to those specialists under contract with the plan. On the other hand, the managed care organization may also facilitate more referrals to quality specialists by serving as a “clearinghouse for information,” allowing the plan to make better informed choices than any single physician (Fournier & McInnes, 2002).
Following previous research, we use admissions for referral-sensitive conditions as indicators of referral patterns in this study. Admissions for referral-sensitive conditions are high-tech discretionary procedures, usually needing referrals from primary care providers to specialists, and these admissions were hypothesized to associate positively with the availability of primary care (Basu, Friedman, & Burstin, 2002; Billings et al., 1993). These conditions were chosen for evaluation since the specialty referral pattern in HMOs is a controversial issue with insufficient evidence, especially for the Medicare HMOs. These two admission types are selected for comparison, because previous research showed that these subsets of admissions have sharp differences, in the hypotheses, about the likely effects of primary care (Basu et al., 2002).
The analytical approach we take determines the likely impact of MA plans by comparing across three groups of admissions, a design not previously used to study the performance of MA plans. We compare the preventable (or ACSC) admissions and the referral-sensitive admissions with a stable benchmark: marker admissions, which is a group of conditions urgent in nature and not preventable within prior weeks by ambulatory care. The three-way comparison provides a general framework to assess the impact of specific hypotheses and is a potential improvement over comparing ACSC, or referral-sensitive admissions, with ‘all other’ admissions (Basu et al., 2002) or with a specific group of marker admissions. We made the comparisons using the multinomial logit models, which estimate the parameters of three types of admissions simultaneously, a method expected to improve the efficiency in estimation (described later). We also address the issue of positive selection bias (healthier enrollees in managed care plans) in this study, using control for the potential confounding from selection bias, which has been found important in previous studies (Mello, Stearns, & Norton, 2002; Mello, Stearns, Norton, & Ricketts, 2003; Call, Dowd, Feldman, & Maciejewski, 1999). Finally, we use primary care service area (PCSA) markets (rather than larger, more heterogeneous, counties) to define most of the contextual variables.
PCSAs are based on Medicare FFS patient flows to primary care physicians’ offices, and represent geographic approximations of markets for primary care services received by the elderly (Goodman et al., 2003). We assume that these areas are the best approximation of the service areas in which the Medicare beneficiaries travel to receive ambulatory care, and these regions have been validated in previous research on elderly access to preventive care services
MMRR 2012: Volume 2 (1)
Basu, J., Mobley, L.R. E5
(Goodman et al., 2003 & Mobley, Root, Anselin, Garcia, & Koschinsky, 2006). Since managed care is expected to improve outcomes through better availability of primary and preventive care in the healthcare market, an areal unit that reflects a primary care market is appropriate. PCSAs are generally smaller and internally less heterogeneous than counties.
Design and Hypotheses
We use a multivariate cross sectional design with individual admission as the unit of analysis. Each state is modeled separately, because of differences in socio-demographic and geographic factors, the insurance market, and Medicare managed care factors. Hospitalization for ACSC conditions are compared with marker conditions and referral-sensitive conditions. Because beneficiaries in managed care plans could potentially get better care coordination and provision of preventive care, insurance coverage through managed care could likely affect both ACSC and referral-sensitive admissions. Previous studies have reported lower rates of preventable admissions (Basu et al., 2004; Basu & Mobley, 2007) for HMO enrollees and higher referral rates for patients in managed care than those in indemnity plans (Franks & Clancy 1997; Forrest & Reid, 1997). Previous research on adults (Basu & Clancy, 2001) also reported that commercial managed care plan enrollees are admitted more frequently for referral-sensitive than for marker conditions compared to FFS enrollees. More recent work (Basu & Mobley, 2008) found that Medicare HMO patients in 2001 had statistically significant and higher odds of hip/joint replacement admissions than did Medicare FFS patients in New York and Pennsylvania. The study noted that both Medicare HMO and private HMO patients were more apt to utilize the referral-sensitive procedures than Medicare FFS patients, despite the general HMO backlash during this period.
In this paper, we provide a comparison across different admission types, using marker admissions as the control group since they were chosen as nondiscretionary and mostly not preventable by primary care in the recent past. The referral-sensitive admissions are compared to the benchmark set of marker admissions, as are the ACSC admissions. The main hypotheses of the study are (a) compared to marker admissions, MA plans will be associated with reductions in preventable hospital admissions and, (b) compared to marker admissions, MA plans will be associated with increased referral-sensitive admissions. The multivariate approach used in this study therefore uses three subsets of conditions: ACSC, referral-sensitive, and marker. Because of their urgent nature, marker admissions are less likely to be related to health system factors and behavioral influences by patients and physicians. Our approach, therefore, allows us to implicitly standardize for unmeasurable behavioral factors, while controlling statistically for other demand and supply factors that may help explain these utilization patterns (Basu & Mobley, 2008). The use of ACSC, marker, and referral-sensitive admissions to assess quality of primary care has been validated in previous research (Basu et al., 2002; Billings et al., 1993; Basu & Clancy, 2001). We use these three mutually exclusive groups to conduct a simultaneous test of different effects of the same independent variable on different aggregations

MMRR 2012: Volume 2 (1)
Basu, J., Mobley, L.R. E6
of conditions, following Basu, Friedman, and Burstin (2002). The conditions were defined by principal diagnoses codes from the International Classification of Diseases, Ninth revision. These three groupings of conditions are defined on the basis of past research by Billings et al., (1993). The Billings team developed a diagnostic framework for analyzing hospital use patterns based on the recommendations of a medical advisory panel. The diseases and conditions associated with these three admission categories are listed in Exhibit 2.
Exhibit 2: Preventable, Marker, and Referral-sensitive Admissions
Preventable Hospitalizations (PH)
Marker Condition Hospitalizations (marker)
Referral-sensitive Hospitalizations (RS)
Preventable by primary care Urgent, insensitive to primary care Discretionary, needs PCP referral, could increase with better primary care access but may increase in the outpatient, rather than the inpatient setting
Defined by diagnoses codes at the ICD-9-CM level*
Defined by diagnoses codes at the ICD-9-CM level*
Procedures defined by diagnoses codes at ICD-9-CM level*
Severe ENT infections, COPD, Tuberculosis, Hypertension, Diabetes, Cellulitis, Convulsions, Gastroenteritis, Hypoglycemia, kidney infection, UTI, Asthma, Dehydration, Angina, CHF, PID, Nutritional deficiencies, Certain dental conditions
appendicitis with fracture of hip/femur, appendectomy, acute MI, gastrointestinal obstruction,
Hip/Joint replacement, breast reconstruction, pacemaker insertion, organ/bone marrow transplant, CABG, coronary angioplasty
* Billings, Zeitel, Lukomnik, Carey, Blank and Newman, 1993 SOURCE: Personal communication with John Billings, 1998
The following hypothesized relative risk relationships are tested:
A VS. B H0
(ACSC vs. marker) MA VS. (ACSC vs. marker) FFS
A < B
(R-S vs. marker) MA VS. (R-S vs. marker) FFS A > B
We use multinomial logit models to test these hypotheses. We make a simultaneous estimation of the likelihood of association of MA versus FFS status with three types of admissions. The simultaneous estimation allows us to test for statistically significant differences in the effect estimates. The model also allows estimation of all parameters relative to a common

MMRR 2012: Volume 2 (1)
Basu, J., Mobley, L.R. E7
denominator, so that meaningful comparisons can be made. Simultaneous estimation improves efficiency and enhances the statistical power necessary to detect significant associations (Basu et al., 2002; Greene, 1993). The parameters are estimated using the maximum likelihood method in the STATA (STATA, version 8.0) software package, using established strategies including the allowance for correlated errors (clustering) within the area of residence.
The multinomial method requires that the admission types be mutually exclusive. The scope of this study was therefore limited to mutually exclusive admission categories that were created based on clinical analysis in a previous study (Basu et al., 2002). That is, all cases that included a marker condition type were assigned to marker conditions, since it appeared to be the primary reason for hospitalization. For example, hip fracture (a marker condition) followed by hip/joint replacement (a referral-sensitive condition) was assigned to marker condition. The few cases with both ACSC and referral sensitive did not appear to represent any particular admission types and were dropped.
The outcome in the multinomial model is measured by Relative Risk Ratios (RRR). These ratios indicates how relative risk of a particular admission type changes with the MA versus FFS status, compared to the comparison admission type group. We hold marker admission as the comparison group for its assumed neutrality to primary care and compare both preventable and referral-sensitive admissions with respect to marker.
To control for potential selection bias affecting relative health outcomes for MA plan and FFS enrollees, we use an instrumental variables approach and treat insurance choice as an endogenous variable. However, because CMS developed better risk-adjustment methods for capitated plan payment rates over this period, we expect that any observed favorable selection bias by managed care plans (of healthier, less costly patients) might have been attenuated over time. To the extent that favorable selection occurs in these markets, controlling for it is necessary for valid empirical results. Although we control well for disease severity at the patient level, there is still the possibility that managed care plans selected healthier patients, which would appear as lower ACSC rates/higher preventive care quality for patients in managed care plans.
Conceptual model for covariates
The multivariate model includes several patient level and community level variables, some of which have been identified as important control variables in previous studies (Basu et al., 2004; Basu & Mobley 2007). In this study, we include additional variables found important in more recent studies (cited below) to arrive at an expanded list of covariates. The hypotheses for covariates arise from the assumptions of the determinants of supply and demand for primary or specialty care. Some of the patient factors affecting the demand for outpatient care, and hence (inversely) the hospitalization for ACSC conditions, include poverty, public and private insurance (Weissman, Gatsonis, & Epstein, 1992; Billings et al., 1993), race/ethnicity, and disease complexity (Basu & Mobley, 2007). Race/ethnicity is grouped in three mutually exclusive

MMRR 2012: Volume 2 (1)
Basu, J., Mobley, L.R. E8
categories: white (non-Hispanic) and other (representing a mixture of different ethnic groups), African American (non-Hispanic), and Hispanic. Insurance status reflects whether the patient has traditional FFS Medicare (with no restrictions on provider choice) or an MA plan (which in the HMO form does restrict choice of providers). We partially measure patient disease complexity by source of admission as well as by a direct measure of severity. We calculate the direct measure of patient severity by using a variable called Resource Demand Scale (RDSCALE), which is a later development of the Disease Staging System by Medstat, Inc. (Coffey & Goldfarb, 1986). We considered three major sources of admissions: admission from emergency rooms, transfer from another facility, and all others. Emergency and transfer admissions indicate a relatively high severity of illness. Other indirect severity measures include the teaching status of the patient’s hospital and the distance from the patient’s home to the admitting hospital, both associated with higher severity.
Besides patient factors, we consider a set of community-level variables, including socioeconomic environment, community resource supplies, and other contextual variables. The socioeconomic environment is indicated by average household income at the patient’s ZIP Code level. Since administrative databases do not record a patient’s income, this variable also provides an ecological approximation to individual income. Community resource supplies include primary care physicians, specialists, inpatient and outpatient capacity, and resources in underserved/rural areas. These factors were found to be associated with ACSC admissions in previous research (Mobley et al., 2006; Krakauer, Jacoby, Millman, & Lukomnik, 1996; Parchman & Culler, 1994; Homer et al., 1996; Folland, Goodman, & Stano, 1997). A greater availability of primary care physicians, all else equal, would tend to increase the convenience of primary care and make primary care more accessible, while it could lead to more referral to specialists and hence more referral-sensitive admissions (Basu et al., 2002). Higher local hospital inpatient capacity would, on the other hand, lower the average cost of inpatient vs. primary care and could increase ACSC admissions (Folland et al., 1997). The specialist concentration in an area could affect both ACSC and referral-sensitive admissions, as some specialists do provide primary care, and a low supply of specialists serves as a possible barrier for referral where minorities live (Schulz, Williams, Israel, & Lempert, 2002). More recent studies have found resource supplies in rural areas, for example, availability of critical access hospitals and availability of international medical graduates (IMGs), both being important determinants of variability in ACSC admissions and both affecting access to preventive care. The IMGs have been disproportionately located in counties of greatest need and were found to be associated with improved access to preventive services (Mobley et al., 2006). Marker admissions are not expected to be related to primary care or specialty care.
In this study, we use primary care physician supply variables developed by Health Resources and Services Administration (HRSA) from ZIP Code identified American Medical Association Data (http://datawarehouse.hrsa.gov). We used the HRSA-provided physician variables defined at the PCSA level to construct a single index, combining primary care

MMRR 2012: Volume 2 (1)
Basu, J., Mobley, L.R. E9
physicians and specialists per 1,000 people in a patient’s PCSA. We created this combined index because some specialists do provide primary care, but we assign less weight (1/10) to specialists than to primary care physicians (9/10). In addition, we use a variable indicating specialist availability in the county (since a specialist serves a broader region) to serve as a predictor specifically for referral-sensitive admissions. This variable is provided in the Area Resource File, defined as numbers of office based specialists per thousand people in the county. We also include an overall inpatient hospital capacity variable, total inpatient days (all admissions) per capita in the patient’s PCSA, provided by HRSA. A measure of outpatient utilization also from HRSA (a combined index showing outpatient visits from doctors’ offices and clinics, expressed per Medicare beneficiary) is included as a general indicator of demand for ambulatory care in the community. Using Critical Access Hospital (CAH) address data, CAH availability was calculated as a binary variable with a value of 1 if the CAH was located within the patient’s residential PCSA or within 15 miles of its border, and zero otherwise. This method allows for the fact that hospitals serve a wider geographic area than physicians. The IMG ratio was calculated from HRSA data as the ratio of generalist and specialist IMGs to the primary care physician supply described above.
Among contextual factors, we consider those that reflect both isolation (rural nature) and congestion (density), allowing for assessment of the independent effects of other community and resource variables. In addition, we include an index of market competition to indicate the market power of the Medicare managed care plans in different states. Studies have found area characteristics, such as degree of remoteness and rural/urban residence, to be positively associated (Mobley et al., 2006; Ansari, Laditka, & Laditka, 2006), and population density to be negatively associated, with ACSC admissions (Schreiber & Zielinsky, 1997). We characterize the urban and isolation levels of residential areas using population density and the proportion of the PCSA population living in rural census tracts, both calculated from U.S. Census ZIP Code Tabulation Area (ZCTA) data, aggregated to the PCSA level using HRSA’s ZCTA to PCSA crosswalk. Population density was calculated as thousands of total population per square mile land area. The competition index in the Medicare managed care market for 2004 is derived from the Herfindahl-Hirschman Index (HHI) by county.
Data Sources
We use patient level discharge data for ACSCs, marker conditions, and referral-sensitive conditions. Information on inpatient hospital discharges during 2004 was drawn from the complete hospital discharge files for three states: New York, California, and Florida, using Healthcare Cost and Utilization Project (HCUP) State Inpatient Database (SID) of the Agency for Healthcare Research and Quality (AHRQ, 2004). To create the analytical file, the patient-level information obtained from discharge data for hospitals of these states was linked to PCSA-level contextual variables through the PCSA location of patients. To assign the patient’s PCSA, we used the discharge data to link patient ZIP Codes to ZCTA, employing the method of
MMRR 2012: Volume 2 (1)
Basu, J., Mobley, L.R. E10
assigning the ZIP Code to a ZCTA if its geographic centroid was located inside the ZCTA boundary. We then used HRSA’s ZCTA to PCSA crosswalk to assign the patients to a PCSA. The PCSA area shape files and associated data are provided by HRSA (http://datawarehouse.hrsa.gov/pcsa.aspx) along with other variables, aggregated to the PCSA level of geography, including demographic and socio-economic data obtained from the U.S. Census Bureau and provider supply data from the American Medical Association and the American Osteopathic Association. Critical Access Hospital locations were provided by the Rural Assistance Center (http://www.raconline.org/info_guides/hospitals/cahfaq.php).
We use patient level indicators for MA plan or traditional Medicare FFS enrollment as recorded in the confidential versions of the discharge database for the three states (MA and FFS payment categories are not distinguished in the public use files). MA plans include all managed care plan types (HMO, PPO, PFFS); we are not able to distinguish among them. However, as shown in Exhibit 1 above—the traditional HMO was the dominant form of MA plans through 2005. In New York and Florida, Medicare managed care includes both HMO and PPO in 2005, while California had no PPOs for the elderly.
Findings
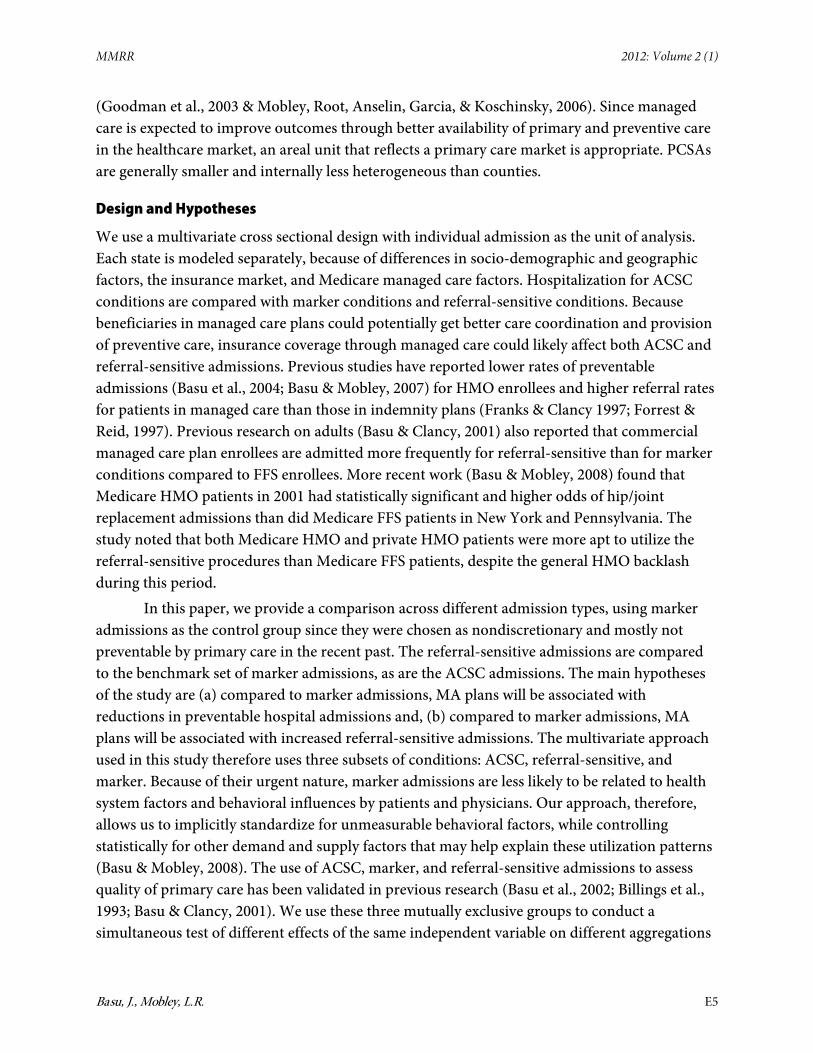
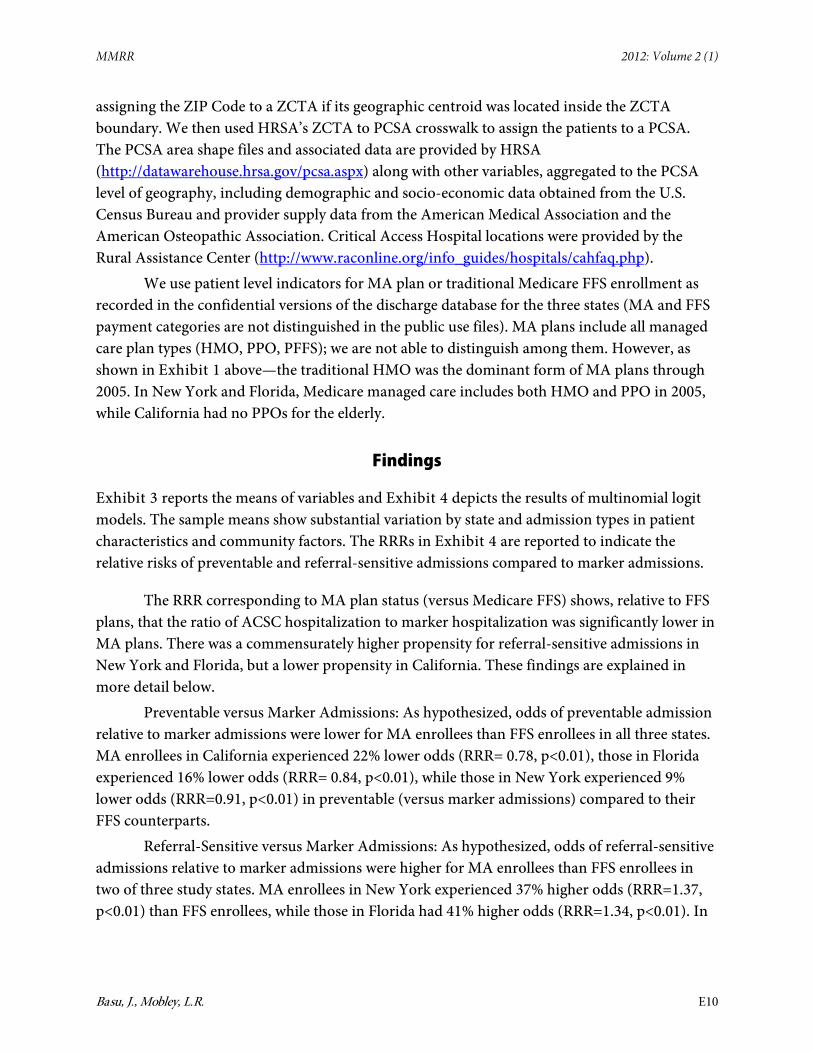
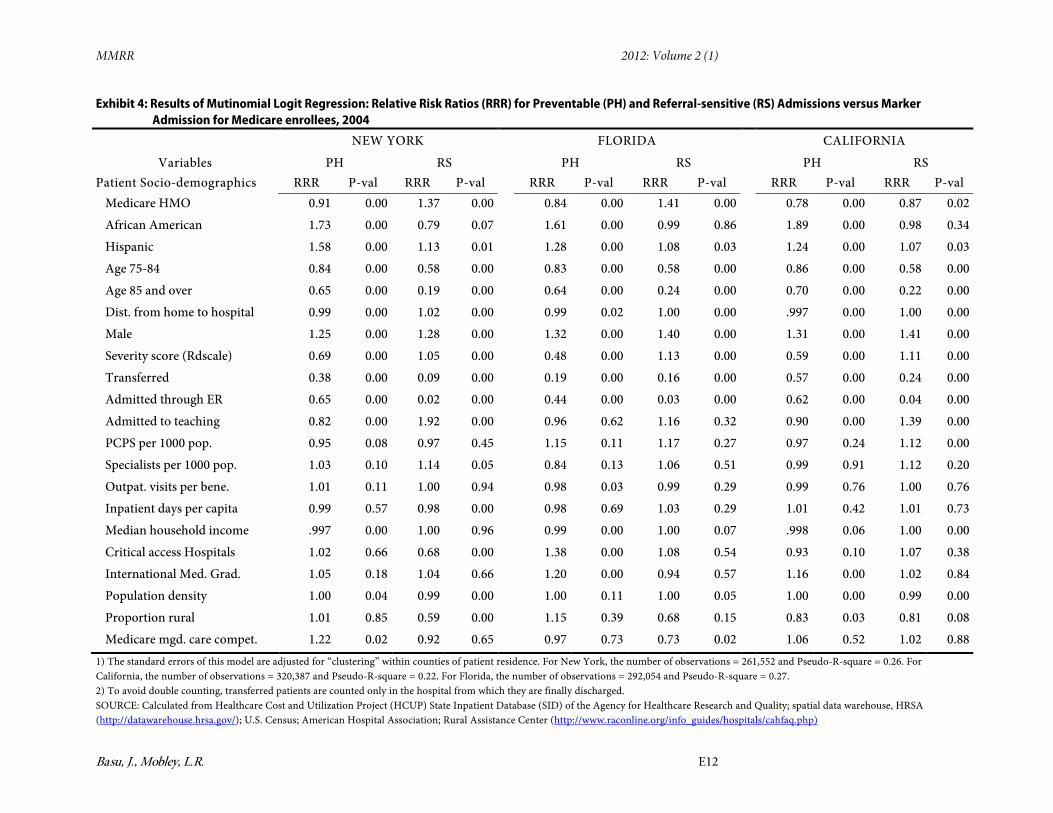
Exhibit 3 reports the means of variables and Exhibit 4 depicts the results of multinomial logit models. The sample means show substantial variation by state and admission types in patient characteristics and community factors. The RRRs in Exhibit 4 are reported to indicate the relative risks of preventable and referral-sensitive admissions compared to marker admissions.
The RRR corresponding to MA plan status (versus Medicare FFS) shows, relative to FFS plans, that the ratio of ACSC hospitalization to marker hospitalization was significantly lower in MA plans. There was a commensurately higher propensity for referral-sensitive admissions in New York and Florida, but a lower propensity in California. These findings are explained in more detail below.
Preventable versus Marker Admissions: As hypothesized, odds of preventable admission relative to marker admissions were lower for MA enrollees than FFS enrollees in all three states. MA enrollees in California experienced 22% lower odds (RRR= 0.78, p<0.01), those in Florida experienced 16% lower odds (RRR= 0.84, p<0.01), while those in New York experienced 9% lower odds (RRR=0.91, p<0.01) in preventable (versus marker admissions) compared to their FFS counterparts.
Referral-Sensitive versus Marker Admissions: As hypothesized, odds of referral-sensitive admissions relative to marker admissions were higher for MA enrollees than FFS enrollees in two of three study states. MA enrollees in New York experienced 37% higher odds (RRR=1.37, p<0.01) than FFS enrollees, while those in Florida had 41% higher odds (RRR=1.34, p<0.01). In
MMRR 2012: Volume 2 (1)
Basu, J., Mobley, L.R. E11
contrast, MA enrollees in California had 13% lower odds (RRR=0.87, p<0.01) of referral-sensitive admissions (versus marker admissions) than FFS enrollees.
Exhibit 3: Sample Size and Means of Predictors used in the Regression Models, by State and Admission Type, 2004 NEW YORK FLORIDA CALIFORNIA PH RS Marker PH RS Marker PH RS Marker Observations 186,005 43,425 37,219 198,566 71,385 43,928 233,628 72,141 50,401
Patient Socio-demographics
Medicare Advantage 0.13 0.16 0.13 0.14 0.14 0.15 0.27 0.28 0.31 African American 0.13 0.06 0.07 0.10 0.05 0.06 0.08 0.03 0.04 Hispanic 0.07 0.04 0.04 0.11 0.06 0.09 0.14 0.11 0.10 Age 75-84 0.42 0.42 0.41 0.43 0.43 0.43 0.43 0.43 0.43 Age 85 and over 0.30 0.08 0.37 0.27 0.09 0.33 0.28 0.10 0.33 Male 0.38 0.47 0.35 0.42 0.51 0.38 0.41 0.48 0.36 Distance from home to hospital
5.24 12.63 6.63 7.55 13.33 8.35 8.03 14.76 9.67
Severity score (Rdscale)
1.19 2.19 1.90 1.21 2.26 1.98 1.28 2.24 1.96
Transferred 0.05 0.10 0.10 0.01 0.07 0.04 0.08 0.13 0.09 Admitted through ER 0.83 0.15 0.82 0.81 0.19 0.87 0.75 0.17 0.80 Admitted to teaching 0.37 0.56 0.38 0.06 0.11 0.07 0.07 0.12 0.07
Community Factors
PCPS per 1000 pop. 0.84 0.86 0.87 0.76 0.77 0.77 0.71 0.74 0.73 Specialists per 1000 pop.
1.49 1.53 1.49 1.12 1.11 1.14 1.06 1.04 1.05
Outpatient visits per beneficiary
8.86 8.89 8.90 11.12 11.03 11.14 11.22 11.07 11.07
Inpatient days per capita
1.38 1.29 1.37 0.90 0.87 0.90 0.73 0.73 0.73
Median household income (in ‘000 $)
49.95 54.73 52.78 41.80 44.15 42.95 53.71 57.64 55.91
Critical access Hospitals
0.10 0.10 0.10 0.11 0.08 0.08 0.13 0.14 0.14
International Medical Graduates
1.29 1.21 1.24 0.95 0.88 0.92 0.74 0.68 0.70
Population density 16,279 12,248 13,003 1,584 1,347 1,592 4,162 3,155 3,466 Proportion rural 0.13 0.15 0.14 0.11 0.12 0.11 0.06 0.08 0.07 Medicare managed care competition
0.51 0.56 0.53 0.44 0.38 0.43 0.58 0.54 0.56
SOURCE: Calculated from Healthcare Cost and Utilization Project (HCUP) State Inpatient Database (SID) of the Agency for Healthcare Research and Quality; spatial data warehouse, HRSA (http://datawarehouse.hrsa.gov/) ; US Census; American Hospital Association; Rural Assistance Center (http://www.raconline.org/info_guides/hospitals/cahfaq.php
MMRR 2012: Volume 2 (1)
Basu, J., Mobley, L.R. E12
Exhibit 4: Results of Mutinomial Logit Regression: Relative Risk Ratios (RRR) for Preventable (PH) and Referral-sensitive (RS) Admissions versus Marker Admission for Medicare enrollees, 2004
NEW YORK FLORIDA CALIFORNIA
Variables PH RS PH RS PH RS Patient Socio-demographics RRR P-val RRR P-val RRR P-val RRR P-val RRR P-val RRR P-val
Medicare HMO 0.91 0.00 1.37 0.00 0.84 0.00 1.41 0.00 0.78 0.00 0.87 0.02
African American 1.73 0.00 0.79 0.07 1.61 0.00 0.99 0.86 1.89 0.00 0.98 0.34
Hispanic 1.58 0.00 1.13 0.01 1.28 0.00 1.08 0.03 1.24 0.00 1.07 0.03
Age 75-84 0.84 0.00 0.58 0.00 0.83 0.00 0.58 0.00 0.86 0.00 0.58 0.00
Age 85 and over 0.65 0.00 0.19 0.00 0.64 0.00 0.24 0.00 0.70 0.00 0.22 0.00
Dist. from home to hospital 0.99 0.00 1.02 0.00 0.99 0.02 1.00 0.00 .997 0.00 1.00 0.00
Male 1.25 0.00 1.28 0.00 1.32 0.00 1.40 0.00 1.31 0.00 1.41 0.00
Severity score (Rdscale) 0.69 0.00 1.05 0.00 0.48 0.00 1.13 0.00 0.59 0.00 1.11 0.00
Transferred 0.38 0.00 0.09 0.00 0.19 0.00 0.16 0.00 0.57 0.00 0.24 0.00
Admitted through ER 0.65 0.00 0.02 0.00 0.44 0.00 0.03 0.00 0.62 0.00 0.04 0.00
Admitted to teaching 0.82 0.00 1.92 0.00 0.96 0.62 1.16 0.32 0.90 0.00 1.39 0.00
PCPS per 1000 pop. 0.95 0.08 0.97 0.45 1.15 0.11 1.17 0.27 0.97 0.24 1.12 0.00
Specialists per 1000 pop. 1.03 0.10 1.14 0.05 0.84 0.13 1.06 0.51 0.99 0.91 1.12 0.20
Outpat. visits per bene. 1.01 0.11 1.00 0.94 0.98 0.03 0.99 0.29 0.99 0.76 1.00 0.76
Inpatient days per capita 0.99 0.57 0.98 0.00 0.98 0.69 1.03 0.29 1.01 0.42 1.01 0.73
Median household income .997 0.00 1.00 0.96 0.99 0.00 1.00 0.07 .998 0.06 1.00 0.00
Critical access Hospitals 1.02 0.66 0.68 0.00 1.38 0.00 1.08 0.54 0.93 0.10 1.07 0.38
International Med. Grad. 1.05 0.18 1.04 0.66 1.20 0.00 0.94 0.57 1.16 0.00 1.02 0.84
Population density 1.00 0.04 0.99 0.00 1.00 0.11 1.00 0.05 1.00 0.00 0.99 0.00
Proportion rural 1.01 0.85 0.59 0.00 1.15 0.39 0.68 0.15 0.83 0.03 0.81 0.08
Medicare mgd. care compet. 1.22 0.02 0.92 0.65 0.97 0.73 0.73 0.02 1.06 0.52 1.02 0.88 1) The standard errors of this model are adjusted for “clustering” within counties of patient residence. For New York, the number of observations = 261,552 and Pseudo-R-square = 0.26. For California, the number of observations = 320,387 and Pseudo-R-square = 0.22. For Florida, the number of observations = 292,054 and Pseudo-R-square = 0.27. 2) To avoid double counting, transferred patients are counted only in the hospital from which they are finally discharged. SOURCE: Calculated from Healthcare Cost and Utilization Project (HCUP) State Inpatient Database (SID) of the Agency for Healthcare Research and Quality; spatial data warehouse, HRSA (http://datawarehouse.hrsa.gov/); U.S. Census; American Hospital Association; Rural Assistance Center (http://www.raconline.org/info_guides/hospitals/cahfaq.php)
MMRR 2012: Volume 2 (1)
Basu, J., Mobley, L.R. E13
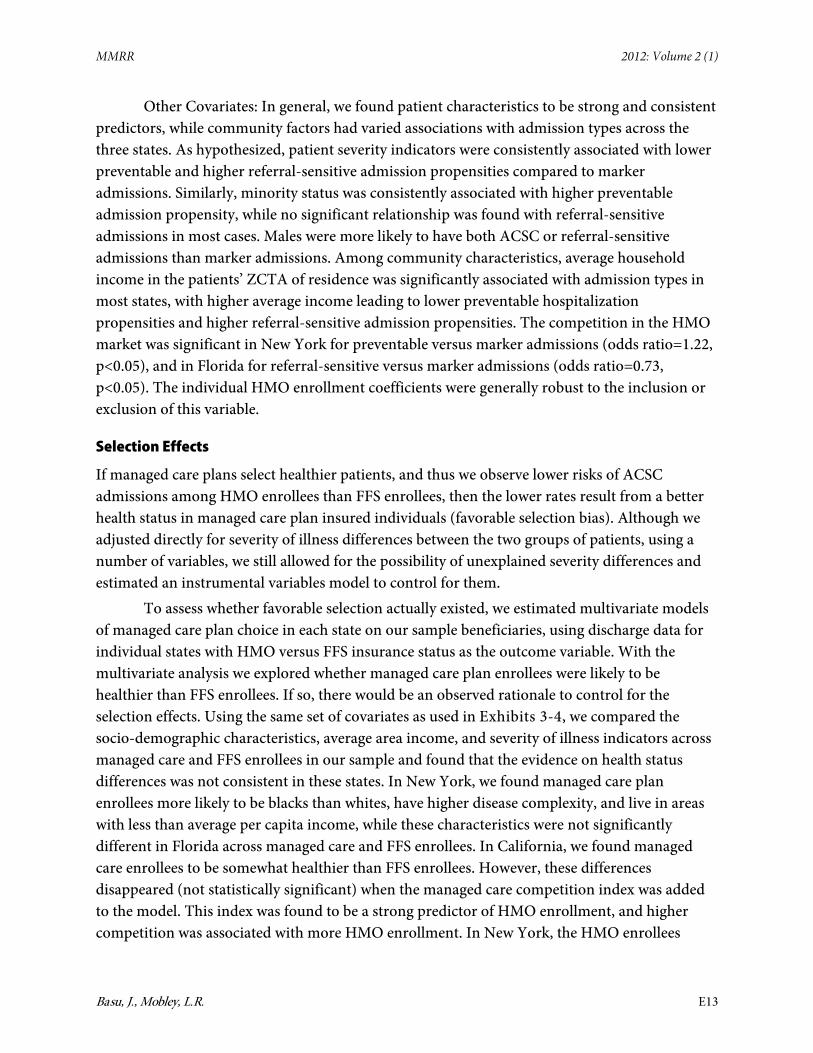
Other Covariates: In general, we found patient characteristics to be strong and consistent predictors, while community factors had varied associations with admission types across the three states. As hypothesized, patient severity indicators were consistently associated with lower preventable and higher referral-sensitive admission propensities compared to marker admissions. Similarly, minority status was consistently associated with higher preventable admission propensity, while no significant relationship was found with referral-sensitive admissions in most cases. Males were more likely to have both ACSC or referral-sensitive admissions than marker admissions. Among community characteristics, average household income in the patients’ ZCTA of residence was significantly associated with admission types in most states, with higher average income leading to lower preventable hospitalization propensities and higher referral-sensitive admission propensities. The competition in the HMO market was significant in New York for preventable versus marker admissions (odds ratio=1.22, p<0.05), and in Florida for referral-sensitive versus marker admissions (odds ratio=0.73, p<0.05). The individual HMO enrollment coefficients were generally robust to the inclusion or exclusion of this variable.
Selection Effects
If managed care plans select healthier patients, and thus we observe lower risks of ACSC admissions among HMO enrollees than FFS enrollees, then the lower rates result from a better health status in managed care plan insured individuals (favorable selection bias). Although we adjusted directly for severity of illness differences between the two groups of patients, using a number of variables, we still allowed for the possibility of unexplained severity differences and estimated an instrumental variables model to control for them.
To assess whether favorable selection actually existed, we estimated multivariate models of managed care plan choice in each state on our sample beneficiaries, using discharge data for individual states with HMO versus FFS insurance status as the outcome variable. With the multivariate analysis we explored whether managed care plan enrollees were likely to be healthier than FFS enrollees. If so, there would be an observed rationale to control for the selection effects. Using the same set of covariates as used in Exhibits 3-4, we compared the socio-demographic characteristics, average area income, and severity of illness indicators across managed care and FFS enrollees in our sample and found that the evidence on health status differences was not consistent in these states. In New York, we found managed care plan enrollees more likely to be blacks than whites, have higher disease complexity, and live in areas with less than average per capita income, while these characteristics were not significantly different in Florida across managed care and FFS enrollees. In California, we found managed care enrollees to be somewhat healthier than FFS enrollees. However, these differences disappeared (not statistically significant) when the managed care competition index was added to the model. This index was found to be a strong predictor of HMO enrollment, and higher competition was associated with more HMO enrollment. In New York, the HMO enrollees
MMRR 2012: Volume 2 (1)
Basu, J., Mobley, L.R. E14
continued to have a higher severity index than FFS enrollees, pointing toward adverse selection into HMOs. The empirical evidence, therefore, does not support the favorable selection effects in MA plans in these states.
All three of our study states had a longer history with Medicare managed care and higher managed care plan penetration than the US average. The three states are among the top ten in terms of Medicare HMO penetration by 2003 (Gold, Achman, Mittler, & Stevens, 2004). Call, Dowd, Feldman, and Maciejewski (1999) found that favorable HMO selection existed at low market penetration, but it declined significantly as the HMO market share increased. Also, as more Medicare managed care plans have begun to offer prescription drug coverage, managed care will be more attractive to chronically ill patients (Mello et al., 2002). These studies suggest that as Medicare managed care markets mature and penetration increases, it is more likely that managed care plans will enroll Medicare beneficiaries whose health is relatively poor.
Despite the absence of consistent evidence that adverse selection would confound our findings, we used Instrumental Variable (IV) analysis to account for potential endogeneity in insurance choice. Different instruments were tested for the individual insurance choice variable (MA plan versus FFS) using standard specification tests (e.g., overidentification tests, IV relevance test, orthogonal tests, and a Hausman test). Two variables, county population size and 2001-2003 average Medicare managed care plan penetration rates in patient’s PCSA, were found to correlate highly with current MA plan choice but not with type of admission. We used the two stage residual insertion (2SRI) method which is suitable for regression models with categorical outcomes (Terza, Basu, & Rathouz, 2008).
Exhibit 5 provides multivariate multinomial logistic regression results with and without control for selection, and shows evidence of negative, not positive, selection. That is, MA plans apparently served enrollees who were sicker than their FFS counterparts. We find that the MA plan enrollees in New York were even less likely (after selection correction) to have preventable admissions relative to marker admission, while more likely to have referral-sensitive admissions relative to marker admission, as compared to their FFS counterparts. Likewise in Florida, selection control resulted in a higher likelihood of referral-sensitive admission relative to marker admission among MA plan enrollees as compared to FFS enrollees. This is as expected, since MA plan enrollees were generally more ill in our sample for these two states than FFS (negative selection). Thus, controlling further for their health status through instrumentation resulted in a greater gap between MA plan and FFS enrollees’ admission propensities than would otherwise be the case. The selection-adjusted results were not significant in California.

MMRR 2012: Volume 2 (1)
Basu, J., Mobley, L.R. E15
Exhibit 5: Results of Selection-adjusted Multinomial Logit Regression: Relative Risk Ratios (RRR) for Preventable and Referral-sensitive Admissions versus Marker Admission for Medicare enrollees, 2004
Medicare Advantage versus Medicare FFS Without Selection Control With Selection Control RRR P-value RRR P-value
NEW YORK
PH/Marker 0.9068 0.000 0.8006 0.014 RS/Marker 1.3681 0.000 1.8733 0.004
FLORIDA
PH/marker 0.8407 0.000 0.8473 0.040 RS/marker 1.4017 0.000 1.6798 0.006
CALIFORNIA
PH/marker 0.7789 0.000 0.8857 0.690 RS/Marker 0.8684 0.024 0.7537 0.106
Note: The standard errors of this model are adjusted for “clustering” within counties of patient residence. SOURCE: Calculated from Healthcare Cost and Utilization Project (HCUP) State Inpatient Database (SID) of the Agency for Healthcare Research and Quality; spatial data warehouse, HRSA (http://datawarehouse.hrsa.gov/) ; US Census; American Hospital Association; Rural Assistance Center (http://www.raconline.org/info_guides/hospitals/cahfaq.php
Discussion
The study shows that MA plans had beneficial impacts in terms of improving quality primary care by reducing preventable hospitalizations. The effects on referral-sensitive admissions varied across states, with New York and Florida demonstrating the hypothesized associations, while California was experiencing reductions in both preventable and referral-sensitive admissions relative to marker for MA enrollees. Several hypotheses can be drawn as explanations for findings in California. First, this could indicate the maturity of MA plans and higher utilization control mechanisms operating in that state. That is, fewer referral-sensitive admissions may have been observed, because specialist referral was provided only in outpatient settings or specialist referral was generally restricted for managed care enrollees. This might be expected, because California had the highest penetration by Medicare managed care and the longest history with managed care. Second, California had the largest number of well-established Medicare HMO plans, having been in operation for 10 years or more (Basu & Mobley, 2007). This history may have conferred a greater propensity for managed care plans to impact medical practice styles in their health markets. If managed care plans have substantial market power, it is possible that they would restrict referral to specialists, reducing the relative rate of referral-sensitive admissions. It should, however, be noted that because our multivariate models control for market competition, the state-specific results are robust to differences in competition, in the HMO market, that could potentially cause variation in HMO referral patterns. It should also be noted that our findings were robust to inclusion or exclusion on the managed care competition

MMRR 2012: Volume 2 (1)
Basu, J., Mobley, L.R. E16
index in the models. Additionally, we also find that the MA plans did not benefit from positive selection of healthier enrollees.
Several limitations of the study should be acknowledged. The three states examined are not fully representative of the entire U.S. population and market conditions. All three have a well-established managed care presence, so the findings should be interpreted in that context. Another limitation is that, although we controlled for potential selection bias in all three states, suitable instruments were not available, especially in California. However, as we argued above, the favorable selection into Medicare MA plans may decline as the MA market matures. Because California had the most mature, highly penetrated managed care market, the possibility of a selection effect biasing our results in California may be small. The empirical evidence also did not indicate the presence of a strong selection effect in our specified models of any state. Finally, we made several severity adjustments to account for possible health status differences between MA and FFS enrollees.
Another potential concern is that marker conditions might not reflect conditions that are perfectly neutral to primary care and preventive care. However, they are believed to be a better control measure than the heterogeneous group of non-preventable admissions (Basu & Mobley, 2007). Finally, we could not fully evaluate in this study the factors that account for differences in different types of admissions across states. In addition to age of managed care penetration, several unmeasured differences across states could likely be important in such comparisons. One such difference could be the availability of public health resources, such as community health centers and other public health clinics, that were found to be associated with lower preventable hospitalizations among low income and elderly populations in medically underserved areas (Epstein, 2001). By controlling for average area income, urban/rural location, and population density at the small area level, we were partially able to account for some of the contextual differences that would be associated with health care infrastructure in different states. Another potential issue could be that significant proportions of Medicare enrollees were dually eligible for Medicare and Medicaid and these subgroups, being sicker and poorer with multiple chronic conditions, could have higher rates of preventable hospitalizations. These beneficiaries were included in the Medicare enrollees under both FFS and MA categories. However, since higher proportions of these patients are likely to be in FFS plans (GAO, 2000), this could have resulted in higher observed rates of preventable hospitalizations among FFS patients than among MA patients. We were not able to use additional controls for the dually eligible group, because data did not permit us to separate them out in California and Florida, the two states with higher MA penetration. However, as pointed out in a previous study (Basu & Mobley, 2007), these populations are expected to be small, and even smaller in HMOs than in FFS (GAO, 2000); therefore, they are not likely to have significantly altered the findings from our study. In addition, we have controlled for severity of illness using various measures, area average income levels, and the selection bias in the MA population.

MMRR 2012: Volume 2 (1)
Basu, J., Mobley, L.R. E17
Conclusion
Using hospital discharge data for 2004, we tested the association of Medicare managed care with two types of hospitalizations. The year 2004 is the ideal time period for this study, because the HMOs dominated the market composition in those three states in that time period, and the purpose of the study was to show the effect of care coordination provided in Medicare HMOs. Our findings indicate that MA plans have added value to the quality of primary care for the elderly by reducing preventable hospitalizations. However, the evidence is mixed as to the specialty referrals provided by MA plans. Our study shows that MA plans have reduced referral-sensitive or discretionary admissions in California, while increasing them in New York and Florida. These findings suggest that maturity of MA plans and higher utilization control mechanisms are probably important for controlling such non-urgent hospital admissions. By highlighting the care management component in Medicare managed care models, the findings of the study contribute to the currently debated policies on Medicare delivery and payment reforms. The findings may have implications for greater use of preventive care advocated for in health reform.
Correspondence Jayasree Basu, M.A., M.B.A, Ph.D., U.S. DHHS, Agency for Healthcare Research and Quality, 540 Gaither Road, Rockville, MD 20850, [email protected], Tel: (301) 427-1579, Fax: (301) 427-1595.
Acknowledgments This research is funded wholly by the authors’ employers, the Agency for Healthcare Research and Quality (AHRQ) and RTI International. The views expressed in this paper are those of the authors. No official endorsement by any agency of the federal government is intended or should be inferred. The authors would like to acknowledge the state data organizations that participate in the HCUP State Inpatient Databases: California Office of Statewide Health Planning & Development; Florida Agency for Health Care Administration; New York State Department of Health. This paper was presented at the 2009 AcademyHealth annual research meeting panel on ‘Medicare Advantage’.

MMRR 2012: Volume 2 (1)
Basu, J., Mobley, L.R. E18
References Agency for Healthcare Research and Quality (AHRQ) (2004). Healthcare Cost and Utilization
Project (HCUP). Rockville, MD. Accessed online December 2005: http://www.hcup-us.ahrq.gov/db/state/siddbdocumentation.jsp
Ansari, Z., Laditka, J. N., & Laditka, S. B. (2006). Access to Health care and Hospitalization for Ambulatory care Sensitive Conditions. Medical Care Research and Review, 63(6), 719–741. PubMed http://dx.doi.org/10.1177/1077558706293637
Backus, L., Moron, M., Bacchetti, P., Baker, L. C., & Bindman, A. B. (2002). Effect of managed care on preventable hospitalization rates in California. Medical Care, 40(4), 315–324. PubMed http://dx.doi.org/10.1097/00005650-200204000-00007
Basu, J., & Clancy, C. (2001). Racial Disparity, Primary Care, and Specialty Referral. Health Services Research, 36(6, pt. II), 64–77. PubMed
Basu, J., Friedman, B., & Burstin, H. (2002). Primary care, HMO enrollment, and hospitalization for ambulatory care sensitive conditions: a new approach. Medical Care, 40(12), 1260–1269. PubMed http://dx.doi.org/10.1097/00005650-200212000-00013
Basu, J., Friedman, B., & Burstin, H. (2004). Managed care and preventable hospitalization among Medicaid adults. Health Services Research, 39(3), 489–510. PubMed http://dx.doi.org/10.1111/j.1475-6773.2004.00241.x
Basu, J., & Mobley, L. R. (2007). Do HMOs reduce Preventable Hospitalizations for Medicare Beneficiaries? Medical Care Research and Review, 64(5), 544–567. PubMed http://dx.doi.org/10.1177/1077558707301955
Basu, J., & Mobley, L. (2008). Racial Disparities in the Elderly for Selected Procedures. Medical Care Research and Review, 65(5), 617–637. PubMed http://dx.doi.org/10.1177/1077558708318284
Billings, J., Zeitel, L., Lukomnik, J., Carey, T. S., Blank, A. E., & Newman, L. (1993). Impact of socioeconomic status on hospital use in New York City. Health Affairs (Project Hope), 12(1), 162–173. PubMed http://dx.doi.org/10.1377/hlthaff.12.1.162
Blustein, J., Hanson, K., & Shea, S. (1998). Preventable Hospitalizations and Socioeconomic Status. Health Affairs, 17(2), 177–189. PubMed http://dx.doi.org/10.1377/hlthaff.17.2.177
Call, K.T., Dowd, T., Feldman, B., & Maciejewski, R. (1999). Selection Experiences in Medicare HMOs: Pre-Enrollment Expenditures. Health Care Financing Review, 20(4), 197–209. PubMed
Coffey, R. M., & Goldfarb, M. G. (1986). DRGs and disease staging for reimbursing Medicare patients. Medical Care, 24(9), 814–829. PubMed http://dx.doi.org/10.1097/00005650-198609000-00003
Epstein, A. J. (2001). The role of public clinics in preventable hospitalizations among vulnerable populations. Health Services Research, 36(2), 405–420. PubMed

MMRR 2012: Volume 2 (1)
Basu, J., Mobley, L.R. E19
Folland, S. A., Goodman, A. C., & Stano, M. (1997). The Economics of Health Care. Second edition, Upper saddle river, NJ: Prentice Hall
Forrest, C. B., & Reid, R. J. (1997). Passing the Baton: HMO’s influence on referrals to specialty care. Health Affairs, 16(6), 157–162. PubMed http://dx.doi.org/10.1377/hlthaff.16.6.157
Fournier, G. M. & McInnes, M. (2002). The Effects of Managed care on Medical Referrals and the Quality of Specialty care. The Journal of Industrial Economics, 50(4), 457–473. http://dx.doi.org/10.1111/1467-6451.00186
Franks, P. & Clancy, C. M. (1997). Referrals of Adult patients from Primary care: Demographic disparities and Their Relationship to HMO Insurance. The Journal of Family Practice, 45(1), 47–53. PubMed
Friedman, B. & Basu, J. (2001). Health insurance, primary care, and preventable hospitalization of children in a large state. The American Journal of Managed Care, 7(5), 473–481. PubMed
Gold, M., Achman, L., Mittler, J., & Stevens, B. (2004). Monitoring Medicare_Choice: What have we learned? Findings and operational lessons for Medicare Advantage. MPR publication no. 8846-200 done under contract no. 43005 for Robert Wood Johnson Foundation. Princeton, NJ: Mathematica Policy Research, Inc.
Goodman, D. C., Mick, S. S., Bott, D., Stukel, T., Chang, C., Marth, N., . . . Carretta, H. J. (2003). Primary care service areas: a new tool for the evaluation of primary care services. Health Services Research, 38(1p1), 287–309. PubMed http://dx.doi.org/10.1111/1475-6773.00116
Government Accoutning Office (GAO) (2000). Medicare and Medicaid: Implementing state demonstrations for dual eligibles has proven challenging. Report to the U.S. Senate Special Committee on Aging. Washington, DC: U.S. General Accounting Office. http://www.gao.gov/new.items/he00094.pdf (accessed April 17, 2007).
Greene, W. H. (1993). Econometric analysis (2nd ed., pp. 666-672). New York: Macmillan. Homer, C. J., Szilagyi, P., Rodewald, L., Bloom, S. R., Greenspan, P., Yazdgerdi, S., . . . Perrin, J.
M. (1996). Does Quality of Care Affect Rates of Hospitalization for Childhood Asthma? Pediatrics, 98(1), 18–23. PubMed
Krakauer, H., Jacoby, I., Millman, M., & Lukomnik, J. E. (1996). Physician Impact on Hospital Admission and on Mortality Rates in the Medicare Population. Health Services Research, 31(2), 191–211. PubMed
Kruzikas, D. T., Jiang, H. J., Remus, D., Barrett, M. L., Coffey, R. M., & Andrews, R. (2000). Preventable Hospitalizations: A Window Into Primary and Preventive Care, 2000. Healthcare Cost and Utilization Project (HCUP) Fact Book No. 5 (AHRQ Publication No. 04-0056). Agency for Healthcare Research and Quality (AHRQ), Rockville, MD.
Long, S. K., & Coughlin, T. A. (2001). Impacts of Medicaid managed care on children. Health Services Research, 36(1 Pt 1), 7–23. PubMed

MMRR 2012: Volume 2 (1)
Basu, J., Mobley, L.R. E20
Mello, M. M., Stearns, S. C., & Norton, E. C. (2002). Do Medicare HMOs still reduce health services use after controlling for selection bias? Health Economics, 11(4), 323–340. PubMed http://dx.doi.org/10.1002/hec.664
Mello, M. M., Stearns, S. C., Norton, E. C., & Ricketts, T. C., III. (2003). Understanding Biased Selection in Medicare HMOs. Health Services Research, 38(3), 961–992. PubMed http://dx.doi.org/10.1111/1475-6773.00156
Mobley, L. R., Root, E. D., Anselin, L., Garcia, N. L., & Koschinsky, J. (2006). Spatial Analysis of Elderly Access to Primary Care Services. International Journal of Health Geographics, 5. http://www.ij-healthgeographics.com/content/5/1/19 PubMed http://dx.doi.org/10.1186/1476-072X-5-19
National Health Policy Forum | www.nhpf.org, November 29, 2005 Parchman, M. L., & Culler, S. (1994). Primary Care Physicians and Avoidable Hospitalization.
The Journal of Family Practice, 39(2), 123–128. PubMed Pizer, S.D., Frakt, A.B., & Feldman, R. (2007) Regional PPOs in Medicare: what are the
prospects? Academy Health, February 2007. Pope, G., Olmsted, E. A., Kautter, J., Mobley, L. R., & Greenwald, L. M. (April 2005). The
Medicare Preferred Provider Organization Demonstration: Plan Offerings and Enrollment. Final Report. Prepared for the Centers for Medicare & Medicaid Services (RTI Project Number 07964.005.007).
Pope, G.C., Greenwald, L. M., Kautter, J., Olmstead, E. A., & Mobley, L. R. (2006). Medicare Preferred Provider Organization Demonstration: Plan Offerings and Beneficiary Enrollment. Health Care Financing Review, 27(3), 95–109. PubMed
Schreiber, S., & Zielinsky, T. (1997). The Meaning of Ambulatory care Sensitive Admissions:urban and rural Perspectives. The Journal of Rural Health, 13(4), 276–284. PubMed http://dx.doi.org/10.1111/j.1748-0361.1997.tb00970.x
Schulz, A. J., Williams, D. R., Israel, B. A., & Lempert, L. B. (2002). Racial and spatial relations as fundamental determinants of health in Detroit. The Milbank Quarterly, 80(4), 677–707. PubMed http://dx.doi.org/10.1111/1468-0009.00028
STATA (Version 8.0) [Computer software]. College Station, TX: StataCorp Terza, J. V., Basu, A., & Rathouz, P. J. (2008). Two-stage residual inclusion estimation:
addressing endogeneity in health econometric modeling. Journal of Health Economics, 27(3), 531–543. Epub 2007 Dec 4 PubMed http://dx.doi.org/10.1016/j.jhealeco.2007.09.009
Weissman, J. S., Gatsonis, C., & Epstein, A. M. (1992). Rates of Avoidable Hospitalization by Insurance Status in Massachusetts and Maryland. Journal of the American Medical Association, 268(17), 2388–2394. PubMed http://dx.doi.org/10.1001/jama.1992.03490170060026

MMRR 2012 Volume 2, Number 1
ISSN: 2159-0354 doi: http://dx.doi.org/10.5600/mmrr.002.01.a02 E21
Medicare & Medicaid Research Review 2012
Volume 2, Number 1
Mission Statement
Medicare & Medicaid Research Review is a peer-reviewed, online journal reporting data and research that informs current and future directions of the Medicare, Medicaid, and Children’s Health Insurance programs. The journal seeks to examine and evaluate health care coverage, quality and access to care for beneficiaries, and payment for
health services.
http://www.cms.gov/MMRR/
U.S. Department of Health & Human Services
Kathleen Sebelius, Secretary
Centers for Medicare & Medicaid Services Marilyn Tavenner
Acting Administrator
Center for Strategic Planning Anthony D. Rodgers,
Deputy Administrator and Director Editor-in-Chief David M. Bott, Ph.D. Senior Editor Cynthia Riegler, M.A.
Editorial Board Gerald S. Adler, M.Phil.
CMS/Center for Strategic Planning Andrew Bindman, M.D.
University of California, San Francisco William J. Buczko, Ph.D.
CMS/Innovation Center Todd Caldis, Ph.D., J.D.
CMS/Office of the Actuary Craig F. Caplan, M.A.
CMS/ Innovation Center Melissa A. Evans, Ph.D.
CMS/Center for Medicare John Hsu, M.D., M.B.A, M.S.C.E.
Harvard Medical School Jesse M. Levy, Ph.D.
CMS/ Innovation Center Jennifer Polinski, Sc.D, M.P.H.
Brigham & Women's Hospital Isidor R. Strauss, F.S.A.
CMS/Office of the Actuary Fred G. Thomas, Ph.D., C.P.A.
CMS/ Innovation Center Robert Weech-Maldonado, Ph.D.
University of Alabama at Birmingham Rashid Bashshur, PhD.
University of Michigan Health System Submission Guidelines: www.cms.gov/MMRR/InformationforAuthors Contact: [email protected]
Published by the Centers for Medicare & Medicaid Services All material in the Medicare & Medicaid Research Review is in the public domain and may be duplicated without permission.
Citation to source is requested.