medication therapy management -...
TRANSCRIPT

Medication Therapy Management
Sample Presentation: Given to Local Employer

Background
The Need for Medication Therapy Management
Prescription drug spending in the United States was $252 billion in 2005
Medicare Part D will add $700 billion over the next 10 years
Prescription drug spending has grown by an average annual rate of 11-15% over the past 5 years
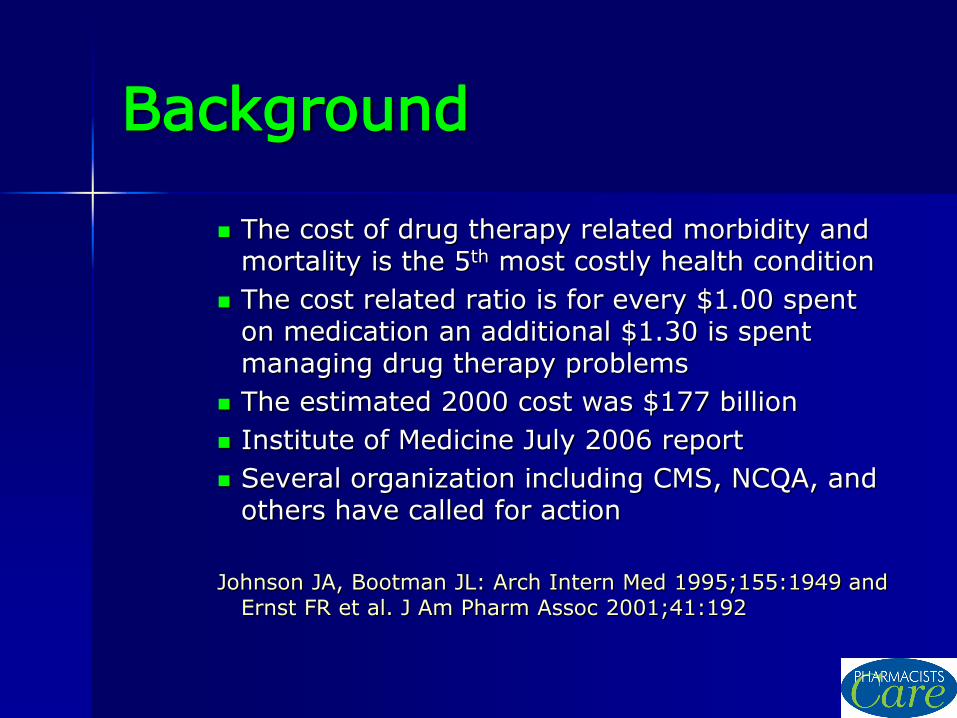
Background
The cost of drug therapy related morbidity and mortality is the 5th most costly health condition
The cost related ratio is for every $1.00 spent on medication an additional $1.30 is spent managing drug therapy problems
The estimated 2000 cost was $177 billion
Institute of Medicine July 2006 report
Several organization including CMS, NCQA, and others have called for action
Johnson JA, Bootman JL: Arch Intern Med 1995;155:1949 and
Ernst FR et al. J Am Pharm Assoc 2001;41:192

COSTS OF DRUG THERAPY PROBLEMS
Total U.S. Costs = $177 billion / year
Physician/Urgent Care Visits $ 14 billion +Added Medications $ 3 billion +Emergency Room Visits $ 6 billion +Hospital Visits $ 121 billion +Long-term Care Stays $ 33 billion
Ernest FR and Grizzle AJ. Drug-Related Morbidity and Mortality: Updating the Cost-of-Illness Model J. APhA 41: March 2001.
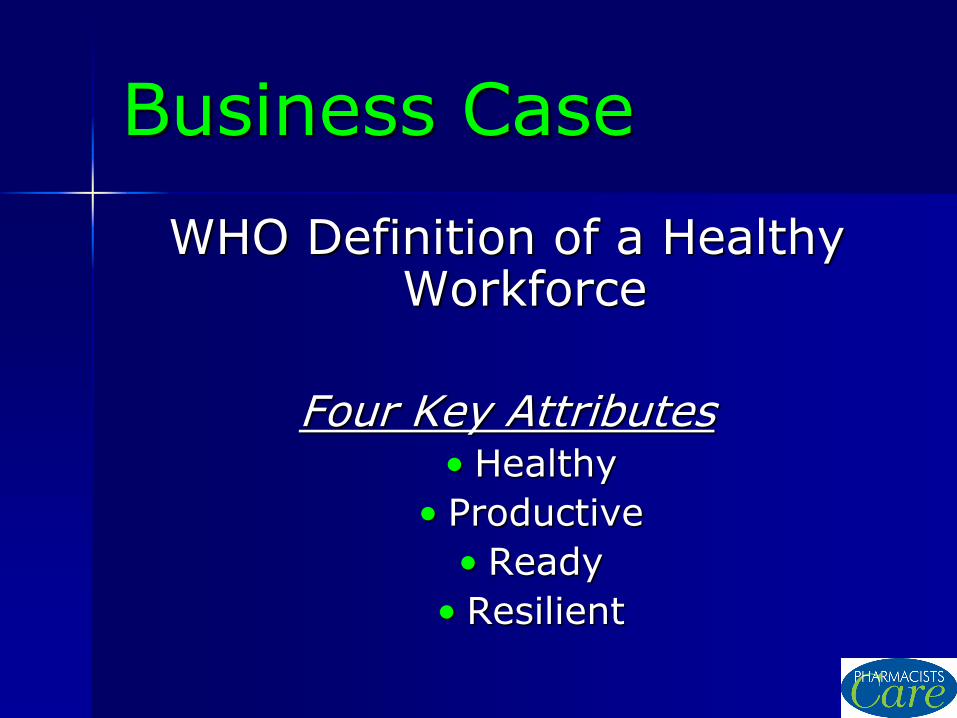
Business Case
WHO Definition of a Healthy Workforce
Four Key Attributes
• Healthy
• Productive
• Ready
• Resilient
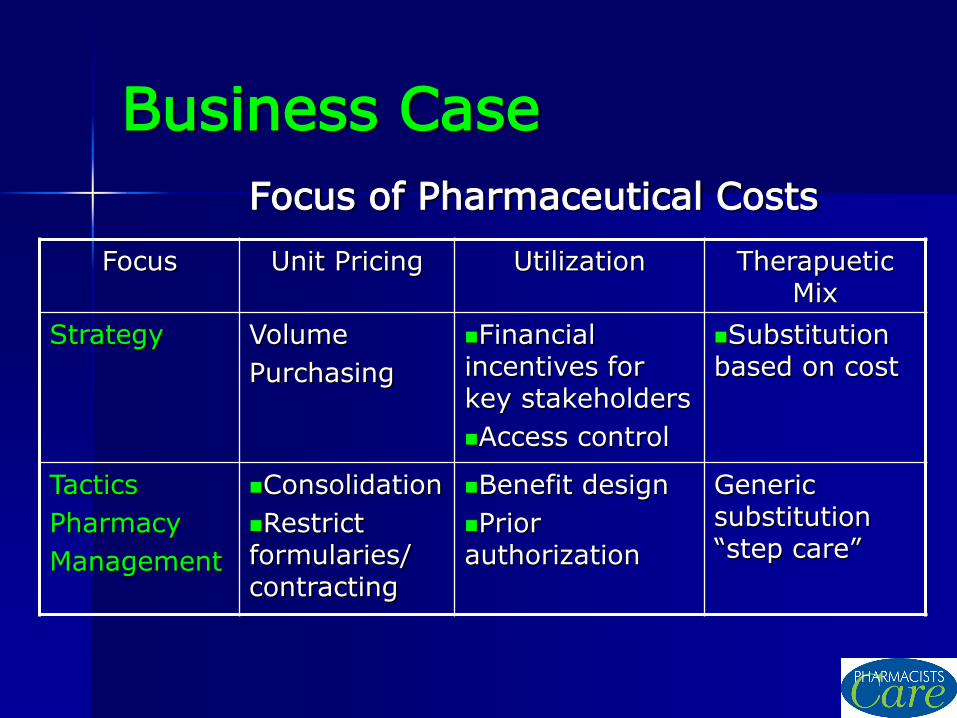
Business Case
Focus of Pharmaceutical Costs
Focus Unit Pricing Utilization Therapuetic Mix
Strategy Volume
Purchasing
Financial incentives for key stakeholders
Access control
Substitution based on cost
Tactics
Pharmacy
Management
Consolidation
Restrict formularies/ contracting
Benefit design
Prior authorization
Generic substitution “step care”

Now Which Way?
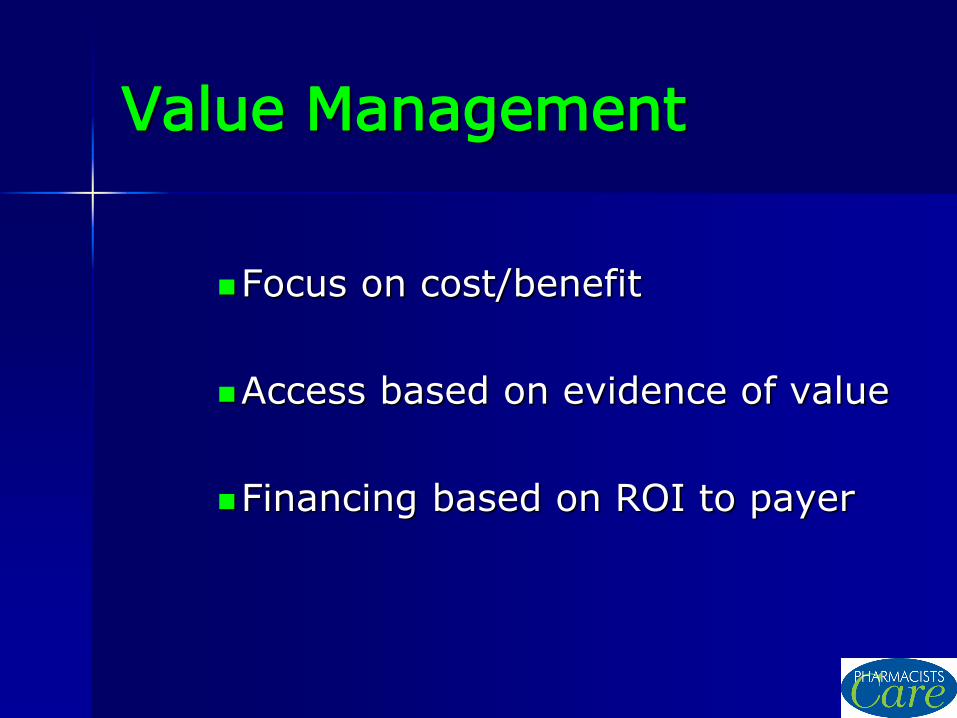
Value Management
Cost Management

Cost Management
Carve out silo management
Focus on unit price
–Ties copayment to acquisition price
Limit access
Value Management
Focus on cost/benefit
Access based on evidence of value
Financing based on ROI to payer

Impact of Health on Productivity
Average Number of Unproductive Hours by Condition in a
Typical 8 Hour Work Day*
Condition Heart Disease 4.3 Respiratory Infection 4.1 Diabetes 4.0 Migraine 3.4 High Blood Pressure 3.4 Arthritis 3.2 Allergies 2.8 High Stress 2.3 Anxiety 2.2 Depression 2.2
On days when affected by the condition/Sample size = 563 Source: Medstat

Value Proposition for a Medication Therapy Management as a Benefit
Proper use of medications can lead to improved health, enhanced quality of life, and increased productivity
Overuse, under-use, and misuse of drugs is linked to reduced health, poor quality of life, and decreased productivity
Clinical pharmacists with advanced training can reduce drug therapy problems and improve health and economic outcomes
Patient-centered MTM services have consistently provided a $4:$1 ROI*
* Sources Wilcox S, Himmelstein D, Wolhander S: JAMA 1994;272:292-296 Col N, Finale J, Kronhom P: Arch Intern Med 1990;150:841-845
Isetts B, Brown L, Schondelmeyer S, Lenarz L: Arch Intern Med 2003;163:1813-1820 Zarowitz B, Stebelsky L, Muma B, Romain T: Pharmacotherapy 2005;25(11):1636-1645
Garrett D, Bluml B: J Am Pharm Assoc 2005;45:130-137 Cranor C, Christensen D: J Am Pharm Assoc 2003;43:160-172
Malone DC et al. Pharmacotherapy 2000;20:1149

Objectives
Transition the perspective of pharmacy benefit to: Enhance employee satisfaction Improve employee performance Improve economic outcomes Change the pharmacy care model to one of
action and prevention not reaction Improve targeting of drug therapy problems Improve health status Establish multi-risk focused interventions for
drug therapy management Develop a framework that is employee-centric Integrate MTM into the mainstream of corporate
health care

MTM Process of Care Overview
Patient-centered
Consistent and systematic processes that:
– Assess all of the patient’s drug-related needs
– Identifies drug therapy problems
– Establishes therapeutic goals
– Designs a medication therapy care plan
– Conducts follow-up visits to evaluate progress
– Communicates information to the patient’s physician or nurse provider in a collaborative practice

Goals
Individualized Establish desired goals of therapy for each
drug and measurement parameters Mutual negotiation with the patient and
health care providers when appropriate Goals are realistic based on patient’s ability Establish timelines Optimize the patients medication therapy
experience Several recommendations of the Institute of Medicine
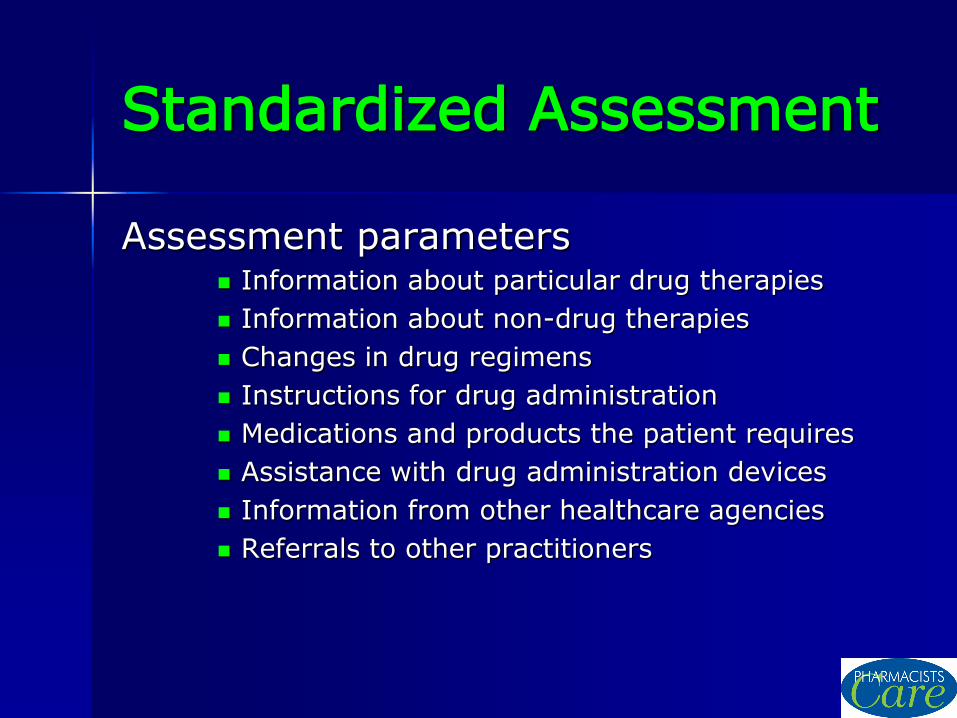
Standardized Assessment
Assessment parameters Information about particular drug therapies
Information about non-drug therapies
Changes in drug regimens
Instructions for drug administration
Medications and products the patient requires
Assistance with drug administration devices
Information from other healthcare agencies
Referrals to other practitioners

Categories of Drug Therapy Problems
Every drug the patient receives undergoes the following evaluation:
Assessment of proper indication
–Is the drug being used unnecessary –Is additional drug therapy needed
Effectiveness of treatment –The current drug therapy is
ineffective –The dose is too low to produce the
desired response

Categories of Drug Therapy Problems
Safety –Is there an adverse drug reaction
present –Is the current drug dosage too high
Convenience –Is the patient adherent to the
therapy –Are there barriers to the patient’s
ability to comply with therapy e.g. physical, financial

Drug Therapy Problems Identified (n=5,136 patients)
Number of Drug
Therapy Problems
% of Drug Therapy Problems
Indication Unnecessary Drug Therapy
Needs Additional Drug Therapy
688
3,246
6%
28%
Effectiveness Ineffectve Drug
Dosage too Low
882
2,328
8%
20%
Safety Adverse Drug Reaction
Dosage too High
1,704
602
14%
5%
Compliance Noncompliance 2,276 19%
TOTAL: 11,726 100% Data from Medication Management Services, Inc.

Experience

The Service Value Proposition
High satisfaction with this care model
95% physician acceptance of care recommendations by pharmacists
Data documented a 50% improvement in patients meeting their therapeutic goals
Positive impact on health system utilization and employee productivity including:
– Reduction in hospitalization / clinic / ER visits
– Identification and resolution of drug therapy problems
– Employee days saved
Example Practice Profile for a Medication Therapy Management Service
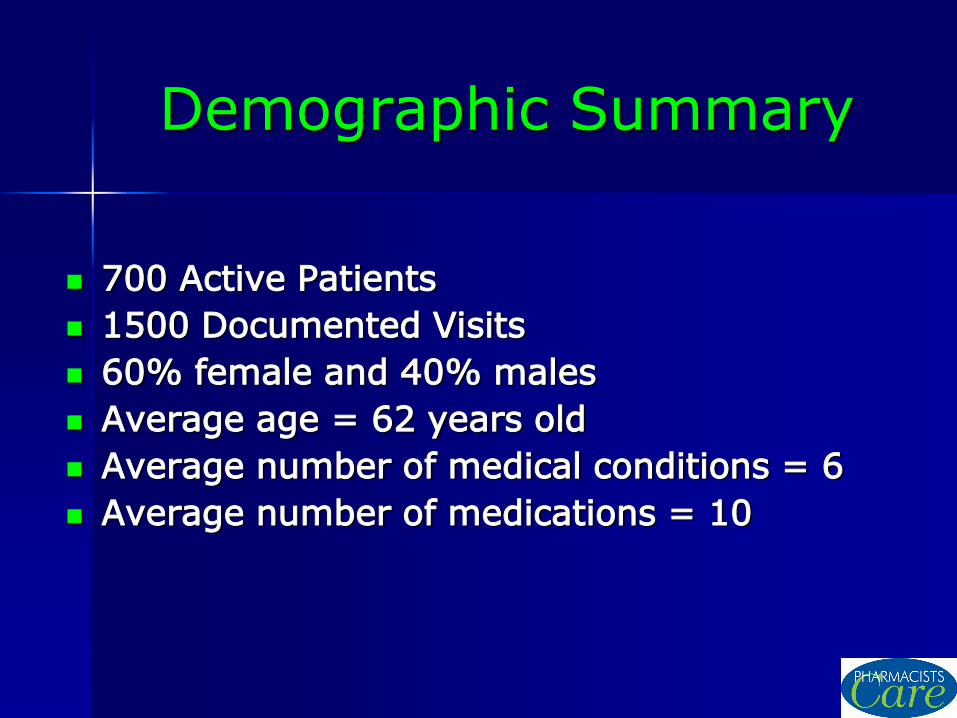
Demographic Summary
700 Active Patients
1500 Documented Visits
60% female and 40% males
Average age = 62 years old
Average number of medical conditions = 6
Average number of medications = 10

The Most Frequent Indications for Drug Therapy in Practice
1. Hypertension
2. Hyperlipidemia
3. Peptic Ulcer Disease
4. Allergic Rhinitis
5. Diabetes
6. Osteoporosis
7. Pain-general
8. Arthritis Pain
9. Prevention MI/Stroke
10. Hypothyroidism
11. Depression
12. Insomnia
These 12 conditions represent 52% of all indications for drug therapy

Sources of Medications
In addition to their prescription medications:
502 patients (72%) were taking 2010
different OTC medications 19 patients were taking 36 different
medications they received from friends or family members
21 patients were also using 43 different sample products to manage their medical conditions

Practice Analysis (n = 700 patients)
724 drug therapy problems were identified and resolved
385 patients (55%) had > 1 drug therapy problem
98 patients (14%) had > 3 drug therapy problems

Drug Therapy Problems Identified
% of Drug Therapy Problems
Indication Unnecessary Drug Therapy
Need Additional Drug Therapy
12%
26%
Effectiveness Ineffective Drug
Dosage too Low
9%
17%
Safety Adverse Drug Reaction
Dosage too High
19%
10%
Compliance Noncompliance 7%
Total Number of Drug Therapy Problems: 724

Ten Most Common Drug Therapy Problems and Associated Medical Conditions
Dosage too low Hypertension Needs additional drug therapy Allergic rhinitis Adverse drug reaction Hypertension Dosage too low Arthritis Pain Adverse drug reaction Arthritis Pain Adverse drug reaction Hyperlipidemia Needed additional drug therapy Depression Dosage too low Allergic rhinitis Needed additional drug therapy Angina pectoris Needed additional drug therapy Esophagitis
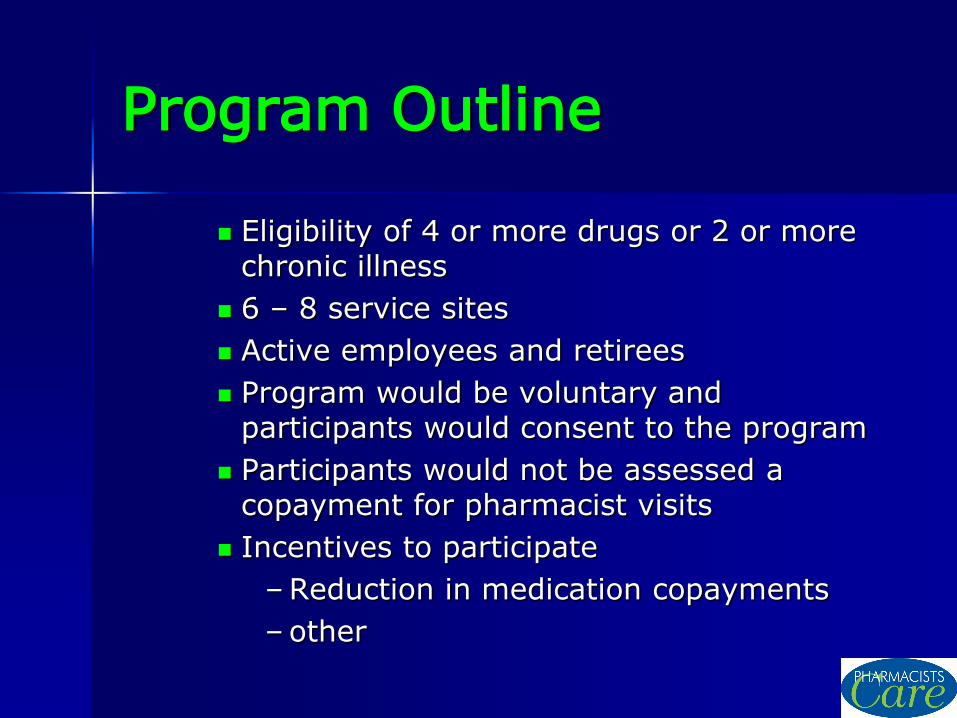
Program Outline
Eligibility of 4 or more drugs or 2 or more chronic illness
6 – 8 service sites
Active employees and retirees
Program would be voluntary and participants would consent to the program
Participants would not be assessed a copayment for pharmacist visits
Incentives to participate
– Reduction in medication copayments
– other
Program Outline
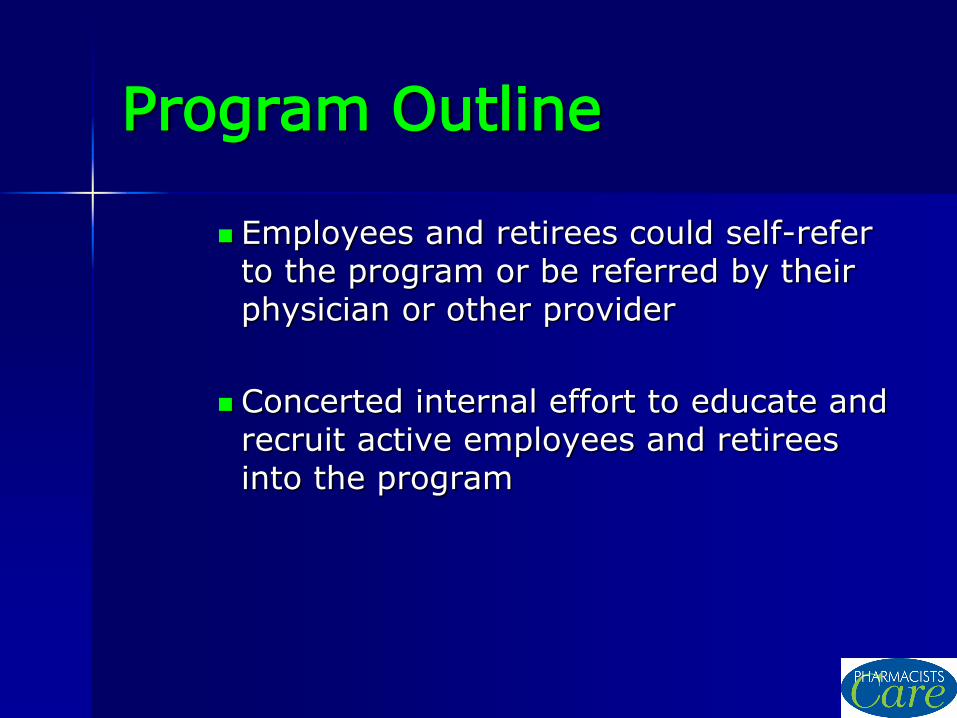
Employees and retirees could self-refer to the program or be referred by their physician or other provider
Concerted internal effort to educate and recruit active employees and retirees into the program
Program Outline
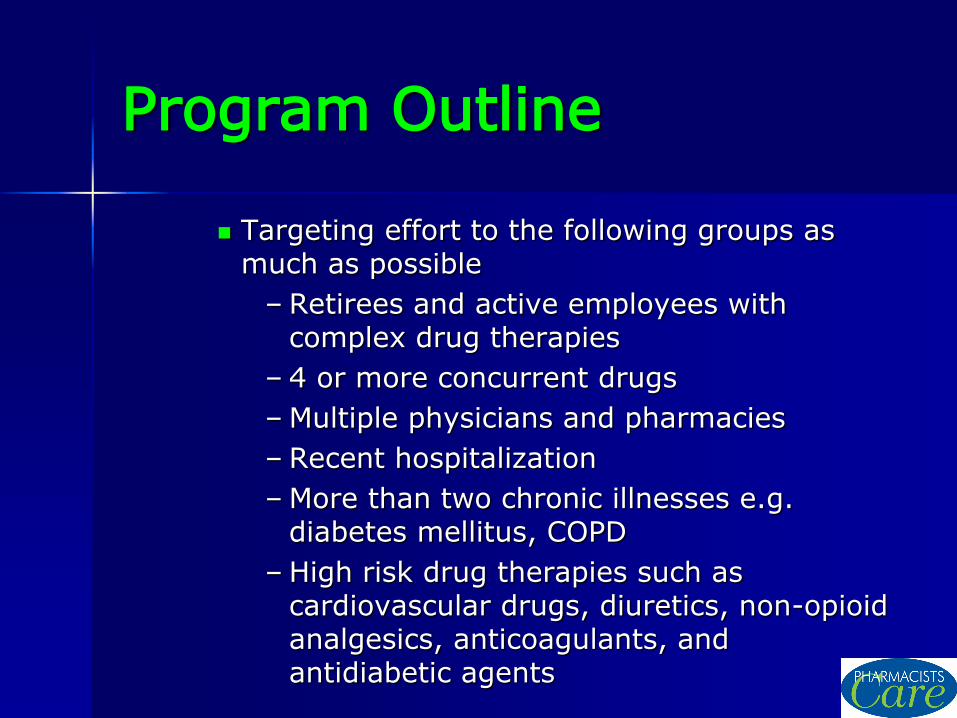
Targeting effort to the following groups as much as possible
– Retirees and active employees with complex drug therapies
– 4 or more concurrent drugs
– Multiple physicians and pharmacies
– Recent hospitalization
– More than two chronic illnesses e.g. diabetes mellitus, COPD
– High risk drug therapies such as cardiovascular drugs, diuretics, non-opioid analgesics, anticoagulants, and antidiabetic agents
Additional Support Service
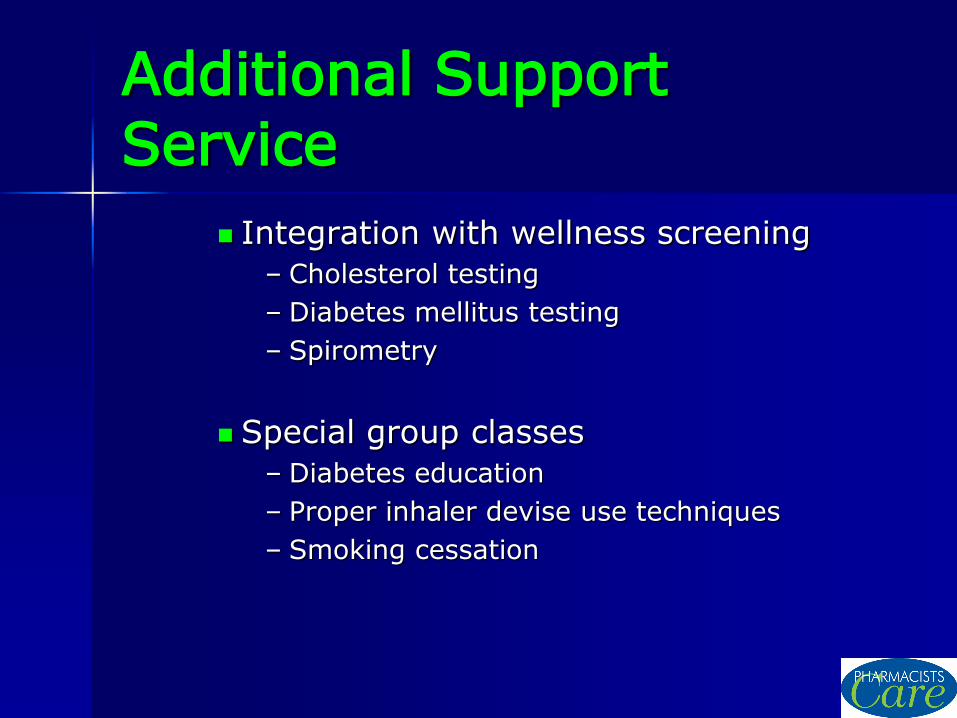
Integration with wellness screening
– Cholesterol testing
– Diabetes mellitus testing
– Spirometry
Special group classes
– Diabetes education
– Proper inhaler devise use techniques
– Smoking cessation
MTM Program Metrics
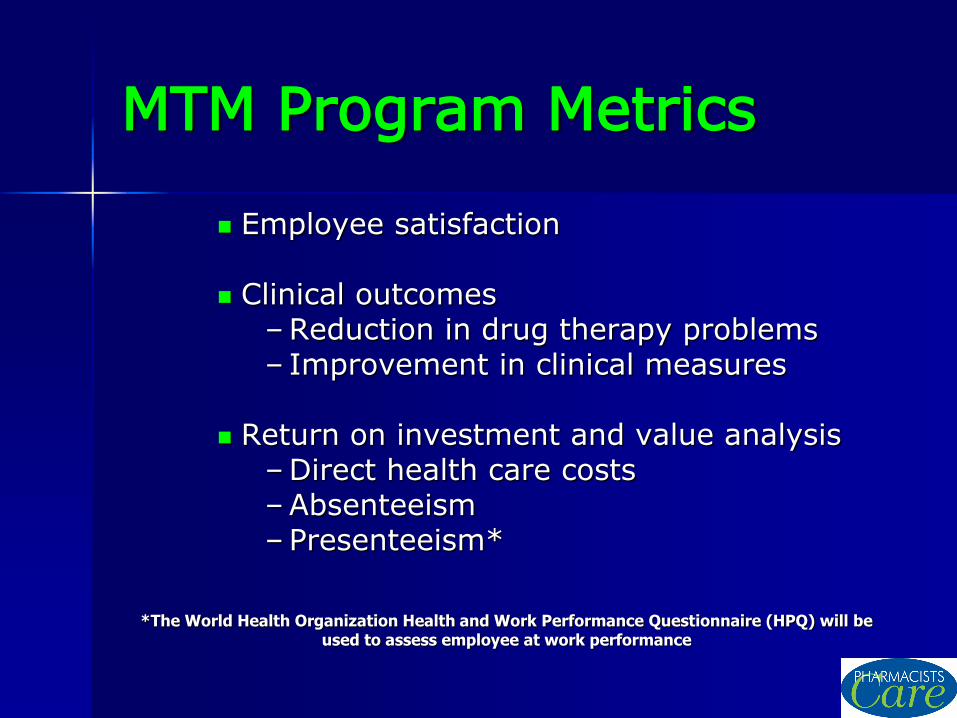
Employee satisfaction
Clinical outcomes – Reduction in drug therapy problems – Improvement in clinical measures
Return on investment and value analysis
– Direct health care costs – Absenteeism – Presenteeism*
*The World Health Organization Health and Work Performance Questionnaire (HPQ) will be used to assess employee at work performance

Financial Support
Plan would cover MTM service for active employees and retirees for.
Promotional program
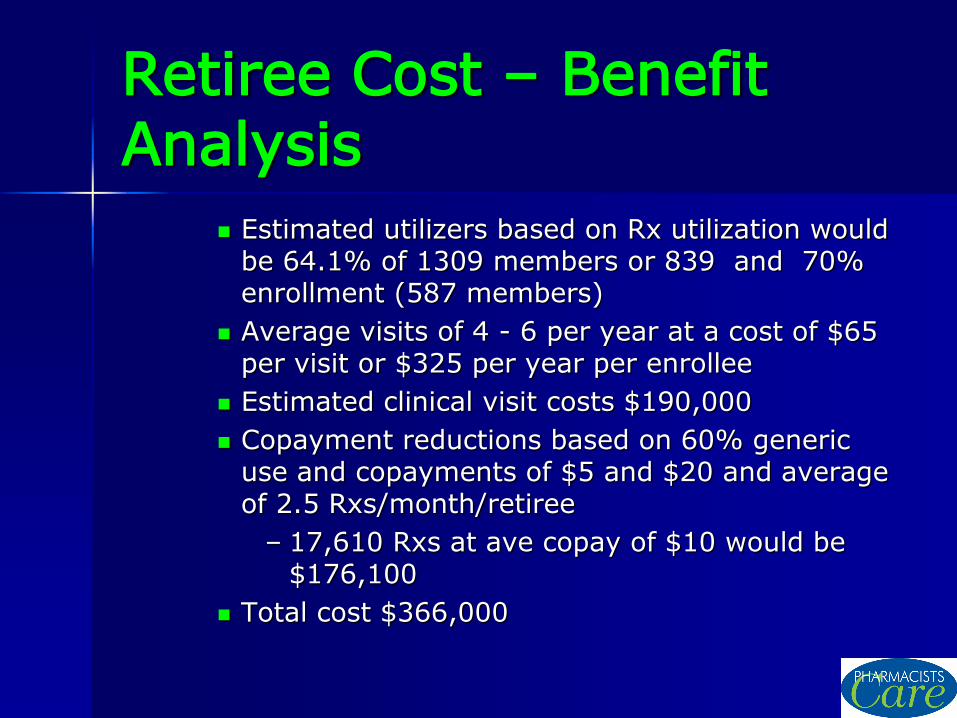
Retiree Cost – Benefit Analysis
Estimated utilizers based on Rx utilization would be 64.1% of 1309 members or 839 and 70% enrollment (587 members)
Average visits of 4 - 6 per year at a cost of $65 per visit or $325 per year per enrollee
Estimated clinical visit costs $190,000
Copayment reductions based on 60% generic use and copayments of $5 and $20 and average of 2.5 Rxs/month/retiree
– 17,610 Rxs at ave copay of $10 would be $176,100
Total cost $366,000
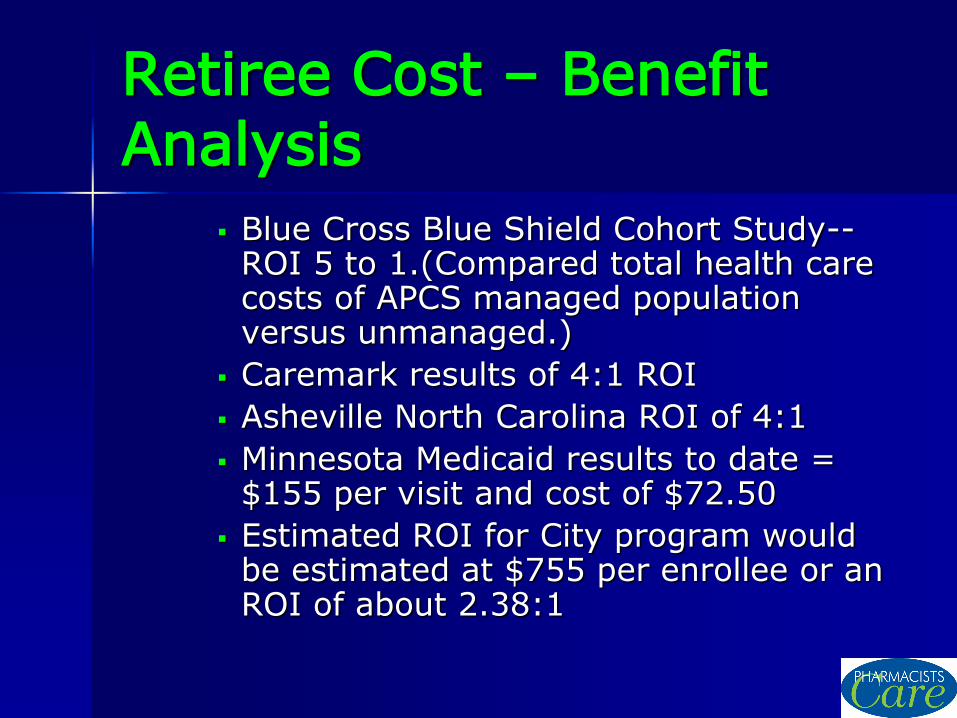
Retiree Cost – Benefit Analysis
Blue Cross Blue Shield Cohort Study--ROI 5 to 1.(Compared total health care costs of APCS managed population versus unmanaged.)
Caremark results of 4:1 ROI
Asheville North Carolina ROI of 4:1
Minnesota Medicaid results to date = $155 per visit and cost of $72.50
Estimated ROI for City program would be estimated at $755 per enrollee or an ROI of about 2.38:1

Organizations Who Have Embarked on Similar Programs
Minnesota Medicaid program
City of Asheville NC
VF Corporation - Greensboro, NC
Mohawk Industries – Dublin, GA
Manitowoc Health Care Cooperative – WI
The Ohio State University
The Kroger Company – Columbus, OH
The University of Kentucky
West Virginia State Employees
Blue Ridge Paper
City of Chicago