medicineinsight - nps medicinewise
TRANSCRIPT
nps.org.au©2020 NPS MedicinewiseIndependent. Not-for-profit. Evidence-based
MedicineInsight General practice insights reportJuly 2018– June 2019
©2020 NPS MedicineWise
This work is copyright. You may download, display, print and reproduce this work in unaltered form
(only retaining this notice) for non-commercial use either personally or within your organisation. Apart
from any such use or otherwise as permitted under the Copyright Act 1968, all rights are reserved.
This work may contain other works (subworks) reproduced with permission from third-party copyright
owners. Please ensure that you have permission from the copyright owner or pursuant to the
Copyright Act before using such subworks.
Disclaimer: Views expressed in this report/working paper are those of the authors and do not
necessarily represent the views of the organisations represented on the working group.
This report should be cited as follows:
NPS MedicineWise, General Practice Insights Report July 2018–June 2019. Sydney: NPS
MedicineWise, 2020.
For more information about MedicineInsight contact [email protected]
Queries concerning reproduction and rights should be sent to [email protected]
2
Contents
Foreword ............................................................................................................. 4
Acknowledgements ...................................................................................................................... 4
GPIR at a glance.................................................................................................. 5
Executive summary .............................................................................................. 6
Practices, providers and patients.................................................................................................. 6 Encounters ................................................................................................................................... 6 Non-communicable diseases ....................................................................................................... 6 Long-term mental illness .............................................................................................................. 7 Dementia ...................................................................................................................................... 7 Childhood conditions .................................................................................................................... 8 Prescriptions ................................................................................................................................. 8 Pathology testing .......................................................................................................................... 8 Risk factors ................................................................................................................................... 9
1. Introduction ................................................................................................ 10
1.1. Aims and objectives ....................................................................................................... 10 1.2. Report overview ............................................................................................................. 10 1.3. Advisory group ............................................................................................................... 11 1.4. The MedicineInsight program ........................................................................................ 11 1.5. Data governance and ethics .......................................................................................... 11
2. Practices, providers and patients................................................................ 12
2.1. General practice sites .................................................................................................... 12 2.2. GP providers .................................................................................................................. 14 2.3. Patients .......................................................................................................................... 15
3. Encounters ................................................................................................. 18
3.1. GP clinical encounter rate per patient ............................................................................ 18
4. Non-communicable diseases ..................................................................... 22
4.1. Patient prevalence ......................................................................................................... 22 4.2. Conditions recorded for patients in 2018–19 ................................................................. 24 4.3. Conditions per 100 GP clinical encounters .................................................................... 28 4.4. Annual GP clinical encounter rate for patients with selected conditions (ever recorded)29
5. In-depth analysis: Long-term mental and cognitive conditions .................... 32
5.1. Background.................................................................................................................... 32 5.2. Identifying patients with long-term mental illness or dementia ....................................... 33 5.3. Patient prevalence of current long-term mental illness and dementia ............................ 34 5.4. Sociodemographic characteristics of patients by type of long-term mental illness......... 40 5.5. Comparisons of sociodemographic characteristics of patients with dementia to the general patient population .................................................................................... 43 5.6. Average number of GP clinical encounters in 2018–19 for patients with long-term mental illness or dementia ............................................................................................. 44 5.7. Conditions per 100 GP clinical encounters .................................................................... 44 5.8. Mental health care plans for people with long-term mental illness ................................. 45 5.9. Cardiovascular disease and cardiovascular risk factors in people with long-term mental illness ................................................................................................................. 45 5.10. Management of cardiovascular disease in people with long-term mental illness ........... 47 5.11. Conclusions ................................................................................................................... 48
6. Childhood conditions (0–14 years) ............................................................. 49
6.1. Sociodemographic characteristics of children in MedicineInsight, 2018–19 .................. 49
3
6.2. Conditions recorded for children in 2018–19 ..................................................................50 6.3. Conditions per 100 GP clinical encounters with children ................................................54 6.4. Annual GP clinical encounter rate for children with selected conditions (ever recorded)54
7. Prescriptions .............................................................................................. 57
7.1. Prescription numbers......................................................................................................58 7.2. Prescriptions per medicine type .....................................................................................60 7.3. Private and government-subsidised issued prescriptions ...............................................64 7.4. Prescriptions per 100 encounters ...................................................................................65 7.5. Prescriptions per 100 encounters by ATC codes ...........................................................67 7.6. Patterns of prescribing for selected medicines ...............................................................69
8. Pathology testing........................................................................................ 72
8.1. Pathology test results by patient .....................................................................................72 8.2. Top 10% of patients by pathology test volume ...............................................................74 8.3. Test results that are outside reference ranges ...............................................................76
9. Risk factors ................................................................................................ 82
9.1. Smoking status recorded ................................................................................................82 9.2. Alcohol use recorded ......................................................................................................83 9.3. BMI and weight recorded ................................................................................................83
10. Interpretation of the data ........................................................................ 87
References ........................................................................................................ 88
Appendix 1. Methodology .................................................................................. 91
Sample selection .........................................................................................................................91 Patients .......................................................................................................................................92 Clinical encounters ......................................................................................................................92 Conditions ...................................................................................................................................93 Weighting ....................................................................................................................................94 Mental health care plans .............................................................................................................96
Appendix 2: The MedicineInsight program ......................................................... 97
Recruitment of general practices and consent ............................................................................97 Data collection .............................................................................................................................97 Other Australian general practice data ......................................................................................100
Appendix 3. Definitions of variables used in this report .................................... 102
Demographics ...........................................................................................................................102 Conditions .................................................................................................................................102 Prescriptions .............................................................................................................................103 Pathology tests ..........................................................................................................................103
Appendix 4. Exclusion terms for GP clinical encounters ................................... 104
Appendix 5. Condition coding .......................................................................... 106
Appendix 6. Additional analyses ...................................................................... 109
Patients by PHN ........................................................................................................................109 Medicines without unique ATC codes .......................................................................................109 Number and proportion of prescriptions by all ATC 3 codes .....................................................110 PBS/RPBS and private prescription breakdown by all ATC 3 codes .........................................115
Appendix 7. Glossary and abbreviations .......................................................... 120
GENERAL PRACTICE INSIGHTS REPORT 2018–19 4
FOREWORD
The NPS MedicineWise General Practice Insights Report 2018–19 provides an overview of the key
features of general practice activity in Australia for the period July 2018 to June 2019. It includes
information from 9% of all Australian GPs and 13% of all Australian patients who saw a GP at least
once during the financial year. It builds on previous reports and further investigates how data from the
MedicineInsight program can be used to describe general practice activity.
Once again, the report highlights the important role primary care plays in the management of chronic
illness and mental health. This report provides new information on a number of primary care patient
groups, including children, patients with long-term mental illnesses and patients with dementia.
Since the publication of the 2017–18 General Practice Insights Report, the number of peer-reviewed
publications from NPS MedicineWise staff and external researchers has continued to increase. We
have also completed a validation study which explored whether MedicineInsight accurately identifies
clinical encounters and conditions and these results will be published soon. Linkage of MedicineInsight
to other Australian databases is currently being explored and, if possible, will contribute to the
evaluation of health outcomes of patients and will enhance post-market surveillance of health
technologies.
This report has been a collaborative effort with the Department of Health (DoH), the Australian Bureau
of Statistics (ABS), the Australian Institute of Health and Welfare (AIHW) and academic general
practitioners. We appreciate their support and the efforts of NPS MedicineWise staff in producing this
report.
We would like to thank all of the patients, general practices and general practice staff whose data
makes this report possible. We hope that this document provides patients, GPs, policy makers and
researchers with an the Royal Australian College of General Practitioners (RACGP) accurate picture
of the enormous amount of work undertaken in primary care and enhances current understanding of
the Australian health system.
Acknowledgements
• NPS MedicineWise Real World Research Team
• Charles Siao, Assistant Director, Data Development Section, Data and Analytics Branch,
Department of Health
• Joanne Groube, Director, Data Development Section, Data and Analytics Branch, Department
of Health
• Ian Rayson, Assistant Director, Health National Statistics Centre, Australian Bureau of
Statistics
• Jo-Anne Manski-Nankervis, Associate Professor, Department of General Practice, Melbourne
Medical School, University of Melbourne
• Teng Liaw, Professor of General Practice, University of NSW
• Rachael Moorin, Associate Professor, Health Economics and Data Analytics, Curtin University
• Ronald McCoy, Royal Australian College of General Practitioners
• Conan Liu, Primary Health Care Data, Australian Institute of Health and Welfare
• Barbara Whitlock, former Director, Data Development Section, Data Analytics Branch,
Department of Health
GENERAL PRACTICE INSIGHTS REPORT 2018–19 5
GPIR AT A GLANCE
• The GPIR uses data from:
o 481 general practice sites, comprising 569 general practices
o 3255 unique GP providers
o 2,893,776 patients with 14,723,569 clinical encounters in the 12-month period from 1 July 2018 to 30 June 2019
o almost 12 million issued prescriptions and 37 million issued plus repeat prescriptions in 2018–19, and
o almost 72 million pathology test results recorded in 2018–19.
• Compared to national data and rates, the GPIR includes 7% of practices, 9% of GPs and 13% of Australian patients who saw a GP at least once in 2018–19.
• MedicineInsight patients are similar in terms of age, gender and socio-economic status to all Australian patients with at least one MBS-subsidised GP visit.
• For every 100 GP clinical encountersa during 2018–19, on average:
o 29.7 were with a patient with a history of hypertension, 25.7 were with a patient with a history of low back pain and 24.0 were with a patient with a history of dyslipidaemia
o 23.5 were with a patient with a history of depression and 19.8 were with a patient with a history of anxiety disorder
o 5.2 were with a patient with current long-term depression and 4.6 were with a patient with a current long-term anxiety disorder
o 1.7 were with a patient with bipolar disorder and 1.1 were with a patient with schizophrenia
o 1.6 were with a patient with dementia, and
o there were 79 prescriptions issued – sufficient for 241 prescriptions to be dispensed if both issued scripts and repeats are included.
• On average, for every 100 GP clinical encountersa with children aged 0–14 years during 2018–19, 37.1 were with a child with a recent history of an acute upper respiratory tract infection (URTI) and 13.7 were with a child with a recent history of otitis media.
• For patients with long-term mental illness, the prevalence of existing cardiovascular disease (CVD) and every single cardiovascular risk factor was significantly higher when compared to the general patient population without long-term mental illness.
• New prevalence estimates for dementia reveal 3.4% of patients aged 65 years or older had a record of dementia.
• Medicines for the nervous system (ATC-N), which include the analgesics and psychotropic medicines, accounted for the largest proportion of issued prescriptions (28.0%). However, cardiovascular medicines (ATC-C) accounted for the largest proportion of medicines ordered for MedicineInsight patients, in terms of the total volume of prescriptions (issued plus repeats; 31.2%).
• The majority of medicines prescribed in practices are PBS-subsidised (84.7%).
• Approximately 2 in 5 patients had at least one pathology test recorded in 2018–19.
• Patients with chronic kidney disease (CKD), type 2 diabetes and rheumatoid arthritis were most likely to be in the top 10% of tested patients.
a Note: conditions and prescriptions are not linked directly to GP clinical encounters but to patients.
GENERAL PRACTICE INSIGHTS REPORT 2018–19 6
EXECUTIVE SUMMARY
MedicineInsight was established by NPS MedicineWise in 2011, with core funding from Australian
Government Department of Health (DoH). MedicineInsight collects general practice data to support
quality improvement in Australian primary care and post-market surveillance of medicines and tests,
and it continues to grow as a valuable resource for Australian longitudinal general practice research.
This report has been undertaken with funding from the DoH and with advice from representatives of
general practice, DoH, academia, Australian Bureau of Statistics (ABS), Royal Australian College of
General Practitioners (RACGP), and the Australian Institute of Health and Welfare (AIHW).
This General Practice Insights Report (GPIR) 2018–19 provides an overview of the care provided to
patients by GPs working in general practice, including patient prevalence of selected common non-
communicable conditions and an exploration of the care provided to patients with long-term mental
illness or dementia. We also present data on pathology testing and prescribing of medicines.
This report is based on the MedicineInsight November 2019 data download and includes encounters
from 1 July 2018 to 30 June 2019. It includes data from 2.9 million patients and 15 million clinical
encounters.
Practices, providers and patients
This report includes nationwide data from 569 general practices and 3255 GPs. This corresponds to
7.1% of all Australian general practices and 8.6% of all Australian GPs. The distribution of GPs
between state and territories is similar to the national coverage.
Approximately 2.89 million patients were seen at least once by GPs in the participating practices
during 2018–19. This represents 13.2% of all patients seen by GPs nationally. The demographic
profile of MedicineInsight patients and Medicare Benefits Schedule (MBS) data on all Australian
patients who visited a GP during 2018–19 were similar in terms of age, gender and socio-economic
status.
Encounters
During 2018–19 there were 14.7 million GP clinical encounters recorded in eligible MedicineInsight
practices. The average number of GP clinical encounters per patient during 2018–19 was 5.1.
Across all ages, with the exception of 0–9 years, female patients had a higher average annual number
of GP clinical encounters than male patients. The average number of GP clinical encounters during
2018–19 rose with increasing age, to a peak of 13.7 among people aged 90 years or older.
Non-communicable diseases
During 2018–19, hypertension was the most common of the selected non-communicable conditions
recorded for patients seen by GPs in MedicineInsight practices (5.7% of patients), followed by
depression (4.7% of patients) and anxiety disorder (4.6% of patients).
Patient condition prevalence in 2018–19 was explored by identifying patients who were recorded as
having a particular condition at any time before or during 2018–19. Hypertension was the most
prevalent of the selected non-communicable conditions (16.3% of patients), followed by low back pain
(14.5%) and depression (13.9%). The patient prevalence estimates for most of the conditions aligned
with the population prevalence estimates from the 2017–18 ABS National Health Survey. Consistent
with national data, the proportion of patients with hypertension, low back pain and dyslipidaemia
increased with age in both males and females.
GENERAL PRACTICE INSIGHTS REPORT 2018–19 7
We calculated the rates of conditions per 100 encounters to get an overview of GP workload.b This
indicated that for every 100 GP clinical encounters during 2018–19, on average:
10 were with a patient with a recent record of hypertension and 30 were with a patient with
hypertension ever recorded 9 were with a patient with a recent record of depression and 24 were with a patient with
depression ever recorded 8 were with a patient with a recent record of anxiety disorder and 20 were with a patient with
anxiety disorder ever recorded, and 8 were with a patient with a recent record of low back pain and 26 were with a patient with low
back pain ever recorded.
Long-term mental illness
Of all patients who visited a MedicineInsight practice in 2018–19, 4.7% had a recent history of long-
term mental illness: 2.4% had current long-term depression that lasted at least 6 months,c 2.2% had
current long-term anxiety disorder that lasted at least 6 months, 0.9% had bipolar disorder and 0.5%
had schizophrenia recorded. Regardless of the type of long-term mental illness, the average number
of encounters in 2018–19 for these patients was similar, at around 10 GP clinical encounters per year,
double that for the general population (5.1 per year). Almost half of patients with current long-term
anxiety disorder or current long-term depression had a mental health care plan created, or reviewed,
by a GP during 2018–19.
The prevalence of existing CVD and every single cardiovascular risk factor was significantly higher for
patients with long-term mental illness when compared to the general patient population without long-
term mental illness. Compared to the general population without long-term mental illness, having long-
term mental illness increased the odds of :
CVD by 50% being a current smoker by 250% dyslipidaemia by 90% overweight/obesity by 80% hypertension by 40% type 2 diabetes by 30%.
While most patients with long-term mental illness and existing CVD had at least one preventive
medicine recorded, they were less likely than the general population with existing CVD to have both a
lipid-lowering and a BP-lowering medicine recorded, as recommended in guidelines for the secondary
prevention of cardiovascular events. While people with long-term mental illness have a high morbidity
burden, these findings represent opportunities for primary care providers to make substantial
differences to the health of this group as many of the risk factors and conditions identified are
modifiable or manageable.
Dementia
In 2018–19 the patient prevalence of dementia was 3.4% among patients aged 65 years or older and
0.6% among patients of all ages. Our findings align with the population prevalence estimates for
dementia from the ABS Survey of Disability, Aging and Carers Report 2018 that estimated 3.1% of the
population aged 65 years or over had dementia. Dementia was most common among patients aged
90 years or older (12.6%) and those aged 80–89 (6.8%). The prevalence of dementia was similar
among males and females in younger ages, but in those aged 80 years or more, dementia was more
common among females than males. Although patients with dementia have a comparatively high
average yearly encounter rate (15.4 encounters per year), they attend 1.6 out of every 100 GP clinical
encounters.
b Note: conditions are not linked directly to GP clinical encounters but to patients. c To be regarded as having long-term anxiety disorder or long-term depression the conditions needed to have been recorded on at least two separate
occasions at least 6 months apart.
GENERAL PRACTICE INSIGHTS REPORT 2018–19 8
Childhood conditions
Almost 520,000 MedicineInsight patients (18.0%) seen during 2018–19 were children aged 0–14
years. Unlike the entire MedicineInsight patient cohort, there were slightly more males than females
(51.8% vs 48.2%) in the child cohort.
Of the selected conditions, acute upper respiratory tract infections (URTIs) were the most commonly
recorded for children aged 0–14 years (22.7%). Acute otitis media was recorded for 7.5% of children
and 3.9% had acute tonsillitis. Asthma was recorded in 4.2% of children and dermatitis/eczema in
3.9%.
The most commonly encountered of the selected conditions among children aged 0–14 years were
URTIs (37.1 per 100 GP encounters). Children with otitis media were managed on average for 13.7
encounters per 100 GP encounters, and children with acute tonsillitis, asthma and dermatitis/eczema
were managed in 6.6, 6.7 and 6.9 encounters per 100 GP encounters, respectively. The average
number of GP clinical encounters for children during 2018–19 was 3.3, lower than the 5.1 average for
all patients.
Prescriptions
Information on prescriptions is reported by issued prescriptions (which may or may not include repeat
prescriptions) and total prescriptions (the total number of prescriptions that are generated as a result
of an issued prescription including repeats). Almost 12 million issued prescriptions and 36.7 million
total prescriptions with unique Anatomical Therapeutic Chemical (ATC) codes were written by GPs in
MedicineInsight practices during 2018–19. Almost 71% of MedicineInsight patients were prescribed a
medicine at least once during 2018–19. While a third of patients only had one or two prescriptions
issued, 6.4% of patients had 15 or more issued prescriptions during 2018–19.
There was an overall average of 3.9 issued prescriptions per patient in 2018–19. The average number
of prescriptions per patient increased with age and with socio-economic disadvantage, consistent with
higher disease burdens in these populations. On average, every 100 GP encountersd result in 78.8
issued prescriptions and 240.6 total prescriptions (issued plus repeats).
Medicines to treat the nervous system (ATC N; antidepressants, analgesics, antiepileptics) were the
most commonly issued prescriptions in 2018–19 but cardiovascular medicines (ATC C; lipid-modifying
medicines, antihypertensives) were the most commonly prescribed issued plus repeat medicines.
Opioids (N02A) accounted for 10.6% of all issued prescriptions while lipid-lowering medicines (C10A)
accounted for 9.8% of total prescriptions.
MedicineInsight captures prescriptions that have been written, whether they are private, subsidised on
the Pharmaceutical Benefits Scheme (PBS) or under co-payment. In contrast, PBS data capture
prescriptions when the medicine is dispensed on the PBS or is under co-payment. This report shows
that an overwhelming majority of medicines (84.7%) were subsidised by the Australian Government
under the PBS or the Repatriation Schedule of Pharmaceutical Benefits (RPBS). Private prescriptions
are more common if the medicine is for topical dermatological use, for hormonal contraception, or is
an anti-infective for the eye or ear.
Pathology testing
Just over 40% of patients had at least one atomised test result recorded in 2018–19 and there were
almost 72 million atomised pathology test results recorded.
Each component of a pathology test result is recorded separately (atomised) in MedicineInsight and
so a request from the GP for something like a full blood test (FBC) can generate up to a dozen
individual test results. Bearing this in mind, rates of testing increased with age and women had a
d Note: prescriptions are not linked directly to GP clinical encounters but to patients
GENERAL PRACTICE INSIGHTS REPORT 2018–19 9
higher average number of atomised test results recorded than men. Patients in the top 10% of tested
patients were more likely to have chronic conditions such as type 2 diabetes and CKD.
Using haemoglobin, creatinine and alanine aminotransferase as proxy measures, the percentage of
patients aged 20 years or older who had an FBC was 42.0%, a kidney function test was 42.2% and a
liver function test (LFT) was 41.0%, respectively.
We also looked at the proportion of patients who had at least one test result that fell outside the
relevant reference rangee at least once during the year. We did not attempt to collect information on
follow-up tests or the conditions diagnosed for these patients (with the exception of diabetes) and so
cannot comment upon the appropriateness of subsequent management decisions. However, bearing
this in mind:
more than two-thirds of patients with diagnosed diabetes had their glycated haemoglobin (HbA1c)
levels checked during 2018–19. For half of these, at least one result was higher than 53 mmol/mol
(7.0%) suggesting that they may have benefited from clinical review only 10.3% of MedicineInsight patients without a diagnosis of diabetes had an HbA1c test,
suggesting that patients who are not considered to be at high risk of diabetes are unlikely to have
HbA1c tests fewer than 10% of patients who had at least one thyroid stimulating hormone (TSH) test during the
year had a result that was outside the reference range 28.2% of MedicineInsight patients who had a vitamin D test had a result that fell outside the
reference range.
Risk factors
We explored the completeness of the MedicineInsight dataset over time on three important health risk
factors: smoking, alcohol use, and body mass index (BMI). We have also investigated the recording of
weight as an individual measurement. Some GPs may record information on BMI, smoking or alcohol
use in different sections in the medical record not available to MedicineInsight, such as progress
notes, and this can have a significant effect on completeness rates.
Information on smoking status was the most complete and was recorded at least once in the medical
record for 84.0% of patients over 18 years of age in 2018–19, an increase of 1.1% from 2017–18.
Alcohol use was ever recorded for only 21.5% of patients over 18 years of age, a decrease of 0.6%
from 2017–18. Alcohol use was more frequently recorded for females (23.4%) than males (19.0%).
Patients aged 80 years and over had substantially higher rates of recording of alcohol use compared
to younger patients.
In the 24-month period from 1 July 2017 to 30 June 2019, BMI (or height and weight) was recorded for
33.9% of patients of all ages. In the same period, weight was recorded for 41.9% of patients of all
ages.
e As defined by the Royal College of Pathologists of Australasia Manual
GENERAL PRACTICE INSIGHTS REPORT 2018–19 10
1. INTRODUCTION
1.1. Aims and objectives
The General Practice Insights Report (GPIR) 2018–19 provides an overview of the key features of
general practice patients and activity in Australia for the period 1 July 2018 to 30 June 2019. This
report prioritises information that cannot be obtained from other sources and aspects of general
practice for which MedicineInsight data are capable of providing reasonable estimates.
This work builds on previous NPS MedicineWise General Practice Insights Reports,1,2 and further
describes and investigates how data from the MedicineInsight program can be used to describe
general practice activity. This report also includes vignettes showing how MedicineInsight can be used
to improve the quality use of medicines and medical tests and in the evaluation of primary care
interventions, for the purpose of demonstrating the versatility and utility of the dataset.
1.2. Report overview
Each chapter explores a different aspect of the clinical and sociodemographic information collected in
MedicineInsight. The report begins with a high-level overview of the number and the geographical
distribution of practices and general practitioner providers in MedicineInsight and compares this with
national data. MedicineInsight patients are characterised by gender, age, Aboriginal and Torres Strait
Islander status and location of residence (state or territory, rurality and ABS Socio-Economic Indexes
for Areas [SEIFA]). We have also quantified differences in the numbers of GP encounters based on
patient characteristics, including age, gender, medical conditions and geographical location.
We also present data on the patient prevalence of selected common non-communicable conditions,
long-term mental health and cognitive conditions, childhood illnesses and on the provision of services
such as pathology testing and prescribing.
Information on conditions is presented in two ways, as:
patient prevalence, which is the proportion of patients with the condition recorded at any time in
their medical record (‘ever recorded’) conditions recorded during 2018–19.
Depending on individual GP recording practices, ongoing management may be provided for a
condition that has been recorded historically, but is not routinely recorded at subsequent GP clinical
encounters. For example, a GP may have recorded that a patient has type 2 diabetes many years ago
but because they know the patient’s history, they may not continue to record this as being the reason
for visit despite continuing to actively manage the condition. Therefore, relying solely on diagnoses
recorded during 2018–19 may underestimate the prevalence of conditions that are currently being
actively managed.
Patient prevalence can be considered the most accurate way of estimating prevalence of chronic
conditions, such as diabetes and chronic obstructive pulmonary disease (COPD). However, it might
overestimate the current prevalence for conditions that can resolve over time, such as depression and
anxiety disorder, or with age, such as asthma and eczema.
Reporting on both the patient prevalence (ever recorded) and conditions recorded in 2018–19 is a way
to describe both the maximum and minimum estimates of GP management of patients with these
conditions, respectively.
Further details about the methodology for this report are provided in Appendix 1. Readers should also
refer to Chapter 10 for other limitations or caveats to consider when interpreting the data in this report.
GENERAL PRACTICE INSIGHTS REPORT 2018–19 11
1.3. Advisory group
The scope, rationale and methodology for this report were developed by NPS MedicineWise, with
expert input from a specially convened Advisory Group. This Advisory Group included representatives
from NPS MedicineWise and:
Australian Government Department of Health (DoH) Australian Institute of Health and Welfare (AIHW) Australian Bureau of Statistics (ABS) Royal Australian College of General Practitioners (RACGP) University of New South Wales University of Melbourne, and Curtin University.
1.4. The MedicineInsight program
NPS MedicineWise is an independent, not-for-profit and evidence-based organisation that works to
improve the way health technologies, medicines and medical tests are used. MedicineInsight was
initially established by NPS MedicineWise in 2011, with core funding from the DoH, to collect general
practice data to support quality improvement in Australian primary care and post-market surveillance
of medicines.
MedicineInsight uses third-party data extraction tools to de-identify, extract and securely transmit data
from within each participating general practice’s clinical information system (CIS). This includes patient
demographic and clinical data entered by GPs and practice staff directly into the system or collected in
the CIS from external sources (eg, pathology test results). However, data are not extracted from fields
that may contain identifying information such as the progress notes.
Regular national-level MedicineInsight study reports are provided to the DoH to support quality use of
health technologies for Australia, including medicines, immunisations and medical tests.
MedicineInsight data are used for quality improvement activities in general practice by comparing
practice activity with best practice clinical guidelines in areas such as asthma, diabetes, anxiety
disorder and opioid use. This allows practice staff to reflect on current practice and identify potential
areas for improvement. MedicineInsight data are also available to support research that aligns with the
NPS MedicineWise mission and the ethos of the MedicineInsight program and are approved by the
independent Data Governance Committee.
Further details about MedicineInsight are available in Appendix 2 and at www.nps.org.au/medicine-
insight. Further information on population health and health service research projects that have used
MedicineInsight data can be found at www.nps.org.au/approved-projects-using-medicineinsight-data.
1.5. Data governance and ethics
The MedicineInsight program has rigorous governance processes in place to mitigate any risk to
participants and to ensure that the program is run lawfully, ethically and for the public good.
MedicineInsight data use is subject to a robust data governance framework, including approval by an
independent Data Governance Committee. The committee comprises consumer advocates, data
privacy and security experts, general practitioners and researchers. It approved the use of data for this
report.
The pilot MedicineInsight program was approved by the RACGP National Research and Evaluation
Ethics Committee in January 2013. In December 2017, the same committee granted NPS
MedicineWise ethics approval for the MedicineInsight program. This approval covers the standard
operations and uses of the MedicineInsight database.
Additional ethics approval was granted by the RACGP National Research and Evaluation Ethics
Committee in October 2019 (NREEC 19-011) for this report.
GENERAL PRACTICE INSIGHTS REPORT 2018–19 12
2. PRACTICES, PROVIDERS AND PATIENTS
In summary
This report includes data collected from 569 general practices and 3255 GPs during 2018–19. This report includes information on 7.1% of general practices and 8.6% of GPs nationally. Approximately 2.89 million patients were seen at least once by GPs in the participating
practices during 2018–19. This represents 13.2% of all patients seen by GPs nationally. The demographic profile of MedicineInsight patients and MBS data on all Australian patients
visiting GPs are similar in terms of age, gender and socio-economic status. 3.0% of MedicineInsight patients were recorded as being of Aboriginal or Torres Strait Islander
background. Information on Aboriginal and Torres Strait Islander status was missing for 19.8% of the
MedicineInsight population. The NT had the lowest rate of missing data on Indigenous status
and Victoria the highest.
This chapter describes:
the characteristics of the general practices in the cohort, compared to all practices nationally,
including:
– the number of practices within each practice site
– the distribution of practices in the cohort and all practices nationally
– percentage of practices covered by state, rurality, and PHN the distribution of GP providers in the cohort and all providers nationally by state and rurality the characteristics of the patient cohort, compared to all patients nationally, including:
– the distribution of patients in the cohort and all patients nationally, and
– percentage of patients by sociodemographic characteristics and location.
2.1. General practice sites
MedicineInsight extracts data from two general practice CISs – Best Practice (BP) and MedicalDirector
(MD). Where multiple general practices share a CIS, this is a general practice site. A site may consist
of several geographically and administratively distinct practices with discrete patient lists, or it may
consist of a collection of practices with shared staff and patients. Patient electronic files from each
general practice are amalgamated within the site’s CIS, and it is not possible for MedicineInsight to
distinguish within a site which general practice a specific patient’s record comes from.
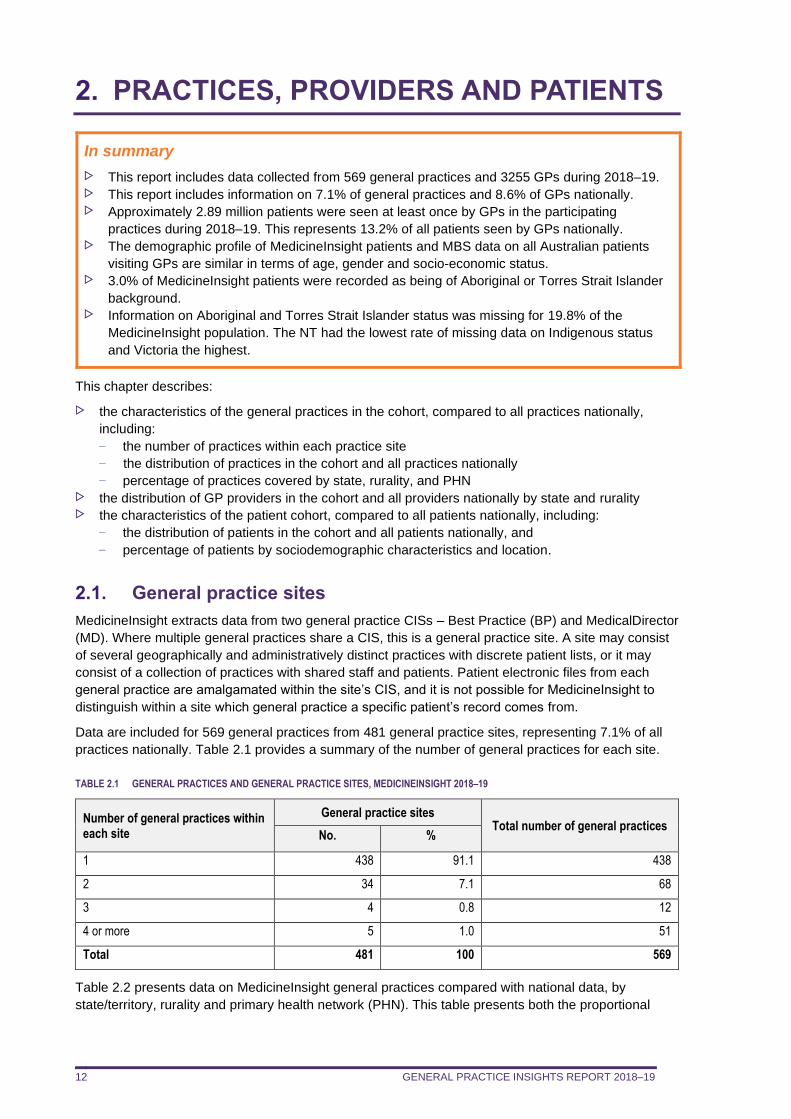
Data are included for 569 general practices from 481 general practice sites, representing 7.1% of all
practices nationally. Table 2.1 provides a summary of the number of general practices for each site.
TABLE 2.1 GENERAL PRACTICES AND GENERAL PRACTICE SITES, MEDICINEINSIGHT 2018–19
Number of general practices within each site
General practice sites Total number of general practices
No. %
1 438 91.1 438
2 34 7.1 68
3 4 0.8 12
4 or more 5 1.0 51
Total 481 100 569
Table 2.2 presents data on MedicineInsight general practices compared with national data, by
state/territory, rurality and primary health network (PHN). This table presents both the proportional
GENERAL PRACTICE INSIGHTS REPORT 2018–19 13
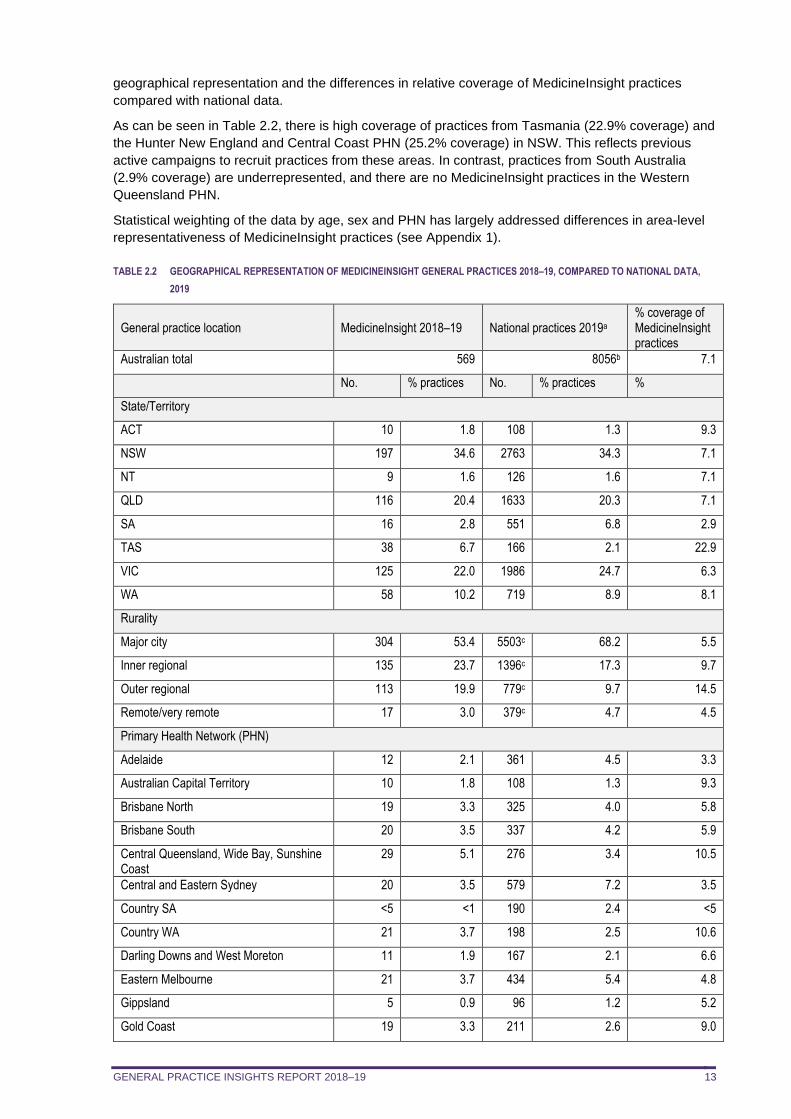
geographical representation and the differences in relative coverage of MedicineInsight practices
compared with national data.
As can be seen in Table 2.2, there is high coverage of practices from Tasmania (22.9% coverage) and
the Hunter New England and Central Coast PHN (25.2% coverage) in NSW. This reflects previous
active campaigns to recruit practices from these areas. In contrast, practices from South Australia
(2.9% coverage) are underrepresented, and there are no MedicineInsight practices in the Western
Queensland PHN.
Statistical weighting of the data by age, sex and PHN has largely addressed differences in area-level
representativeness of MedicineInsight practices (see Appendix 1).
TABLE 2.2 GEOGRAPHICAL REPRESENTATION OF MEDICINEINSIGHT GENERAL PRACTICES 2018–19, COMPARED TO NATIONAL DATA,
2019
General practice location MedicineInsight 2018–19 National practices 2019a % coverage of MedicineInsight practices
Australian total 569 8056b 7.1
No. % practices No. % practices %
State/Territory
ACT 10 1.8 108 1.3 9.3
NSW 197 34.6 2763 34.3 7.1
NT 9 1.6 126 1.6 7.1
QLD 116 20.4 1633 20.3 7.1
SA 16 2.8 551 6.8 2.9
TAS 38 6.7 166 2.1 22.9
VIC 125 22.0 1986 24.7 6.3
WA 58 10.2 719 8.9 8.1
Rurality
Major city 304 53.4 5503c 68.2 5.5
Inner regional 135 23.7 1396c 17.3 9.7
Outer regional 113 19.9 779c 9.7 14.5
Remote/very remote 17 3.0 379c 4.7 4.5
Primary Health Network (PHN)
Adelaide 12 2.1 361 4.5 3.3
Australian Capital Territory 10 1.8 108 1.3 9.3
Brisbane North 19 3.3 325 4.0 5.8
Brisbane South 20 3.5 337 4.2 5.9
Central Queensland, Wide Bay, Sunshine Coast
29 5.1 276 3.4 10.5
Central and Eastern Sydney 20 3.5 579 7.2 3.5
Country SA <5 <1 190 2.4 <5
Country WA 21 3.7 198 2.5 10.6
Darling Downs and West Moreton 11 1.9 167 2.1 6.6
Eastern Melbourne 21 3.7 434 5.4 4.8
Gippsland 5 0.9 96 1.2 5.2
Gold Coast 19 3.3 211 2.6 9.0
GENERAL PRACTICE INSIGHTS REPORT 2018–19 14
General practice location MedicineInsight 2018–19 National practices 2019a % coverage of MedicineInsight practices
Australian total 569 8056b 7.1
No. % practices No. % practices %
Hunter New England and Central Coast 103 18.1 409 5.1 25.2
Murray 44 7.7 210 2.6 21.0
Murrumbidgee <5 <1 87 1.1 <5
Nepean Blue Mountains <5 <1 135 1.7 <5
North Coast 15 2.6 180 2.2 8.3
North Western Melbourne 34 6.0 568 7.1 6.0
Northern Queensland 18 3.2 253 3.1 7.1
Northern Sydney 7 1.2 292 3.6 2.4
Northern Territory 9 1.6 126 1.6 7.1
Perth North 17 3.0 266 3.3 6.4
Perth South 20 3.5 257 3.2 7.8
South Eastern Melbourne 14 2.5 482 6.0 2.9
South Eastern NSW 14 2.5 203 2.5 6.9
South Western Sydney 12 2.1 423 5.3 2.8
Tasmania 38 6.7 166 2.1 22.9
Western NSW 7 1.2 113 1.4 6.2
Western Queensland - - 64 0.8 =
Western Sydney 11 1.9 329 4.1 3.3
Western Victoria 7 1.2 210 2.6 3.3
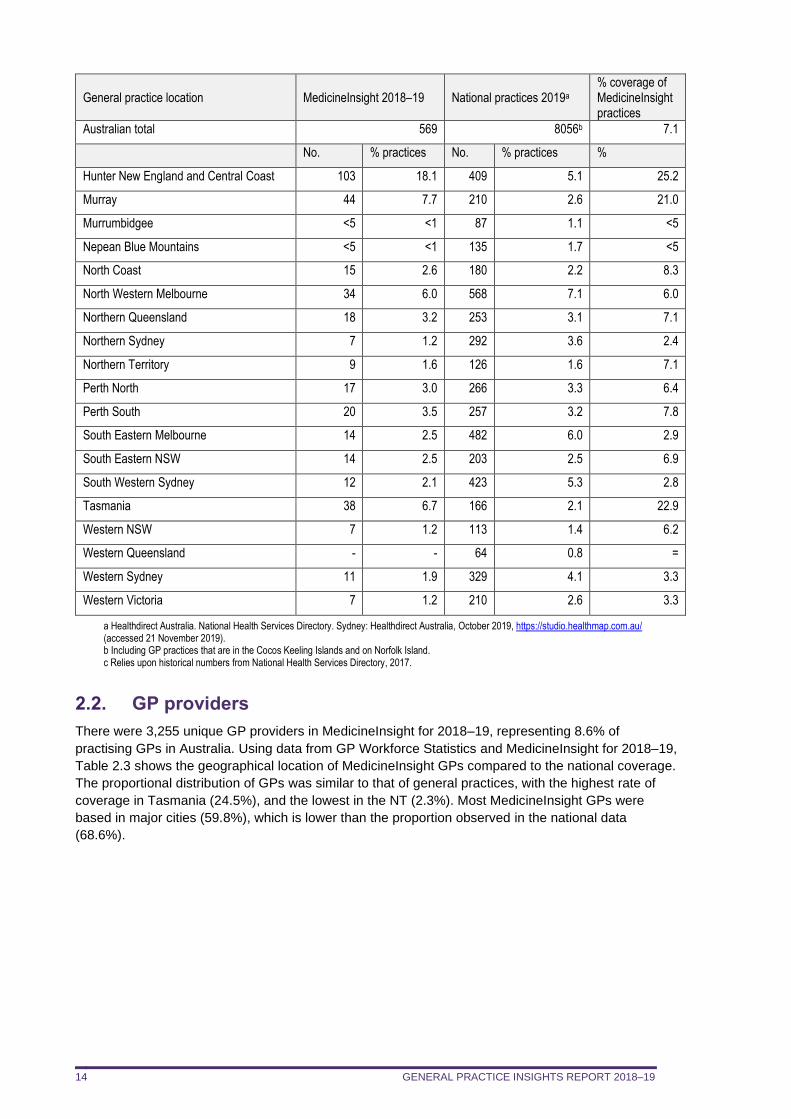
a Healthdirect Australia. National Health Services Directory. Sydney: Healthdirect Australia, October 2019, https://studio.healthmap.com.au/ (accessed 21 November 2019). b Including GP practices that are in the Cocos Keeling Islands and on Norfolk Island. c Relies upon historical numbers from National Health Services Directory, 2017.
2.2. GP providers
There were 3,255 unique GP providers in MedicineInsight for 2018–19, representing 8.6% of
practising GPs in Australia. Using data from GP Workforce Statistics and MedicineInsight for 2018–19,
Table 2.3 shows the geographical location of MedicineInsight GPs compared to the national coverage.
The proportional distribution of GPs was similar to that of general practices, with the highest rate of
coverage in Tasmania (24.5%), and the lowest in the NT (2.3%). Most MedicineInsight GPs were
based in major cities (59.8%), which is lower than the proportion observed in the national data
(68.6%).
GENERAL PRACTICE INSIGHTS REPORT 2018–19 15
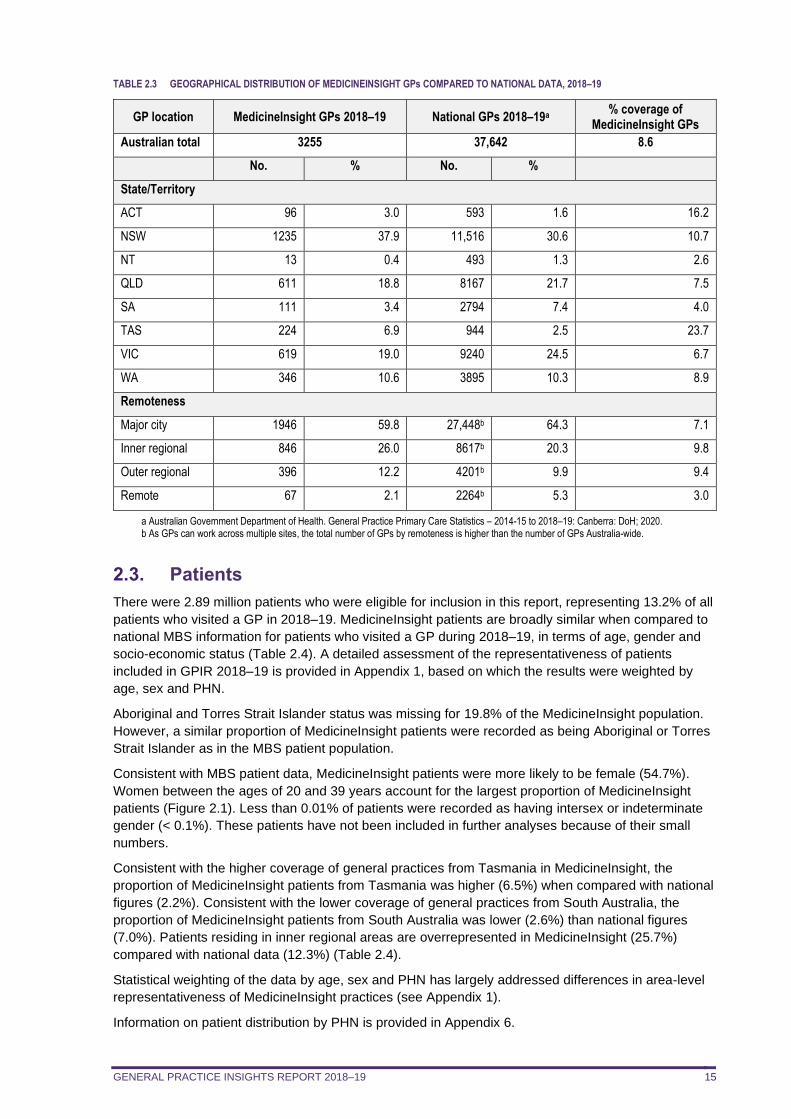
TABLE 2.3 GEOGRAPHICAL DISTRIBUTION OF MEDICINEINSIGHT GPs COMPARED TO NATIONAL DATA, 2018–19
GP location MedicineInsight GPs 2018–19 National GPs 2018–19a % coverage of
MedicineInsight GPs
Australian total 3255 37,642 8.6
No. % No. %
State/Territory
ACT 96 3.0 593 1.6 16.2
NSW 1235 37.9 11,516 30.6 10.7
NT 13 0.4 493 1.3 2.6
QLD 611 18.8 8167 21.7 7.5
SA 111 3.4 2794 7.4 4.0
TAS 224 6.9 944 2.5 23.7
VIC 619 19.0 9240 24.5 6.7
WA 346 10.6 3895 10.3 8.9
Remoteness
Major city 1946 59.8 27,448b 64.3 7.1
Inner regional 846 26.0 8617b 20.3 9.8
Outer regional 396 12.2 4201b 9.9 9.4
Remote 67 2.1 2264b 5.3 3.0
a Australian Government Department of Health. General Practice Primary Care Statistics – 2014-15 to 2018–19: Canberra: DoH; 2020. b As GPs can work across multiple sites, the total number of GPs by remoteness is higher than the number of GPs Australia-wide.
2.3. Patients
There were 2.89 million patients who were eligible for inclusion in this report, representing 13.2% of all
patients who visited a GP in 2018–19. MedicineInsight patients are broadly similar when compared to
national MBS information for patients who visited a GP during 2018–19, in terms of age, gender and
socio-economic status (Table 2.4). A detailed assessment of the representativeness of patients
included in GPIR 2018–19 is provided in Appendix 1, based on which the results were weighted by
age, sex and PHN.
Aboriginal and Torres Strait Islander status was missing for 19.8% of the MedicineInsight population.
However, a similar proportion of MedicineInsight patients were recorded as being Aboriginal or Torres
Strait Islander as in the MBS patient population.
Consistent with MBS patient data, MedicineInsight patients were more likely to be female (54.7%).
Women between the ages of 20 and 39 years account for the largest proportion of MedicineInsight
patients (Figure 2.1). Less than 0.01% of patients were recorded as having intersex or indeterminate
gender (< 0.1%). These patients have not been included in further analyses because of their small
numbers.
Consistent with the higher coverage of general practices from Tasmania in MedicineInsight, the
proportion of MedicineInsight patients from Tasmania was higher (6.5%) when compared with national
figures (2.2%). Consistent with the lower coverage of general practices from South Australia, the
proportion of MedicineInsight patients from South Australia was lower (2.6%) than national figures
(7.0%). Patients residing in inner regional areas are overrepresented in MedicineInsight (25.7%)
compared with national data (12.3%) (Table 2.4).
Statistical weighting of the data by age, sex and PHN has largely addressed differences in area-level
representativeness of MedicineInsight practices (see Appendix 1).
Information on patient distribution by PHN is provided in Appendix 6.
GENERAL PRACTICE INSIGHTS REPORT 2018–19 16
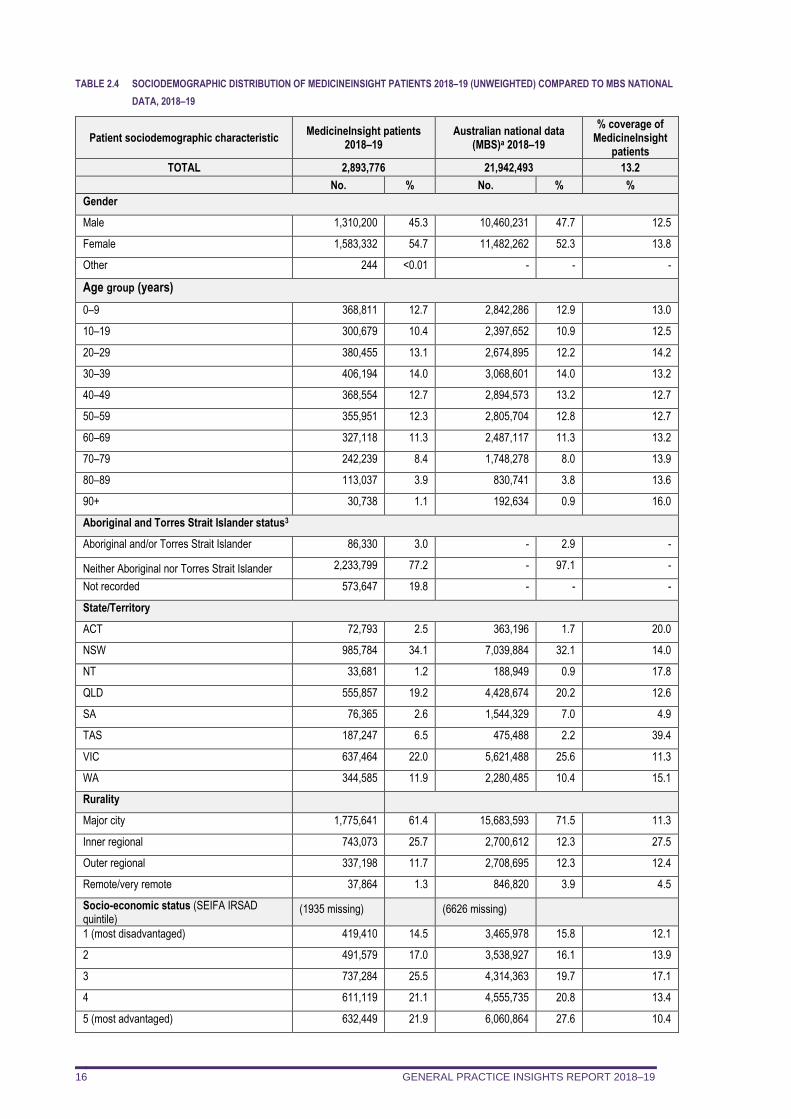
TABLE 2.4 SOCIODEMOGRAPHIC DISTRIBUTION OF MEDICINEINSIGHT PATIENTS 2018–19 (UNWEIGHTED) COMPARED TO MBS NATIONAL
DATA, 2018–19
Patient sociodemographic characteristic MedicineInsight patients
2018–19 Australian national data
(MBS)a 2018–19
% coverage of MedicineInsight
patients
TOTAL 2,893,776 21,942,493 13.2
No. % No. % %
Gender
Male 1,310,200 45.3 10,460,231 47.7 12.5
Female 1,583,332 54.7 11,482,262 52.3 13.8
Other 244 <0.01 - - -
Age group (years)
0–9 368,811 12.7 2,842,286 12.9 13.0
10–19 300,679 10.4 2,397,652 10.9 12.5
20–29 380,455 13.1 2,674,895 12.2 14.2
30–39 406,194 14.0 3,068,601 14.0 13.2
40–49 368,554 12.7 2,894,573 13.2 12.7
50–59 355,951 12.3 2,805,704 12.8 12.7
60–69 327,118 11.3 2,487,117 11.3 13.2
70–79 242,239 8.4 1,748,278 8.0 13.9
80–89 113,037 3.9 830,741 3.8 13.6
90+ 30,738 1.1 192,634 0.9 16.0
Aboriginal and Torres Strait Islander status3
Aboriginal and/or Torres Strait Islander 86,330 3.0 - 2.9 -
Neither Aboriginal nor Torres Strait Islander 2,233,799 77.2 - 97.1 -
Not recorded 573,647 19.8 - - -
State/Territory
ACT 72,793 2.5 363,196 1.7 20.0
NSW 985,784 34.1 7,039,884 32.1 14.0
NT 33,681 1.2 188,949 0.9 17.8
QLD 555,857 19.2 4,428,674 20.2 12.6
SA 76,365 2.6 1,544,329 7.0 4.9
TAS 187,247 6.5 475,488 2.2 39.4
VIC 637,464 22.0 5,621,488 25.6 11.3
WA 344,585 11.9 2,280,485 10.4 15.1
Rurality
Major city 1,775,641 61.4 15,683,593 71.5 11.3
Inner regional 743,073 25.7 2,700,612 12.3 27.5
Outer regional 337,198 11.7 2,708,695 12.3 12.4
Remote/very remote 37,864 1.3 846,820 3.9 4.5
Socio-economic status (SEIFA IRSAD quintile)
(1935 missing) (6626 missing)
1 (most disadvantaged) 419,410 14.5 3,465,978 15.8 12.1
2 491,579 17.0 3,538,927 16.1 13.9
3 737,284 25.5 4,314,363 19.7 17.1
4 611,119 21.1 4,555,735 20.8 13.4
5 (most advantaged) 632,449 21.9 6,060,864 27.6 10.4
GENERAL PRACTICE INSIGHTS REPORT 2018–19 17
Patient sociodemographic characteristic MedicineInsight patients
2018–19 Australian national data
(MBS)a 2018–19
% coverage of MedicineInsight
patients
TOTAL 2,893,776 21,942,493 13.2
No. % No. % %
Concession cards (2,075,202 missing)
Health Care Card 810,115 28.0 1,418,2164 6.5 57.1
DVA Health Card 8459 0.3 199,1235 0.9 4.2
a MBS data from Australian Government Department of Health
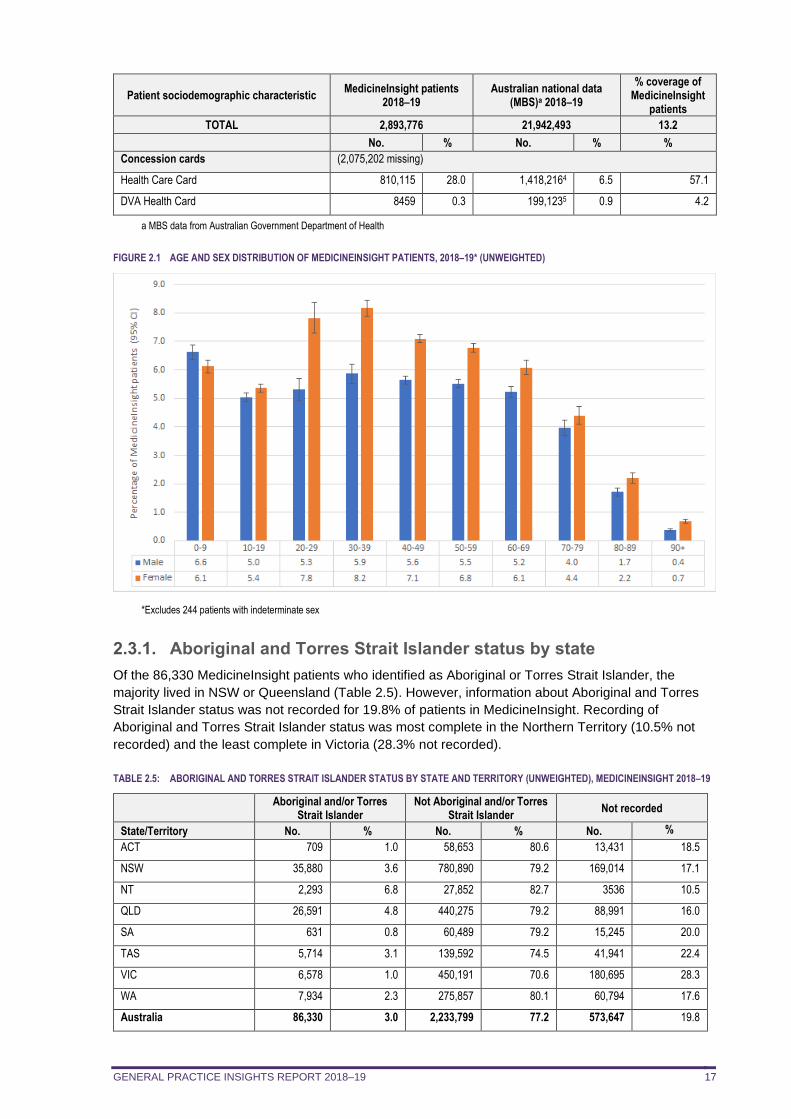
FIGURE 2.1 AGE AND SEX DISTRIBUTION OF MEDICINEINSIGHT PATIENTS, 2018–19* (UNWEIGHTED)
*Excludes 244 patients with indeterminate sex
2.3.1. Aboriginal and Torres Strait Islander status by state
Of the 86,330 MedicineInsight patients who identified as Aboriginal or Torres Strait Islander, the
majority lived in NSW or Queensland (Table 2.5). However, information about Aboriginal and Torres
Strait Islander status was not recorded for 19.8% of patients in MedicineInsight. Recording of
Aboriginal and Torres Strait Islander status was most complete in the Northern Territory (10.5% not
recorded) and the least complete in Victoria (28.3% not recorded).
TABLE 2.5: ABORIGINAL AND TORRES STRAIT ISLANDER STATUS BY STATE AND TERRITORY (UNWEIGHTED), MEDICINEINSIGHT 2018–19
Aboriginal and/or Torres
Strait Islander Not Aboriginal and/or Torres
Strait Islander Not recorded
State/Territory No. % No. % No. %
ACT 709 1.0 58,653 80.6 13,431 18.5
NSW 35,880 3.6 780,890 79.2 169,014 17.1
NT 2,293 6.8 27,852 82.7 3536 10.5
QLD 26,591 4.8 440,275 79.2 88,991 16.0
SA 631 0.8 60,489 79.2 15,245 20.0
TAS 5,714 3.1 139,592 74.5 41,941 22.4
VIC 6,578 1.0 450,191 70.6 180,695 28.3
WA 7,934 2.3 275,857 80.1 60,794 17.6
Australia 86,330 3.0 2,233,799 77.2 573,647 19.8
GENERAL PRACTICE INSIGHTS REPORT 2018–19 18
3. ENCOUNTERS
In summary
During 2018–19 there were 14.7 million clinical encounters with GPs recorded in the 569
eligible MedicineInsight practices. The average number of clinical encounters with a GP per patient during 2018–19 was 5.1. More than half the patients had 1–3 GP clinical encounters during the year. With the exception of the 0–9 years age group, female patients have a higher average number
of GP clinical encounters than male patients.
This chapter describes the characteristics of GP clinical encounters in the MedicineInsight cohort,
compared to all MBS-billed GP clinical encounters nationally, including:
number of encounters per patient for encounters in the cohort and all encounters nationally average number of encounters per patient for encounters in the cohort and all encounters
nationally, grouped by sex, age, state, rurality, and socio-economic status average number of encounters by age and sex, and by socio-economic status and sex proportion of encounters by age group, compared to encounters nationally proportion of encounters according to reason for encounter.
Identifying GP clinical encounters in MedicineInsight data is a challenge because an encounter is
created in the CIS whenever a patient record is opened, whether it is opened for clinical or
administrative reasons. NPS MedicineWise has developed an algorithm to define a clinical encounter
with a GP (see Appendix 1, Box 1). Although we identified certain encounters as ‘clinical’ for the
purposes of counting and describing characteristics of clinical encounters in this report, all clinical data
about a patient (eg, diagnoses and prescriptions) recorded on any date during the financial year
2018–19 was used, even if associated with an administrative encounter.
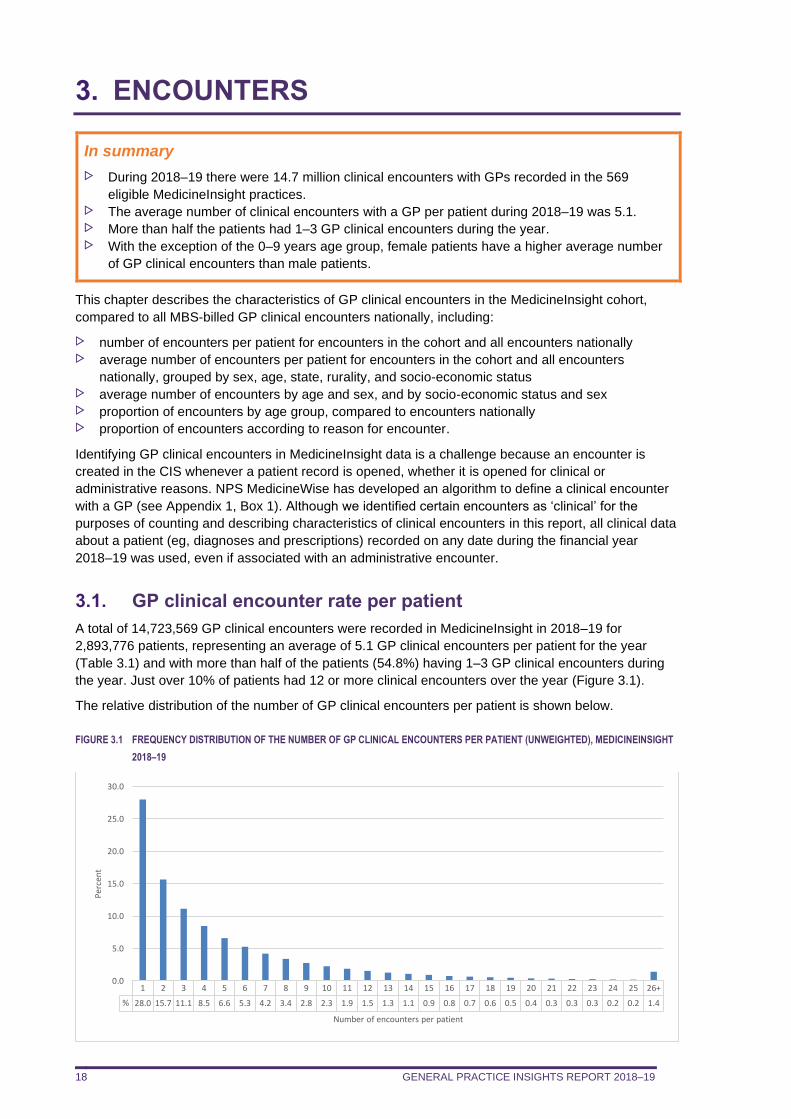
3.1. GP clinical encounter rate per patient
A total of 14,723,569 GP clinical encounters were recorded in MedicineInsight in 2018–19 for
2,893,776 patients, representing an average of 5.1 GP clinical encounters per patient for the year
(Table 3.1) and with more than half of the patients (54.8%) having 1–3 GP clinical encounters during
the year. Just over 10% of patients had 12 or more clinical encounters over the year (Figure 3.1).
The relative distribution of the number of GP clinical encounters per patient is shown below.
FIGURE 3.1 FREQUENCY DISTRIBUTION OF THE NUMBER OF GP CLINICAL ENCOUNTERS PER PATIENT (UNWEIGHTED), MEDICINEINSIGHT
2018–19
1 2 3 4 5 6 7 8 9 10 11 12 13 14 15 16 17 18 19 20 21 22 23 24 25 26+
% 28.0 15.7 11.1 8.5 6.6 5.3 4.2 3.4 2.8 2.3 1.9 1.5 1.3 1.1 0.9 0.8 0.7 0.6 0.5 0.4 0.3 0.3 0.3 0.2 0.2 1.4
0.0
5.0
10.0
15.0
20.0
25.0
30.0
Per
cen
t
Number of encounters per patient
GENERAL PRACTICE INSIGHTS REPORT 2018–19 19
Patient loyalty data provided by the DoH indicates that 63% of all patients attend only one practice.
Another 26% attend two practices and 11% attend three or more practices (data on file, Australian
Government Department of Health).
Using this patient loyalty data, in combination with the estimates of the proportion of practices in
MedicineInsight (6.0%), we can also model the likely number of duplicate patient-ID numbers in
MedicineInsight. Assuming no change in patient behaviour, we estimate that 2.2% of patients in the
cohort have two or more unique patient ID numbers, due to visiting more than one MedicineInsight
practice site.
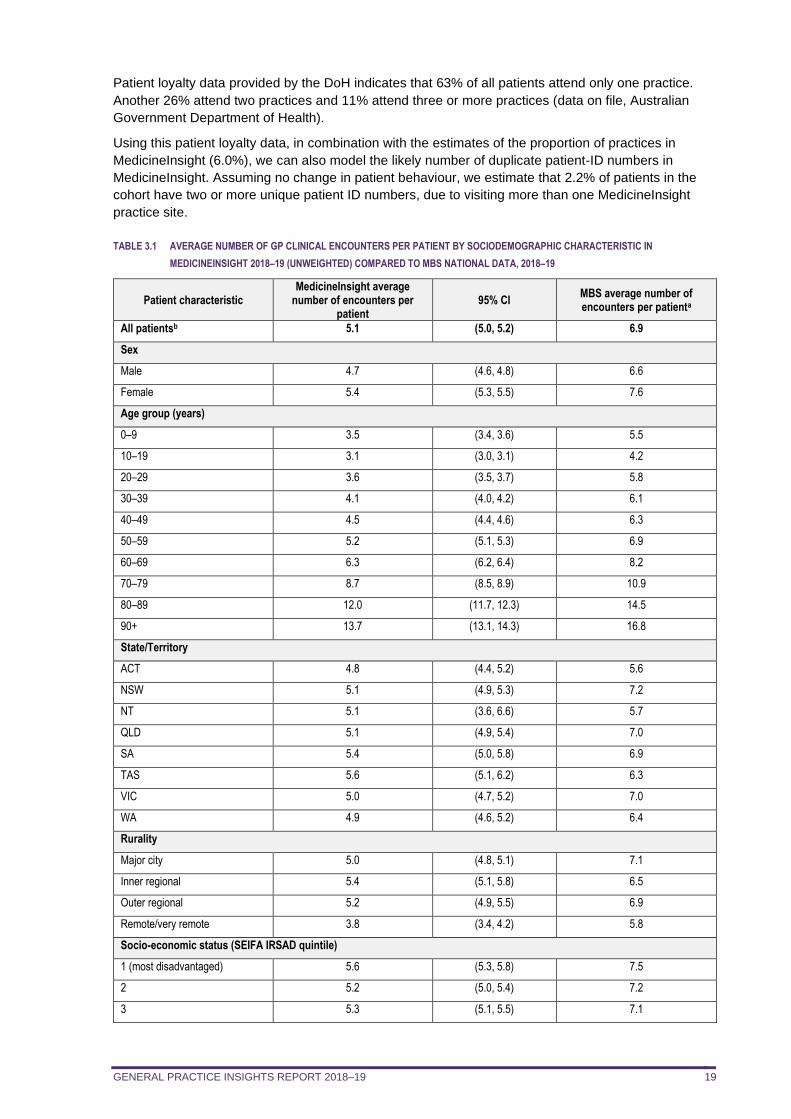
TABLE 3.1 AVERAGE NUMBER OF GP CLINICAL ENCOUNTERS PER PATIENT BY SOCIODEMOGRAPHIC CHARACTERISTIC IN
MEDICINEINSIGHT 2018–19 (UNWEIGHTED) COMPARED TO MBS NATIONAL DATA, 2018–19
Patient characteristic MedicineInsight average
number of encounters per patient
95% CI MBS average number of encounters per patienta
All patientsb 5.1 (5.0, 5.2) 6.9
Sex
Male 4.7 (4.6, 4.8) 6.6
Female 5.4 (5.3, 5.5) 7.6
Age group (years)
0–9 3.5 (3.4, 3.6) 5.5
10–19 3.1 (3.0, 3.1) 4.2
20–29 3.6 (3.5, 3.7) 5.8
30–39 4.1 (4.0, 4.2) 6.1
40–49 4.5 (4.4, 4.6) 6.3
50–59 5.2 (5.1, 5.3) 6.9
60–69 6.3 (6.2, 6.4) 8.2
70–79 8.7 (8.5, 8.9) 10.9
80–89 12.0 (11.7, 12.3) 14.5
90+ 13.7 (13.1, 14.3) 16.8
State/Territory
ACT 4.8 (4.4, 5.2) 5.6
NSW 5.1 (4.9, 5.3) 7.2
NT 5.1 (3.6, 6.6) 5.7
QLD 5.1 (4.9, 5.4) 7.0
SA 5.4 (5.0, 5.8) 6.9
TAS 5.6 (5.1, 6.2) 6.3
VIC 5.0 (4.7, 5.2) 7.0
WA 4.9 (4.6, 5.2) 6.4
Rurality
Major city 5.0 (4.8, 5.1) 7.1
Inner regional 5.4 (5.1, 5.8) 6.5
Outer regional 5.2 (4.9, 5.5) 6.9
Remote/very remote 3.8 (3.4, 4.2) 5.8
Socio-economic status (SEIFA IRSAD quintile)
1 (most disadvantaged) 5.6 (5.3, 5.8) 7.5
2 5.2 (5.0, 5.4) 7.2
3 5.3 (5.1, 5.5) 7.1
GENERAL PRACTICE INSIGHTS REPORT 2018–19 20
Patient characteristic MedicineInsight average
number of encounters per patient
95% CI MBS average number of encounters per patienta
4 4.9 (4.8, 5.1) 7.0
5 (most advantaged) 4.6 (4.5, 4.8) 6.3
a MBS data from Australian Government Department of Health Total GP Non-Referred Attendances excluding Practice Nurse Items 2018–19. b There were 244 patients of indeterminate gender who are not included in this table or for the rest of the report.
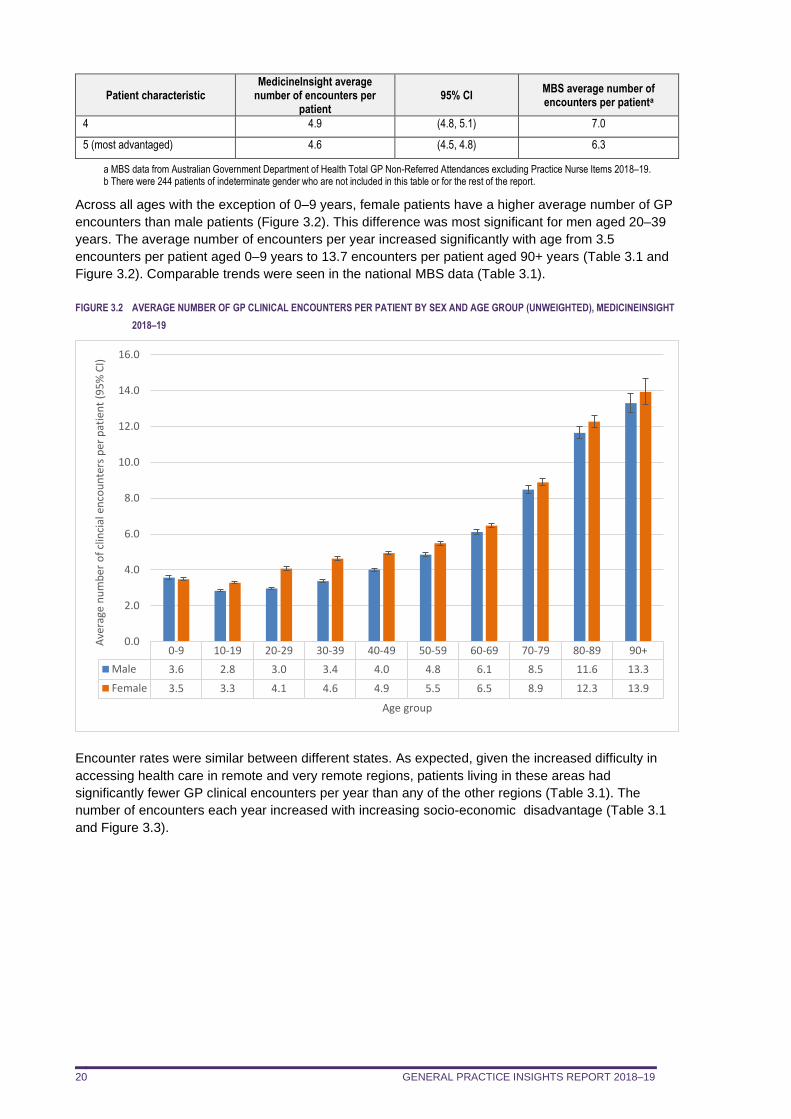
Across all ages with the exception of 0–9 years, female patients have a higher average number of GP
encounters than male patients (Figure 3.2). This difference was most significant for men aged 20–39
years. The average number of encounters per year increased significantly with age from 3.5
encounters per patient aged 0–9 years to 13.7 encounters per patient aged 90+ years (Table 3.1 and
Figure 3.2). Comparable trends were seen in the national MBS data (Table 3.1).
FIGURE 3.2 AVERAGE NUMBER OF GP CLINICAL ENCOUNTERS PER PATIENT BY SEX AND AGE GROUP (UNWEIGHTED), MEDICINEINSIGHT
2018–19
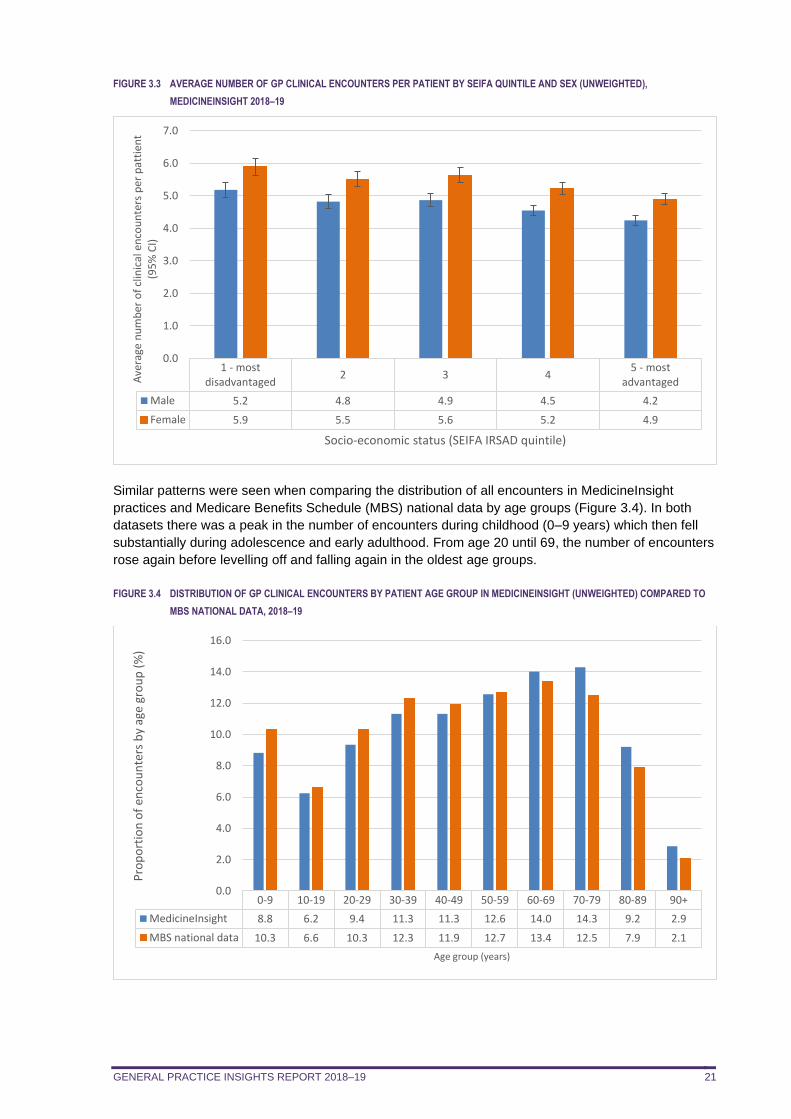
Encounter rates were similar between different states. As expected, given the increased difficulty in
accessing health care in remote and very remote regions, patients living in these areas had
significantly fewer GP clinical encounters per year than any of the other regions (Table 3.1). The
number of encounters each year increased with increasing socio-economic disadvantage (Table 3.1
and Figure 3.3).
0-9 10-19 20-29 30-39 40-49 50-59 60-69 70-79 80-89 90+
Male 3.6 2.8 3.0 3.4 4.0 4.8 6.1 8.5 11.6 13.3
Female 3.5 3.3 4.1 4.6 4.9 5.5 6.5 8.9 12.3 13.9
0.0
2.0
4.0
6.0
8.0
10.0
12.0
14.0
16.0
Ave
rage
nu
mb
er o
f cl
inci
al e
nco
un
ters
per
pat
ien
t (9
5%
CI)
Age group
GENERAL PRACTICE INSIGHTS REPORT 2018–19 21
FIGURE 3.3 AVERAGE NUMBER OF GP CLINICAL ENCOUNTERS PER PATIENT BY SEIFA QUINTILE AND SEX (UNWEIGHTED),
MEDICINEINSIGHT 2018–19
Similar patterns were seen when comparing the distribution of all encounters in MedicineInsight
practices and Medicare Benefits Schedule (MBS) national data by age groups (Figure 3.4). In both
datasets there was a peak in the number of encounters during childhood (0–9 years) which then fell
substantially during adolescence and early adulthood. From age 20 until 69, the number of encounters
rose again before levelling off and falling again in the oldest age groups.
FIGURE 3.4 DISTRIBUTION OF GP CLINICAL ENCOUNTERS BY PATIENT AGE GROUP IN MEDICINEINSIGHT (UNWEIGHTED) COMPARED TO
MBS NATIONAL DATA, 2018–19
1 - mostdisadvantaged
2 3 45 - most
advantaged
Male 5.2 4.8 4.9 4.5 4.2
Female 5.9 5.5 5.6 5.2 4.9
0.0
1.0
2.0
3.0
4.0
5.0
6.0
7.0A
vera
ge n
um
ber
of
clin
ical
en
cou
nte
rs p
er p
atti
ent
(95
% C
I)
Socio-economic status (SEIFA IRSAD quintile)
0-9 10-19 20-29 30-39 40-49 50-59 60-69 70-79 80-89 90+
MedicineInsight 8.8 6.2 9.4 11.3 11.3 12.6 14.0 14.3 9.2 2.9
MBS national data 10.3 6.6 10.3 12.3 11.9 12.7 13.4 12.5 7.9 2.1
0.0
2.0
4.0
6.0
8.0
10.0
12.0
14.0
16.0
Pro
po
rtio
n o
f en
cou
nte
rs b
y ag
e gr
ou
p (
%)
Age group (years)
GENERAL PRACTICE INSIGHTS REPORT 2018–19 22
4. NON-COMMUNICABLE DISEASES
In summary
Hypertension was the most common selected condition recorded during 2018–19 for patients
seen by GPs in MedicineInsight practices (5.7% of patients). This was followed by depression
(4.7%) and anxiety disorder (4.6%), lower back pain (4.0%) and asthma (3.2%). Patient prevalence in 2018–19 was further explored by identifying patients who were recorded
as having a particular condition at any time in their medical record. Once again hypertension
was the most commonly reported of the selected non-communicable conditions (16.3% of
patients), followed by low back pain (14.5%) and depression (13.9%). The patient prevalence estimates for most of the selected conditions align with the population
prevalence estimates from the 2017–18 ABS National Health Survey. Consistent with national data, the proportion of patients with hypertension, low back pain and
dyslipidaemia increased with age in both males and females. Compared to males, female patients were more likely to have a record of depression and
anxiety disorder, across all age groups. The proportion of patients with asthma was highest among boys aged 19 years or younger.
From age 20 onwards, women were more likely to have asthma than men. For every 100 GP clinical encounters during 2018–19, on average:
– 10.3 were with a patient with a recent record of hypertension and 29.7 were with a patient
with hypertension ever recorded
– 8.8 were with a patient with a recent record of depression and 23.5 were with a patient with
depression ever recorded.
This chapter describes:
the proportion of patients with selected conditions reported at encounters in 2018–19 the age and sex-specific proportions of patients with a subset of the most common non-
communicable conditions the proportions of patients with selected non-communicable conditions ever recorded the number of encounters with selected non-communicable conditions recorded per 100
encounters. average number of encounters during 2018–19 for patients with selected conditions.
Detailed definitions of the conditions included in this report are provided in Appendix 5.
4.1. Patient prevalence
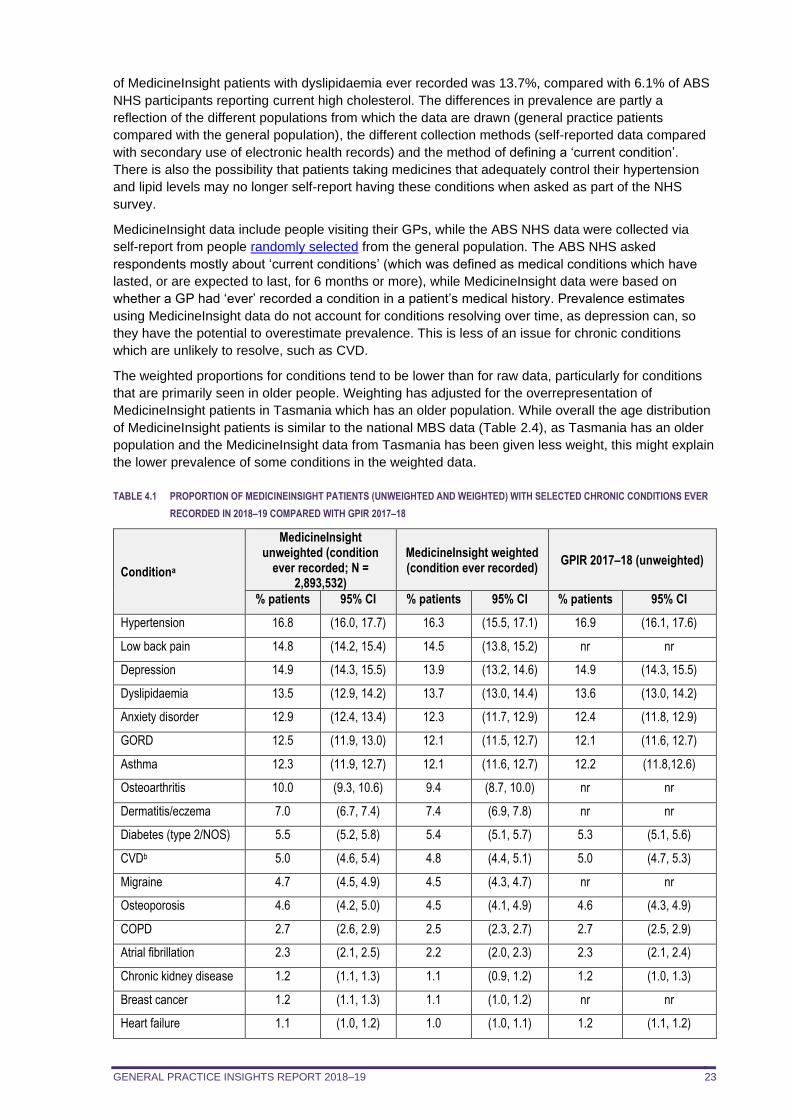
Hypertension was the most common condition with 16.3% of patients having a diagnosis of
hypertension ever recorded (at any time in their medical record; Table 4.1). The next four most
prevalent conditions were low back pain (14.5%), depression (13.9%), dyslipidaemia (13.7%) and
anxiety disorder (12.3%).
The patient prevalence estimates of most of the conditions were similar in this cohort, the 2017–18
MedicineInsight GPIR cohort 182 and the population estimates from the 2017–18 ABS National Health
Survey (ABS NHS), including anxiety disorder, asthma, CVD, type 1 diabetes, osteoarthritis, COPD,
osteoporosis, atrial fibrillation, CKD and stroke.6 Anxiety disorder was recorded for 12.3% of
MedicineInsight patients and 13.1% of ABS NHS participants. Similarly, COPD was recorded for 2.5%
of both MedicineInsight patients and ABS NHS participants (Table 4.1).6
Patient prevalence estimates were higher for a number of conditions in the current MedicineInsight
cohort during 2018–19 than the population prevalence estimates from the 2017–18 ABS NHS,
including hypertension, dyslipidaemia, heart failure, dermatitis/eczema and depression. In the
MedicineInsight cohort during 2018–19, the proportion of people with hypertension ever recorded was
16.3%, compared with 10.6% with current hypertension among ABS NHS participants. The proportion
GENERAL PRACTICE INSIGHTS REPORT 2018–19 23
of MedicineInsight patients with dyslipidaemia ever recorded was 13.7%, compared with 6.1% of ABS
NHS participants reporting current high cholesterol. The differences in prevalence are partly a
reflection of the different populations from which the data are drawn (general practice patients
compared with the general population), the different collection methods (self-reported data compared
with secondary use of electronic health records) and the method of defining a ‘current condition’.
There is also the possibility that patients taking medicines that adequately control their hypertension
and lipid levels may no longer self-report having these conditions when asked as part of the NHS
survey.
MedicineInsight data include people visiting their GPs, while the ABS NHS data were collected via
self-report from people randomly selected from the general population. The ABS NHS asked
respondents mostly about ‘current conditions’ (which was defined as medical conditions which have
lasted, or are expected to last, for 6 months or more), while MedicineInsight data were based on
whether a GP had ‘ever’ recorded a condition in a patient’s medical history. Prevalence estimates
using MedicineInsight data do not account for conditions resolving over time, as depression can, so
they have the potential to overestimate prevalence. This is less of an issue for chronic conditions
which are unlikely to resolve, such as CVD.
The weighted proportions for conditions tend to be lower than for raw data, particularly for conditions
that are primarily seen in older people. Weighting has adjusted for the overrepresentation of
MedicineInsight patients in Tasmania which has an older population. While overall the age distribution
of MedicineInsight patients is similar to the national MBS data (Table 2.4), as Tasmania has an older
population and the MedicineInsight data from Tasmania has been given less weight, this might explain
the lower prevalence of some conditions in the weighted data.
TABLE 4.1 PROPORTION OF MEDICINEINSIGHT PATIENTS (UNWEIGHTED AND WEIGHTED) WITH SELECTED CHRONIC CONDITIONS EVER
RECORDED IN 2018–19 COMPARED WITH GPIR 2017–18
Conditiona
MedicineInsight unweighted (condition
ever recorded; N = 2,893,532)
MedicineInsight weighted (condition ever recorded)
GPIR 2017–18 (unweighted)
% patients 95% CI % patients 95% CI % patients 95% CI
Hypertension 16.8 (16.0, 17.7) 16.3 (15.5, 17.1) 16.9 (16.1, 17.6)
Low back pain 14.8 (14.2, 15.4) 14.5 (13.8, 15.2) nr nr
Depression 14.9 (14.3, 15.5) 13.9 (13.2, 14.6) 14.9 (14.3, 15.5)
Dyslipidaemia 13.5 (12.9, 14.2) 13.7 (13.0, 14.4) 13.6 (13.0, 14.2)
Anxiety disorder 12.9 (12.4, 13.4) 12.3 (11.7, 12.9) 12.4 (11.8, 12.9)
GORD 12.5 (11.9, 13.0) 12.1 (11.5, 12.7) 12.1 (11.6, 12.7)
Asthma 12.3 (11.9, 12.7) 12.1 (11.6, 12.7) 12.2 (11.8,12.6)
Osteoarthritis 10.0 (9.3, 10.6) 9.4 (8.7, 10.0) nr nr
Dermatitis/eczema 7.0 (6.7, 7.4) 7.4 (6.9, 7.8) nr nr
Diabetes (type 2/NOS) 5.5 (5.2, 5.8) 5.4 (5.1, 5.7) 5.3 (5.1, 5.6)
CVDb 5.0 (4.6, 5.4) 4.8 (4.4, 5.1) 5.0 (4.7, 5.3)
Migraine 4.7 (4.5, 4.9) 4.5 (4.3, 4.7) nr nr
Osteoporosis 4.6 (4.2, 5.0) 4.5 (4.1, 4.9) 4.6 (4.3, 4.9)
COPD 2.7 (2.6, 2.9) 2.5 (2.3, 2.7) 2.7 (2.5, 2.9)
Atrial fibrillation 2.3 (2.1, 2.5) 2.2 (2.0, 2.3) 2.3 (2.1, 2.4)
Chronic kidney disease 1.2 (1.1, 1.3) 1.1 (0.9, 1.2) 1.2 (1.0, 1.3)
Breast cancer 1.2 (1.1, 1.3) 1.1 (1.0, 1.2) nr nr
Heart failure 1.1 (1.0, 1.2) 1.0 (1.0, 1.1) 1.2 (1.1, 1.2)
GENERAL PRACTICE INSIGHTS REPORT 2018–19 24
Conditiona
MedicineInsight unweighted (condition
ever recorded; N = 2,893,532)
MedicineInsight weighted (condition ever recorded)
GPIR 2017–18 (unweighted)
% patients 95% CI % patients 95% CI % patients 95% CI
Stroke 1.0 (1.0, 1.1) 1.0 (0.9, 1.1) nr nr
Prostate cancer 0.9 (0.8, 0.9) 0.9 (0.8, 0.9) nr nr
Rheumatoid arthritis 0.8 (0.8, 0.9) 0.7 (0.7, 0.8) nr nr
Diabetes (gestational) 0.7 (0.6, 0.7) 0.7 (0.6, 0.7) nr nr
Diabetes (type 1) 0.6 (0.5, 0.6) 0.5 (0.5, 0.6) nr nr
CI: confidence interval; COPD: chronic obstructive pulmonary disease; CVD: cardiovascular disease; GORD: gastro-oesophageal reflux disease; GPIR: General Practice Insights Report; NOS: not otherwise specified; nr: not recorded; n/a: not available. a As information about the status of the condition is not regularly updated within the CIS, conditions are included irrespective of whether they are marked as ‘active’ or ‘inactive’. b Includes coronary artery disease, peripheral vascular disease, atrial fibrillation, heart failure, stroke and transient ischaemic attack
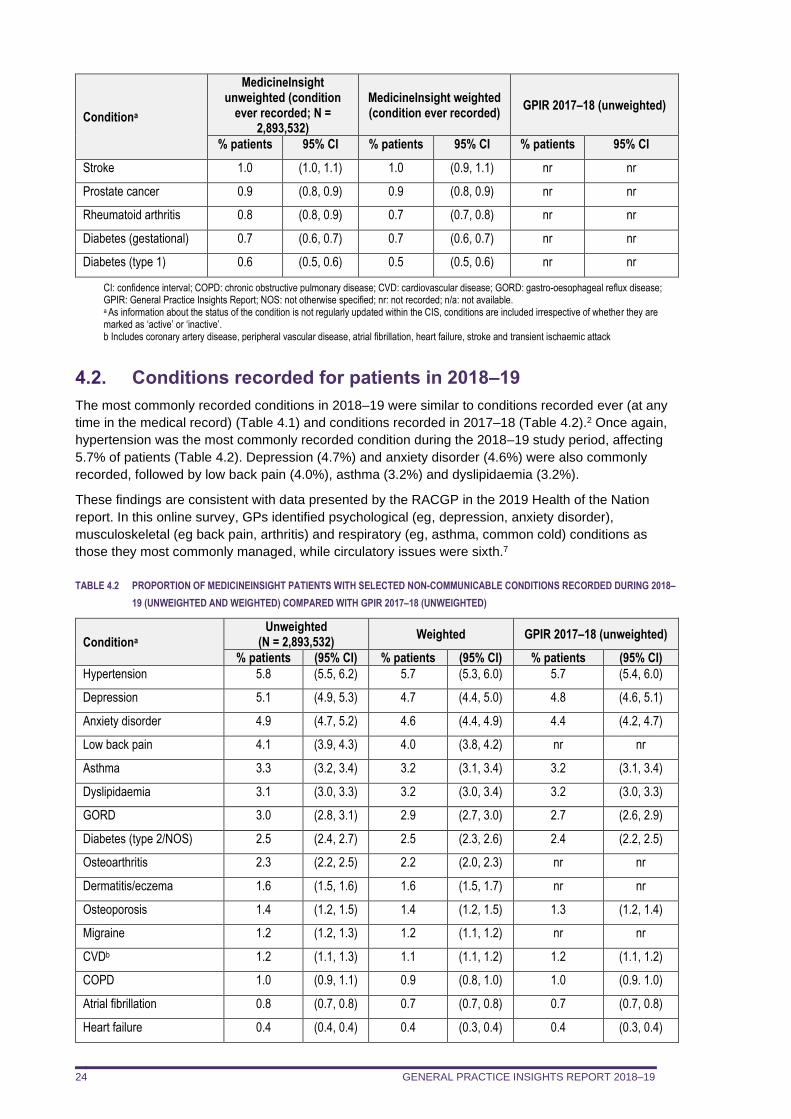
4.2. Conditions recorded for patients in 2018–19
The most commonly recorded conditions in 2018–19 were similar to conditions recorded ever (at any
time in the medical record) (Table 4.1) and conditions recorded in 2017–18 (Table 4.2).2 Once again,
hypertension was the most commonly recorded condition during the 2018–19 study period, affecting
5.7% of patients (Table 4.2). Depression (4.7%) and anxiety disorder (4.6%) were also commonly
recorded, followed by low back pain (4.0%), asthma (3.2%) and dyslipidaemia (3.2%).
These findings are consistent with data presented by the RACGP in the 2019 Health of the Nation
report. In this online survey, GPs identified psychological (eg, depression, anxiety disorder),
musculoskeletal (eg back pain, arthritis) and respiratory (eg, asthma, common cold) conditions as
those they most commonly managed, while circulatory issues were sixth.7
TABLE 4.2 PROPORTION OF MEDICINEINSIGHT PATIENTS WITH SELECTED NON-COMMUNICABLE CONDITIONS RECORDED DURING 2018–
19 (UNWEIGHTED AND WEIGHTED) COMPARED WITH GPIR 2017–18 (UNWEIGHTED)
Conditiona
Unweighted (N = 2,893,532)
Weighted GPIR 2017–18 (unweighted)
% patients (95% CI) % patients (95% CI) % patients (95% CI)
Hypertension 5.8 (5.5, 6.2) 5.7 (5.3, 6.0) 5.7 (5.4, 6.0)
Depression 5.1 (4.9, 5.3) 4.7 (4.4, 5.0) 4.8 (4.6, 5.1)
Anxiety disorder 4.9 (4.7, 5.2) 4.6 (4.4, 4.9) 4.4 (4.2, 4.7)
Low back pain 4.1 (3.9, 4.3) 4.0 (3.8, 4.2) nr nr
Asthma 3.3 (3.2, 3.4) 3.2 (3.1, 3.4) 3.2 (3.1, 3.4)
Dyslipidaemia 3.1 (3.0, 3.3) 3.2 (3.0, 3.4) 3.2 (3.0, 3.3)
GORD 3.0 (2.8, 3.1) 2.9 (2.7, 3.0) 2.7 (2.6, 2.9)
Diabetes (type 2/NOS) 2.5 (2.4, 2.7) 2.5 (2.3, 2.6) 2.4 (2.2, 2.5)
Osteoarthritis 2.3 (2.2, 2.5) 2.2 (2.0, 2.3) nr nr
Dermatitis/eczema 1.6 (1.5, 1.6) 1.6 (1.5, 1.7) nr nr
Osteoporosis 1.4 (1.2, 1.5) 1.4 (1.2, 1.5) 1.3 (1.2, 1.4)
Migraine 1.2 (1.2, 1.3) 1.2 (1.1, 1.2) nr nr
CVDb 1.2 (1.1, 1.3) 1.1 (1.1, 1.2) 1.2 (1.1, 1.2)
COPD 1.0 (0.9, 1.1) 0.9 (0.8, 1.0) 1.0 (0.9. 1.0)
Atrial fibrillation 0.8 (0.7, 0.8) 0.7 (0.7, 0.8) 0.7 (0.7, 0.8)
Heart failure 0.4 (0.4, 0.4) 0.4 (0.3, 0.4) 0.4 (0.3, 0.4)
GENERAL PRACTICE INSIGHTS REPORT 2018–19 25
Conditiona
Unweighted (N = 2,893,532)
Weighted GPIR 2017–18 (unweighted)
% patients (95% CI) % patients (95% CI) % patients (95% CI)
Chronic kidney disease 0.4 (0.3, 0.4) 0.3 (0.3, 0.3) 0.3 (0.3, 0.4)
Rheumatoid arthritis 0.3 (0.2, 0.3) 0.2 (0.2, 0.2) nr nr
Stroke 0.2 (0.2, 0.2) 0.2 (0.2, 0.2) nr nr
Breast cancer 0.2 (0.2, 0.3) 0.2 (0.2, 0.2) nr nr
Prostate cancer 0.2 (0.2, 0.2) 0.2 (0.2, 0.2) nr nr
Diabetes (type 1) 0.2 (0.2, 0.2) 0.2 (0.2, 0.2) nr nr
Diabetes (gestational) 0.1 (0.1, 0.1) 0.1 (0.1, 0.1) nr nr
CI: Confidence interval; COPD: chronic obstructive pulmonary disease; CVD: cardiovascular disease; GORD: gastro-oesophageal reflux disease; GPIR: General Practice Insights Report; NOS: not otherwise specified; nr: not recorded. a As information about the status of the condition is not regularly updated within the CIS, conditions are included irrespective of whether they are marked as ‘active’ or ‘inactive’. b Includes coronary artery disease, peripheral vascular disease, atrial fibrillation, heart failure, stroke and transient ischaemic attack
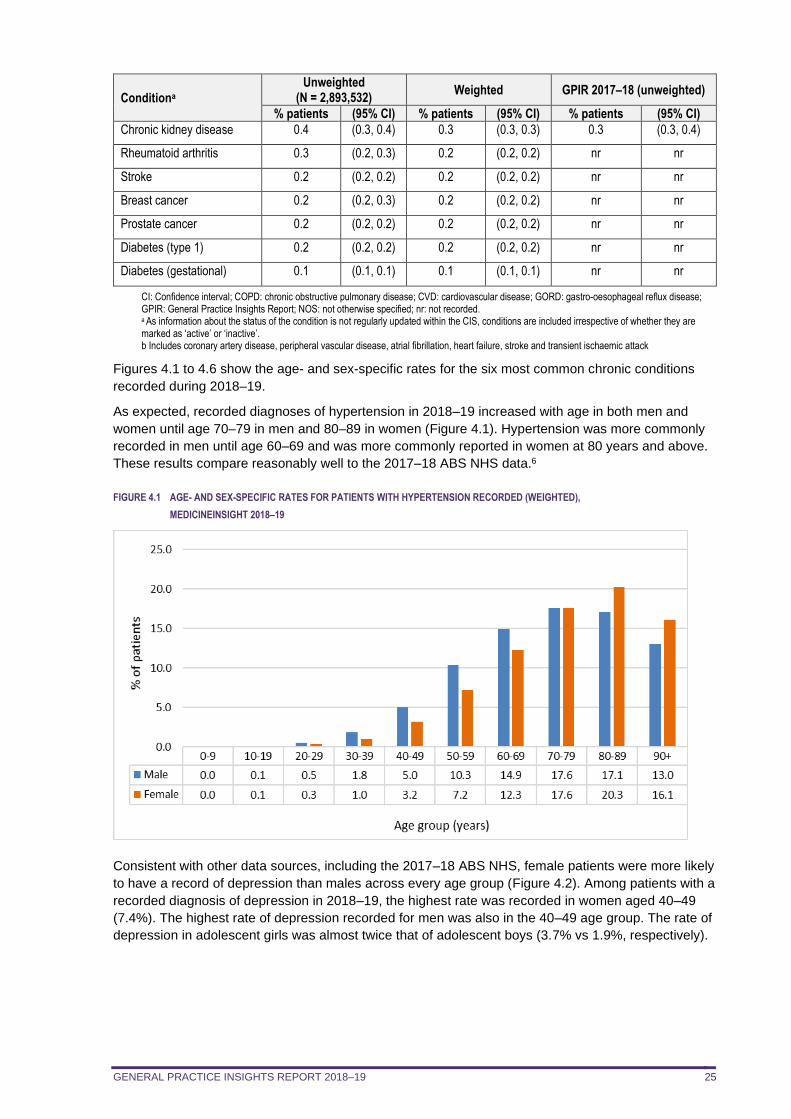
Figures 4.1 to 4.6 show the age- and sex-specific rates for the six most common chronic conditions
recorded during 2018–19.
As expected, recorded diagnoses of hypertension in 2018–19 increased with age in both men and
women until age 70–79 in men and 80–89 in women (Figure 4.1). Hypertension was more commonly
recorded in men until age 60–69 and was more commonly reported in women at 80 years and above.
These results compare reasonably well to the 2017–18 ABS NHS data.6
FIGURE 4.1 AGE- AND SEX-SPECIFIC RATES FOR PATIENTS WITH HYPERTENSION RECORDED (WEIGHTED),
MEDICINEINSIGHT 2018–19
Consistent with other data sources, including the 2017–18 ABS NHS, female patients were more likely
to have a record of depression than males across every age group (Figure 4.2). Among patients with a
recorded diagnosis of depression in 2018–19, the highest rate was recorded in women aged 40–49
(7.4%). The highest rate of depression recorded for men was also in the 40–49 age group. The rate of
depression in adolescent girls was almost twice that of adolescent boys (3.7% vs 1.9%, respectively).
GENERAL PRACTICE INSIGHTS REPORT 2018–19 26
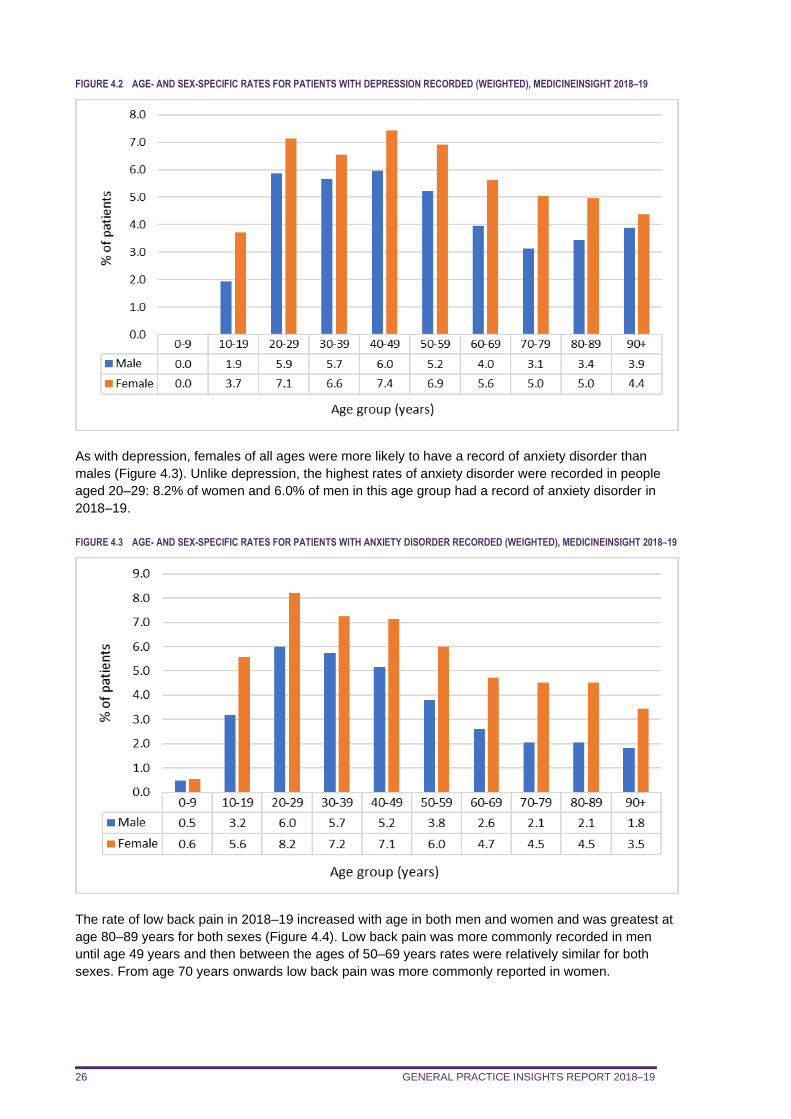
FIGURE 4.2 AGE- AND SEX-SPECIFIC RATES FOR PATIENTS WITH DEPRESSION RECORDED (WEIGHTED), MEDICINEINSIGHT 2018–19
As with depression, females of all ages were more likely to have a record of anxiety disorder than
males (Figure 4.3). Unlike depression, the highest rates of anxiety disorder were recorded in people
aged 20–29: 8.2% of women and 6.0% of men in this age group had a record of anxiety disorder in
2018–19.
FIGURE 4.3 AGE- AND SEX-SPECIFIC RATES FOR PATIENTS WITH ANXIETY DISORDER RECORDED (WEIGHTED), MEDICINEINSIGHT 2018–19
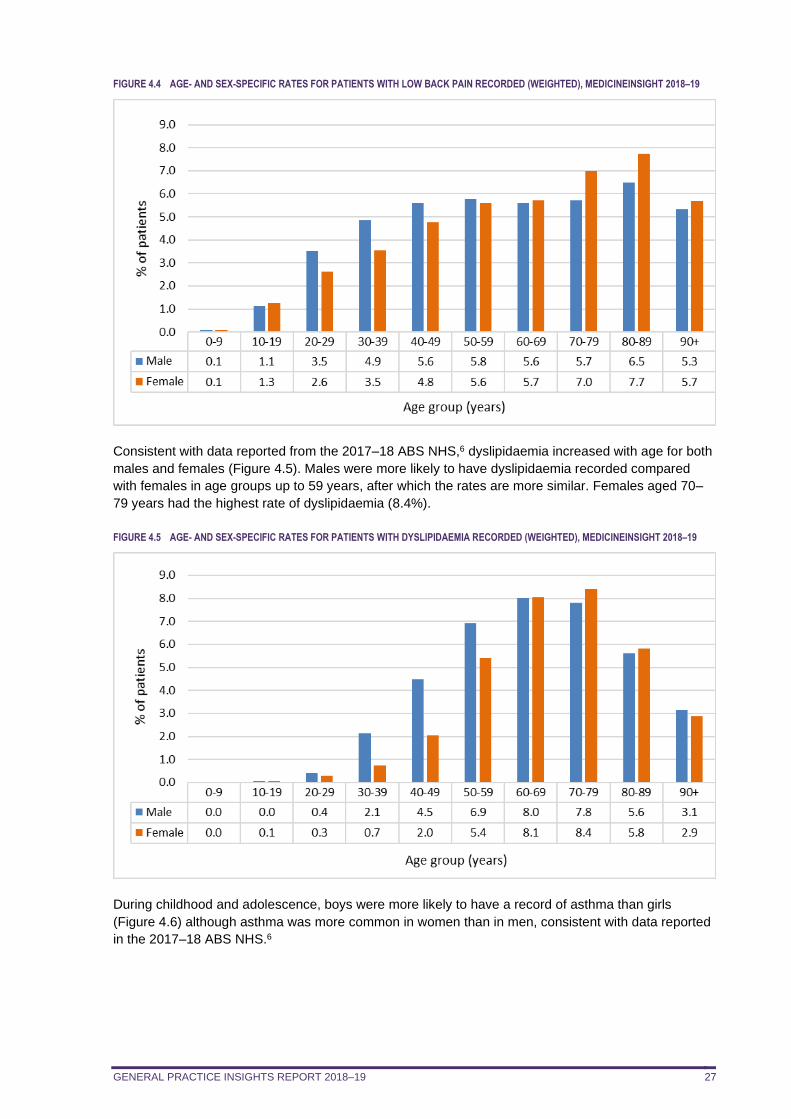
The rate of low back pain in 2018–19 increased with age in both men and women and was greatest at
age 80–89 years for both sexes (Figure 4.4). Low back pain was more commonly recorded in men
until age 49 years and then between the ages of 50–69 years rates were relatively similar for both
sexes. From age 70 years onwards low back pain was more commonly reported in women.
GENERAL PRACTICE INSIGHTS REPORT 2018–19 27
FIGURE 4.4 AGE- AND SEX-SPECIFIC RATES FOR PATIENTS WITH LOW BACK PAIN RECORDED (WEIGHTED), MEDICINEINSIGHT 2018–19
Consistent with data reported from the 2017–18 ABS NHS,6 dyslipidaemia increased with age for both
males and females (Figure 4.5). Males were more likely to have dyslipidaemia recorded compared
with females in age groups up to 59 years, after which the rates are more similar. Females aged 70–
79 years had the highest rate of dyslipidaemia (8.4%).
FIGURE 4.5 AGE- AND SEX-SPECIFIC RATES FOR PATIENTS WITH DYSLIPIDAEMIA RECORDED (WEIGHTED), MEDICINEINSIGHT 2018–19
During childhood and adolescence, boys were more likely to have a record of asthma than girls
(Figure 4.6) although asthma was more common in women than in men, consistent with data reported
in the 2017–18 ABS NHS.6
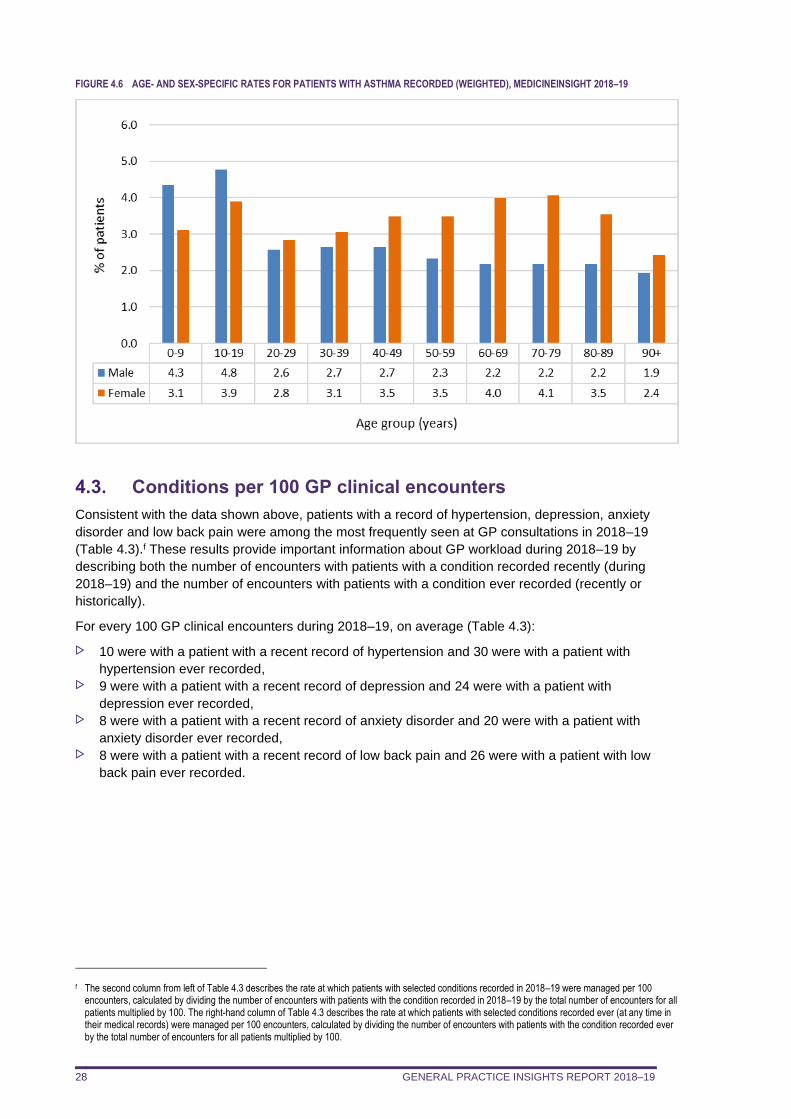
GENERAL PRACTICE INSIGHTS REPORT 2018–19 28
FIGURE 4.6 AGE- AND SEX-SPECIFIC RATES FOR PATIENTS WITH ASTHMA RECORDED (WEIGHTED), MEDICINEINSIGHT 2018–19
4.3. Conditions per 100 GP clinical encounters
Consistent with the data shown above, patients with a record of hypertension, depression, anxiety
disorder and low back pain were among the most frequently seen at GP consultations in 2018–19
(Table 4.3).f These results provide important information about GP workload during 2018–19 by
describing both the number of encounters with patients with a condition recorded recently (during
2018–19) and the number of encounters with patients with a condition ever recorded (recently or
historically).
For every 100 GP clinical encounters during 2018–19, on average (Table 4.3):
10 were with a patient with a recent record of hypertension and 30 were with a patient with
hypertension ever recorded, 9 were with a patient with a recent record of depression and 24 were with a patient with
depression ever recorded, 8 were with a patient with a recent record of anxiety disorder and 20 were with a patient with
anxiety disorder ever recorded, 8 were with a patient with a recent record of low back pain and 26 were with a patient with low
back pain ever recorded.
f The second column from left of Table 4.3 describes the rate at which patients with selected conditions recorded in 2018–19 were managed per 100 encounters, calculated by dividing the number of encounters with patients with the condition recorded in 2018–19 by the total number of encounters for all patients multiplied by 100. The right-hand column of Table 4.3 describes the rate at which patients with selected conditions recorded ever (at any time in their medical records) were managed per 100 encounters, calculated by dividing the number of encounters with patients with the condition recorded ever by the total number of encounters for all patients multiplied by 100.
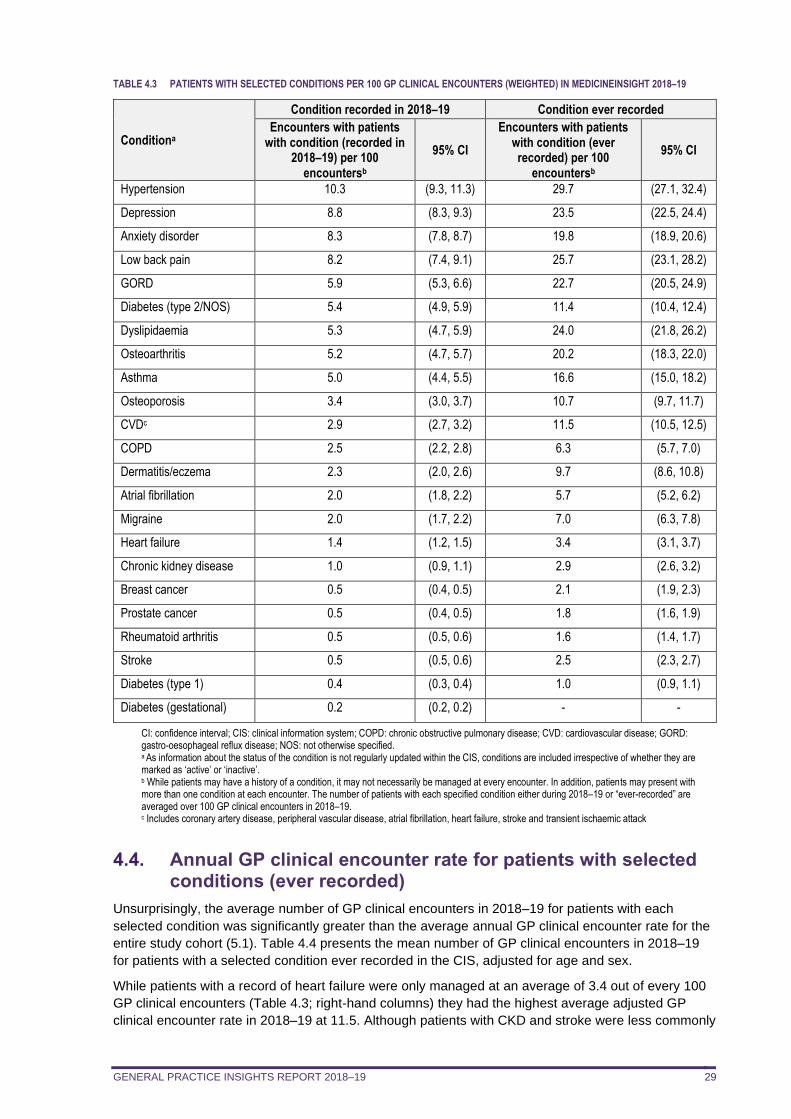
GENERAL PRACTICE INSIGHTS REPORT 2018–19 29
TABLE 4.3 PATIENTS WITH SELECTED CONDITIONS PER 100 GP CLINICAL ENCOUNTERS (WEIGHTED) IN MEDICINEINSIGHT 2018–19
Conditiona
Condition recorded in 2018–19 Condition ever recorded
Encounters with patients with condition (recorded in
2018–19) per 100 encountersb
95% CI
Encounters with patients with condition (ever recorded) per 100
encountersb
95% CI
Hypertension 10.3 (9.3, 11.3) 29.7 (27.1, 32.4)
Depression 8.8 (8.3, 9.3) 23.5 (22.5, 24.4)
Anxiety disorder 8.3 (7.8, 8.7) 19.8 (18.9, 20.6)
Low back pain 8.2 (7.4, 9.1) 25.7 (23.1, 28.2)
GORD 5.9 (5.3, 6.6) 22.7 (20.5, 24.9)
Diabetes (type 2/NOS) 5.4 (4.9, 5.9) 11.4 (10.4, 12.4)
Dyslipidaemia 5.3 (4.7, 5.9) 24.0 (21.8, 26.2)
Osteoarthritis 5.2 (4.7, 5.7) 20.2 (18.3, 22.0)
Asthma 5.0 (4.4, 5.5) 16.6 (15.0, 18.2)
Osteoporosis 3.4 (3.0, 3.7) 10.7 (9.7, 11.7)
CVDc 2.9 (2.7, 3.2) 11.5 (10.5, 12.5)
COPD 2.5 (2.2, 2.8) 6.3 (5.7, 7.0)
Dermatitis/eczema 2.3 (2.0, 2.6) 9.7 (8.6, 10.8)
Atrial fibrillation 2.0 (1.8, 2.2) 5.7 (5.2, 6.2)
Migraine 2.0 (1.7, 2.2) 7.0 (6.3, 7.8)
Heart failure 1.4 (1.2, 1.5) 3.4 (3.1, 3.7)
Chronic kidney disease 1.0 (0.9, 1.1) 2.9 (2.6, 3.2)
Breast cancer 0.5 (0.4, 0.5) 2.1 (1.9, 2.3)
Prostate cancer 0.5 (0.4, 0.5) 1.8 (1.6, 1.9)
Rheumatoid arthritis 0.5 (0.5, 0.6) 1.6 (1.4, 1.7)
Stroke 0.5 (0.5, 0.6) 2.5 (2.3, 2.7)
Diabetes (type 1) 0.4 (0.3, 0.4) 1.0 (0.9, 1.1)
Diabetes (gestational) 0.2 (0.2, 0.2) - -
CI: confidence interval; CIS: clinical information system; COPD: chronic obstructive pulmonary disease; CVD: cardiovascular disease; GORD: gastro-oesophageal reflux disease; NOS: not otherwise specified. a As information about the status of the condition is not regularly updated within the CIS, conditions are included irrespective of whether they are marked as ‘active’ or ‘inactive’. b While patients may have a history of a condition, it may not necessarily be managed at every encounter. In addition, patients may present with more than one condition at each encounter. The number of patients with each specified condition either during 2018–19 or “ever-recorded” are averaged over 100 GP clinical encounters in 2018–19. c Includes coronary artery disease, peripheral vascular disease, atrial fibrillation, heart failure, stroke and transient ischaemic attack
4.4. Annual GP clinical encounter rate for patients with selected conditions (ever recorded)
Unsurprisingly, the average number of GP clinical encounters in 2018–19 for patients with each
selected condition was significantly greater than the average annual GP clinical encounter rate for the
entire study cohort (5.1). Table 4.4 presents the mean number of GP clinical encounters in 2018–19
for patients with a selected condition ever recorded in the CIS, adjusted for age and sex.
While patients with a record of heart failure were only managed at an average of 3.4 out of every 100
GP clinical encounters (Table 4.3; right-hand columns) they had the highest average adjusted GP
clinical encounter rate in 2018–19 at 11.5. Although patients with CKD and stroke were less commonly
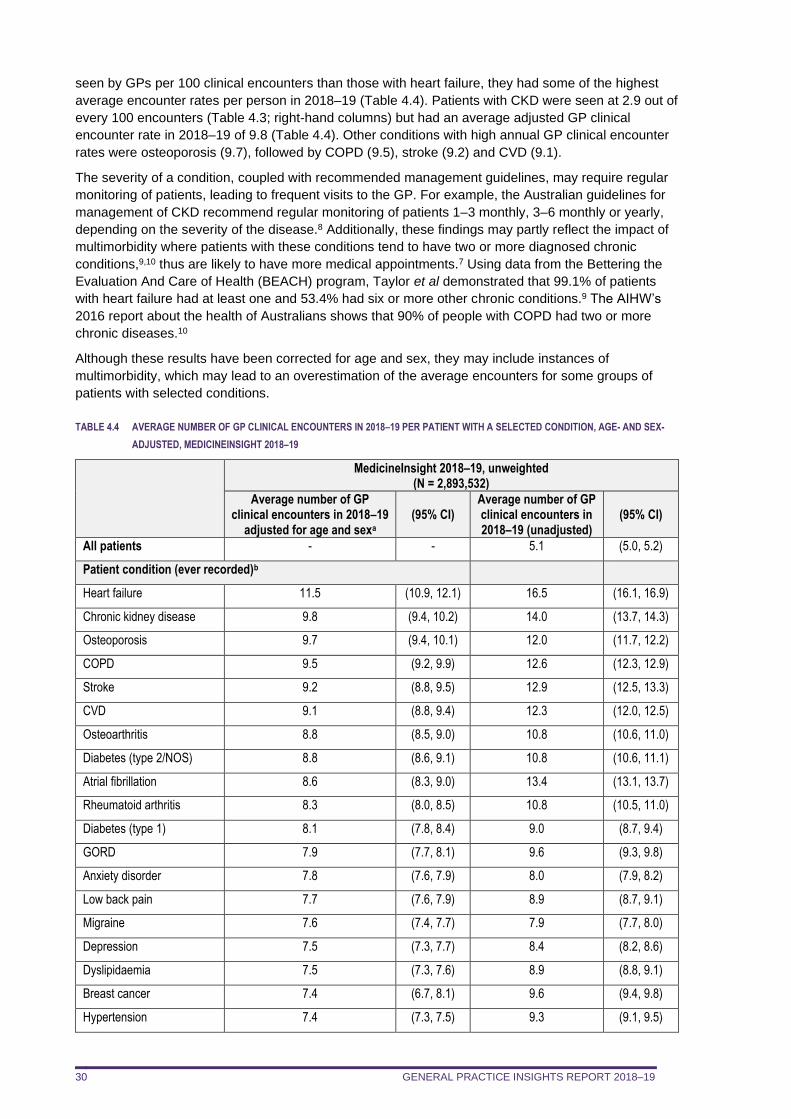
GENERAL PRACTICE INSIGHTS REPORT 2018–19 30
seen by GPs per 100 clinical encounters than those with heart failure, they had some of the highest
average encounter rates per person in 2018–19 (Table 4.4). Patients with CKD were seen at 2.9 out of
every 100 encounters (Table 4.3; right-hand columns) but had an average adjusted GP clinical
encounter rate in 2018–19 of 9.8 (Table 4.4). Other conditions with high annual GP clinical encounter
rates were osteoporosis (9.7), followed by COPD (9.5), stroke (9.2) and CVD (9.1).
The severity of a condition, coupled with recommended management guidelines, may require regular
monitoring of patients, leading to frequent visits to the GP. For example, the Australian guidelines for
management of CKD recommend regular monitoring of patients 1–3 monthly, 3–6 monthly or yearly,
depending on the severity of the disease.8 Additionally, these findings may partly reflect the impact of
multimorbidity where patients with these conditions tend to have two or more diagnosed chronic
conditions,9,10 thus are likely to have more medical appointments.7 Using data from the Bettering the
Evaluation And Care of Health (BEACH) program, Taylor et al demonstrated that 99.1% of patients
with heart failure had at least one and 53.4% had six or more other chronic conditions.9 The AIHW’s
2016 report about the health of Australians shows that 90% of people with COPD had two or more
chronic diseases.10
Although these results have been corrected for age and sex, they may include instances of
multimorbidity, which may lead to an overestimation of the average encounters for some groups of
patients with selected conditions.
TABLE 4.4 AVERAGE NUMBER OF GP CLINICAL ENCOUNTERS IN 2018–19 PER PATIENT WITH A SELECTED CONDITION, AGE- AND SEX-
ADJUSTED, MEDICINEINSIGHT 2018–19
MedicineInsight 2018–19, unweighted (N = 2,893,532)
Average number of GP clinical encounters in 2018–19
adjusted for age and sexa (95% CI)
Average number of GP clinical encounters in 2018–19 (unadjusted)
(95% CI)
All patients - - 5.1 (5.0, 5.2)
Patient condition (ever recorded)b
Heart failure 11.5 (10.9, 12.1) 16.5 (16.1, 16.9)
Chronic kidney disease 9.8 (9.4, 10.2) 14.0 (13.7, 14.3)
Osteoporosis 9.7 (9.4, 10.1) 12.0 (11.7, 12.2)
COPD 9.5 (9.2, 9.9) 12.6 (12.3, 12.9)
Stroke 9.2 (8.8, 9.5) 12.9 (12.5, 13.3)
CVD 9.1 (8.8, 9.4) 12.3 (12.0, 12.5)
Osteoarthritis 8.8 (8.5, 9.0) 10.8 (10.6, 11.0)
Diabetes (type 2/NOS) 8.8 (8.6, 9.1) 10.8 (10.6, 11.1)
Atrial fibrillation 8.6 (8.3, 9.0) 13.4 (13.1, 13.7)
Rheumatoid arthritis 8.3 (8.0, 8.5) 10.8 (10.5, 11.0)
Diabetes (type 1) 8.1 (7.8, 8.4) 9.0 (8.7, 9.4)
GORD 7.9 (7.7, 8.1) 9.6 (9.3, 9.8)
Anxiety disorder 7.8 (7.6, 7.9) 8.0 (7.9, 8.2)
Low back pain 7.7 (7.6, 7.9) 8.9 (8.7, 9.1)
Migraine 7.6 (7.4, 7.7) 7.9 (7.7, 8.0)
Depression 7.5 (7.3, 7.7) 8.4 (8.2, 8.6)
Dyslipidaemia 7.5 (7.3, 7.6) 8.9 (8.8, 9.1)
Breast cancer 7.4 (6.7, 8.1) 9.6 (9.4, 9.8)
Hypertension 7.4 (7.3, 7.5) 9.3 (9.1, 9.5)
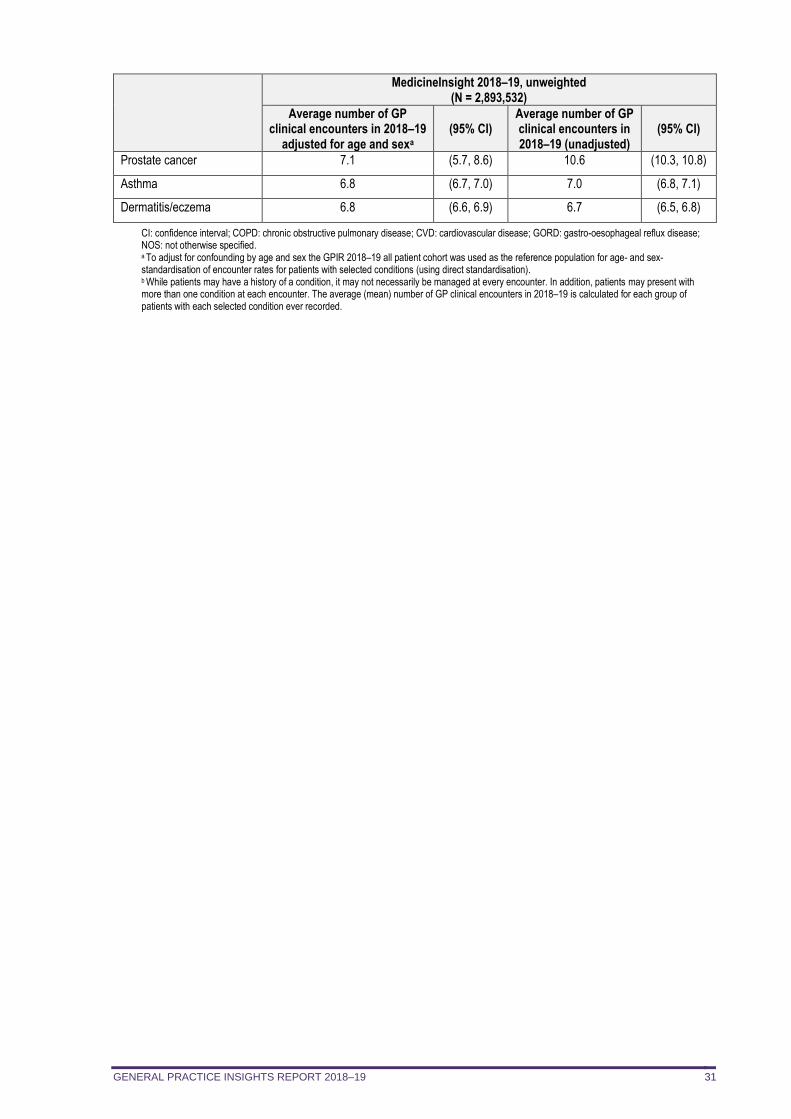
GENERAL PRACTICE INSIGHTS REPORT 2018–19 31
MedicineInsight 2018–19, unweighted (N = 2,893,532)
Average number of GP clinical encounters in 2018–19
adjusted for age and sexa (95% CI)
Average number of GP clinical encounters in 2018–19 (unadjusted)
(95% CI)
Prostate cancer 7.1 (5.7, 8.6) 10.6 (10.3, 10.8)
Asthma 6.8 (6.7, 7.0) 7.0 (6.8, 7.1)
Dermatitis/eczema 6.8 (6.6, 6.9) 6.7 (6.5, 6.8)
CI: confidence interval; COPD: chronic obstructive pulmonary disease; CVD: cardiovascular disease; GORD: gastro-oesophageal reflux disease; NOS: not otherwise specified. a To adjust for confounding by age and sex the GPIR 2018–19 all patient cohort was used as the reference population for age- and sex-standardisation of encounter rates for patients with selected conditions (using direct standardisation). b While patients may have a history of a condition, it may not necessarily be managed at every encounter. In addition, patients may present with more than one condition at each encounter. The average (mean) number of GP clinical encounters in 2018–19 is calculated for each group of patients with each selected condition ever recorded.
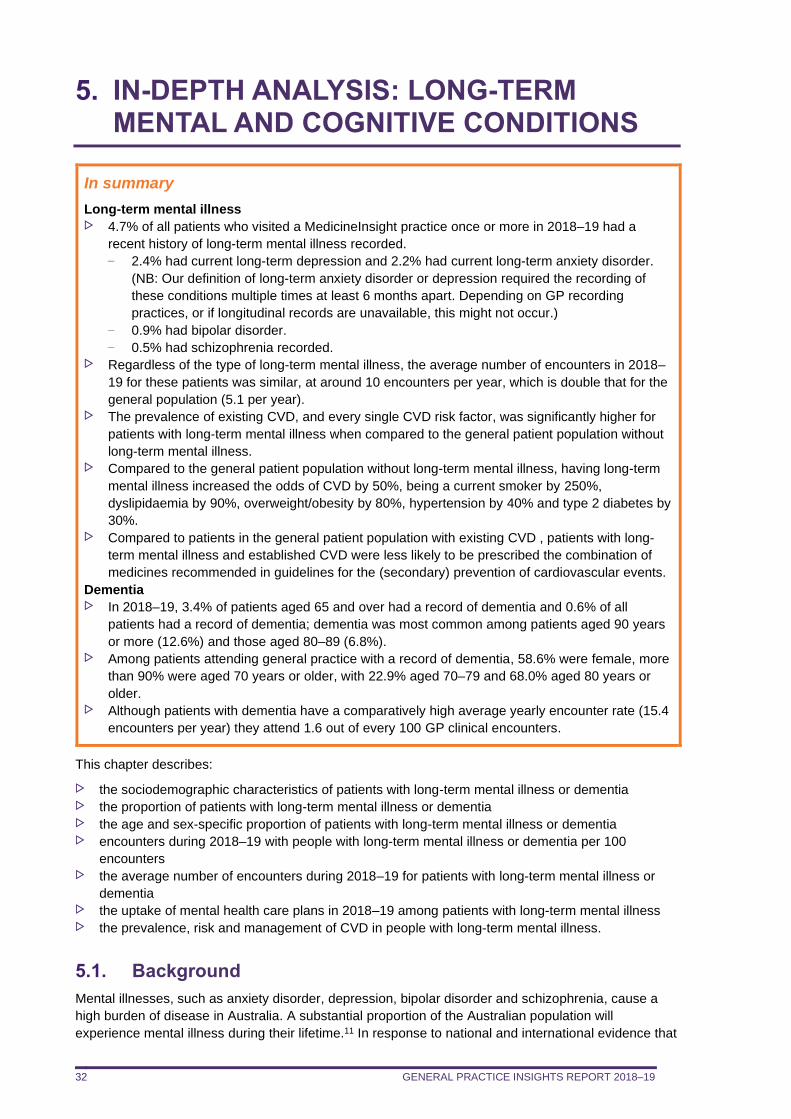
GENERAL PRACTICE INSIGHTS REPORT 2018–19 32
5. IN-DEPTH ANALYSIS: LONG-TERM MENTAL AND COGNITIVE CONDITIONS
In summary
Long-term mental illness 4.7% of all patients who visited a MedicineInsight practice once or more in 2018–19 had a
recent history of long-term mental illness recorded.
– 2.4% had current long-term depression and 2.2% had current long-term anxiety disorder.
(NB: Our definition of long-term anxiety disorder or depression required the recording of
these conditions multiple times at least 6 months apart. Depending on GP recording
practices, or if longitudinal records are unavailable, this might not occur.)
– 0.9% had bipolar disorder.
– 0.5% had schizophrenia recorded. Regardless of the type of long-term mental illness, the average number of encounters in 2018–
19 for these patients was similar, at around 10 encounters per year, which is double that for the
general population (5.1 per year). The prevalence of existing CVD, and every single CVD risk factor, was significantly higher for
patients with long-term mental illness when compared to the general patient population without
long-term mental illness. Compared to the general patient population without long-term mental illness, having long-term
mental illness increased the odds of CVD by 50%, being a current smoker by 250%,
dyslipidaemia by 90%, overweight/obesity by 80%, hypertension by 40% and type 2 diabetes by
30%. Compared to patients in the general patient population with existing CVD , patients with long-
term mental illness and established CVD were less likely to be prescribed the combination of
medicines recommended in guidelines for the (secondary) prevention of cardiovascular events.
Dementia In 2018–19, 3.4% of patients aged 65 and over had a record of dementia and 0.6% of all
patients had a record of dementia; dementia was most common among patients aged 90 years
or more (12.6%) and those aged 80–89 (6.8%). Among patients attending general practice with a record of dementia, 58.6% were female, more
than 90% were aged 70 years or older, with 22.9% aged 70–79 and 68.0% aged 80 years or
older. Although patients with dementia have a comparatively high average yearly encounter rate (15.4
encounters per year) they attend 1.6 out of every 100 GP clinical encounters.
This chapter describes:
the sociodemographic characteristics of patients with long-term mental illness or dementia the proportion of patients with long-term mental illness or dementia the age and sex-specific proportion of patients with long-term mental illness or dementia encounters during 2018–19 with people with long-term mental illness or dementia per 100
encounters the average number of encounters during 2018–19 for patients with long-term mental illness or
dementia the uptake of mental health care plans in 2018–19 among patients with long-term mental illness the prevalence, risk and management of CVD in people with long-term mental illness.
5.1. Background
Mental illnesses, such as anxiety disorder, depression, bipolar disorder and schizophrenia, cause a
high burden of disease in Australia. A substantial proportion of the Australian population will
experience mental illness during their lifetime.11 In response to national and international evidence that
GENERAL PRACTICE INSIGHTS REPORT 2018–19 33
people with mental illness have poorer physical health and lower life expectancies than those without,
the Fifth National Mental Health Plan identified improving the physical health of people with mental
illness as one of its key priorities.12
Among MedicineInsight patients, depression and anxiety disorder were the second and third most
commonly recorded conditions, respectively, in 2018–19 (see Chapter 4) and in the 2017–18 GPIR
report.2 This is consistent with the RACGP 2019 Health of the Nation report, in which GPs identified
psychological conditions as the most commonly managed class of conditions.7
This chapter describes the characteristics of patients with current long-term mental illness, including
how often they visit a GP and their uptake of mental health care plans. In addition, it explores the
burden of CVD – the leading cause of death and disease burden in Australia – for patients with long-
term mental illness. More than a quarter of 1825 Australian patients in the 2010 Survey of High Impact
Psychosis (SHIP) reported having a cardiovascular condition,13 however recent information and
estimates for Australian patients with other mental illnesses are lacking.
Dementia is a syndrome caused by a number of underlying diseases – most commonly Alzheimer
disease, vascular disease, or Lewy body disease. Dementia gradually impairs brain function and
affects memory, thinking, behaviour, communication and a person’s ability to perform activities of daily
living.
The most recent national data on the prevalence of dementia in Australia is from the ABS Survey of
Disability, Aging and Carers Report 2018. They found 3.1% of the population aged 65 years or over
had dementia.14 This is lower than prior estimates from the AIHW, based on international data and
modelling, that predicted 8.7% of people aged 65 and over in Australia had dementia in 2018.11
This chapter also quantifies the proportion of general practice patients recorded as having dementia,
describes their sociodemographic characteristics and how often they visit, or are visited by, a GP.
5.2. Identifying patients with long-term mental illness or dementia
This analysis included patients with dementia (ever recorded) or any of the following four categories of
severe or current long-term mental illness.
Long-term anxiety disorder (two records or more, at least six months apart over two consecutive
years between 1 July 2016 and 30 June 2019). Long-term depression (two records or more, at least six months apart over two consecutive years
between 1 July 2016 and 30 June 2019); Bipolar disorder (ever recorded). Schizophrenia (ever recorded).
Due to the nature of routinely collected data, information on whether a patient had mild, moderate or
severe depression or anxiety disorder was often missing. For this reason, we used duration of illness
to define the cohort of patients with recent long-term mental illness. Detailed definitions of the
conditions are provided in Appendix 5.
Figure 5.1 displays the study selection flow chart for patients with long-term mental illness or
dementia. Among the unweighted GPIR population there were 144,629 patients (5.0%) with long-term
mental illness and 16,979 (0.6%) with dementia.
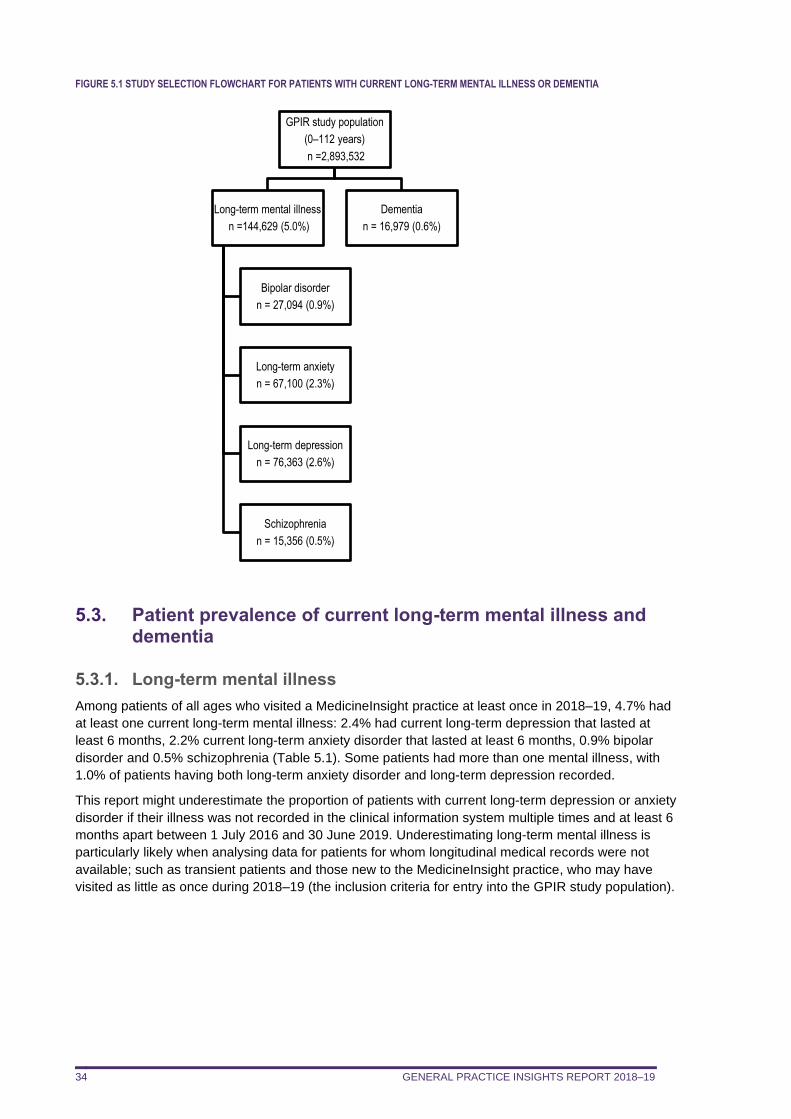
GENERAL PRACTICE INSIGHTS REPORT 2018–19 34
FIGURE 5.1 STUDY SELECTION FLOWCHART FOR PATIENTS WITH CURRENT LONG-TERM MENTAL ILLNESS OR DEMENTIA
5.3. Patient prevalence of current long-term mental illness and dementia
5.3.1. Long-term mental illness
Among patients of all ages who visited a MedicineInsight practice at least once in 2018–19, 4.7% had
at least one current long-term mental illness: 2.4% had current long-term depression that lasted at
least 6 months, 2.2% current long-term anxiety disorder that lasted at least 6 months, 0.9% bipolar
disorder and 0.5% schizophrenia (Table 5.1). Some patients had more than one mental illness, with
1.0% of patients having both long-term anxiety disorder and long-term depression recorded.
This report might underestimate the proportion of patients with current long-term depression or anxiety
disorder if their illness was not recorded in the clinical information system multiple times and at least 6
months apart between 1 July 2016 and 30 June 2019. Underestimating long-term mental illness is
particularly likely when analysing data for patients for whom longitudinal medical records were not
available; such as transient patients and those new to the MedicineInsight practice, who may have
visited as little as once during 2018–19 (the inclusion criteria for entry into the GPIR study population).
GPIR study population
(0–112 years)
n =2,893,532
Long-term mental illness
n =144,629 (5.0%)
Bipolar disorder
n = 27,094 (0.9%)
Long-term anxiety
n = 67,100 (2.3%)
Long-term depression
n = 76,363 (2.6%)
Schizophrenia
n = 15,356 (0.5%)
Dementia
n = 16,979 (0.6%)
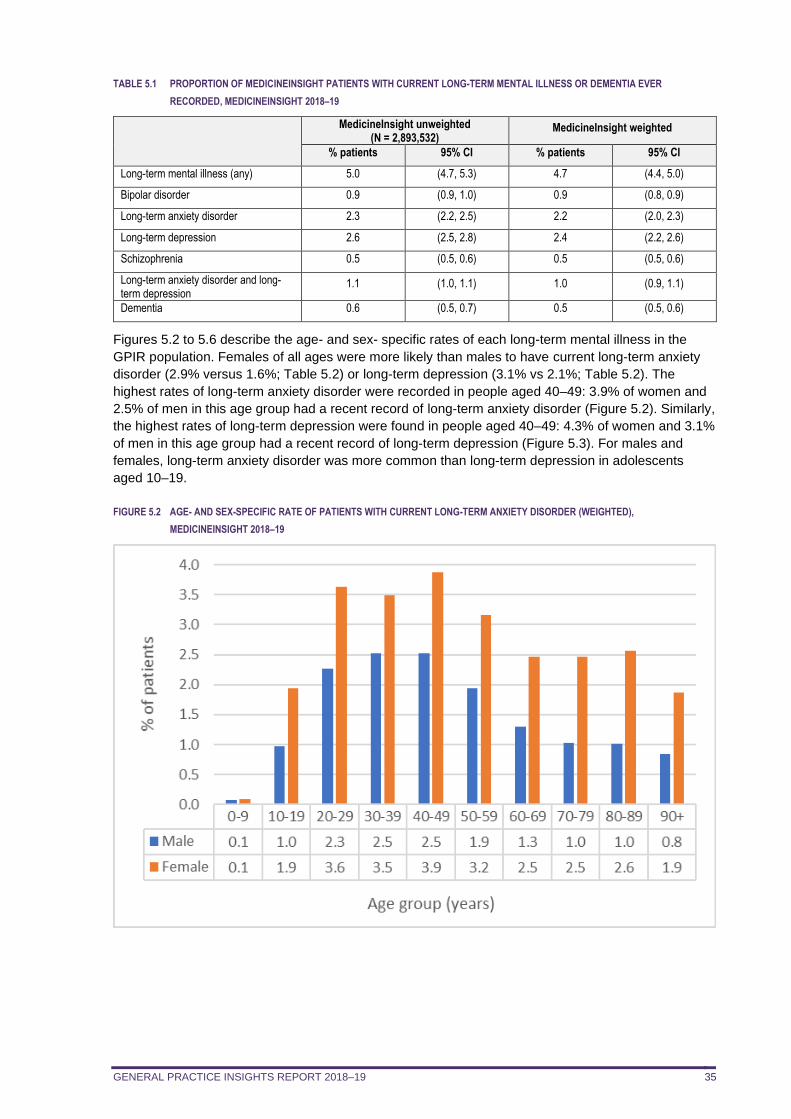
GENERAL PRACTICE INSIGHTS REPORT 2018–19 35
TABLE 5.1 PROPORTION OF MEDICINEINSIGHT PATIENTS WITH CURRENT LONG-TERM MENTAL ILLNESS OR DEMENTIA EVER
RECORDED, MEDICINEINSIGHT 2018–19
MedicineInsight unweighted (N = 2,893,532)
MedicineInsight weighted
% patients 95% CI % patients 95% CI
Long-term mental illness (any) 5.0 (4.7, 5.3) 4.7 (4.4, 5.0)
Bipolar disorder 0.9 (0.9, 1.0) 0.9 (0.8, 0.9)
Long-term anxiety disorder 2.3 (2.2, 2.5) 2.2 (2.0, 2.3)
Long-term depression 2.6 (2.5, 2.8) 2.4 (2.2, 2.6)
Schizophrenia 0.5 (0.5, 0.6) 0.5 (0.5, 0.6)
Long-term anxiety disorder and long-term depression
1.1 (1.0, 1.1) 1.0 (0.9, 1.1)
Dementia 0.6 (0.5, 0.7) 0.5 (0.5, 0.6)
Figures 5.2 to 5.6 describe the age- and sex- specific rates of each long-term mental illness in the
GPIR population. Females of all ages were more likely than males to have current long-term anxiety
disorder (2.9% versus 1.6%; Table 5.2) or long-term depression (3.1% vs 2.1%; Table 5.2). The
highest rates of long-term anxiety disorder were recorded in people aged 40–49: 3.9% of women and
2.5% of men in this age group had a recent record of long-term anxiety disorder (Figure 5.2). Similarly,
the highest rates of long-term depression were found in people aged 40–49: 4.3% of women and 3.1%
of men in this age group had a recent record of long-term depression (Figure 5.3). For males and
females, long-term anxiety disorder was more common than long-term depression in adolescents
aged 10–19.
FIGURE 5.2 AGE- AND SEX-SPECIFIC RATE OF PATIENTS WITH CURRENT LONG-TERM ANXIETY DISORDER (WEIGHTED),
MEDICINEINSIGHT 2018–19
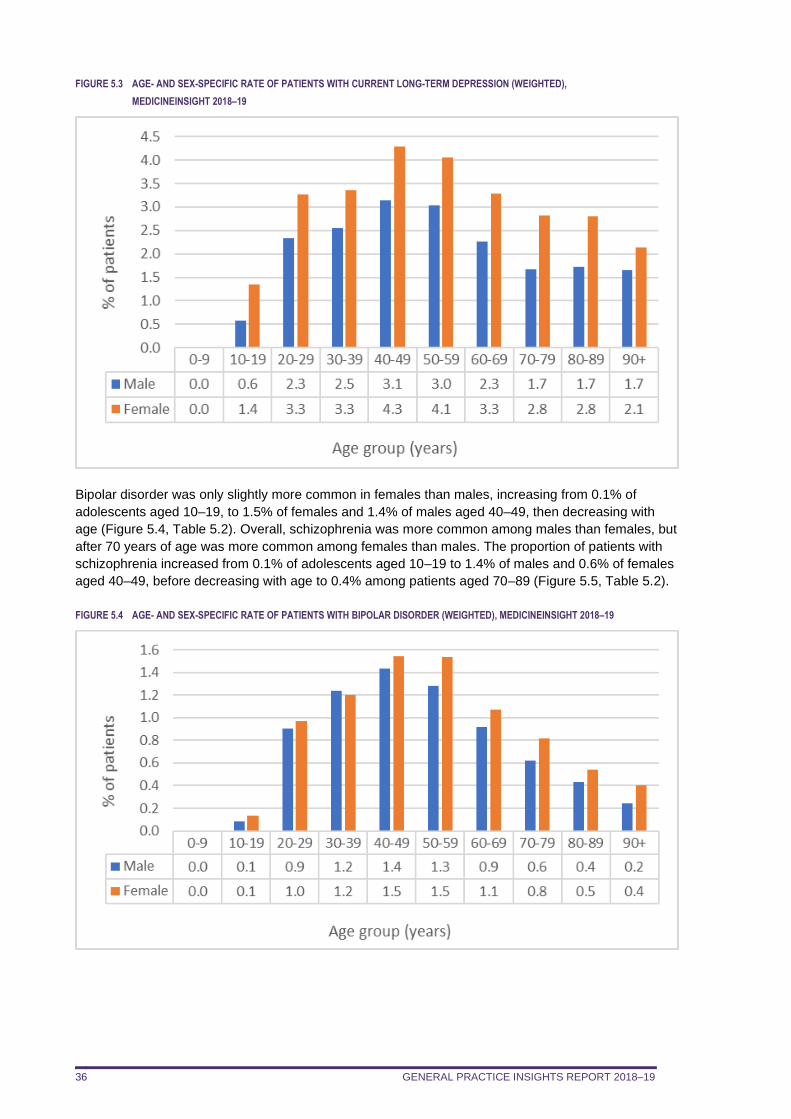
GENERAL PRACTICE INSIGHTS REPORT 2018–19 36
FIGURE 5.3 AGE- AND SEX-SPECIFIC RATE OF PATIENTS WITH CURRENT LONG-TERM DEPRESSION (WEIGHTED),
MEDICINEINSIGHT 2018–19
Bipolar disorder was only slightly more common in females than males, increasing from 0.1% of
adolescents aged 10–19, to 1.5% of females and 1.4% of males aged 40–49, then decreasing with
age (Figure 5.4, Table 5.2). Overall, schizophrenia was more common among males than females, but
after 70 years of age was more common among females than males. The proportion of patients with
schizophrenia increased from 0.1% of adolescents aged 10–19 to 1.4% of males and 0.6% of females
aged 40–49, before decreasing with age to 0.4% among patients aged 70–89 (Figure 5.5, Table 5.2).
FIGURE 5.4 AGE- AND SEX-SPECIFIC RATE OF PATIENTS WITH BIPOLAR DISORDER (WEIGHTED), MEDICINEINSIGHT 2018–19
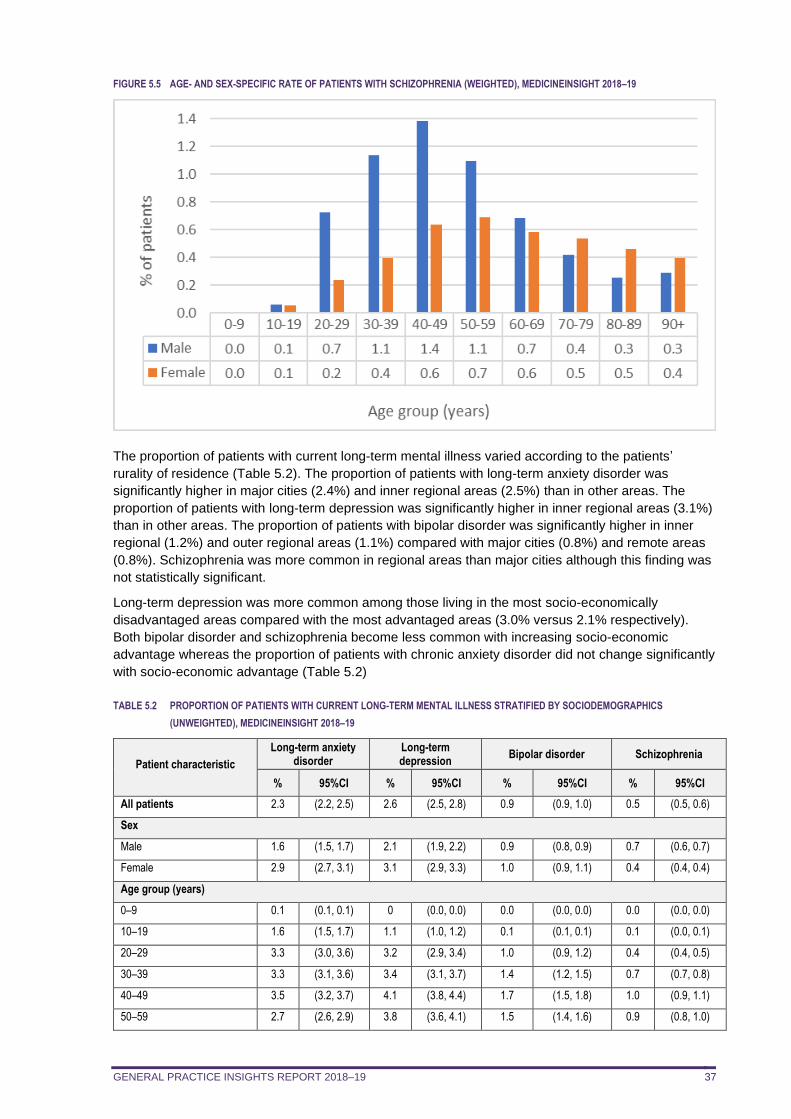
GENERAL PRACTICE INSIGHTS REPORT 2018–19 37
FIGURE 5.5 AGE- AND SEX-SPECIFIC RATE OF PATIENTS WITH SCHIZOPHRENIA (WEIGHTED), MEDICINEINSIGHT 2018–19
The proportion of patients with current long-term mental illness varied according to the patients’
rurality of residence (Table 5.2). The proportion of patients with long-term anxiety disorder was
significantly higher in major cities (2.4%) and inner regional areas (2.5%) than in other areas. The
proportion of patients with long-term depression was significantly higher in inner regional areas (3.1%)
than in other areas. The proportion of patients with bipolar disorder was significantly higher in inner
regional (1.2%) and outer regional areas (1.1%) compared with major cities (0.8%) and remote areas
(0.8%). Schizophrenia was more common in regional areas than major cities although this finding was
not statistically significant.
Long-term depression was more common among those living in the most socio-economically
disadvantaged areas compared with the most advantaged areas (3.0% versus 2.1% respectively).
Both bipolar disorder and schizophrenia become less common with increasing socio-economic
advantage whereas the proportion of patients with chronic anxiety disorder did not change significantly
with socio-economic advantage (Table 5.2)
TABLE 5.2 PROPORTION OF PATIENTS WITH CURRENT LONG-TERM MENTAL ILLNESS STRATIFIED BY SOCIODEMOGRAPHICS
(UNWEIGHTED), MEDICINEINSIGHT 2018–19
Patient characteristic
Long-term anxiety disorder
Long-term depression
Bipolar disorder Schizophrenia
% 95%CI % 95%CI % 95%CI % 95%CI
All patients 2.3 (2.2, 2.5) 2.6 (2.5, 2.8) 0.9 (0.9, 1.0) 0.5 (0.5, 0.6)
Sex
Male 1.6 (1.5, 1.7) 2.1 (1.9, 2.2) 0.9 (0.8, 0.9) 0.7 (0.6, 0.7)
Female 2.9 (2.7, 3.1) 3.1 (2.9, 3.3) 1.0 (0.9, 1.1) 0.4 (0.4, 0.4)
Age group (years)
0–9 0.1 (0.1, 0.1) 0 (0.0, 0.0) 0.0 (0.0, 0.0) 0.0 (0.0, 0.0)
10–19 1.6 (1.5, 1.7) 1.1 (1.0, 1.2) 0.1 (0.1, 0.1) 0.1 (0.0, 0.1)
20–29 3.3 (3.0, 3.6) 3.2 (2.9, 3.4) 1.0 (0.9, 1.2) 0.4 (0.4, 0.5)
30–39 3.3 (3.1, 3.6) 3.4 (3.1, 3.7) 1.4 (1.2, 1.5) 0.7 (0.7, 0.8)
40–49 3.5 (3.2, 3.7) 4.1 (3.8, 4.4) 1.7 (1.5, 1.8) 1.0 (0.9, 1.1)
50–59 2.7 (2.6, 2.9) 3.8 (3.6, 4.1) 1.5 (1.4, 1.6) 0.9 (0.8, 1.0)
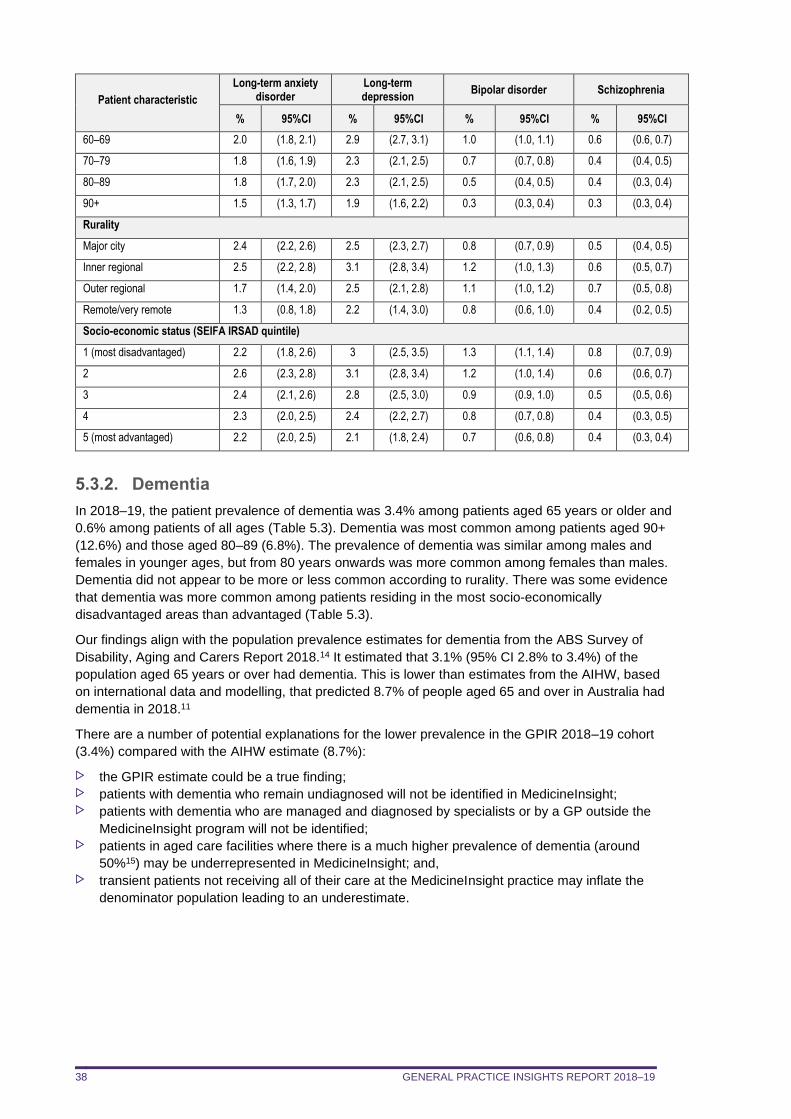
GENERAL PRACTICE INSIGHTS REPORT 2018–19 38
Patient characteristic
Long-term anxiety disorder
Long-term depression
Bipolar disorder Schizophrenia
% 95%CI % 95%CI % 95%CI % 95%CI
60–69 2.0 (1.8, 2.1) 2.9 (2.7, 3.1) 1.0 (1.0, 1.1) 0.6 (0.6, 0.7)
70–79 1.8 (1.6, 1.9) 2.3 (2.1, 2.5) 0.7 (0.7, 0.8) 0.4 (0.4, 0.5)
80–89 1.8 (1.7, 2.0) 2.3 (2.1, 2.5) 0.5 (0.4, 0.5) 0.4 (0.3, 0.4)
90+ 1.5 (1.3, 1.7) 1.9 (1.6, 2.2) 0.3 (0.3, 0.4) 0.3 (0.3, 0.4)
Rurality
Major city 2.4 (2.2, 2.6) 2.5 (2.3, 2.7) 0.8 (0.7, 0.9) 0.5 (0.4, 0.5)
Inner regional 2.5 (2.2, 2.8) 3.1 (2.8, 3.4) 1.2 (1.0, 1.3) 0.6 (0.5, 0.7)
Outer regional 1.7 (1.4, 2.0) 2.5 (2.1, 2.8) 1.1 (1.0, 1.2) 0.7 (0.5, 0.8)
Remote/very remote 1.3 (0.8, 1.8) 2.2 (1.4, 3.0) 0.8 (0.6, 1.0) 0.4 (0.2, 0.5)
Socio-economic status (SEIFA IRSAD quintile)
1 (most disadvantaged) 2.2 (1.8, 2.6) 3 (2.5, 3.5) 1.3 (1.1, 1.4) 0.8 (0.7, 0.9)
2 2.6 (2.3, 2.8) 3.1 (2.8, 3.4) 1.2 (1.0, 1.4) 0.6 (0.6, 0.7)
3 2.4 (2.1, 2.6) 2.8 (2.5, 3.0) 0.9 (0.9, 1.0) 0.5 (0.5, 0.6)
4 2.3 (2.0, 2.5) 2.4 (2.2, 2.7) 0.8 (0.7, 0.8) 0.4 (0.3, 0.5)
5 (most advantaged) 2.2 (2.0, 2.5) 2.1 (1.8, 2.4) 0.7 (0.6, 0.8) 0.4 (0.3, 0.4)
5.3.2. Dementia
In 2018–19, the patient prevalence of dementia was 3.4% among patients aged 65 years or older and
0.6% among patients of all ages (Table 5.3). Dementia was most common among patients aged 90+
(12.6%) and those aged 80–89 (6.8%). The prevalence of dementia was similar among males and
females in younger ages, but from 80 years onwards was more common among females than males.
Dementia did not appear to be more or less common according to rurality. There was some evidence
that dementia was more common among patients residing in the most socio-economically
disadvantaged areas than advantaged (Table 5.3).
Our findings align with the population prevalence estimates for dementia from the ABS Survey of
Disability, Aging and Carers Report 2018.14 It estimated that 3.1% (95% CI 2.8% to 3.4%) of the
population aged 65 years or over had dementia. This is lower than estimates from the AIHW, based
on international data and modelling, that predicted 8.7% of people aged 65 and over in Australia had
dementia in 2018.11
There are a number of potential explanations for the lower prevalence in the GPIR 2018–19 cohort
(3.4%) compared with the AIHW estimate (8.7%):
the GPIR estimate could be a true finding; patients with dementia who remain undiagnosed will not be identified in MedicineInsight; patients with dementia who are managed and diagnosed by specialists or by a GP outside the
MedicineInsight program will not be identified; patients in aged care facilities where there is a much higher prevalence of dementia (around
50%15) may be underrepresented in MedicineInsight; and, transient patients not receiving all of their care at the MedicineInsight practice may inflate the
denominator population leading to an underestimate.
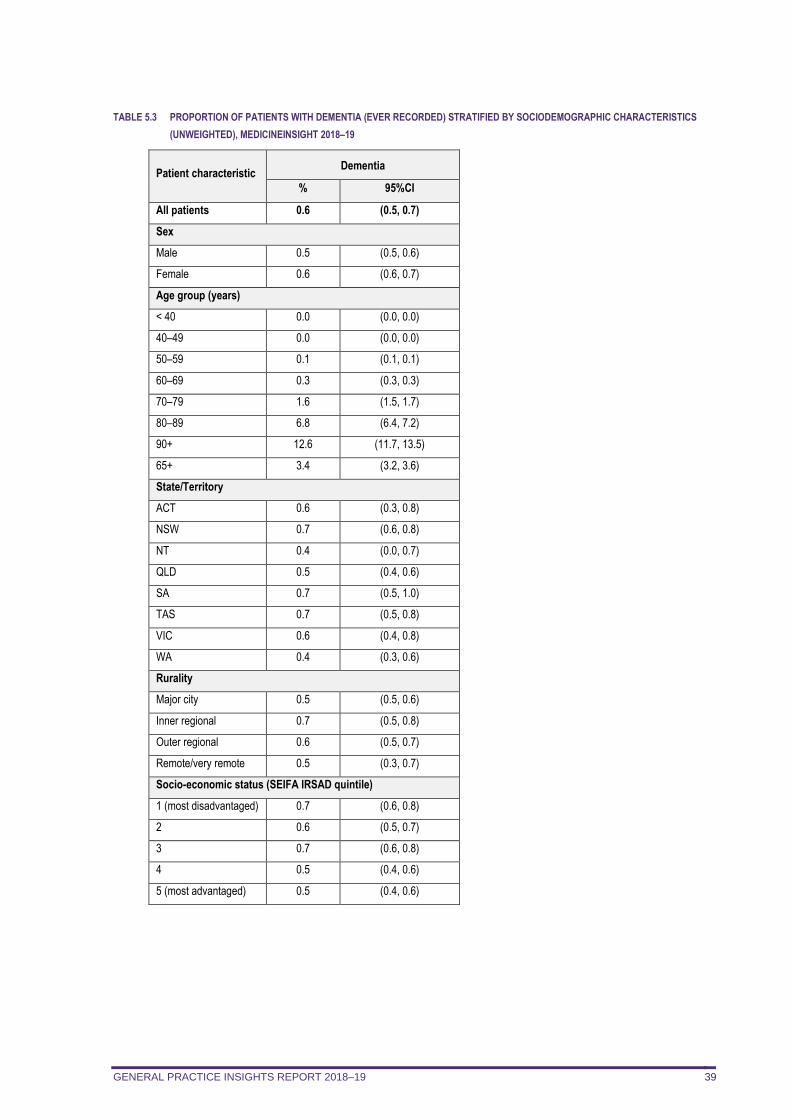
GENERAL PRACTICE INSIGHTS REPORT 2018–19 39
TABLE 5.3 PROPORTION OF PATIENTS WITH DEMENTIA (EVER RECORDED) STRATIFIED BY SOCIODEMOGRAPHIC CHARACTERISTICS
(UNWEIGHTED), MEDICINEINSIGHT 2018–19
Patient characteristic Dementia
% 95%CI
All patients 0.6 (0.5, 0.7)
Sex
Male 0.5 (0.5, 0.6)
Female 0.6 (0.6, 0.7)
Age group (years)
< 40 0.0 (0.0, 0.0)
40–49 0.0 (0.0, 0.0)
50–59 0.1 (0.1, 0.1)
60–69 0.3 (0.3, 0.3)
70–79 1.6 (1.5, 1.7)
80–89 6.8 (6.4, 7.2)
90+ 12.6 (11.7, 13.5)
65+ 3.4 (3.2, 3.6)
State/Territory
ACT 0.6 (0.3, 0.8)
NSW 0.7 (0.6, 0.8)
NT 0.4 (0.0, 0.7)
QLD 0.5 (0.4, 0.6)
SA 0.7 (0.5, 1.0)
TAS 0.7 (0.5, 0.8)
VIC 0.6 (0.4, 0.8)
WA 0.4 (0.3, 0.6)
Rurality
Major city 0.5 (0.5, 0.6)
Inner regional 0.7 (0.5, 0.8)
Outer regional 0.6 (0.5, 0.7)
Remote/very remote 0.5 (0.3, 0.7)
Socio-economic status (SEIFA IRSAD quintile)
1 (most disadvantaged) 0.7 (0.6, 0.8)
2 0.6 (0.5, 0.7)
3 0.7 (0.6, 0.8)
4 0.5 (0.4, 0.6)
5 (most advantaged) 0.5 (0.4, 0.6)
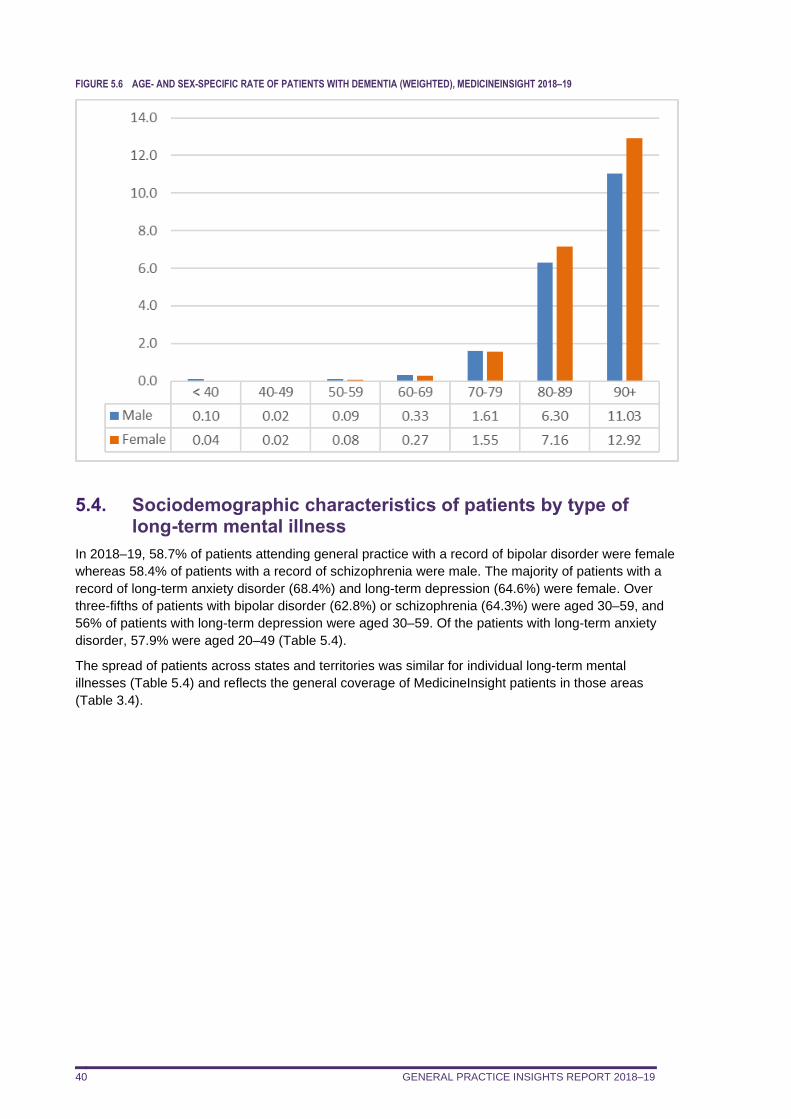
GENERAL PRACTICE INSIGHTS REPORT 2018–19 40
FIGURE 5.6 AGE- AND SEX-SPECIFIC RATE OF PATIENTS WITH DEMENTIA (WEIGHTED), MEDICINEINSIGHT 2018–19
5.4. Sociodemographic characteristics of patients by type of long-term mental illness
In 2018–19, 58.7% of patients attending general practice with a record of bipolar disorder were female
whereas 58.4% of patients with a record of schizophrenia were male. The majority of patients with a
record of long-term anxiety disorder (68.4%) and long-term depression (64.6%) were female. Over
three-fifths of patients with bipolar disorder (62.8%) or schizophrenia (64.3%) were aged 30–59, and
56% of patients with long-term depression were aged 30–59. Of the patients with long-term anxiety
disorder, 57.9% were aged 20–49 (Table 5.4).
The spread of patients across states and territories was similar for individual long-term mental
illnesses (Table 5.4) and reflects the general coverage of MedicineInsight patients in those areas
(Table 3.4).
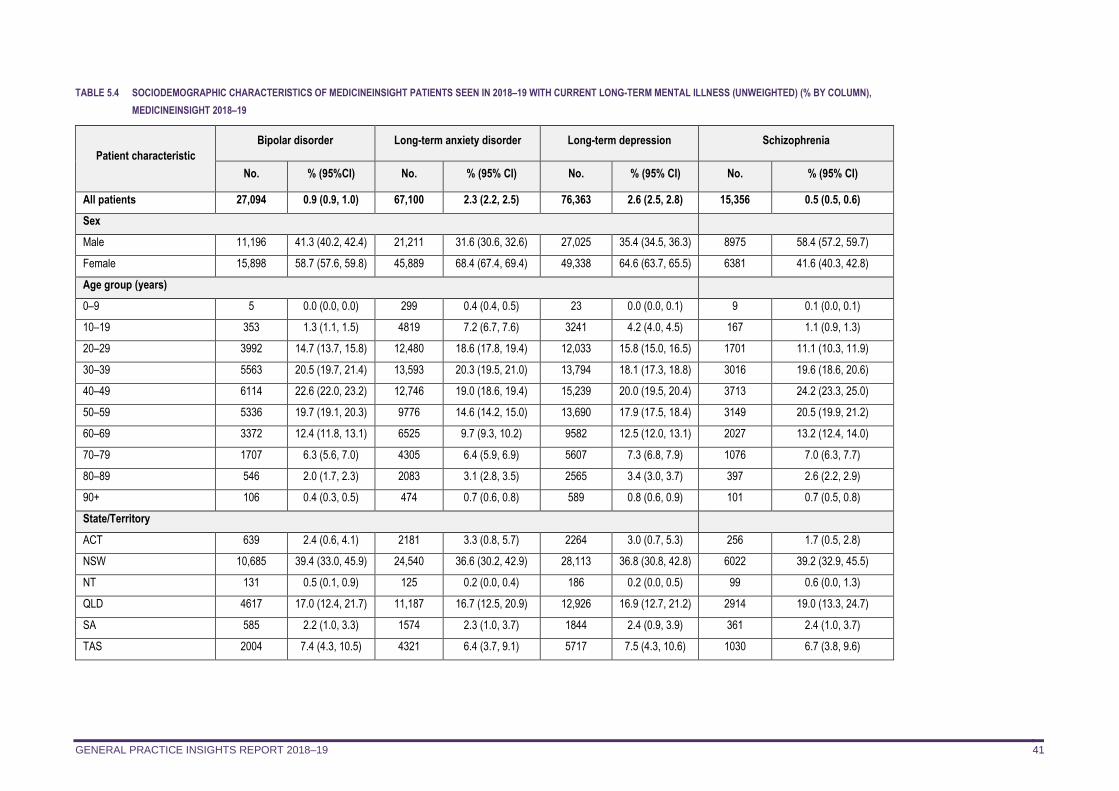
GENERAL PRACTICE INSIGHTS REPORT 2018–19 41
TABLE 5.4 SOCIODEMOGRAPHIC CHARACTERISTICS OF MEDICINEINSIGHT PATIENTS SEEN IN 2018–19 WITH CURRENT LONG-TERM MENTAL ILLNESS (UNWEIGHTED) (% BY COLUMN),
MEDICINEINSIGHT 2018–19
Patient characteristic
Bipolar disorder Long-term anxiety disorder Long-term depression Schizophrenia
No. % (95%CI) No. % (95% CI) No. % (95% CI) No. % (95% CI)
All patients 27,094 0.9 (0.9, 1.0) 67,100 2.3 (2.2, 2.5) 76,363 2.6 (2.5, 2.8) 15,356 0.5 (0.5, 0.6)
Sex
Male 11,196 41.3 (40.2, 42.4) 21,211 31.6 (30.6, 32.6) 27,025 35.4 (34.5, 36.3) 8975 58.4 (57.2, 59.7)
Female 15,898 58.7 (57.6, 59.8) 45,889 68.4 (67.4, 69.4) 49,338 64.6 (63.7, 65.5) 6381 41.6 (40.3, 42.8)
Age group (years)
0–9 5 0.0 (0.0, 0.0) 299 0.4 (0.4, 0.5) 23 0.0 (0.0, 0.1) 9 0.1 (0.0, 0.1)
10–19 353 1.3 (1.1, 1.5) 4819 7.2 (6.7, 7.6) 3241 4.2 (4.0, 4.5) 167 1.1 (0.9, 1.3)
20–29 3992 14.7 (13.7, 15.8) 12,480 18.6 (17.8, 19.4) 12,033 15.8 (15.0, 16.5) 1701 11.1 (10.3, 11.9)
30–39 5563 20.5 (19.7, 21.4) 13,593 20.3 (19.5, 21.0) 13,794 18.1 (17.3, 18.8) 3016 19.6 (18.6, 20.6)
40–49 6114 22.6 (22.0, 23.2) 12,746 19.0 (18.6, 19.4) 15,239 20.0 (19.5, 20.4) 3713 24.2 (23.3, 25.0)
50–59 5336 19.7 (19.1, 20.3) 9776 14.6 (14.2, 15.0) 13,690 17.9 (17.5, 18.4) 3149 20.5 (19.9, 21.2)
60–69 3372 12.4 (11.8, 13.1) 6525 9.7 (9.3, 10.2) 9582 12.5 (12.0, 13.1) 2027 13.2 (12.4, 14.0)
70–79 1707 6.3 (5.6, 7.0) 4305 6.4 (5.9, 6.9) 5607 7.3 (6.8, 7.9) 1076 7.0 (6.3, 7.7)
80–89 546 2.0 (1.7, 2.3) 2083 3.1 (2.8, 3.5) 2565 3.4 (3.0, 3.7) 397 2.6 (2.2, 2.9)
90+ 106 0.4 (0.3, 0.5) 474 0.7 (0.6, 0.8) 589 0.8 (0.6, 0.9) 101 0.7 (0.5, 0.8)
State/Territory
ACT 639 2.4 (0.6, 4.1) 2181 3.3 (0.8, 5.7) 2264 3.0 (0.7, 5.3) 256 1.7 (0.5, 2.8)
NSW 10,685 39.4 (33.0, 45.9) 24,540 36.6 (30.2, 42.9) 28,113 36.8 (30.8, 42.8) 6022 39.2 (32.9, 45.5)
NT 131 0.5 (0.1, 0.9) 125 0.2 (0.0, 0.4) 186 0.2 (0.0, 0.5) 99 0.6 (0.0, 1.3)
QLD 4617 17.0 (12.4, 21.7) 11,187 16.7 (12.5, 20.9) 12,926 16.9 (12.7, 21.2) 2914 19.0 (13.3, 24.7)
SA 585 2.2 (1.0, 3.3) 1574 2.3 (1.0, 3.7) 1844 2.4 (0.9, 3.9) 361 2.4 (1.0, 3.7)
TAS 2004 7.4 (4.3, 10.5) 4321 6.4 (3.7, 9.1) 5717 7.5 (4.3, 10.6) 1030 6.7 (3.8, 9.6)
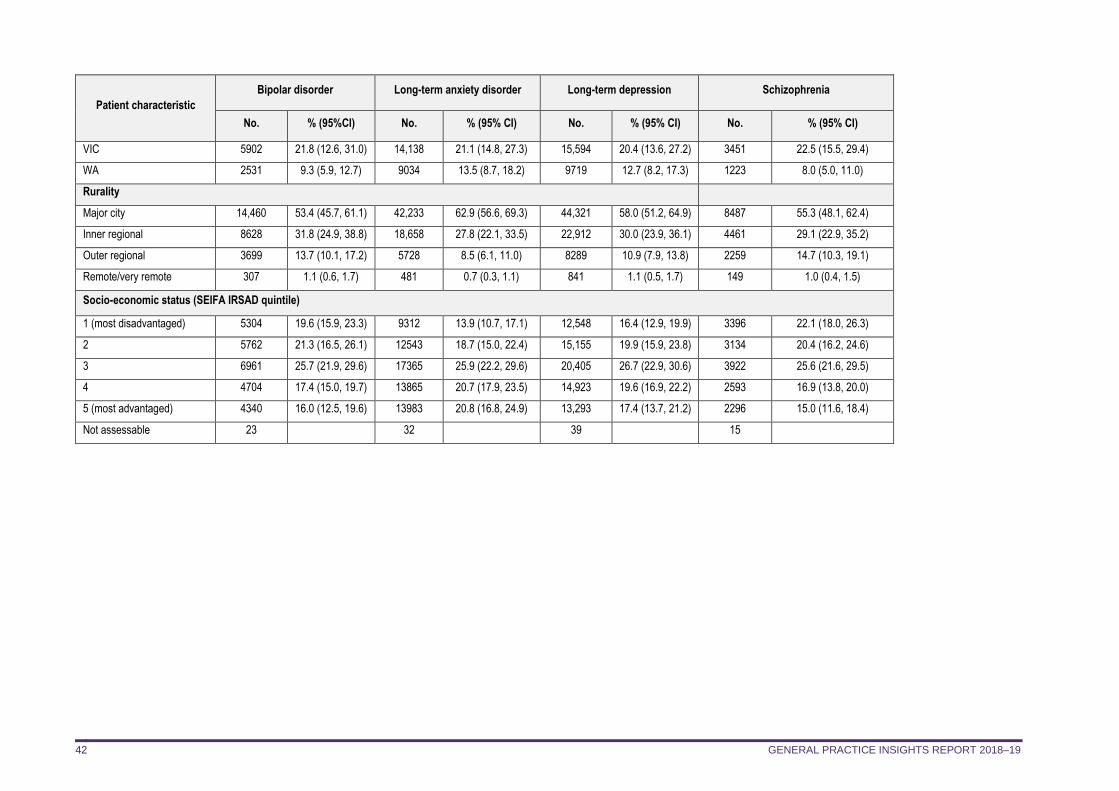
GENERAL PRACTICE INSIGHTS REPORT 2018–19 42
Patient characteristic
Bipolar disorder Long-term anxiety disorder Long-term depression Schizophrenia
No. % (95%CI) No. % (95% CI) No. % (95% CI) No. % (95% CI)
VIC 5902 21.8 (12.6, 31.0) 14,138 21.1 (14.8, 27.3) 15,594 20.4 (13.6, 27.2) 3451 22.5 (15.5, 29.4)
WA 2531 9.3 (5.9, 12.7) 9034 13.5 (8.7, 18.2) 9719 12.7 (8.2, 17.3) 1223 8.0 (5.0, 11.0)
Rurality
Major city 14,460 53.4 (45.7, 61.1) 42,233 62.9 (56.6, 69.3) 44,321 58.0 (51.2, 64.9) 8487 55.3 (48.1, 62.4)
Inner regional 8628 31.8 (24.9, 38.8) 18,658 27.8 (22.1, 33.5) 22,912 30.0 (23.9, 36.1) 4461 29.1 (22.9, 35.2)
Outer regional 3699 13.7 (10.1, 17.2) 5728 8.5 (6.1, 11.0) 8289 10.9 (7.9, 13.8) 2259 14.7 (10.3, 19.1)
Remote/very remote 307 1.1 (0.6, 1.7) 481 0.7 (0.3, 1.1) 841 1.1 (0.5, 1.7) 149 1.0 (0.4, 1.5)
Socio-economic status (SEIFA IRSAD quintile)
1 (most disadvantaged) 5304 19.6 (15.9, 23.3) 9312 13.9 (10.7, 17.1) 12,548 16.4 (12.9, 19.9) 3396 22.1 (18.0, 26.3)
2 5762 21.3 (16.5, 26.1) 12543 18.7 (15.0, 22.4) 15,155 19.9 (15.9, 23.8) 3134 20.4 (16.2, 24.6)
3 6961 25.7 (21.9, 29.6) 17365 25.9 (22.2, 29.6) 20,405 26.7 (22.9, 30.6) 3922 25.6 (21.6, 29.5)
4 4704 17.4 (15.0, 19.7) 13865 20.7 (17.9, 23.5) 14,923 19.6 (16.9, 22.2) 2593 16.9 (13.8, 20.0)
5 (most advantaged) 4340 16.0 (12.5, 19.6) 13983 20.8 (16.8, 24.9) 13,293 17.4 (13.7, 21.2) 2296 15.0 (11.6, 18.4)
Not assessable 23 32 39 15
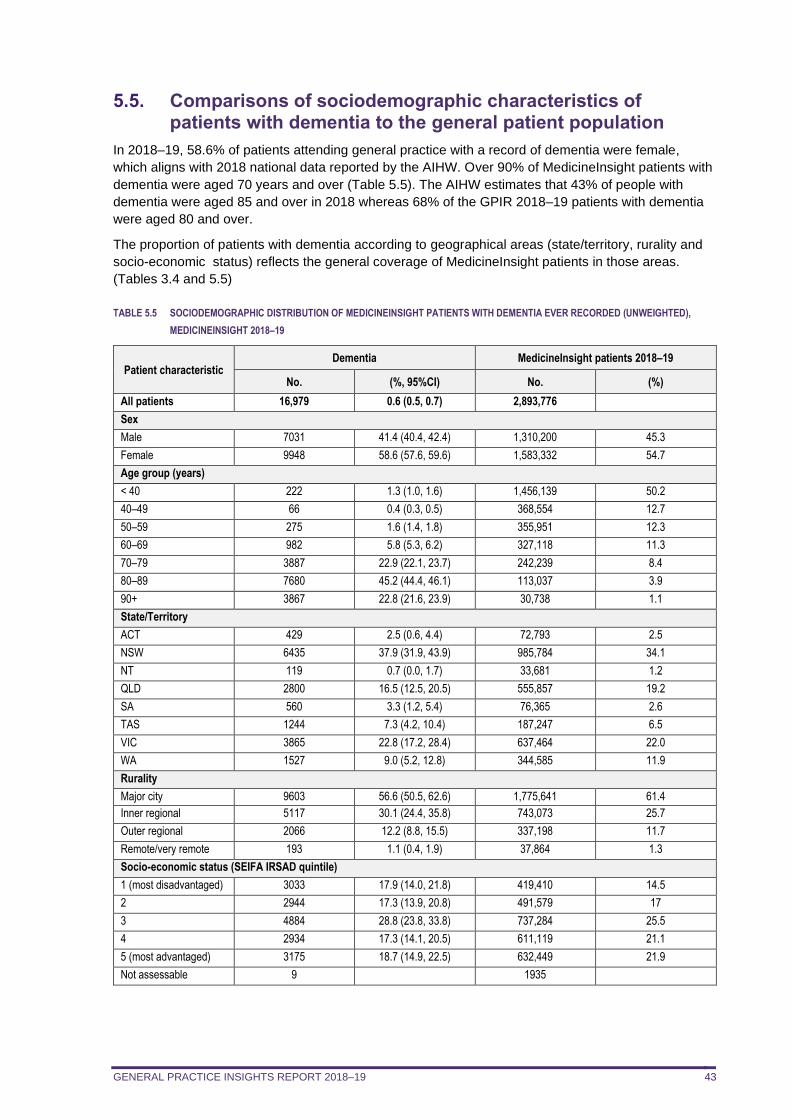
GENERAL PRACTICE INSIGHTS REPORT 2018–19 43
5.5. Comparisons of sociodemographic characteristics of patients with dementia to the general patient population
In 2018–19, 58.6% of patients attending general practice with a record of dementia were female,
which aligns with 2018 national data reported by the AIHW. Over 90% of MedicineInsight patients with
dementia were aged 70 years and over (Table 5.5). The AIHW estimates that 43% of people with
dementia were aged 85 and over in 2018 whereas 68% of the GPIR 2018–19 patients with dementia
were aged 80 and over.
The proportion of patients with dementia according to geographical areas (state/territory, rurality and
socio-economic status) reflects the general coverage of MedicineInsight patients in those areas.
(Tables 3.4 and 5.5)
TABLE 5.5 SOCIODEMOGRAPHIC DISTRIBUTION OF MEDICINEINSIGHT PATIENTS WITH DEMENTIA EVER RECORDED (UNWEIGHTED),
MEDICINEINSIGHT 2018–19
Patient characteristic Dementia MedicineInsight patients 2018–19
No. (%, 95%CI) No. (%)
All patients 16,979 0.6 (0.5, 0.7) 2,893,776
Sex
Male 7031 41.4 (40.4, 42.4) 1,310,200 45.3
Female 9948 58.6 (57.6, 59.6) 1,583,332 54.7
Age group (years)
< 40 222 1.3 (1.0, 1.6) 1,456,139 50.2
40–49 66 0.4 (0.3, 0.5) 368,554 12.7
50–59 275 1.6 (1.4, 1.8) 355,951 12.3
60–69 982 5.8 (5.3, 6.2) 327,118 11.3
70–79 3887 22.9 (22.1, 23.7) 242,239 8.4
80–89 7680 45.2 (44.4, 46.1) 113,037 3.9
90+ 3867 22.8 (21.6, 23.9) 30,738 1.1
State/Territory
ACT 429 2.5 (0.6, 4.4) 72,793 2.5
NSW 6435 37.9 (31.9, 43.9) 985,784 34.1
NT 119 0.7 (0.0, 1.7) 33,681 1.2
QLD 2800 16.5 (12.5, 20.5) 555,857 19.2
SA 560 3.3 (1.2, 5.4) 76,365 2.6
TAS 1244 7.3 (4.2, 10.4) 187,247 6.5
VIC 3865 22.8 (17.2, 28.4) 637,464 22.0
WA 1527 9.0 (5.2, 12.8) 344,585 11.9
Rurality
Major city 9603 56.6 (50.5, 62.6) 1,775,641 61.4
Inner regional 5117 30.1 (24.4, 35.8) 743,073 25.7
Outer regional 2066 12.2 (8.8, 15.5) 337,198 11.7
Remote/very remote 193 1.1 (0.4, 1.9) 37,864 1.3
Socio-economic status (SEIFA IRSAD quintile)
1 (most disadvantaged) 3033 17.9 (14.0, 21.8) 419,410 14.5
2 2944 17.3 (13.9, 20.8) 491,579 17
3 4884 28.8 (23.8, 33.8) 737,284 25.5
4 2934 17.3 (14.1, 20.5) 611,119 21.1
5 (most advantaged) 3175 18.7 (14.9, 22.5) 632,449 21.9
Not assessable 9 1935
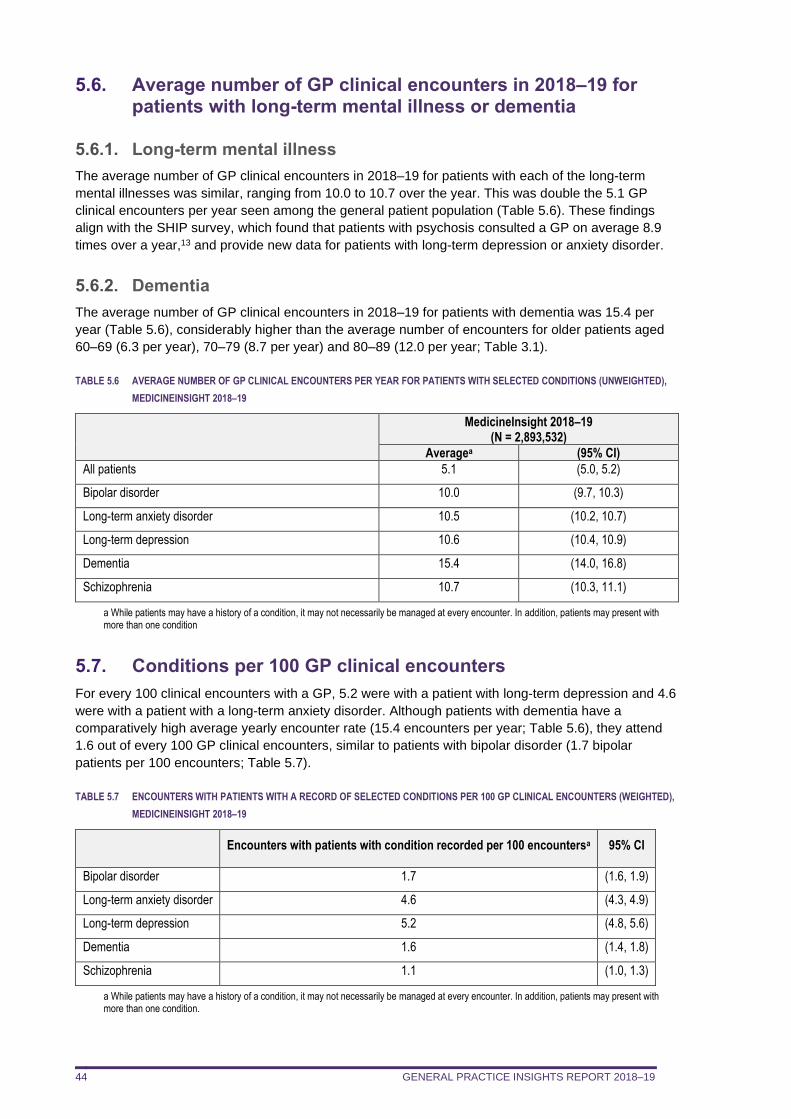
GENERAL PRACTICE INSIGHTS REPORT 2018–19 44
5.6. Average number of GP clinical encounters in 2018–19 for patients with long-term mental illness or dementia
5.6.1. Long-term mental illness
The average number of GP clinical encounters in 2018–19 for patients with each of the long-term
mental illnesses was similar, ranging from 10.0 to 10.7 over the year. This was double the 5.1 GP
clinical encounters per year seen among the general patient population (Table 5.6). These findings
align with the SHIP survey, which found that patients with psychosis consulted a GP on average 8.9
times over a year,13 and provide new data for patients with long-term depression or anxiety disorder.
5.6.2. Dementia
The average number of GP clinical encounters in 2018–19 for patients with dementia was 15.4 per
year (Table 5.6), considerably higher than the average number of encounters for older patients aged
60–69 (6.3 per year), 70–79 (8.7 per year) and 80–89 (12.0 per year; Table 3.1).
TABLE 5.6 AVERAGE NUMBER OF GP CLINICAL ENCOUNTERS PER YEAR FOR PATIENTS WITH SELECTED CONDITIONS (UNWEIGHTED),
MEDICINEINSIGHT 2018–19
MedicineInsight 2018–19 (N = 2,893,532)
Averagea (95% CI)
All patients 5.1 (5.0, 5.2)
Bipolar disorder 10.0 (9.7, 10.3)
Long-term anxiety disorder 10.5 (10.2, 10.7)
Long-term depression 10.6 (10.4, 10.9)
Dementia 15.4 (14.0, 16.8)
Schizophrenia 10.7 (10.3, 11.1)
a While patients may have a history of a condition, it may not necessarily be managed at every encounter. In addition, patients may present with more than one condition
5.7. Conditions per 100 GP clinical encounters
For every 100 clinical encounters with a GP, 5.2 were with a patient with long-term depression and 4.6
were with a patient with a long-term anxiety disorder. Although patients with dementia have a
comparatively high average yearly encounter rate (15.4 encounters per year; Table 5.6), they attend
1.6 out of every 100 GP clinical encounters, similar to patients with bipolar disorder (1.7 bipolar
patients per 100 encounters; Table 5.7).
TABLE 5.7 ENCOUNTERS WITH PATIENTS WITH A RECORD OF SELECTED CONDITIONS PER 100 GP CLINICAL ENCOUNTERS (WEIGHTED),
MEDICINEINSIGHT 2018–19
Encounters with patients with condition recorded per 100 encountersa 95% CI
Bipolar disorder 1.7 (1.6, 1.9)
Long-term anxiety disorder 4.6 (4.3, 4.9)
Long-term depression 5.2 (4.8, 5.6)
Dementia 1.6 (1.4, 1.8)
Schizophrenia 1.1 (1.0, 1.3)
a While patients may have a history of a condition, it may not necessarily be managed at every encounter. In addition, patients may present with more than one condition.
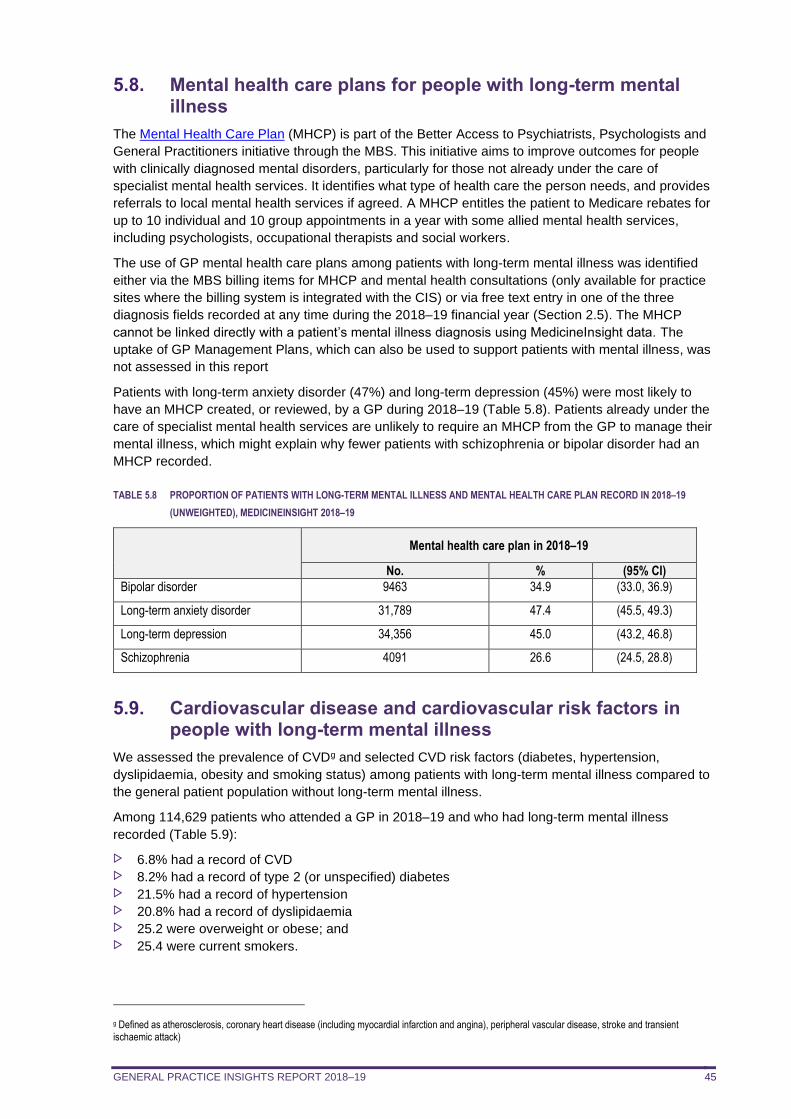
GENERAL PRACTICE INSIGHTS REPORT 2018–19 45
5.8. Mental health care plans for people with long-term mental illness
The Mental Health Care Plan (MHCP) is part of the Better Access to Psychiatrists, Psychologists and
General Practitioners initiative through the MBS. This initiative aims to improve outcomes for people
with clinically diagnosed mental disorders, particularly for those not already under the care of
specialist mental health services. It identifies what type of health care the person needs, and provides
referrals to local mental health services if agreed. A MHCP entitles the patient to Medicare rebates for
up to 10 individual and 10 group appointments in a year with some allied mental health services,
including psychologists, occupational therapists and social workers.
The use of GP mental health care plans among patients with long-term mental illness was identified
either via the MBS billing items for MHCP and mental health consultations (only available for practice
sites where the billing system is integrated with the CIS) or via free text entry in one of the three
diagnosis fields recorded at any time during the 2018–19 financial year (Section 2.5). The MHCP
cannot be linked directly with a patient’s mental illness diagnosis using MedicineInsight data. The
uptake of GP Management Plans, which can also be used to support patients with mental illness, was
not assessed in this report
Patients with long-term anxiety disorder (47%) and long-term depression (45%) were most likely to
have an MHCP created, or reviewed, by a GP during 2018–19 (Table 5.8). Patients already under the
care of specialist mental health services are unlikely to require an MHCP from the GP to manage their
mental illness, which might explain why fewer patients with schizophrenia or bipolar disorder had an
MHCP recorded.
TABLE 5.8 PROPORTION OF PATIENTS WITH LONG-TERM MENTAL ILLNESS AND MENTAL HEALTH CARE PLAN RECORD IN 2018–19
(UNWEIGHTED), MEDICINEINSIGHT 2018–19
Mental health care plan in 2018–19
No. % (95% CI)
Bipolar disorder 9463 34.9 (33.0, 36.9)
Long-term anxiety disorder 31,789 47.4 (45.5, 49.3)
Long-term depression 34,356 45.0 (43.2, 46.8)
Schizophrenia 4091 26.6 (24.5, 28.8)
5.9. Cardiovascular disease and cardiovascular risk factors in people with long-term mental illness
We assessed the prevalence of CVDg and selected CVD risk factors (diabetes, hypertension,
dyslipidaemia, obesity and smoking status) among patients with long-term mental illness compared to
the general patient population without long-term mental illness.
Among 114,629 patients who attended a GP in 2018–19 and who had long-term mental illness
recorded (Table 5.9):
6.8% had a record of CVD 8.2% had a record of type 2 (or unspecified) diabetes 21.5% had a record of hypertension 20.8% had a record of dyslipidaemia 25.2 were overweight or obese; and 25.4 were current smokers.
g Defined as atherosclerosis, coronary heart disease (including myocardial infarction and angina), peripheral vascular disease, stroke and transient ischaemic attack)
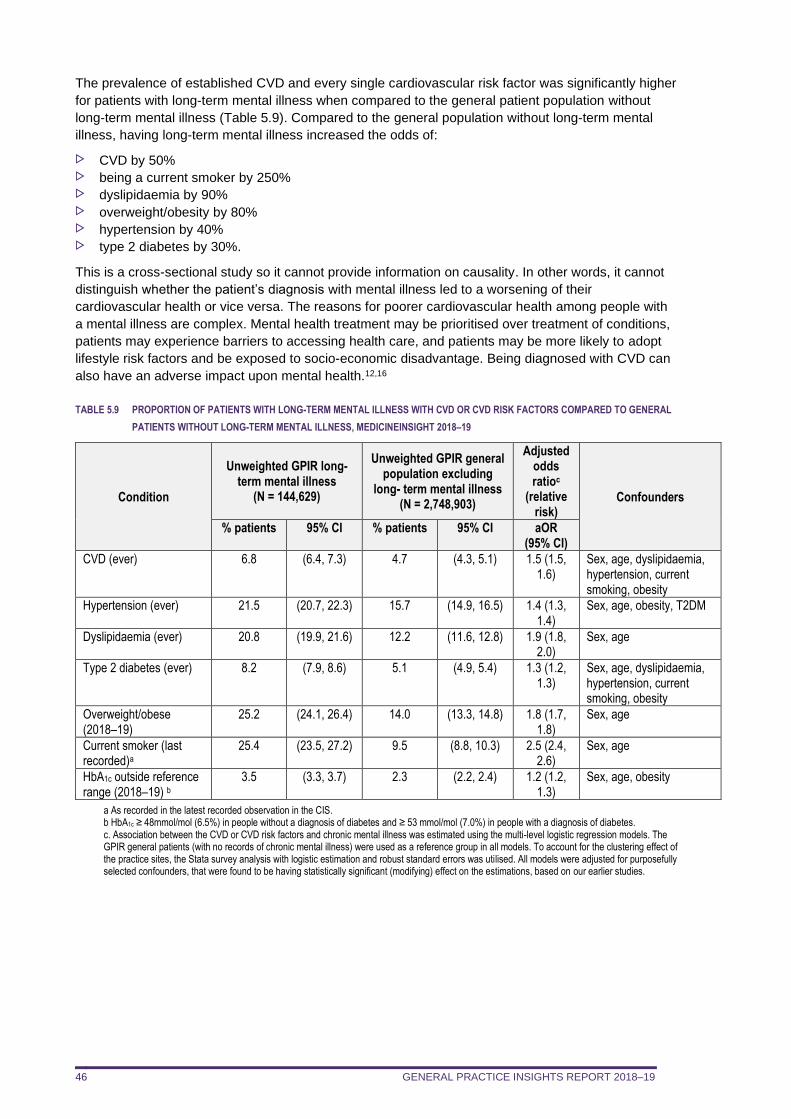
GENERAL PRACTICE INSIGHTS REPORT 2018–19 46
The prevalence of established CVD and every single cardiovascular risk factor was significantly higher
for patients with long-term mental illness when compared to the general patient population without
long-term mental illness (Table 5.9). Compared to the general population without long-term mental
illness, having long-term mental illness increased the odds of:
CVD by 50% being a current smoker by 250% dyslipidaemia by 90% overweight/obesity by 80% hypertension by 40% type 2 diabetes by 30%.
This is a cross-sectional study so it cannot provide information on causality. In other words, it cannot
distinguish whether the patient’s diagnosis with mental illness led to a worsening of their
cardiovascular health or vice versa. The reasons for poorer cardiovascular health among people with
a mental illness are complex. Mental health treatment may be prioritised over treatment of conditions,
patients may experience barriers to accessing health care, and patients may be more likely to adopt
lifestyle risk factors and be exposed to socio-economic disadvantage. Being diagnosed with CVD can
also have an adverse impact upon mental health.12,16
TABLE 5.9 PROPORTION OF PATIENTS WITH LONG-TERM MENTAL ILLNESS WITH CVD OR CVD RISK FACTORS COMPARED TO GENERAL
PATIENTS WITHOUT LONG-TERM MENTAL ILLNESS, MEDICINEINSIGHT 2018–19
Condition
Unweighted GPIR long-term mental illness
(N = 144,629)
Unweighted GPIR general population excluding
long- term mental illness (N = 2,748,903)
Adjusted odds ratioc
(relative risk)
Confounders
% patients 95% CI % patients 95% CI aOR (95% CI)
CVD (ever) 6.8 (6.4, 7.3) 4.7 (4.3, 5.1) 1.5 (1.5, 1.6)
Sex, age, dyslipidaemia, hypertension, current smoking, obesity
Hypertension (ever) 21.5 (20.7, 22.3) 15.7 (14.9, 16.5) 1.4 (1.3, 1.4)
Sex, age, obesity, T2DM
Dyslipidaemia (ever) 20.8 (19.9, 21.6) 12.2 (11.6, 12.8) 1.9 (1.8, 2.0)
Sex, age
Type 2 diabetes (ever) 8.2 (7.9, 8.6) 5.1 (4.9, 5.4) 1.3 (1.2, 1.3)
Sex, age, dyslipidaemia, hypertension, current smoking, obesity
Overweight/obese (2018–19)
25.2 (24.1, 26.4) 14.0 (13.3, 14.8) 1.8 (1.7, 1.8)
Sex, age
Current smoker (last recorded)a
25.4 (23.5, 27.2) 9.5 (8.8, 10.3) 2.5 (2.4, 2.6)
Sex, age
HbA1c outside reference range (2018–19) b
3.5 (3.3, 3.7) 2.3 (2.2, 2.4) 1.2 (1.2, 1.3)
Sex, age, obesity
a As recorded in the latest recorded observation in the CIS. b HbA1c ≥ 48mmol/mol (6.5%) in people without a diagnosis of diabetes and ≥ 53 mmol/mol (7.0%) in people with a diagnosis of diabetes. c. Association between the CVD or CVD risk factors and chronic mental illness was estimated using the multi-level logistic regression models. The GPIR general patients (with no records of chronic mental illness) were used as a reference group in all models. To account for the clustering effect of the practice sites, the Stata survey analysis with logistic estimation and robust standard errors was utilised. All models were adjusted for purposefully selected confounders, that were found to be having statistically significant (modifying) effect on the estimations, based on our earlier studies.
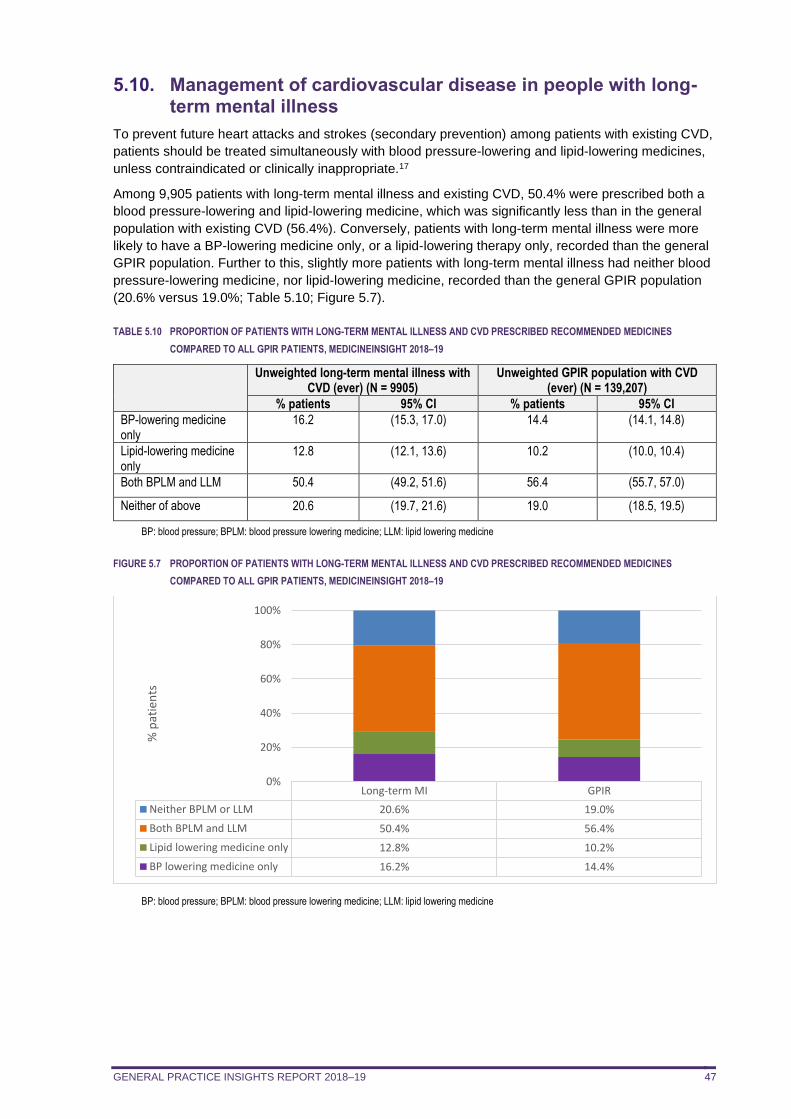
GENERAL PRACTICE INSIGHTS REPORT 2018–19 47
5.10. Management of cardiovascular disease in people with long-term mental illness
To prevent future heart attacks and strokes (secondary prevention) among patients with existing CVD,
patients should be treated simultaneously with blood pressure-lowering and lipid-lowering medicines,
unless contraindicated or clinically inappropriate.17
Among 9,905 patients with long-term mental illness and existing CVD, 50.4% were prescribed both a
blood pressure-lowering and lipid-lowering medicine, which was significantly less than in the general
population with existing CVD (56.4%). Conversely, patients with long-term mental illness were more
likely to have a BP-lowering medicine only, or a lipid-lowering therapy only, recorded than the general
GPIR population. Further to this, slightly more patients with long-term mental illness had neither blood
pressure-lowering medicine, nor lipid-lowering medicine, recorded than the general GPIR population
(20.6% versus 19.0%; Table 5.10; Figure 5.7).
TABLE 5.10 PROPORTION OF PATIENTS WITH LONG-TERM MENTAL ILLNESS AND CVD PRESCRIBED RECOMMENDED MEDICINES
COMPARED TO ALL GPIR PATIENTS, MEDICINEINSIGHT 2018–19
Unweighted long-term mental illness with
CVD (ever) (N = 9905) Unweighted GPIR population with CVD
(ever) (N = 139,207)
% patients 95% CI % patients 95% CI
BP-lowering medicine only
16.2 (15.3, 17.0) 14.4 (14.1, 14.8)
Lipid-lowering medicine only
12.8 (12.1, 13.6) 10.2 (10.0, 10.4)
Both BPLM and LLM 50.4 (49.2, 51.6) 56.4 (55.7, 57.0)
Neither of above 20.6 (19.7, 21.6) 19.0 (18.5, 19.5)
BP: blood pressure; BPLM: blood pressure lowering medicine; LLM: lipid lowering medicine
FIGURE 5.7 PROPORTION OF PATIENTS WITH LONG-TERM MENTAL ILLNESS AND CVD PRESCRIBED RECOMMENDED MEDICINES
COMPARED TO ALL GPIR PATIENTS, MEDICINEINSIGHT 2018–19
BP: blood pressure; BPLM: blood pressure lowering medicine; LLM: lipid lowering medicine
Long-term MI GPIR
Neither BPLM or LLM 20.6% 19.0%
Both BPLM and LLM 50.4% 56.4%
Lipid lowering medicine only 12.8% 10.2%
BP lowering medicine only 16.2% 14.4%
0%
20%
40%
60%
80%
100%
% p
atie
nts
GENERAL PRACTICE INSIGHTS REPORT 2018–19 48
5.11. Conclusions
This chapter provides evidence that the prevalence of CVD, diabetes, hypertension, dyslipidaemia,
obesity and smoking is higher among patients with long-term mental illness than the general
population without long-term mental illness. These findings are consistent with other Australian studies
on people living with psychotic illness13,18,19 and provides new information on patients with long-term
anxiety disorder or depression. While most patients with long-term mental illness and existing CVD
had at least one preventive medicine recorded, they were less likely than the general population with
existing CVD to be prescribed both a lipid-lowering and a BP-lowering medicine as recommended in
guidelines for the secondary prevention of cardiovascular events.
These findings highlight an opportunity to improve cardiovascular health among people with long-term
mental illness, both through lifestyle advice to improve the risk factor profile of these patients, and
through recommended medicines. Three-quarters of Australians with mental illness seek medical help
from a GP rather than specialist mental health services20 and, in our study, patients with long-term
mental illness visited a GP around 10 times per year, on average. By continuing to provide ongoing
support and management, GPs and other primary care health providers can work together with these
patients to greatly improve their health and life expectancy.
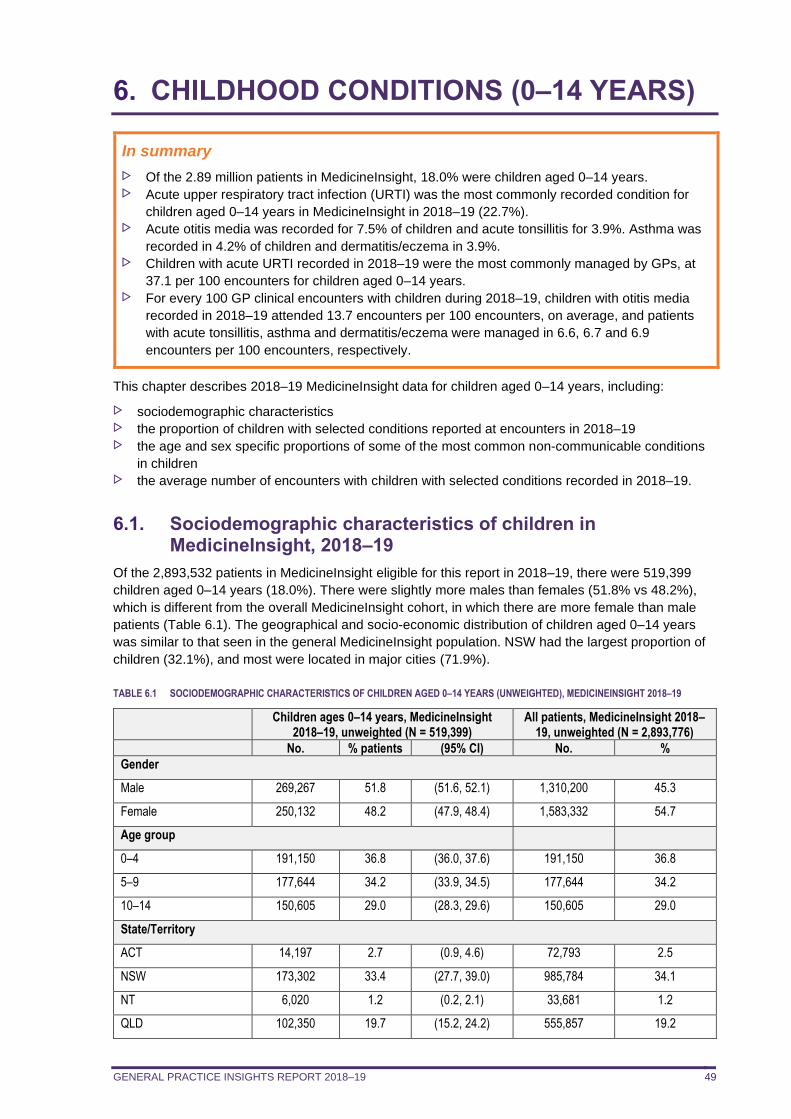
GENERAL PRACTICE INSIGHTS REPORT 2018–19 49
6. CHILDHOOD CONDITIONS (0–14 YEARS)
In summary
Of the 2.89 million patients in MedicineInsight, 18.0% were children aged 0–14 years. Acute upper respiratory tract infection (URTI) was the most commonly recorded condition for
children aged 0–14 years in MedicineInsight in 2018–19 (22.7%). Acute otitis media was recorded for 7.5% of children and acute tonsillitis for 3.9%. Asthma was
recorded in 4.2% of children and dermatitis/eczema in 3.9%. Children with acute URTI recorded in 2018–19 were the most commonly managed by GPs, at
37.1 per 100 encounters for children aged 0–14 years. For every 100 GP clinical encounters with children during 2018–19, children with otitis media
recorded in 2018–19 attended 13.7 encounters per 100 encounters, on average, and patients
with acute tonsillitis, asthma and dermatitis/eczema were managed in 6.6, 6.7 and 6.9
encounters per 100 encounters, respectively.
This chapter describes 2018–19 MedicineInsight data for children aged 0–14 years, including:
sociodemographic characteristics the proportion of children with selected conditions reported at encounters in 2018–19 the age and sex specific proportions of some of the most common non-communicable conditions
in children the average number of encounters with children with selected conditions recorded in 2018–19.
6.1. Sociodemographic characteristics of children in MedicineInsight, 2018–19
Of the 2,893,532 patients in MedicineInsight eligible for this report in 2018–19, there were 519,399
children aged 0–14 years (18.0%). There were slightly more males than females (51.8% vs 48.2%),
which is different from the overall MedicineInsight cohort, in which there are more female than male
patients (Table 6.1). The geographical and socio-economic distribution of children aged 0–14 years
was similar to that seen in the general MedicineInsight population. NSW had the largest proportion of
children (32.1%), and most were located in major cities (71.9%).
TABLE 6.1 SOCIODEMOGRAPHIC CHARACTERISTICS OF CHILDREN AGED 0–14 YEARS (UNWEIGHTED), MEDICINEINSIGHT 2018–19
Children ages 0–14 years, MedicineInsight 2018–19, unweighted (N = 519,399)
All patients, MedicineInsight 2018–19, unweighted (N = 2,893,776)
No. % patients (95% CI) No. %
Gender
Male 269,267 51.8 (51.6, 52.1) 1,310,200 45.3
Female 250,132 48.2 (47.9, 48.4) 1,583,332 54.7
Age group
0–4 191,150 36.8 (36.0, 37.6) 191,150 36.8
5–9 177,644 34.2 (33.9, 34.5) 177,644 34.2
10–14 150,605 29.0 (28.3, 29.6) 150,605 29.0
State/Territory
ACT 14,197 2.7 (0.9, 4.6) 72,793 2.5
NSW 173,302 33.4 (27.7, 39.0) 985,784 34.1
NT 6,020 1.2 (0.2, 2.1) 33,681 1.2
QLD 102,350 19.7 (15.2, 24.2) 555,857 19.2
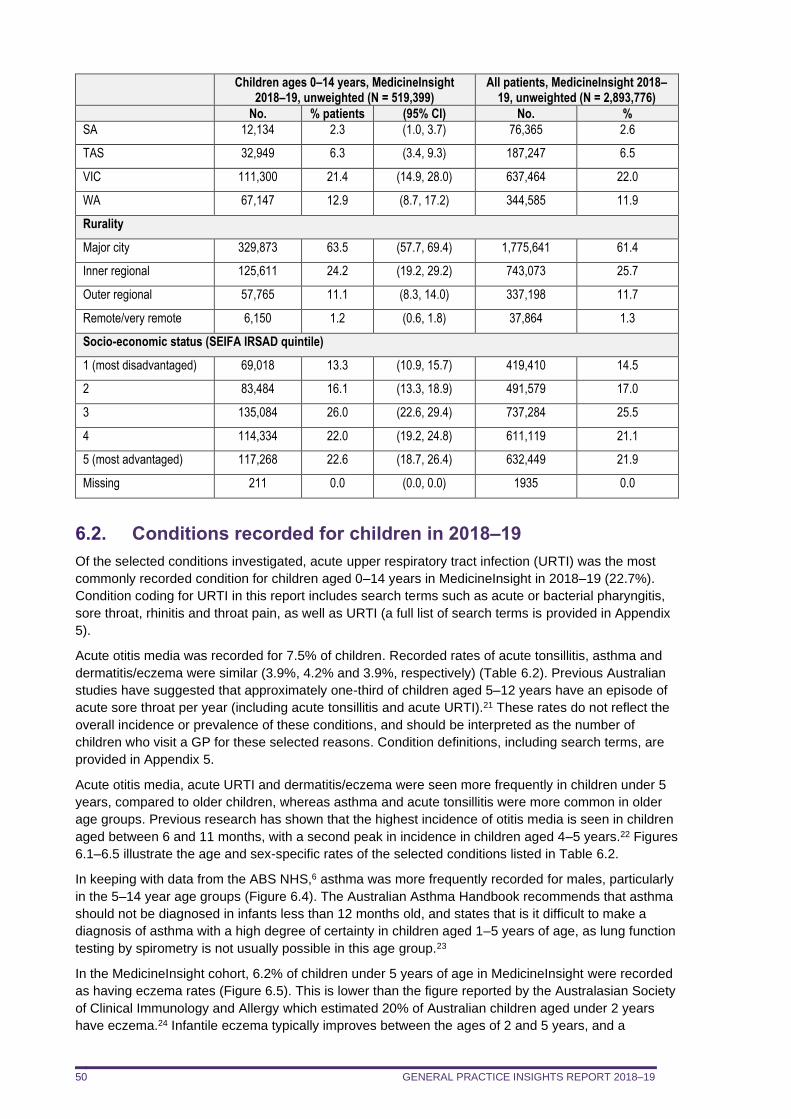
GENERAL PRACTICE INSIGHTS REPORT 2018–19 50
Children ages 0–14 years, MedicineInsight 2018–19, unweighted (N = 519,399)
All patients, MedicineInsight 2018–19, unweighted (N = 2,893,776)
No. % patients (95% CI) No. %
SA 12,134 2.3 (1.0, 3.7) 76,365 2.6
TAS 32,949 6.3 (3.4, 9.3) 187,247 6.5
VIC 111,300 21.4 (14.9, 28.0) 637,464 22.0
WA 67,147 12.9 (8.7, 17.2) 344,585 11.9
Rurality
Major city 329,873 63.5 (57.7, 69.4) 1,775,641 61.4
Inner regional 125,611 24.2 (19.2, 29.2) 743,073 25.7
Outer regional 57,765 11.1 (8.3, 14.0) 337,198 11.7
Remote/very remote 6,150 1.2 (0.6, 1.8) 37,864 1.3
Socio-economic status (SEIFA IRSAD quintile)
1 (most disadvantaged) 69,018 13.3 (10.9, 15.7) 419,410 14.5
2 83,484 16.1 (13.3, 18.9) 491,579 17.0
3 135,084 26.0 (22.6, 29.4) 737,284 25.5
4 114,334 22.0 (19.2, 24.8) 611,119 21.1
5 (most advantaged) 117,268 22.6 (18.7, 26.4) 632,449 21.9
Missing 211 0.0 (0.0, 0.0) 1935 0.0
6.2. Conditions recorded for children in 2018–19
Of the selected conditions investigated, acute upper respiratory tract infection (URTI) was the most
commonly recorded condition for children aged 0–14 years in MedicineInsight in 2018–19 (22.7%).
Condition coding for URTI in this report includes search terms such as acute or bacterial pharyngitis,
sore throat, rhinitis and throat pain, as well as URTI (a full list of search terms is provided in Appendix
5).
Acute otitis media was recorded for 7.5% of children. Recorded rates of acute tonsillitis, asthma and
dermatitis/eczema were similar (3.9%, 4.2% and 3.9%, respectively) (Table 6.2). Previous Australian
studies have suggested that approximately one-third of children aged 5–12 years have an episode of
acute sore throat per year (including acute tonsillitis and acute URTI).21 These rates do not reflect the
overall incidence or prevalence of these conditions, and should be interpreted as the number of
children who visit a GP for these selected reasons. Condition definitions, including search terms, are
provided in Appendix 5.
Acute otitis media, acute URTI and dermatitis/eczema were seen more frequently in children under 5
years, compared to older children, whereas asthma and acute tonsillitis were more common in older
age groups. Previous research has shown that the highest incidence of otitis media is seen in children
aged between 6 and 11 months, with a second peak in incidence in children aged 4–5 years.22 Figures
6.1–6.5 illustrate the age and sex-specific rates of the selected conditions listed in Table 6.2.
In keeping with data from the ABS NHS,6 asthma was more frequently recorded for males, particularly
in the 5–14 year age groups (Figure 6.4). The Australian Asthma Handbook recommends that asthma
should not be diagnosed in infants less than 12 months old, and states that is it difficult to make a
diagnosis of asthma with a high degree of certainty in children aged 1–5 years of age, as lung function
testing by spirometry is not usually possible in this age group.23
In the MedicineInsight cohort, 6.2% of children under 5 years of age in MedicineInsight were recorded
as having eczema rates (Figure 6.5). This is lower than the figure reported by the Australasian Society
of Clinical Immunology and Allergy which estimated 20% of Australian children aged under 2 years
have eczema.24 Infantile eczema typically improves between the ages of 2 and 5 years, and a
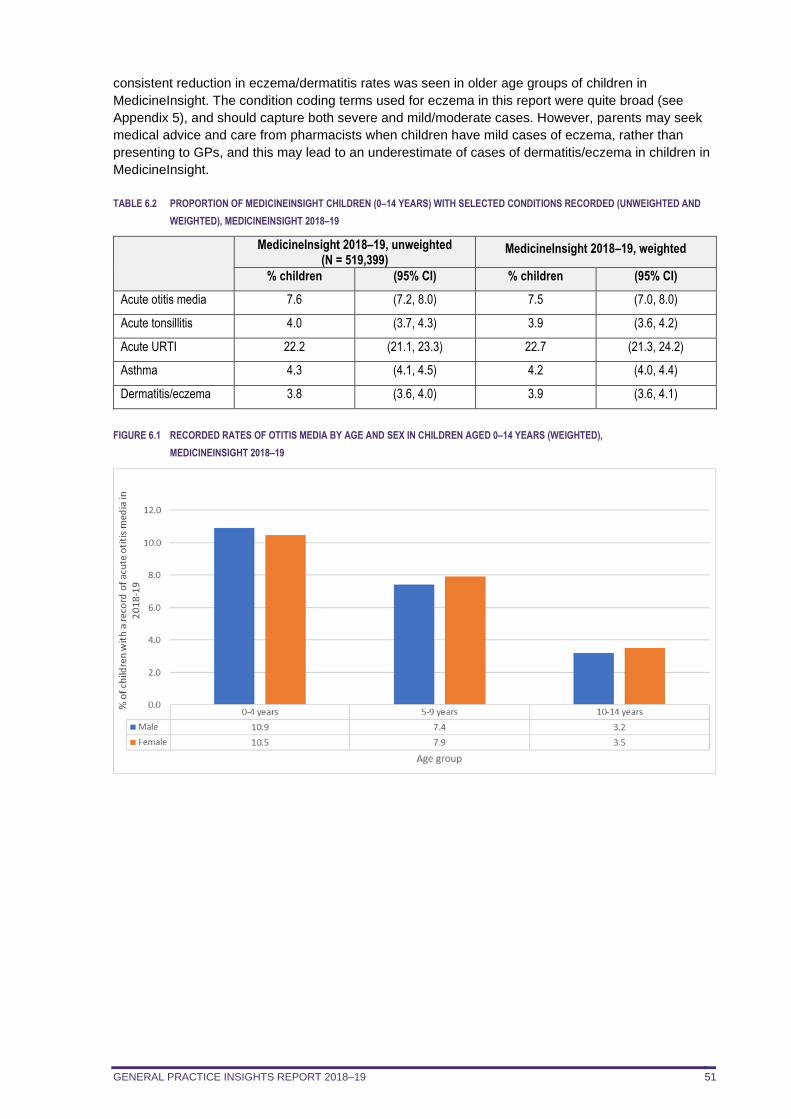
GENERAL PRACTICE INSIGHTS REPORT 2018–19 51
consistent reduction in eczema/dermatitis rates was seen in older age groups of children in
MedicineInsight. The condition coding terms used for eczema in this report were quite broad (see
Appendix 5), and should capture both severe and mild/moderate cases. However, parents may seek
medical advice and care from pharmacists when children have mild cases of eczema, rather than
presenting to GPs, and this may lead to an underestimate of cases of dermatitis/eczema in children in
MedicineInsight.
TABLE 6.2 PROPORTION OF MEDICINEINSIGHT CHILDREN (0–14 YEARS) WITH SELECTED CONDITIONS RECORDED (UNWEIGHTED AND
WEIGHTED), MEDICINEINSIGHT 2018–19
MedicineInsight 2018–19, unweighted (N = 519,399)
MedicineInsight 2018–19, weighted
% children (95% CI) % children (95% CI)
Acute otitis media 7.6 (7.2, 8.0) 7.5 (7.0, 8.0)
Acute tonsillitis 4.0 (3.7, 4.3) 3.9 (3.6, 4.2)
Acute URTI 22.2 (21.1, 23.3) 22.7 (21.3, 24.2)
Asthma 4.3 (4.1, 4.5) 4.2 (4.0, 4.4)
Dermatitis/eczema 3.8 (3.6, 4.0) 3.9 (3.6, 4.1)
FIGURE 6.1 RECORDED RATES OF OTITIS MEDIA BY AGE AND SEX IN CHILDREN AGED 0–14 YEARS (WEIGHTED),
MEDICINEINSIGHT 2018–19
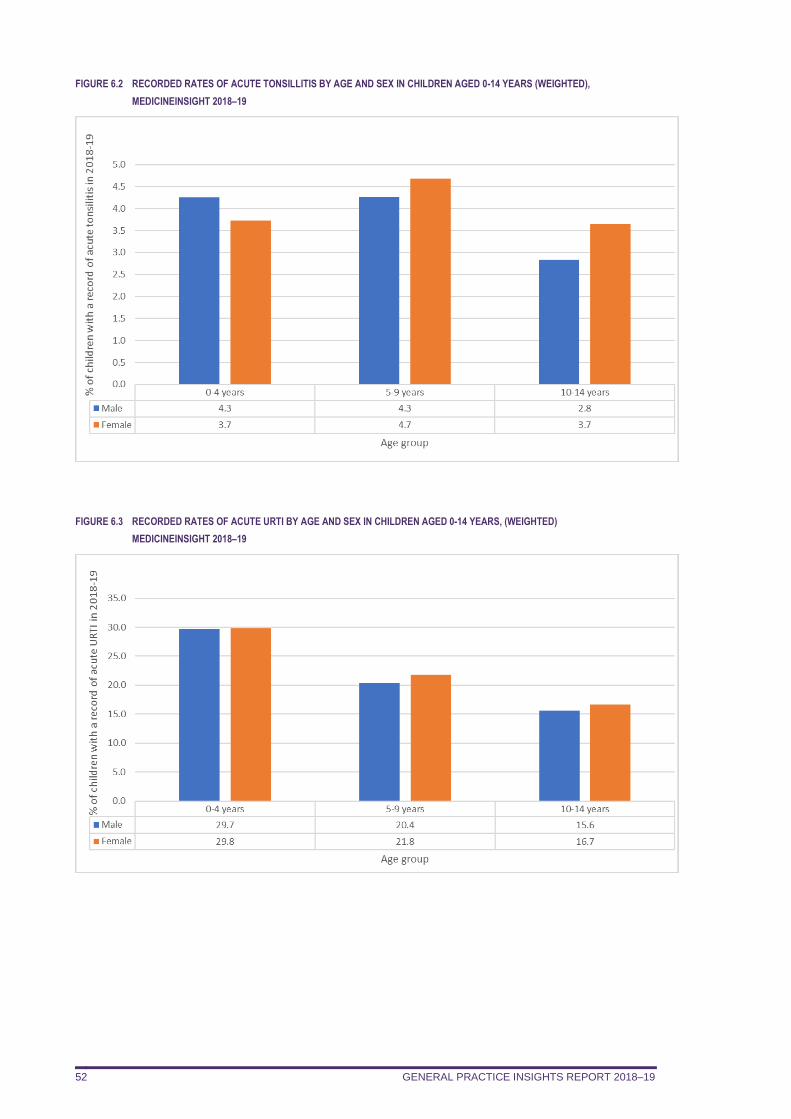
GENERAL PRACTICE INSIGHTS REPORT 2018–19 52
FIGURE 6.2 RECORDED RATES OF ACUTE TONSILLITIS BY AGE AND SEX IN CHILDREN AGED 0-14 YEARS (WEIGHTED),
MEDICINEINSIGHT 2018–19
FIGURE 6.3 RECORDED RATES OF ACUTE URTI BY AGE AND SEX IN CHILDREN AGED 0-14 YEARS, (WEIGHTED)
MEDICINEINSIGHT 2018–19
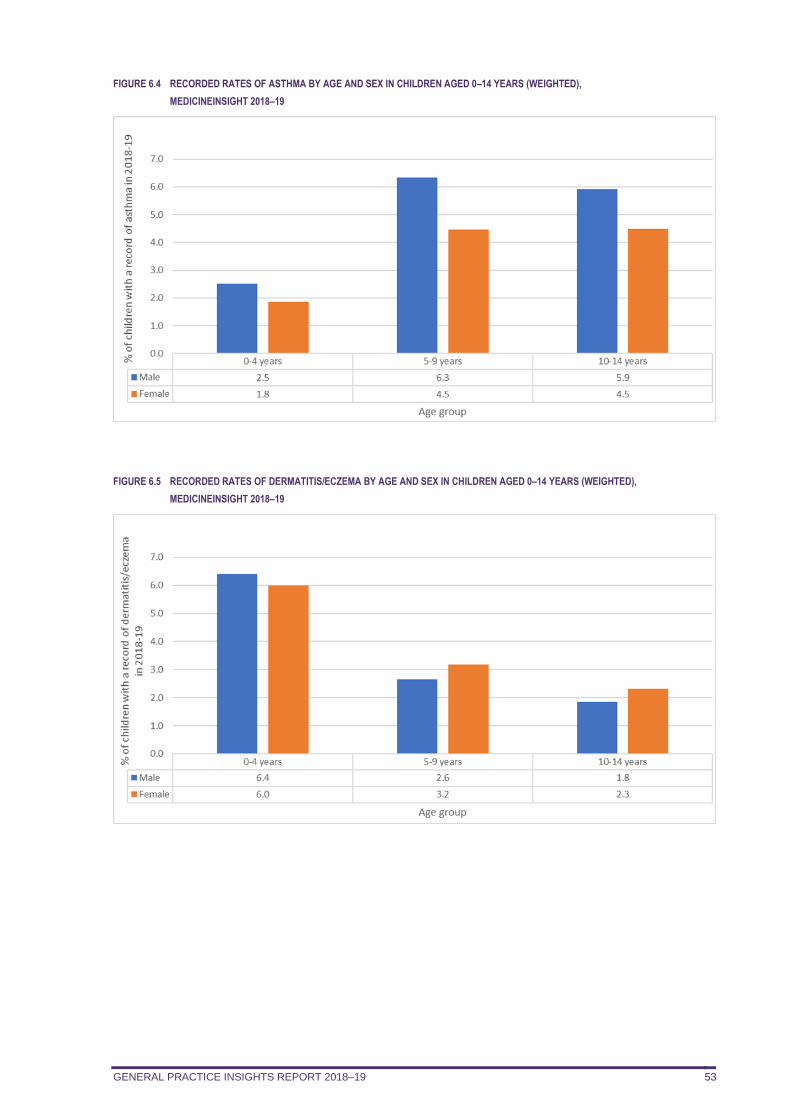
GENERAL PRACTICE INSIGHTS REPORT 2018–19 53
FIGURE 6.4 RECORDED RATES OF ASTHMA BY AGE AND SEX IN CHILDREN AGED 0–14 YEARS (WEIGHTED),
MEDICINEINSIGHT 2018–19
FIGURE 6.5 RECORDED RATES OF DERMATITIS/ECZEMA BY AGE AND SEX IN CHILDREN AGED 0–14 YEARS (WEIGHTED),
MEDICINEINSIGHT 2018–19
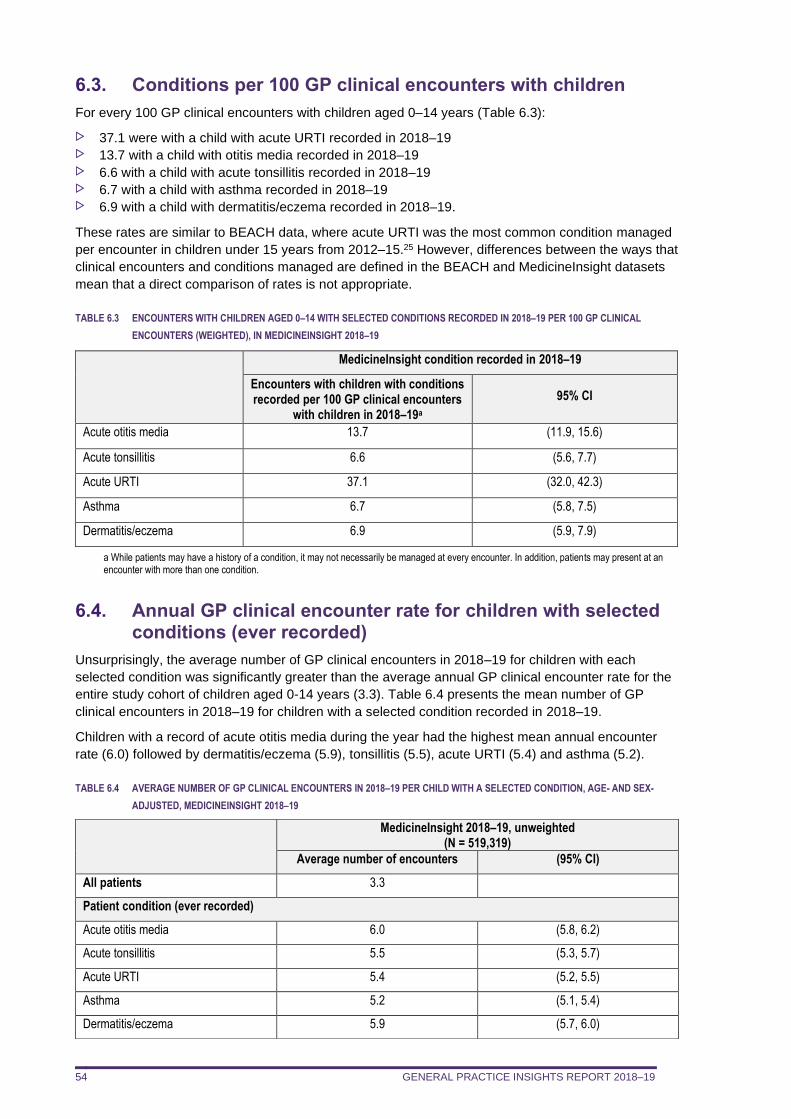
GENERAL PRACTICE INSIGHTS REPORT 2018–19 54
6.3. Conditions per 100 GP clinical encounters with children
For every 100 GP clinical encounters with children aged 0–14 years (Table 6.3):
37.1 were with a child with acute URTI recorded in 2018–19 13.7 with a child with otitis media recorded in 2018–19 6.6 with a child with acute tonsillitis recorded in 2018–19 6.7 with a child with asthma recorded in 2018–19 6.9 with a child with dermatitis/eczema recorded in 2018–19.
These rates are similar to BEACH data, where acute URTI was the most common condition managed
per encounter in children under 15 years from 2012–15.25 However, differences between the ways that
clinical encounters and conditions managed are defined in the BEACH and MedicineInsight datasets
mean that a direct comparison of rates is not appropriate.
TABLE 6.3 ENCOUNTERS WITH CHILDREN AGED 0–14 WITH SELECTED CONDITIONS RECORDED IN 2018–19 PER 100 GP CLINICAL
ENCOUNTERS (WEIGHTED), IN MEDICINEINSIGHT 2018–19
MedicineInsight condition recorded in 2018–19
Encounters with children with conditions recorded per 100 GP clinical encounters
with children in 2018–19a
95% CI
Acute otitis media 13.7 (11.9, 15.6)
Acute tonsillitis 6.6 (5.6, 7.7)
Acute URTI 37.1 (32.0, 42.3)
Asthma 6.7 (5.8, 7.5)
Dermatitis/eczema 6.9 (5.9, 7.9)
a While patients may have a history of a condition, it may not necessarily be managed at every encounter. In addition, patients may present at an encounter with more than one condition.
6.4. Annual GP clinical encounter rate for children with selected conditions (ever recorded)
Unsurprisingly, the average number of GP clinical encounters in 2018–19 for children with each
selected condition was significantly greater than the average annual GP clinical encounter rate for the
entire study cohort of children aged 0-14 years (3.3). Table 6.4 presents the mean number of GP
clinical encounters in 2018–19 for children with a selected condition recorded in 2018–19.
Children with a record of acute otitis media during the year had the highest mean annual encounter
rate (6.0) followed by dermatitis/eczema (5.9), tonsillitis (5.5), acute URTI (5.4) and asthma (5.2).
TABLE 6.4 AVERAGE NUMBER OF GP CLINICAL ENCOUNTERS IN 2018–19 PER CHILD WITH A SELECTED CONDITION, AGE- AND SEX-
ADJUSTED, MEDICINEINSIGHT 2018–19
MedicineInsight 2018–19, unweighted (N = 519,319)
Average number of encounters (95% CI)
All patients 3.3
Patient condition (ever recorded)
Acute otitis media 6.0 (5.8, 6.2)
Acute tonsillitis 5.5 (5.3, 5.7)
Acute URTI 5.4 (5.2, 5.5)
Asthma 5.2 (5.1, 5.4)
Dermatitis/eczema 5.9 (5.7, 6.0)
GENERAL PRACTICE INSIGHTS REPORT 2018–19 55
Vignette 1: supporting quality improvement
Using MedicineInsight to inform a quality improvement activity on asthma in children
To help GPs continue to provide quality care, NPS MedicineWise provides MedicineInsight quality improvement (QI) reports to participating general practices on their patterns of prescribing and patient care, alongside aggregate data from all MedicineInsight practices. The provision of practice-level data enables GPs in participating practices to reflect on how their practice compares to best practice guidance and that of their peers.
In this vignette we present aggregated data from the 2020 QI report delivered to MedicineInsight GPs aimed at improving the diagnosis and management of children with asthma in Australian primary care. The vignette focuses on management of asthma in children aged 6–11 years with asthma.
The definitions used to identify patients in the QI report differ slightly from those used to define patients with asthma in the main GPIR.h To facilitate practice discussion, the QI report used a definition of asthma which included regular patients currently prescribed an asthma medicine or with a reference to asthma in one of the diagnosis fields in the last 2 years. The GPIR definition used the diagnosis or reason for encounter or prescription fields to identify people with asthma, not the medicines list itself. For this reason, the aggregated data presented in this vignette are not directly comparable to information about asthma contained in the main report.
Background
Asthma is responsible for considerable morbidity and health care costs in Australia, affecting approximately 11% of the population.6 Treatment of asthma is a stepwise approach with the aim of relieving symptoms and preventing them from recurring. Reliever medicines, such as short-acting beta2 agonists (SABAs), provide rapid relief of symptoms while preventer medicines are designed for daily use to minimise symptoms and reduce the risk of future symptomatic episodes (‘flareups’ or exacerbations). Preventers include the inhaled corticosteroids (ICS) or the combination of ICS and a long-acting beta2 agonist (LABA).23,26
Clinically, there are differences between diagnosing and managing asthma for younger children, older children, adolescents and adults.23 Australian guidelines recommend using SABA relievers as needed for most children with mild asthma.23 However, for some children who require a regular preventer, low-dose ICS or montelukast can be used in addition to a reliever, or for a few children, a stepped-up regular preventer such as high-dose ICS or ICS plus a LABA should be used if good control is not achieved despite good adherence and correct inhaler technique. This analysis focuses on medicines used to manage asthma in children aged 6–11 years.
Methods
Using MedicineInsight data for the November 2019 download, we assessed medicines used to manage mild to moderate asthma in regular patients aged 6–11 years. Patients with asthma were identified and those first diagnosed with asthma in the last 2 years were defined as those whose first reference to asthma ever occurred in the 2 years preceding the November 2019 MedicineInsight data download.
Results
Of the 167,195 children aged 6–11 years eligible for inclusion, 21.4% (n = 35,778) were identified as having asthma and 29.4% (n = 10,505) were first diagnosed in the last 2 years. More than 40% of the 6–11-year old children who had asthma were currently prescribed SABA medicines only (Figure V1.1). The other medicines (+/- SABA) prescribed for children with asthma included low-strength ICS (31%), montelukast (9%) and high-strength ICS (8%). Although 8% of patients had no treatment recorded, it is possible that these patients might have been using over-the-counter (OTC) salbutamol, or been prescribed asthma medicines at another non-MedicineInsight practice, or that their asthma might have resolved.
h For the purpose of the practice report a ‘regular patient’ was a patient aged 6–11 years who had attended the practice at least three times in the last 2 years and who was not deceased or inactive; a ‘patient with asthma’ was currently prescribed an asthma medicine or had a coded or free text entry related to asthma recorded in any diagnosis, reason for visit/encounter or reason for prescription field in the last 2 years.
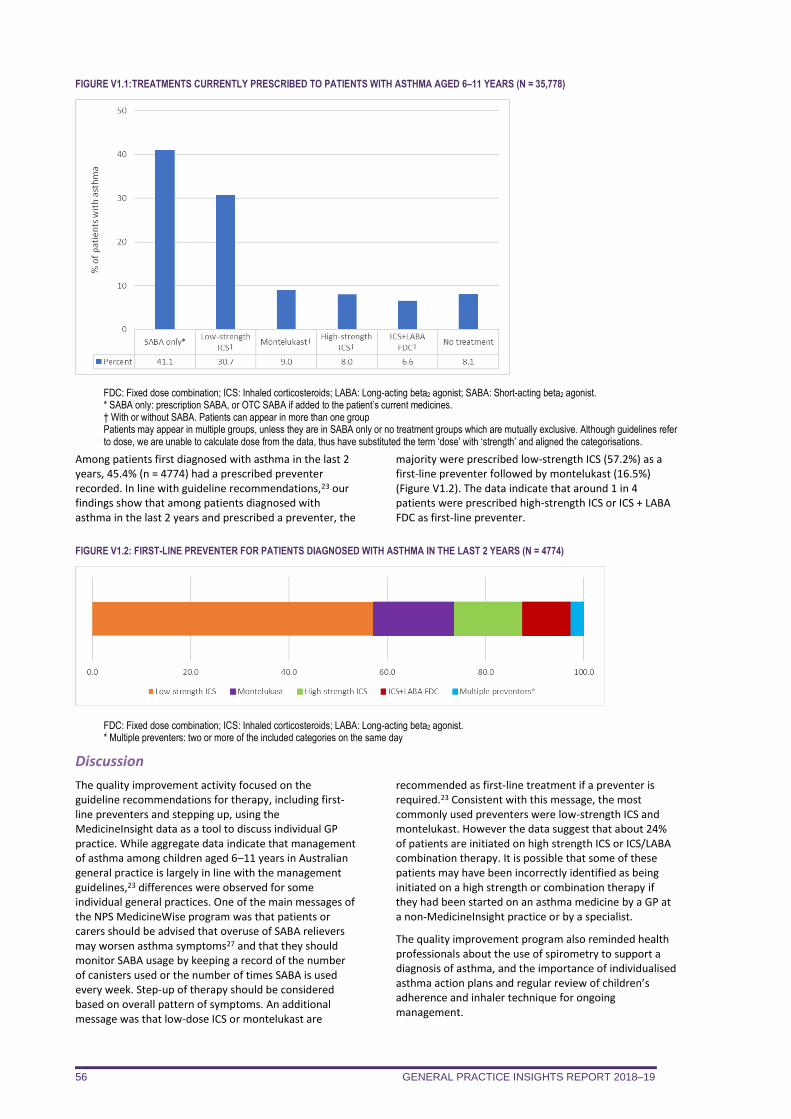
GENERAL PRACTICE INSIGHTS REPORT 2018–19 56
FIGURE V1.1: TREATMENTS CURRENTLY PRESCRIBED TO PATIENTS WITH ASTHMA AGED 6–11 YEARS (N = 35,778)
FDC: Fixed dose combination; ICS: Inhaled corticosteroids; LABA: Long-acting beta2 agonist; SABA: Short-acting beta2 agonist. * SABA only: prescription SABA, or OTC SABA if added to the patient’s current medicines. † With or without SABA. Patients can appear in more than one group Patients may appear in multiple groups, unless they are in SABA only or no treatment groups which are mutually exclusive. Although guidelines refer to dose, we are unable to calculate dose from the data, thus have substituted the term ‘dose’ with ‘strength’ and aligned the categorisations.
Among patients first diagnosed with asthma in the last 2 years, 45.4% (n = 4774) had a prescribed preventer recorded. In line with guideline recommendations,23 our findings show that among patients diagnosed with asthma in the last 2 years and prescribed a preventer, the
majority were prescribed low-strength ICS (57.2%) as a first-line preventer followed by montelukast (16.5%) (Figure V1.2). The data indicate that around 1 in 4 patients were prescribed high-strength ICS or ICS + LABA FDC as first-line preventer.
FIGURE V1.2: FIRST-LINE PREVENTER FOR PATIENTS DIAGNOSED WITH ASTHMA IN THE LAST 2 YEARS (N = 4774)
FDC: Fixed dose combination; ICS: Inhaled corticosteroids; LABA: Long-acting beta2 agonist. * Multiple preventers: two or more of the included categories on the same day
Discussion
The quality improvement activity focused on the guideline recommendations for therapy, including first-line preventers and stepping up, using the MedicineInsight data as a tool to discuss individual GP practice. While aggregate data indicate that management of asthma among children aged 6–11 years in Australian general practice is largely in line with the management guidelines,23 differences were observed for some individual general practices. One of the main messages of the NPS MedicineWise program was that patients or carers should be advised that overuse of SABA relievers may worsen asthma symptoms27 and that they should monitor SABA usage by keeping a record of the number of canisters used or the number of times SABA is used every week. Step-up of therapy should be considered based on overall pattern of symptoms. An additional message was that low-dose ICS or montelukast are
recommended as first-line treatment if a preventer is required.23 Consistent with this message, the most commonly used preventers were low-strength ICS and montelukast. However the data suggest that about 24% of patients are initiated on high strength ICS or ICS/LABA combination therapy. It is possible that some of these patients may have been incorrectly identified as being initiated on a high strength or combination therapy if they had been started on an asthma medicine by a GP at a non-MedicineInsight practice or by a specialist.
The quality improvement program also reminded health professionals about the use of spirometry to support a diagnosis of asthma, and the importance of individualised asthma action plans and regular review of children’s adherence and inhaler technique for ongoing management.
GENERAL PRACTICE INSIGHTS REPORT 2018–19 57
7. PRESCRIPTIONS
In summary
MedicineInsight captures prescriptions that have been issued – whether they are private, PBS
subsidised or under co-payment. In contrast, PBS data captures prescriptions when the
medicine has been dispensed on the PBS (including under co-payment). Approximately 11.9 million issued prescriptions, and 36.7 million total (issued plus repeat)
prescriptions were written by GPs in MedicineInsight practices during 2018–19. 70.9% of MedicineInsight patients were prescribed a medicine at least once during 2018–19. While a third of patients only had one or two prescriptions issued, 6.6% of patients had 15 or
more prescriptions issued during 2018–19. The average number of prescriptions increases as patients get older, and is higher in areas of
socio-economic disadvantage. Medicines to treat the nervous system (ATC N; antidepressants, analgesics, antiepileptics) were
the most commonly issued prescriptions in 2018–19. However, cardiovascular medicines (ATC
C; lipid-modifying medicines, antihypertensives) were the most commonly prescribed total
(issued plus repeat) medicines. Opioids (N02A) accounted for 10.6% of all issued prescriptions while lipid-lowering medicines
(C10A) accounted for 9.8% of total prescriptions. The overwhelming majority of medicines are subsidised by the Australian Government under
the PBS or the RPBS (84.7%). On average, 100 MedicineInsight encounters result in 78.8 issued prescriptions and 240.6 total
prescriptions. Prescribing of anti-infectives, antidepressants and opioids increases with patient age.
This chapter describes:
the distribution of numbers of prescriptions per patient in 2018–19 the average number of issued prescriptions according to patient demographics the number and proportion of prescriptions in 2018–19, issued and total, by Anatomical
Therapeutic Chemical (ATC) Level 1 (anatomical subgroup), compared to national PBS data the number and proportion of prescriptions in 2018–19 for the top 30 ATC Level 3
(pharmacological subgroup) categories, issued and total the number and proportion of PBS/RPBS prescriptions and private prescriptions in 2018–19, by
ATC Level 1 and ATC Level 3 issued and total prescriptions by ATC Level 1 per 100 encounters issued and total prescriptions by ATC Level 3 (top 30 only) per 100 encounters the average number of prescriptions per patient by sex and age for two high volume ATC level 1
categories and two high volume ATC level 3 categories.
All prescriptions ordered by general practice staff in the clinical information software – private, PBS
and RPBS – that could be assigned to a unique ATC code have been included. There were an
additional 834,000 issued prescriptions recorded in the database which could not be assigned an ATC
code by NPS MedicineWise because they either did not have an active ingredient recorded or had an
active ingredient which could be assigned to multiple ATC codes. Prescriptions without an assigned
unique ATC code were not included in the analyses below. For reference, the list of the 20 most
common medicines where an active ingredient was recorded but for which an ATC code has not yet
been assigned in our dataset are included in Appendix 6 (Table A6.1). The single most commonly
ordered medicine which could not be assigned a unique ATC code was hydrocortisone (0.2% of all
issued prescriptions).
MedicineInsight captures prescribing data, not dispensing data. Thus, a medicine may be recorded as
having been prescribed, but there is no guarantee that the medicine was dispensed by a pharmacist to
the patient or that the patient took the medicines as advised.
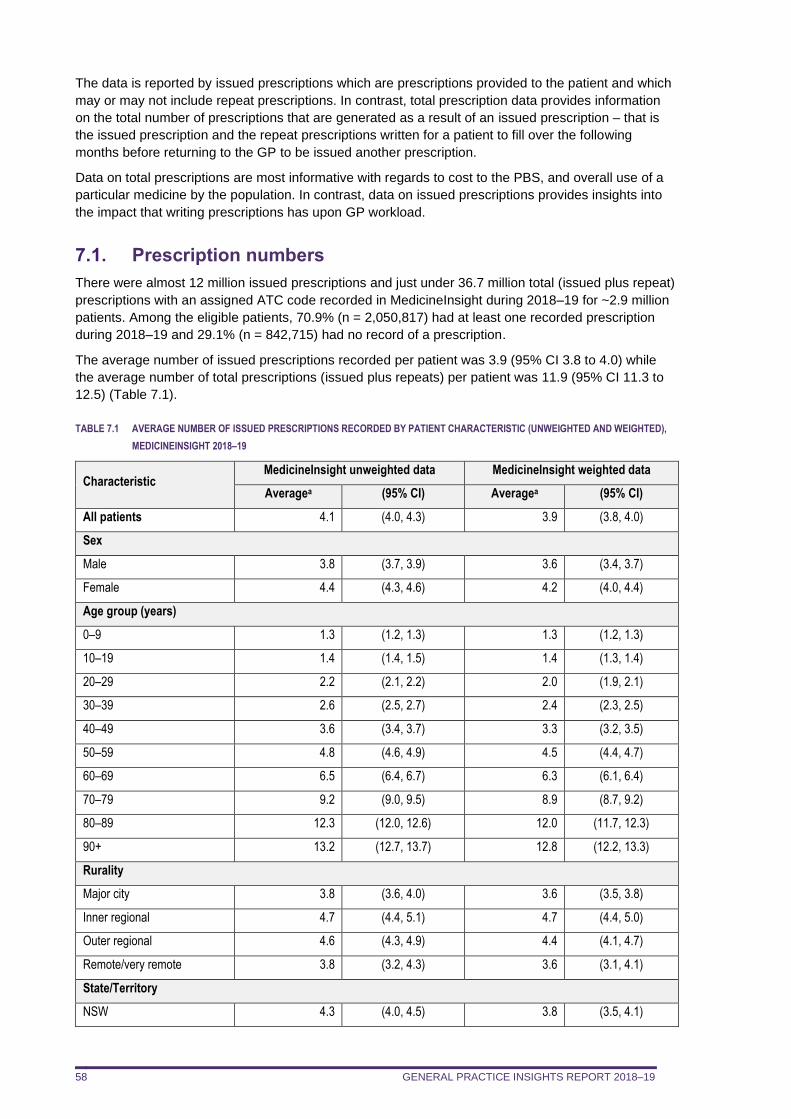
GENERAL PRACTICE INSIGHTS REPORT 2018–19 58
The data is reported by issued prescriptions which are prescriptions provided to the patient and which
may or may not include repeat prescriptions. In contrast, total prescription data provides information
on the total number of prescriptions that are generated as a result of an issued prescription – that is
the issued prescription and the repeat prescriptions written for a patient to fill over the following
months before returning to the GP to be issued another prescription.
Data on total prescriptions are most informative with regards to cost to the PBS, and overall use of a
particular medicine by the population. In contrast, data on issued prescriptions provides insights into
the impact that writing prescriptions has upon GP workload.
7.1. Prescription numbers
There were almost 12 million issued prescriptions and just under 36.7 million total (issued plus repeat)
prescriptions with an assigned ATC code recorded in MedicineInsight during 2018–19 for ~2.9 million
patients. Among the eligible patients, 70.9% (n = 2,050,817) had at least one recorded prescription
during 2018–19 and 29.1% (n = 842,715) had no record of a prescription.
The average number of issued prescriptions recorded per patient was 3.9 (95% CI 3.8 to 4.0) while
the average number of total prescriptions (issued plus repeats) per patient was 11.9 (95% CI 11.3 to
12.5) (Table 7.1).
TABLE 7.1 AVERAGE NUMBER OF ISSUED PRESCRIPTIONS RECORDED BY PATIENT CHARACTERISTIC (UNWEIGHTED AND WEIGHTED),
MEDICINEINSIGHT 2018–19
Characteristic MedicineInsight unweighted data MedicineInsight weighted data
Averagea (95% CI) Averagea (95% CI)
All patients 4.1 (4.0, 4.3) 3.9 (3.8, 4.0)
Sex
Male 3.8 (3.7, 3.9) 3.6 (3.4, 3.7)
Female 4.4 (4.3, 4.6) 4.2 (4.0, 4.4)
Age group (years)
0–9 1.3 (1.2, 1.3) 1.3 (1.2, 1.3)
10–19 1.4 (1.4, 1.5) 1.4 (1.3, 1.4)
20–29 2.2 (2.1, 2.2) 2.0 (1.9, 2.1)
30–39 2.6 (2.5, 2.7) 2.4 (2.3, 2.5)
40–49 3.6 (3.4, 3.7) 3.3 (3.2, 3.5)
50–59 4.8 (4.6, 4.9) 4.5 (4.4, 4.7)
60–69 6.5 (6.4, 6.7) 6.3 (6.1, 6.4)
70–79 9.2 (9.0, 9.5) 8.9 (8.7, 9.2)
80–89 12.3 (12.0, 12.6) 12.0 (11.7, 12.3)
90+ 13.2 (12.7, 13.7) 12.8 (12.2, 13.3)
Rurality
Major city 3.8 (3.6, 4.0) 3.6 (3.5, 3.8)
Inner regional 4.7 (4.4, 5.1) 4.7 (4.4, 5.0)
Outer regional 4.6 (4.3, 4.9) 4.4 (4.1, 4.7)
Remote/very remote 3.8 (3.2, 4.3) 3.6 (3.1, 4.1)
State/Territory
NSW 4.3 (4.0, 4.5) 3.8 (3.5, 4.1)
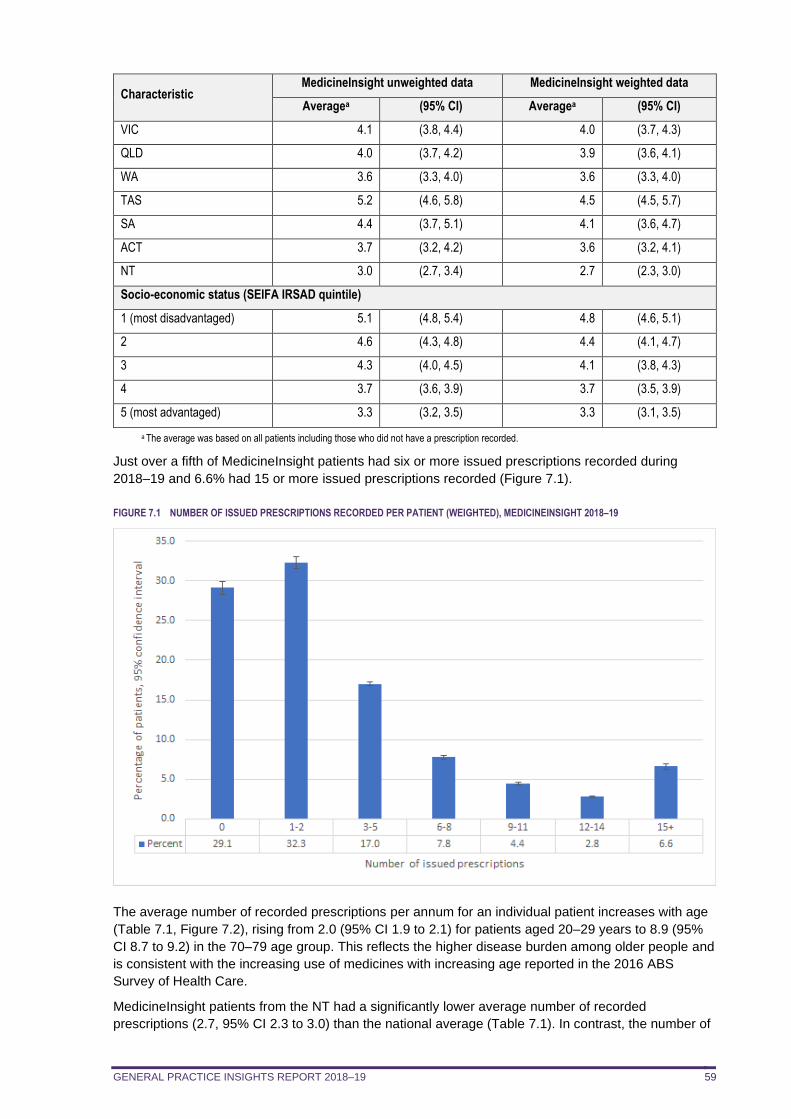
GENERAL PRACTICE INSIGHTS REPORT 2018–19 59
Characteristic MedicineInsight unweighted data MedicineInsight weighted data
Averagea (95% CI) Averagea (95% CI)
VIC 4.1 (3.8, 4.4) 4.0 (3.7, 4.3)
QLD 4.0 (3.7, 4.2) 3.9 (3.6, 4.1)
WA 3.6 (3.3, 4.0) 3.6 (3.3, 4.0)
TAS 5.2 (4.6, 5.8) 4.5 (4.5, 5.7)
SA 4.4 (3.7, 5.1) 4.1 (3.6, 4.7)
ACT 3.7 (3.2, 4.2) 3.6 (3.2, 4.1)
NT 3.0 (2.7, 3.4) 2.7 (2.3, 3.0)
Socio-economic status (SEIFA IRSAD quintile)
1 (most disadvantaged) 5.1 (4.8, 5.4) 4.8 (4.6, 5.1)
2 4.6 (4.3, 4.8) 4.4 (4.1, 4.7)
3 4.3 (4.0, 4.5) 4.1 (3.8, 4.3)
4 3.7 (3.6, 3.9) 3.7 (3.5, 3.9)
5 (most advantaged) 3.3 (3.2, 3.5) 3.3 (3.1, 3.5)
a The average was based on all patients including those who did not have a prescription recorded.
Just over a fifth of MedicineInsight patients had six or more issued prescriptions recorded during
2018–19 and 6.6% had 15 or more issued prescriptions recorded (Figure 7.1).
FIGURE 7.1 NUMBER OF ISSUED PRESCRIPTIONS RECORDED PER PATIENT (WEIGHTED), MEDICINEINSIGHT 2018–19
The average number of recorded prescriptions per annum for an individual patient increases with age
(Table 7.1, Figure 7.2), rising from 2.0 (95% CI 1.9 to 2.1) for patients aged 20–29 years to 8.9 (95%
CI 8.7 to 9.2) in the 70–79 age group. This reflects the higher disease burden among older people and
is consistent with the increasing use of medicines with increasing age reported in the 2016 ABS
Survey of Health Care.
MedicineInsight patients from the NT had a significantly lower average number of recorded
prescriptions (2.7, 95% CI 2.3 to 3.0) than the national average (Table 7.1). In contrast, the number of
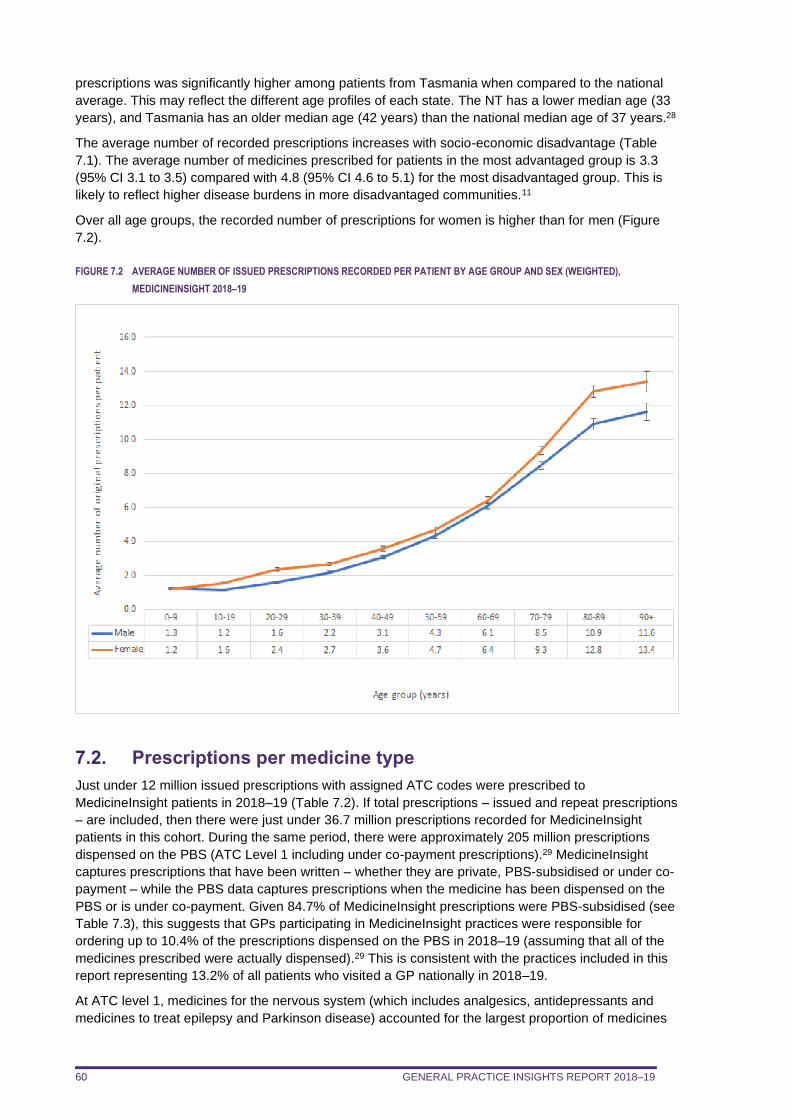
GENERAL PRACTICE INSIGHTS REPORT 2018–19 60
prescriptions was significantly higher among patients from Tasmania when compared to the national
average. This may reflect the different age profiles of each state. The NT has a lower median age (33
years), and Tasmania has an older median age (42 years) than the national median age of 37 years.28
The average number of recorded prescriptions increases with socio-economic disadvantage (Table
7.1). The average number of medicines prescribed for patients in the most advantaged group is 3.3
(95% CI 3.1 to 3.5) compared with 4.8 (95% CI 4.6 to 5.1) for the most disadvantaged group. This is
likely to reflect higher disease burdens in more disadvantaged communities.11
Over all age groups, the recorded number of prescriptions for women is higher than for men (Figure
7.2).
FIGURE 7.2 AVERAGE NUMBER OF ISSUED PRESCRIPTIONS RECORDED PER PATIENT BY AGE GROUP AND SEX (WEIGHTED),
MEDICINEINSIGHT 2018–19
7.2. Prescriptions per medicine type
Just under 12 million issued prescriptions with assigned ATC codes were prescribed to
MedicineInsight patients in 2018–19 (Table 7.2). If total prescriptions – issued and repeat prescriptions
– are included, then there were just under 36.7 million prescriptions recorded for MedicineInsight
patients in this cohort. During the same period, there were approximately 205 million prescriptions
dispensed on the PBS (ATC Level 1 including under co-payment prescriptions).29 MedicineInsight
captures prescriptions that have been written – whether they are private, PBS-subsidised or under co-
payment – while the PBS data captures prescriptions when the medicine has been dispensed on the
PBS or is under co-payment. Given 84.7% of MedicineInsight prescriptions were PBS-subsidised (see
Table 7.3), this suggests that GPs participating in MedicineInsight practices were responsible for
ordering up to 10.4% of the prescriptions dispensed on the PBS in 2018–19 (assuming that all of the
medicines prescribed were actually dispensed).29 This is consistent with the practices included in this
report representing 13.2% of all patients who visited a GP nationally in 2018–19.
At ATC level 1, medicines for the nervous system (which includes analgesics, antidepressants and
medicines to treat epilepsy and Parkinson disease) accounted for the largest proportion of medicines
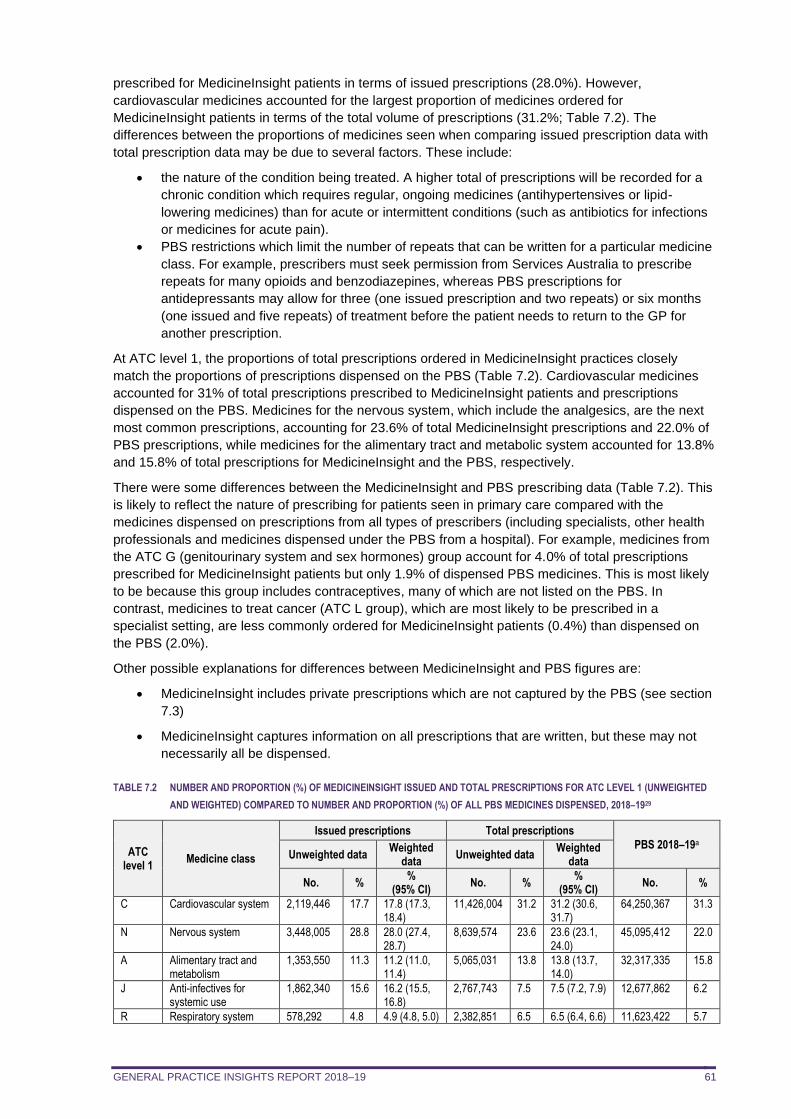
GENERAL PRACTICE INSIGHTS REPORT 2018–19 61
prescribed for MedicineInsight patients in terms of issued prescriptions (28.0%). However,
cardiovascular medicines accounted for the largest proportion of medicines ordered for
MedicineInsight patients in terms of the total volume of prescriptions (31.2%; Table 7.2). The
differences between the proportions of medicines seen when comparing issued prescription data with
total prescription data may be due to several factors. These include:
• the nature of the condition being treated. A higher total of prescriptions will be recorded for a
chronic condition which requires regular, ongoing medicines (antihypertensives or lipid-
lowering medicines) than for acute or intermittent conditions (such as antibiotics for infections
or medicines for acute pain).
• PBS restrictions which limit the number of repeats that can be written for a particular medicine
class. For example, prescribers must seek permission from Services Australia to prescribe
repeats for many opioids and benzodiazepines, whereas PBS prescriptions for
antidepressants may allow for three (one issued prescription and two repeats) or six months
(one issued and five repeats) of treatment before the patient needs to return to the GP for
another prescription.
At ATC level 1, the proportions of total prescriptions ordered in MedicineInsight practices closely
match the proportions of prescriptions dispensed on the PBS (Table 7.2). Cardiovascular medicines
accounted for 31% of total prescriptions prescribed to MedicineInsight patients and prescriptions
dispensed on the PBS. Medicines for the nervous system, which include the analgesics, are the next
most common prescriptions, accounting for 23.6% of total MedicineInsight prescriptions and 22.0% of
PBS prescriptions, while medicines for the alimentary tract and metabolic system accounted for 13.8%
and 15.8% of total prescriptions for MedicineInsight and the PBS, respectively.
There were some differences between the MedicineInsight and PBS prescribing data (Table 7.2). This
is likely to reflect the nature of prescribing for patients seen in primary care compared with the
medicines dispensed on prescriptions from all types of prescribers (including specialists, other health
professionals and medicines dispensed under the PBS from a hospital). For example, medicines from
the ATC G (genitourinary system and sex hormones) group account for 4.0% of total prescriptions
prescribed for MedicineInsight patients but only 1.9% of dispensed PBS medicines. This is most likely
to be because this group includes contraceptives, many of which are not listed on the PBS. In
contrast, medicines to treat cancer (ATC L group), which are most likely to be prescribed in a
specialist setting, are less commonly ordered for MedicineInsight patients (0.4%) than dispensed on
the PBS (2.0%).
Other possible explanations for differences between MedicineInsight and PBS figures are:
• MedicineInsight includes private prescriptions which are not captured by the PBS (see section
7.3)
• MedicineInsight captures information on all prescriptions that are written, but these may not
necessarily all be dispensed.
TABLE 7.2 NUMBER AND PROPORTION (%) OF MEDICINEINSIGHT ISSUED AND TOTAL PRESCRIPTIONS FOR ATC LEVEL 1 (UNWEIGHTED
AND WEIGHTED) COMPARED TO NUMBER AND PROPORTION (%) OF ALL PBS MEDICINES DISPENSED, 2018–1929
ATC level 1
Medicine class
Issued prescriptions Total prescriptions
PBS 2018–19a Unweighted data
Weighted data
Unweighted data Weighted
data
No. % %
(95% CI) No. %
% (95% CI)
No. %
C Cardiovascular system 2,119,446 17.7 17.8 (17.3, 18.4)
11,426,004 31.2 31.2 (30.6, 31.7)
64,250,367 31.3
N Nervous system 3,448,005 28.8 28.0 (27.4, 28.7)
8,639,574 23.6 23.6 (23.1, 24.0)
45,095,412 22.0
A Alimentary tract and metabolism
1,353,550 11.3 11.2 (11.0, 11.4)
5,065,031 13.8 13.8 (13.7, 14.0)
32,317,335 15.8
J Anti-infectives for systemic use
1,862,340 15.6 16.2 (15.5, 16.8)
2,767,743 7.5 7.5 (7.2, 7.9) 12,677,862 6.2
R Respiratory system 578,292 4.8 4.9 (4.8, 5.0) 2,382,851 6.5 6.5 (6.4, 6.6) 11,623,422 5.7
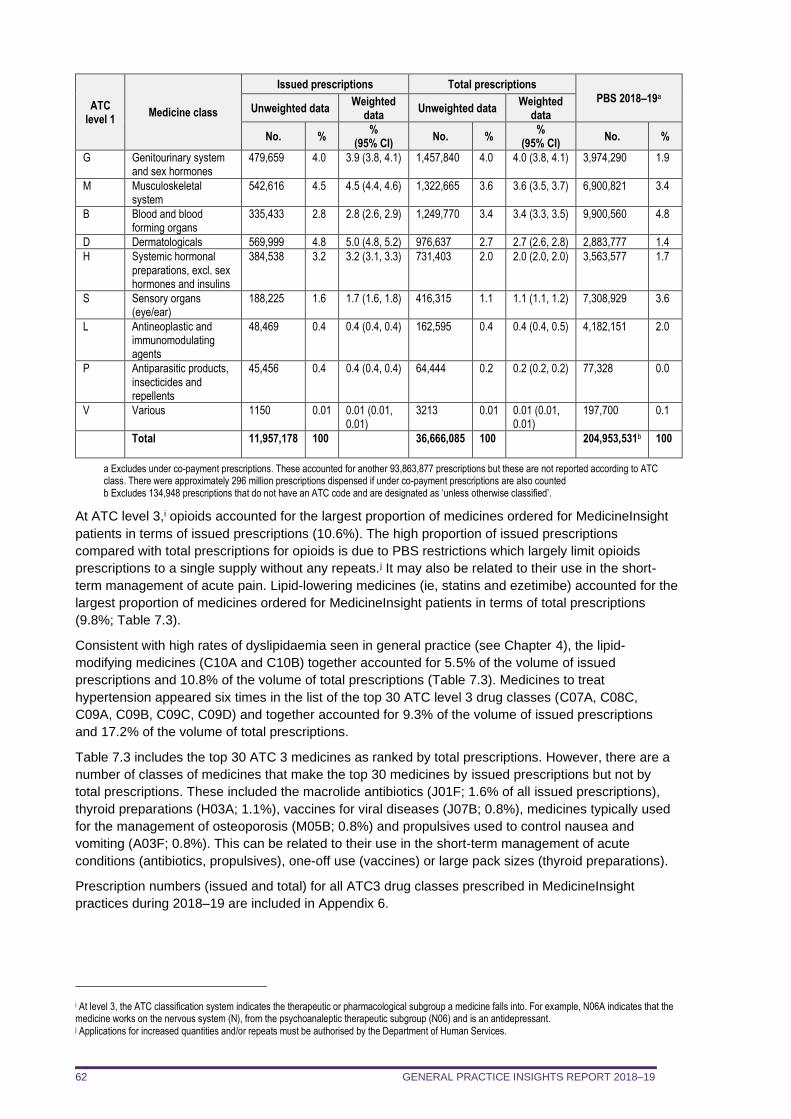
GENERAL PRACTICE INSIGHTS REPORT 2018–19 62
ATC level 1
Medicine class
Issued prescriptions Total prescriptions
PBS 2018–19a Unweighted data
Weighted data
Unweighted data Weighted
data
No. % %
(95% CI) No. %
% (95% CI)
No. %
G Genitourinary system and sex hormones
479,659 4.0 3.9 (3.8, 4.1) 1,457,840 4.0 4.0 (3.8, 4.1) 3,974,290 1.9
M Musculoskeletal system
542,616 4.5 4.5 (4.4, 4.6) 1,322,665 3.6 3.6 (3.5, 3.7) 6,900,821 3.4
B Blood and blood forming organs
335,433 2.8 2.8 (2.6, 2.9) 1,249,770 3.4 3.4 (3.3, 3.5) 9,900,560 4.8
D Dermatologicals 569,999 4.8 5.0 (4.8, 5.2) 976,637 2.7 2.7 (2.6, 2.8) 2,883,777 1.4
H Systemic hormonal preparations, excl. sex hormones and insulins
384,538 3.2 3.2 (3.1, 3.3) 731,403 2.0 2.0 (2.0, 2.0) 3,563,577 1.7
S Sensory organs (eye/ear)
188,225 1.6 1.7 (1.6, 1.8) 416,315 1.1 1.1 (1.1, 1.2) 7,308,929 3.6
L Antineoplastic and immunomodulating agents
48,469 0.4 0.4 (0.4, 0.4) 162,595 0.4 0.4 (0.4, 0.5) 4,182,151 2.0
P Antiparasitic products, insecticides and repellents
45,456 0.4 0.4 (0.4, 0.4) 64,444 0.2 0.2 (0.2, 0.2) 77,328 0.0
V Various 1150 0.01 0.01 (0.01, 0.01)
3213 0.01 0.01 (0.01, 0.01)
197,700 0.1
Total 11,957,178 100 36,666,085 100 204,953,531b 100
a Excludes under co-payment prescriptions. These accounted for another 93,863,877 prescriptions but these are not reported according to ATC class. There were approximately 296 million prescriptions dispensed if under co-payment prescriptions are also counted b Excludes 134,948 prescriptions that do not have an ATC code and are designated as ‘unless otherwise classified’.
At ATC level 3,i opioids accounted for the largest proportion of medicines ordered for MedicineInsight
patients in terms of issued prescriptions (10.6%). The high proportion of issued prescriptions
compared with total prescriptions for opioids is due to PBS restrictions which largely limit opioids
prescriptions to a single supply without any repeats.j It may also be related to their use in the short-
term management of acute pain. Lipid-lowering medicines (ie, statins and ezetimibe) accounted for the
largest proportion of medicines ordered for MedicineInsight patients in terms of total prescriptions
(9.8%; Table 7.3).
Consistent with high rates of dyslipidaemia seen in general practice (see Chapter 4), the lipid-
modifying medicines (C10A and C10B) together accounted for 5.5% of the volume of issued
prescriptions and 10.8% of the volume of total prescriptions (Table 7.3). Medicines to treat
hypertension appeared six times in the list of the top 30 ATC level 3 drug classes (C07A, C08C,
C09A, C09B, C09C, C09D) and together accounted for 9.3% of the volume of issued prescriptions
and 17.2% of the volume of total prescriptions.
Table 7.3 includes the top 30 ATC 3 medicines as ranked by total prescriptions. However, there are a
number of classes of medicines that make the top 30 medicines by issued prescriptions but not by
total prescriptions. These included the macrolide antibiotics (J01F; 1.6% of all issued prescriptions),
thyroid preparations (H03A; 1.1%), vaccines for viral diseases (J07B; 0.8%), medicines typically used
for the management of osteoporosis (M05B; 0.8%) and propulsives used to control nausea and
vomiting (A03F; 0.8%). This can be related to their use in the short-term management of acute
conditions (antibiotics, propulsives), one-off use (vaccines) or large pack sizes (thyroid preparations).
Prescription numbers (issued and total) for all ATC3 drug classes prescribed in MedicineInsight
practices during 2018–19 are included in Appendix 6.
i At level 3, the ATC classification system indicates the therapeutic or pharmacological subgroup a medicine falls into. For example, N06A indicates that the medicine works on the nervous system (N), from the psychoanaleptic therapeutic subgroup (N06) and is an antidepressant. j Applications for increased quantities and/or repeats must be authorised by the Department of Human Services.
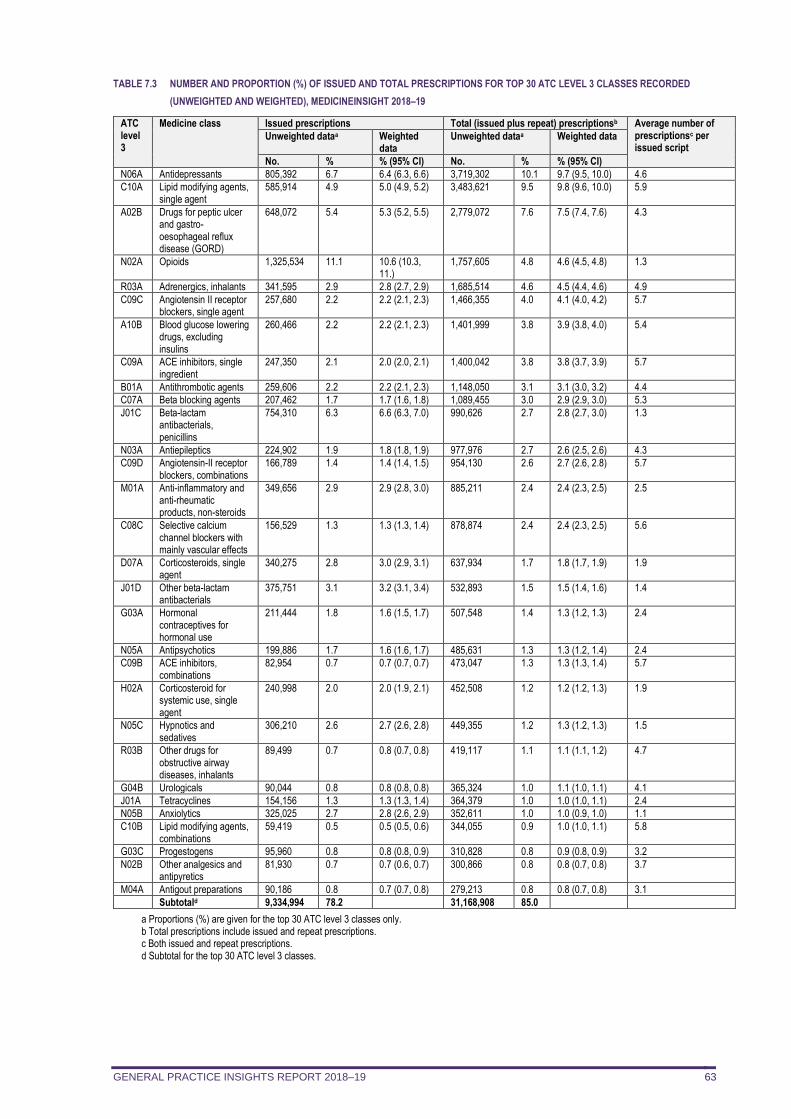
GENERAL PRACTICE INSIGHTS REPORT 2018–19 63
TABLE 7.3 NUMBER AND PROPORTION (%) OF ISSUED AND TOTAL PRESCRIPTIONS FOR TOP 30 ATC LEVEL 3 CLASSES RECORDED
(UNWEIGHTED AND WEIGHTED), MEDICINEINSIGHT 2018–19
ATC level 3
Medicine class Issued prescriptions Total (issued plus repeat) prescriptionsb Average number of prescriptionsc per issued script
Unweighted dataa Weighted data
Unweighted dataa Weighted data
No. % % (95% CI) No. % % (95% CI)
N06A Antidepressants 805,392 6.7 6.4 (6.3, 6.6) 3,719,302 10.1 9.7 (9.5, 10.0) 4.6
C10A Lipid modifying agents, single agent
585,914 4.9 5.0 (4.9, 5.2) 3,483,621 9.5 9.8 (9.6, 10.0) 5.9
A02B Drugs for peptic ulcer and gastro-oesophageal reflux disease (GORD)
648,072 5.4 5.3 (5.2, 5.5) 2,779,072 7.6 7.5 (7.4, 7.6) 4.3
N02A Opioids 1,325,534 11.1 10.6 (10.3, 11.)
1,757,605 4.8 4.6 (4.5, 4.8) 1.3
R03A Adrenergics, inhalants 341,595 2.9 2.8 (2.7, 2.9) 1,685,514 4.6 4.5 (4.4, 4.6) 4.9
C09C Angiotensin II receptor blockers, single agent
257,680 2.2 2.2 (2.1, 2.3) 1,466,355 4.0 4.1 (4.0, 4.2) 5.7
A10B Blood glucose lowering drugs, excluding insulins
260,466 2.2 2.2 (2.1, 2.3) 1,401,999 3.8 3.9 (3.8, 4.0) 5.4
C09A ACE inhibitors, single ingredient
247,350 2.1 2.0 (2.0, 2.1) 1,400,042 3.8 3.8 (3.7, 3.9) 5.7
B01A Antithrombotic agents 259,606 2.2 2.2 (2.1, 2.3) 1,148,050 3.1 3.1 (3.0, 3.2) 4.4
C07A Beta blocking agents 207,462 1.7 1.7 (1.6, 1.8) 1,089,455 3.0 2.9 (2.9, 3.0) 5.3
J01C Beta-lactam antibacterials, penicillins
754,310 6.3 6.6 (6.3, 7.0) 990,626 2.7 2.8 (2.7, 3.0) 1.3
N03A Antiepileptics 224,902 1.9 1.8 (1.8, 1.9) 977,976 2.7 2.6 (2.5, 2.6) 4.3
C09D Angiotensin-II receptor blockers, combinations
166,789 1.4 1.4 (1.4, 1.5) 954,130 2.6 2.7 (2.6, 2.8) 5.7
M01A Anti-inflammatory and anti-rheumatic products, non-steroids
349,656 2.9 2.9 (2.8, 3.0) 885,211 2.4 2.4 (2.3, 2.5) 2.5
C08C Selective calcium channel blockers with mainly vascular effects
156,529 1.3 1.3 (1.3, 1.4) 878,874 2.4 2.4 (2.3, 2.5) 5.6
D07A Corticosteroids, single agent
340,275 2.8 3.0 (2.9, 3.1) 637,934 1.7 1.8 (1.7, 1.9) 1.9
J01D Other beta-lactam antibacterials
375,751 3.1 3.2 (3.1, 3.4) 532,893 1.5 1.5 (1.4, 1.6) 1.4
G03A Hormonal contraceptives for hormonal use
211,444 1.8 1.6 (1.5, 1.7) 507,548 1.4 1.3 (1.2, 1.3) 2.4
N05A Antipsychotics 199,886 1.7 1.6 (1.6, 1.7) 485,631 1.3 1.3 (1.2, 1.4) 2.4
C09B ACE inhibitors, combinations
82,954 0.7 0.7 (0.7, 0.7) 473,047 1.3 1.3 (1.3, 1.4) 5.7
H02A Corticosteroid for systemic use, single agent
240,998 2.0 2.0 (1.9, 2.1) 452,508 1.2 1.2 (1.2, 1.3) 1.9
N05C Hypnotics and sedatives
306,210 2.6 2.7 (2.6, 2.8) 449,355 1.2 1.3 (1.2, 1.3) 1.5
R03B Other drugs for obstructive airway diseases, inhalants
89,499 0.7 0.8 (0.7, 0.8) 419,117 1.1 1.1 (1.1, 1.2) 4.7
G04B Urologicals 90,044 0.8 0.8 (0.8, 0.8) 365,324 1.0 1.1 (1.0, 1.1) 4.1
J01A Tetracyclines 154,156 1.3 1.3 (1.3, 1.4) 364,379 1.0 1.0 (1.0, 1.1) 2.4
N05B Anxiolytics 325,025 2.7 2.8 (2.6, 2.9) 352,611 1.0 1.0 (0.9, 1.0) 1.1
C10B Lipid modifying agents, combinations
59,419 0.5 0.5 (0.5, 0.6) 344,055 0.9 1.0 (1.0, 1.1) 5.8
G03C Progestogens 95,960 0.8 0.8 (0.8, 0.9) 310,828 0.8 0.9 (0.8, 0.9) 3.2
N02B Other analgesics and antipyretics
81,930 0.7 0.7 (0.6, 0.7) 300,866 0.8 0.8 (0.7, 0.8) 3.7
M04A Antigout preparations 90,186 0.8 0.7 (0.7, 0.8) 279,213 0.8 0.8 (0.7, 0.8) 3.1
Subtotald 9,334,994 78.2 31,168,908 85.0
a Proportions (%) are given for the top 30 ATC level 3 classes only. b Total prescriptions include issued and repeat prescriptions. c Both issued and repeat prescriptions. d Subtotal for the top 30 ATC level 3 classes.
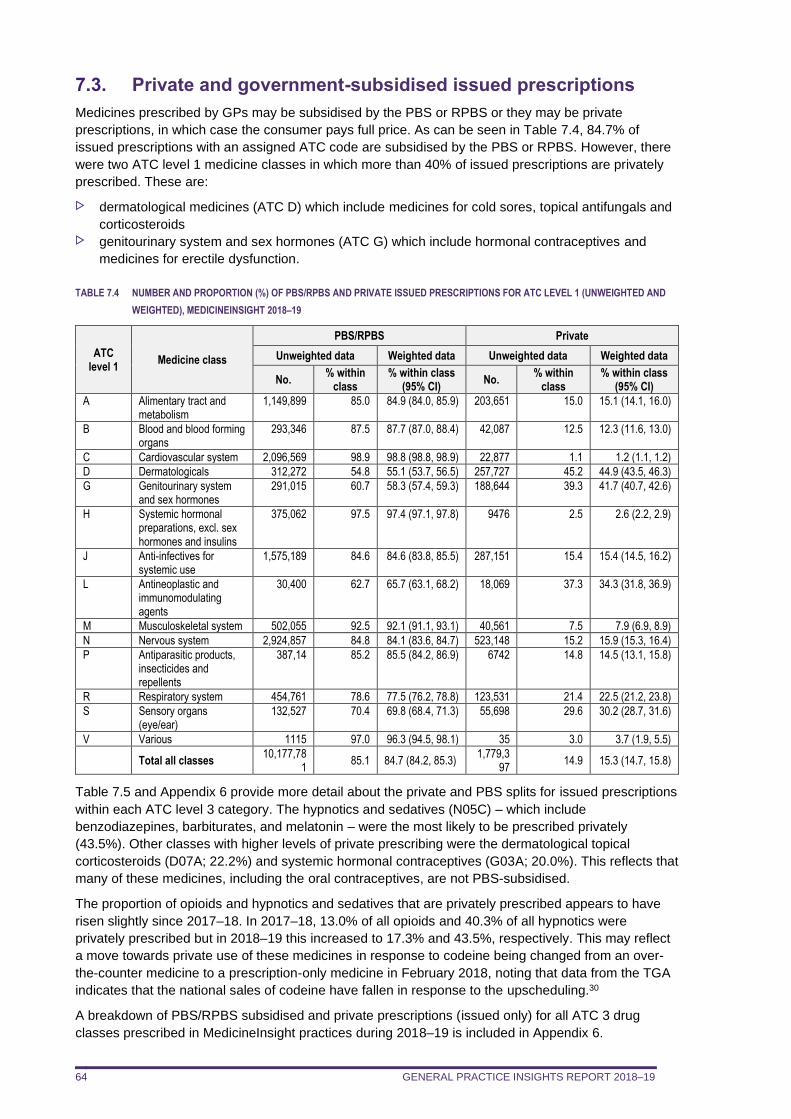
GENERAL PRACTICE INSIGHTS REPORT 2018–19 64
7.3. Private and government-subsidised issued prescriptions
Medicines prescribed by GPs may be subsidised by the PBS or RPBS or they may be private
prescriptions, in which case the consumer pays full price. As can be seen in Table 7.4, 84.7% of
issued prescriptions with an assigned ATC code are subsidised by the PBS or RPBS. However, there
were two ATC level 1 medicine classes in which more than 40% of issued prescriptions are privately
prescribed. These are:
dermatological medicines (ATC D) which include medicines for cold sores, topical antifungals and
corticosteroids genitourinary system and sex hormones (ATC G) which include hormonal contraceptives and
medicines for erectile dysfunction.
TABLE 7.4 NUMBER AND PROPORTION (%) OF PBS/RPBS AND PRIVATE ISSUED PRESCRIPTIONS FOR ATC LEVEL 1 (UNWEIGHTED AND
WEIGHTED), MEDICINEINSIGHT 2018–19
ATC level 1
Medicine class
PBS/RPBS Private
Unweighted data Weighted data Unweighted data Weighted data
No. % within
class % within class
(95% CI) No.
% within class
% within class (95% CI)
A Alimentary tract and metabolism
1,149,899 85.0 84.9 (84.0, 85.9) 203,651 15.0 15.1 (14.1, 16.0)
B Blood and blood forming organs
293,346 87.5 87.7 (87.0, 88.4) 42,087 12.5 12.3 (11.6, 13.0)
C Cardiovascular system 2,096,569 98.9 98.8 (98.8, 98.9) 22,877 1.1 1.2 (1.1, 1.2)
D Dermatologicals 312,272 54.8 55.1 (53.7, 56.5) 257,727 45.2 44.9 (43.5, 46.3)
G Genitourinary system and sex hormones
291,015 60.7 58.3 (57.4, 59.3) 188,644 39.3 41.7 (40.7, 42.6)
H Systemic hormonal preparations, excl. sex hormones and insulins
375,062 97.5 97.4 (97.1, 97.8) 9476 2.5 2.6 (2.2, 2.9)
J Anti-infectives for systemic use
1,575,189 84.6 84.6 (83.8, 85.5) 287,151 15.4 15.4 (14.5, 16.2)
L Antineoplastic and immunomodulating agents
30,400 62.7 65.7 (63.1, 68.2) 18,069 37.3 34.3 (31.8, 36.9)
M Musculoskeletal system 502,055 92.5 92.1 (91.1, 93.1) 40,561 7.5 7.9 (6.9, 8.9)
N Nervous system 2,924,857 84.8 84.1 (83.6, 84.7) 523,148 15.2 15.9 (15.3, 16.4)
P Antiparasitic products, insecticides and repellents
387,14 85.2 85.5 (84.2, 86.9) 6742 14.8 14.5 (13.1, 15.8)
R Respiratory system 454,761 78.6 77.5 (76.2, 78.8) 123,531 21.4 22.5 (21.2, 23.8)
S Sensory organs (eye/ear)
132,527 70.4 69.8 (68.4, 71.3) 55,698 29.6 30.2 (28.7, 31.6)
V Various 1115 97.0 96.3 (94.5, 98.1) 35 3.0 3.7 (1.9, 5.5)
Total all classes 10,177,78
1 85.1 84.7 (84.2, 85.3)
1,779,397
14.9 15.3 (14.7, 15.8)
Table 7.5 and Appendix 6 provide more detail about the private and PBS splits for issued prescriptions
within each ATC level 3 category. The hypnotics and sedatives (N05C) – which include
benzodiazepines, barbiturates, and melatonin – were the most likely to be prescribed privately
(43.5%). Other classes with higher levels of private prescribing were the dermatological topical
corticosteroids (D07A; 22.2%) and systemic hormonal contraceptives (G03A; 20.0%). This reflects that
many of these medicines, including the oral contraceptives, are not PBS-subsidised.
The proportion of opioids and hypnotics and sedatives that are privately prescribed appears to have
risen slightly since 2017–18. In 2017–18, 13.0% of all opioids and 40.3% of all hypnotics were
privately prescribed but in 2018–19 this increased to 17.3% and 43.5%, respectively. This may reflect
a move towards private use of these medicines in response to codeine being changed from an over-
the-counter medicine to a prescription-only medicine in February 2018, noting that data from the TGA
indicates that the national sales of codeine have fallen in response to the upscheduling.30
A breakdown of PBS/RPBS subsidised and private prescriptions (issued only) for all ATC 3 drug
classes prescribed in MedicineInsight practices during 2018–19 is included in Appendix 6.
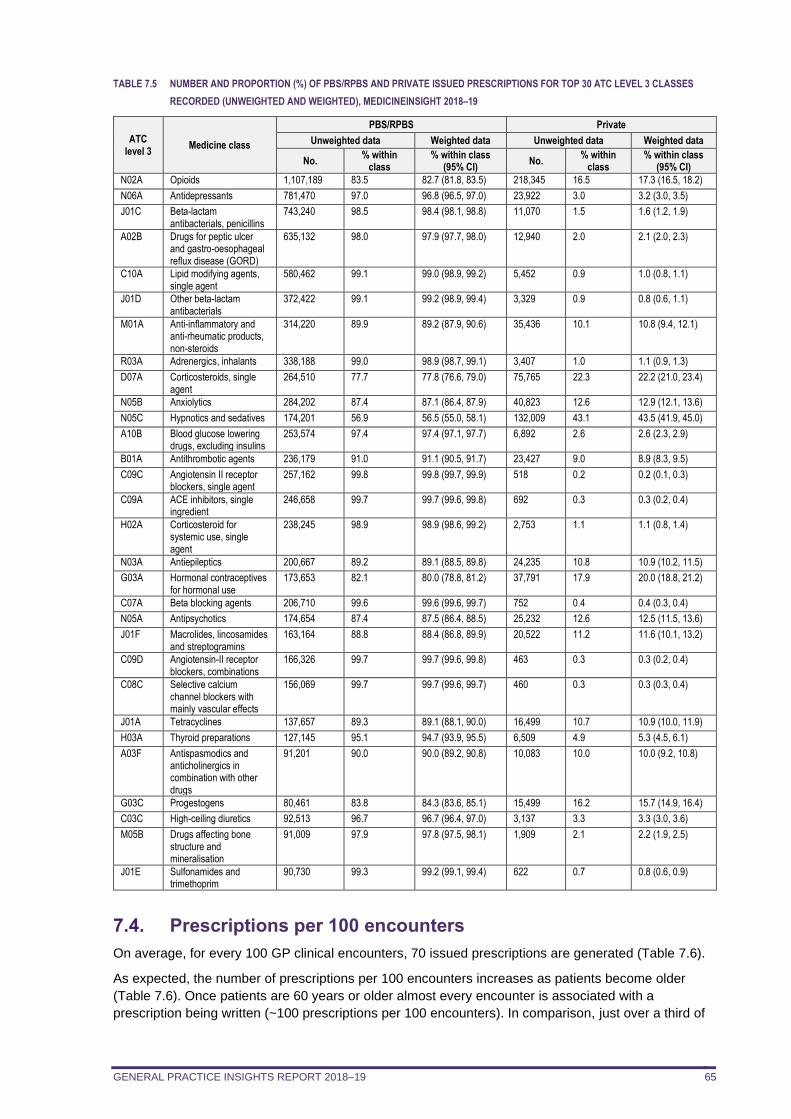
GENERAL PRACTICE INSIGHTS REPORT 2018–19 65
TABLE 7.5 NUMBER AND PROPORTION (%) OF PBS/RPBS AND PRIVATE ISSUED PRESCRIPTIONS FOR TOP 30 ATC LEVEL 3 CLASSES
RECORDED (UNWEIGHTED AND WEIGHTED), MEDICINEINSIGHT 2018–19
ATC level 3
Medicine class
PBS/RPBS Private
Unweighted data Weighted data Unweighted data Weighted data
No. % within
class % within class
(95% CI) No.
% within class
% within class (95% CI)
N02A Opioids 1,107,189 83.5 82.7 (81.8, 83.5) 218,345 16.5 17.3 (16.5, 18.2)
N06A Antidepressants 781,470 97.0 96.8 (96.5, 97.0) 23,922 3.0 3.2 (3.0, 3.5)
J01C Beta-lactam antibacterials, penicillins
743,240 98.5 98.4 (98.1, 98.8) 11,070 1.5 1.6 (1.2, 1.9)
A02B Drugs for peptic ulcer and gastro-oesophageal reflux disease (GORD)
635,132 98.0 97.9 (97.7, 98.0) 12,940 2.0 2.1 (2.0, 2.3)
C10A Lipid modifying agents, single agent
580,462 99.1 99.0 (98.9, 99.2) 5,452 0.9 1.0 (0.8, 1.1)
J01D Other beta-lactam antibacterials
372,422 99.1 99.2 (98.9, 99.4) 3,329 0.9 0.8 (0.6, 1.1)
M01A Anti-inflammatory and anti-rheumatic products, non-steroids
314,220 89.9 89.2 (87.9, 90.6) 35,436 10.1 10.8 (9.4, 12.1)
R03A Adrenergics, inhalants 338,188 99.0 98.9 (98.7, 99.1) 3,407 1.0 1.1 (0.9, 1.3)
D07A Corticosteroids, single agent
264,510 77.7 77.8 (76.6, 79.0) 75,765 22.3 22.2 (21.0, 23.4)
N05B Anxiolytics 284,202 87.4 87.1 (86.4, 87.9) 40,823 12.6 12.9 (12.1, 13.6)
N05C Hypnotics and sedatives 174,201 56.9 56.5 (55.0, 58.1) 132,009 43.1 43.5 (41.9, 45.0)
A10B Blood glucose lowering drugs, excluding insulins
253,574 97.4 97.4 (97.1, 97.7) 6,892 2.6 2.6 (2.3, 2.9)
B01A Antithrombotic agents 236,179 91.0 91.1 (90.5, 91.7) 23,427 9.0 8.9 (8.3, 9.5)
C09C Angiotensin II receptor blockers, single agent
257,162 99.8 99.8 (99.7, 99.9) 518 0.2 0.2 (0.1, 0.3)
C09A ACE inhibitors, single ingredient
246,658 99.7 99.7 (99.6, 99.8) 692 0.3 0.3 (0.2, 0.4)
H02A Corticosteroid for systemic use, single agent
238,245 98.9 98.9 (98.6, 99.2) 2,753 1.1 1.1 (0.8, 1.4)
N03A Antiepileptics 200,667 89.2 89.1 (88.5, 89.8) 24,235 10.8 10.9 (10.2, 11.5)
G03A Hormonal contraceptives for hormonal use
173,653 82.1 80.0 (78.8, 81.2) 37,791 17.9 20.0 (18.8, 21.2)
C07A Beta blocking agents 206,710 99.6 99.6 (99.6, 99.7) 752 0.4 0.4 (0.3, 0.4)
N05A Antipsychotics 174,654 87.4 87.5 (86.4, 88.5) 25,232 12.6 12.5 (11.5, 13.6)
J01F Macrolides, lincosamides and streptogramins
163,164 88.8 88.4 (86.8, 89.9) 20,522 11.2 11.6 (10.1, 13.2)
C09D Angiotensin-II receptor blockers, combinations
166,326 99.7 99.7 (99.6, 99.8) 463 0.3 0.3 (0.2, 0.4)
C08C Selective calcium channel blockers with mainly vascular effects
156,069 99.7 99.7 (99.6, 99.7) 460 0.3 0.3 (0.3, 0.4)
J01A Tetracyclines 137,657 89.3 89.1 (88.1, 90.0) 16,499 10.7 10.9 (10.0, 11.9)
H03A Thyroid preparations 127,145 95.1 94.7 (93.9, 95.5) 6,509 4.9 5.3 (4.5, 6.1)
A03F Antispasmodics and anticholinergics in combination with other drugs
91,201 90.0 90.0 (89.2, 90.8) 10,083 10.0 10.0 (9.2, 10.8)
G03C Progestogens 80,461 83.8 84.3 (83.6, 85.1) 15,499 16.2 15.7 (14.9, 16.4)
C03C High-ceiling diuretics 92,513 96.7 96.7 (96.4, 97.0) 3,137 3.3 3.3 (3.0, 3.6)
M05B Drugs affecting bone structure and mineralisation
91,009 97.9 97.8 (97.5, 98.1) 1,909 2.1 2.2 (1.9, 2.5)
J01E Sulfonamides and trimethoprim
90,730 99.3 99.2 (99.1, 99.4) 622 0.7 0.8 (0.6, 0.9)
7.4. Prescriptions per 100 encounters
On average, for every 100 GP clinical encounters, 70 issued prescriptions are generated (Table 7.6).
As expected, the number of prescriptions per 100 encounters increases as patients become older
(Table 7.6). Once patients are 60 years or older almost every encounter is associated with a
prescription being written (~100 prescriptions per 100 encounters). In comparison, just over a third of
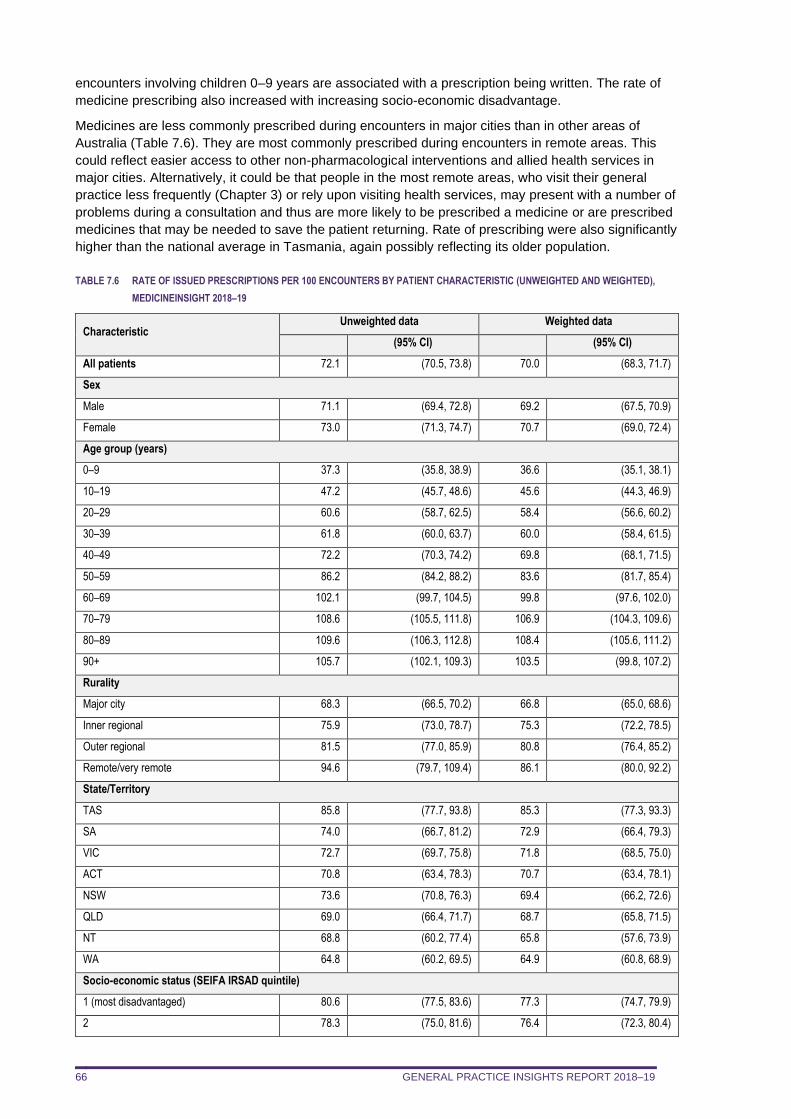
GENERAL PRACTICE INSIGHTS REPORT 2018–19 66
encounters involving children 0–9 years are associated with a prescription being written. The rate of
medicine prescribing also increased with increasing socio-economic disadvantage.
Medicines are less commonly prescribed during encounters in major cities than in other areas of
Australia (Table 7.6). They are most commonly prescribed during encounters in remote areas. This
could reflect easier access to other non-pharmacological interventions and allied health services in
major cities. Alternatively, it could be that people in the most remote areas, who visit their general
practice less frequently (Chapter 3) or rely upon visiting health services, may present with a number of
problems during a consultation and thus are more likely to be prescribed a medicine or are prescribed
medicines that may be needed to save the patient returning. Rate of prescribing were also significantly
higher than the national average in Tasmania, again possibly reflecting its older population.
TABLE 7.6 RATE OF ISSUED PRESCRIPTIONS PER 100 ENCOUNTERS BY PATIENT CHARACTERISTIC (UNWEIGHTED AND WEIGHTED),
MEDICINEINSIGHT 2018–19
Characteristic Unweighted data Weighted data
(95% CI) (95% CI)
All patients 72.1 (70.5, 73.8) 70.0 (68.3, 71.7)
Sex
Male 71.1 (69.4, 72.8) 69.2 (67.5, 70.9)
Female 73.0 (71.3, 74.7) 70.7 (69.0, 72.4)
Age group (years)
0–9 37.3 (35.8, 38.9) 36.6 (35.1, 38.1)
10–19 47.2 (45.7, 48.6) 45.6 (44.3, 46.9)
20–29 60.6 (58.7, 62.5) 58.4 (56.6, 60.2)
30–39 61.8 (60.0, 63.7) 60.0 (58.4, 61.5)
40–49 72.2 (70.3, 74.2) 69.8 (68.1, 71.5)
50–59 86.2 (84.2, 88.2) 83.6 (81.7, 85.4)
60–69 102.1 (99.7, 104.5) 99.8 (97.6, 102.0)
70–79 108.6 (105.5, 111.8) 106.9 (104.3, 109.6)
80–89 109.6 (106.3, 112.8) 108.4 (105.6, 111.2)
90+ 105.7 (102.1, 109.3) 103.5 (99.8, 107.2)
Rurality
Major city 68.3 (66.5, 70.2) 66.8 (65.0, 68.6)
Inner regional 75.9 (73.0, 78.7) 75.3 (72.2, 78.5)
Outer regional 81.5 (77.0, 85.9) 80.8 (76.4, 85.2)
Remote/very remote 94.6 (79.7, 109.4) 86.1 (80.0, 92.2)
State/Territory
TAS 85.8 (77.7, 93.8) 85.3 (77.3, 93.3)
SA 74.0 (66.7, 81.2) 72.9 (66.4, 79.3)
VIC 72.7 (69.7, 75.8) 71.8 (68.5, 75.0)
ACT 70.8 (63.4, 78.3) 70.7 (63.4, 78.1)
NSW 73.6 (70.8, 76.3) 69.4 (66.2, 72.6)
QLD 69.0 (66.4, 71.7) 68.7 (65.8, 71.5)
NT 68.8 (60.2, 77.4) 65.8 (57.6, 73.9)
WA 64.8 (60.2, 69.5) 64.9 (60.8, 68.9)
Socio-economic status (SEIFA IRSAD quintile)
1 (most disadvantaged) 80.6 (77.5, 83.6) 77.3 (74.7, 79.9)
2 78.3 (75.0, 81.6) 76.4 (72.3, 80.4)
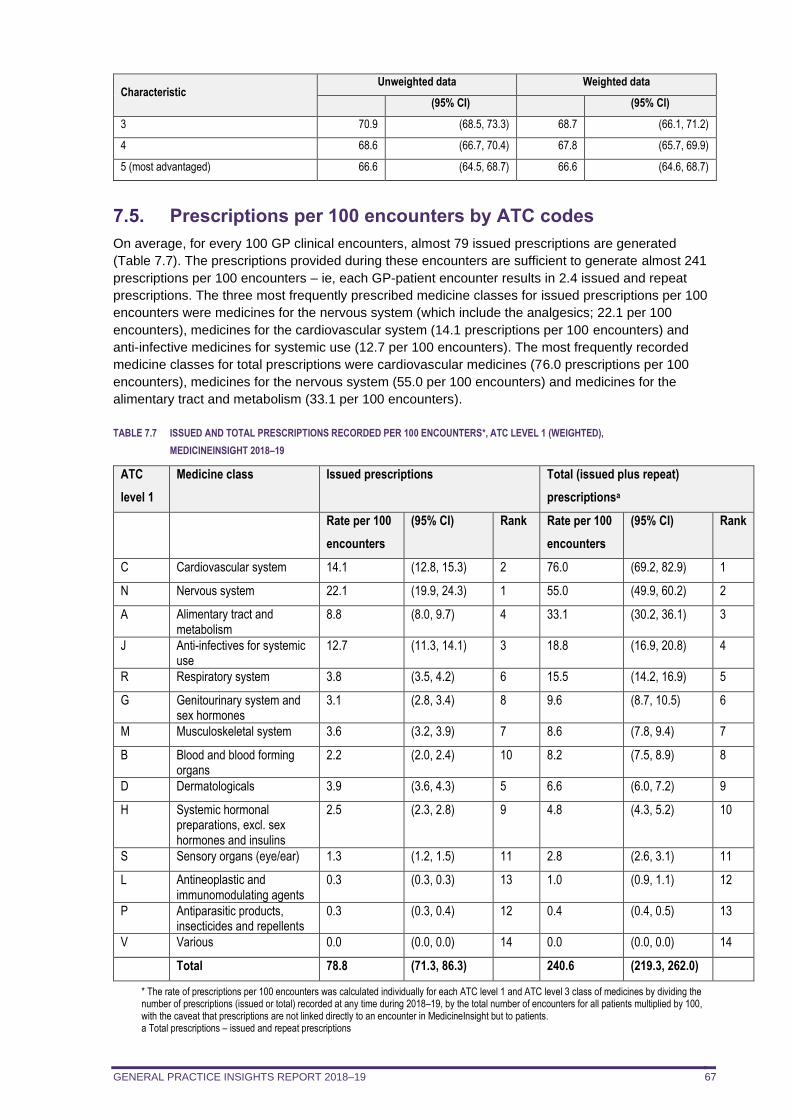
GENERAL PRACTICE INSIGHTS REPORT 2018–19 67
Characteristic Unweighted data Weighted data
(95% CI) (95% CI)
3 70.9 (68.5, 73.3) 68.7 (66.1, 71.2)
4 68.6 (66.7, 70.4) 67.8 (65.7, 69.9)
5 (most advantaged) 66.6 (64.5, 68.7) 66.6 (64.6, 68.7)
7.5. Prescriptions per 100 encounters by ATC codes
On average, for every 100 GP clinical encounters, almost 79 issued prescriptions are generated
(Table 7.7). The prescriptions provided during these encounters are sufficient to generate almost 241
prescriptions per 100 encounters – ie, each GP-patient encounter results in 2.4 issued and repeat
prescriptions. The three most frequently prescribed medicine classes for issued prescriptions per 100
encounters were medicines for the nervous system (which include the analgesics; 22.1 per 100
encounters), medicines for the cardiovascular system (14.1 prescriptions per 100 encounters) and
anti-infective medicines for systemic use (12.7 per 100 encounters). The most frequently recorded
medicine classes for total prescriptions were cardiovascular medicines (76.0 prescriptions per 100
encounters), medicines for the nervous system (55.0 per 100 encounters) and medicines for the
alimentary tract and metabolism (33.1 per 100 encounters).
TABLE 7.7 ISSUED AND TOTAL PRESCRIPTIONS RECORDED PER 100 ENCOUNTERS*, ATC LEVEL 1 (WEIGHTED),
MEDICINEINSIGHT 2018–19
ATC
level 1
Medicine class Issued prescriptions Total (issued plus repeat)
prescriptionsa
Rate per 100
encounters
(95% CI) Rank Rate per 100
encounters
(95% CI) Rank
C Cardiovascular system 14.1 (12.8, 15.3) 2 76.0 (69.2, 82.9) 1
N Nervous system 22.1 (19.9, 24.3) 1 55.0 (49.9, 60.2) 2
A Alimentary tract and metabolism
8.8 (8.0, 9.7) 4 33.1 (30.2, 36.1) 3
J Anti-infectives for systemic use
12.7 (11.3, 14.1) 3 18.8 (16.9, 20.8) 4
R Respiratory system 3.8 (3.5, 4.2) 6 15.5 (14.2, 16.9) 5
G Genitourinary system and sex hormones
3.1 (2.8, 3.4) 8 9.6 (8.7, 10.5) 6
M Musculoskeletal system 3.6 (3.2, 3.9) 7 8.6 (7.8, 9.4) 7
B Blood and blood forming organs
2.2 (2.0, 2.4) 10 8.2 (7.5, 8.9) 8
D Dermatologicals 3.9 (3.6, 4.3) 5 6.6 (6.0, 7.2) 9
H Systemic hormonal preparations, excl. sex hormones and insulins
2.5 (2.3, 2.8) 9 4.8 (4.3, 5.2) 10
S Sensory organs (eye/ear) 1.3 (1.2, 1.5) 11 2.8 (2.6, 3.1) 11
L Antineoplastic and immunomodulating agents
0.3 (0.3, 0.3) 13 1.0 (0.9, 1.1) 12
P Antiparasitic products, insecticides and repellents
0.3 (0.3, 0.4) 12 0.4 (0.4, 0.5) 13
V Various 0.0 (0.0, 0.0) 14 0.0 (0.0, 0.0) 14
Total 78.8 (71.3, 86.3) 240.6 (219.3, 262.0)
* The rate of prescriptions per 100 encounters was calculated individually for each ATC level 1 and ATC level 3 class of medicines by dividing the number of prescriptions (issued or total) recorded at any time during 2018–19, by the total number of encounters for all patients multiplied by 100, with the caveat that prescriptions are not linked directly to an encounter in MedicineInsight but to patients. a Total prescriptions – issued and repeat prescriptions
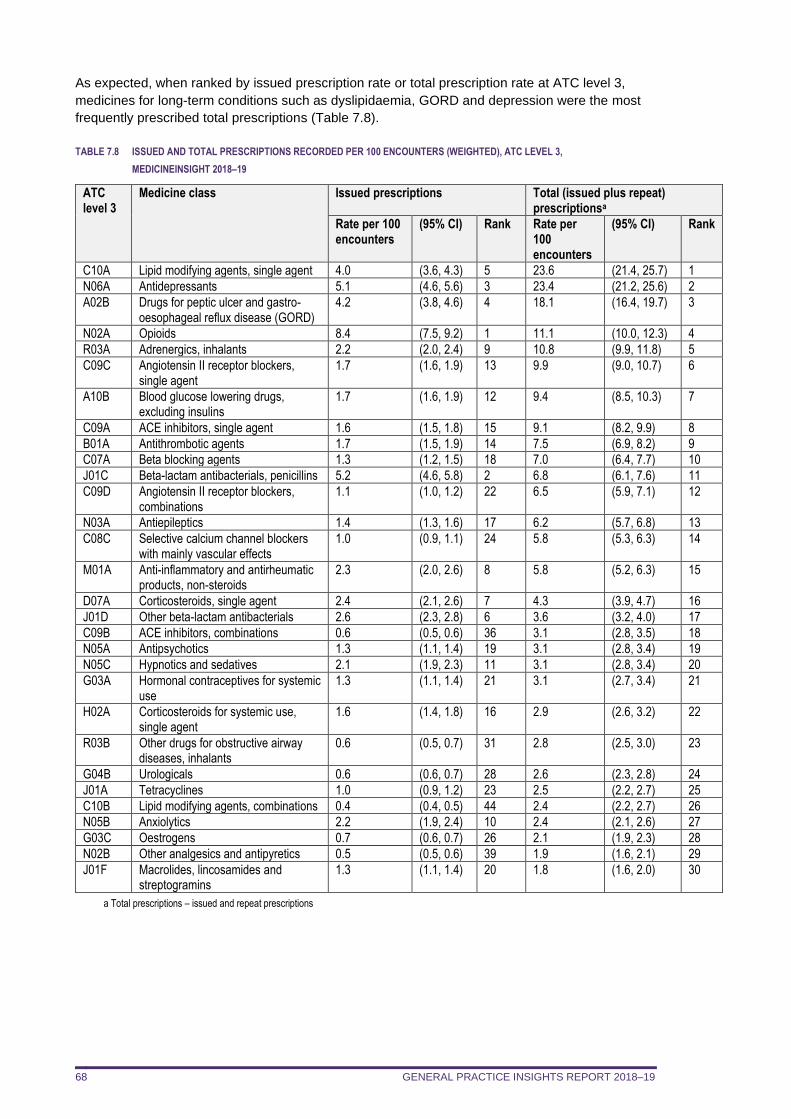
GENERAL PRACTICE INSIGHTS REPORT 2018–19 68
As expected, when ranked by issued prescription rate or total prescription rate at ATC level 3,
medicines for long-term conditions such as dyslipidaemia, GORD and depression were the most
frequently prescribed total prescriptions (Table 7.8).
TABLE 7.8 ISSUED AND TOTAL PRESCRIPTIONS RECORDED PER 100 ENCOUNTERS (WEIGHTED), ATC LEVEL 3,
MEDICINEINSIGHT 2018–19
ATC level 3
Medicine class Issued prescriptions Total (issued plus repeat) prescriptionsa
Rate per 100 encounters
(95% CI) Rank Rate per 100 encounters
(95% CI) Rank
C10A Lipid modifying agents, single agent 4.0 (3.6, 4.3) 5 23.6 (21.4, 25.7) 1
N06A Antidepressants 5.1 (4.6, 5.6) 3 23.4 (21.2, 25.6) 2
A02B Drugs for peptic ulcer and gastro-oesophageal reflux disease (GORD)
4.2 (3.8, 4.6) 4 18.1 (16.4, 19.7) 3
N02A Opioids 8.4 (7.5, 9.2) 1 11.1 (10.0, 12.3) 4
R03A Adrenergics, inhalants 2.2 (2.0, 2.4) 9 10.8 (9.9, 11.8) 5
C09C Angiotensin II receptor blockers, single agent
1.7 (1.6, 1.9) 13 9.9 (9.0, 10.7) 6
A10B Blood glucose lowering drugs, excluding insulins
1.7 (1.6, 1.9) 12 9.4 (8.5, 10.3) 7
C09A ACE inhibitors, single agent 1.6 (1.5, 1.8) 15 9.1 (8.2, 9.9) 8
B01A Antithrombotic agents 1.7 (1.5, 1.9) 14 7.5 (6.9, 8.2) 9
C07A Beta blocking agents 1.3 (1.2, 1.5) 18 7.0 (6.4, 7.7) 10
J01C Beta-lactam antibacterials, penicillins 5.2 (4.6, 5.8) 2 6.8 (6.1, 7.6) 11
C09D Angiotensin II receptor blockers, combinations
1.1 (1.0, 1.2) 22 6.5 (5.9, 7.1) 12
N03A Antiepileptics 1.4 (1.3, 1.6) 17 6.2 (5.7, 6.8) 13
C08C Selective calcium channel blockers with mainly vascular effects
1.0 (0.9, 1.1) 24 5.8 (5.3, 6.3) 14
M01A Anti-inflammatory and antirheumatic products, non-steroids
2.3 (2.0, 2.6) 8 5.8 (5.2, 6.3) 15
D07A Corticosteroids, single agent 2.4 (2.1, 2.6) 7 4.3 (3.9, 4.7) 16
J01D Other beta-lactam antibacterials 2.6 (2.3, 2.8) 6 3.6 (3.2, 4.0) 17
C09B ACE inhibitors, combinations 0.6 (0.5, 0.6) 36 3.1 (2.8, 3.5) 18
N05A Antipsychotics 1.3 (1.1, 1.4) 19 3.1 (2.8, 3.4) 19
N05C Hypnotics and sedatives 2.1 (1.9, 2.3) 11 3.1 (2.8, 3.4) 20
G03A Hormonal contraceptives for systemic use
1.3 (1.1, 1.4) 21 3.1 (2.7, 3.4) 21
H02A Corticosteroids for systemic use, single agent
1.6 (1.4, 1.8) 16 2.9 (2.6, 3.2) 22
R03B Other drugs for obstructive airway diseases, inhalants
0.6 (0.5, 0.7) 31 2.8 (2.5, 3.0) 23
G04B Urologicals 0.6 (0.6, 0.7) 28 2.6 (2.3, 2.8) 24
J01A Tetracyclines 1.0 (0.9, 1.2) 23 2.5 (2.2, 2.7) 25
C10B Lipid modifying agents, combinations 0.4 (0.4, 0.5) 44 2.4 (2.2, 2.7) 26
N05B Anxiolytics 2.2 (1.9, 2.4) 10 2.4 (2.1, 2.6) 27
G03C Oestrogens 0.7 (0.6, 0.7) 26 2.1 (1.9, 2.3) 28
N02B Other analgesics and antipyretics 0.5 (0.5, 0.6) 39 1.9 (1.6, 2.1) 29
J01F Macrolides, lincosamides and streptogramins
1.3 (1.1, 1.4) 20 1.8 (1.6, 2.0) 30
a Total prescriptions – issued and repeat prescriptions
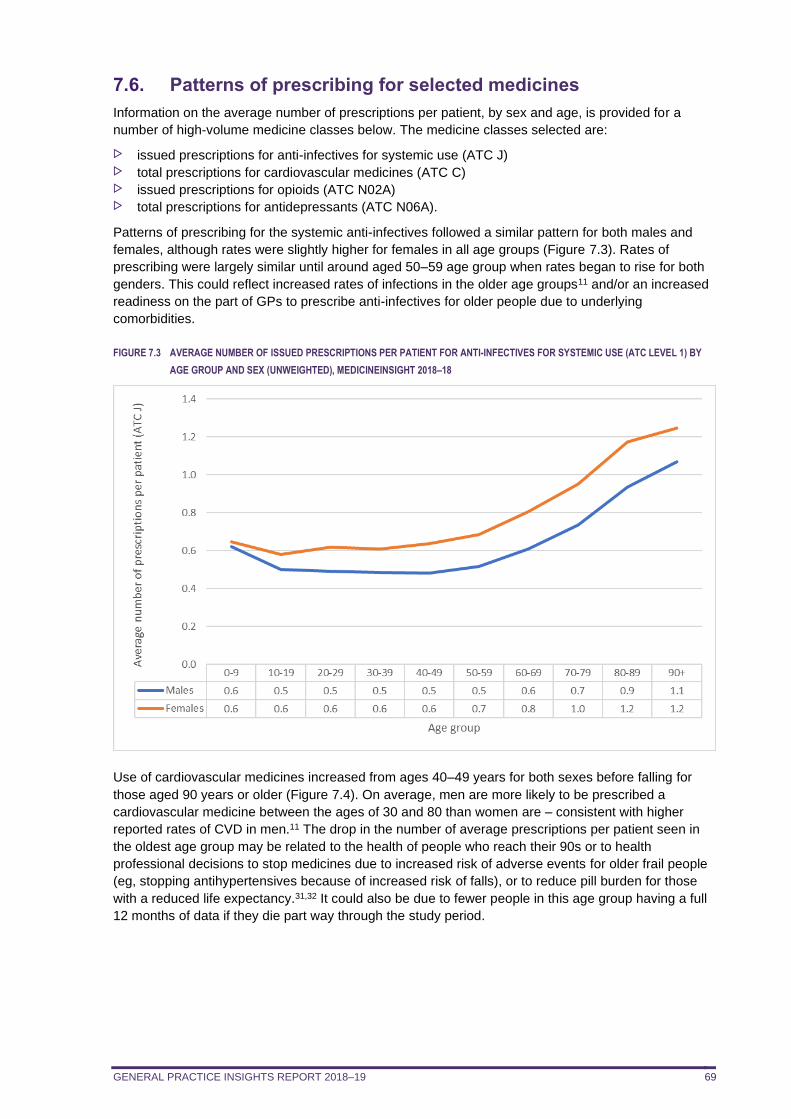
GENERAL PRACTICE INSIGHTS REPORT 2018–19 69
7.6. Patterns of prescribing for selected medicines
Information on the average number of prescriptions per patient, by sex and age, is provided for a
number of high-volume medicine classes below. The medicine classes selected are:
issued prescriptions for anti-infectives for systemic use (ATC J) total prescriptions for cardiovascular medicines (ATC C) issued prescriptions for opioids (ATC N02A) total prescriptions for antidepressants (ATC N06A).
Patterns of prescribing for the systemic anti-infectives followed a similar pattern for both males and
females, although rates were slightly higher for females in all age groups (Figure 7.3). Rates of
prescribing were largely similar until around aged 50–59 age group when rates began to rise for both
genders. This could reflect increased rates of infections in the older age groups11 and/or an increased
readiness on the part of GPs to prescribe anti-infectives for older people due to underlying
comorbidities.
FIGURE 7.3 AVERAGE NUMBER OF ISSUED PRESCRIPTIONS PER PATIENT FOR ANTI-INFECTIVES FOR SYSTEMIC USE (ATC LEVEL 1) BY
AGE GROUP AND SEX (UNWEIGHTED), MEDICINEINSIGHT 2018–18
Use of cardiovascular medicines increased from ages 40–49 years for both sexes before falling for
those aged 90 years or older (Figure 7.4). On average, men are more likely to be prescribed a
cardiovascular medicine between the ages of 30 and 80 than women are – consistent with higher
reported rates of CVD in men.11 The drop in the number of average prescriptions per patient seen in
the oldest age group may be related to the health of people who reach their 90s or to health
professional decisions to stop medicines due to increased risk of adverse events for older frail people
(eg, stopping antihypertensives because of increased risk of falls), or to reduce pill burden for those
with a reduced life expectancy.31,32 It could also be due to fewer people in this age group having a full
12 months of data if they die part way through the study period.
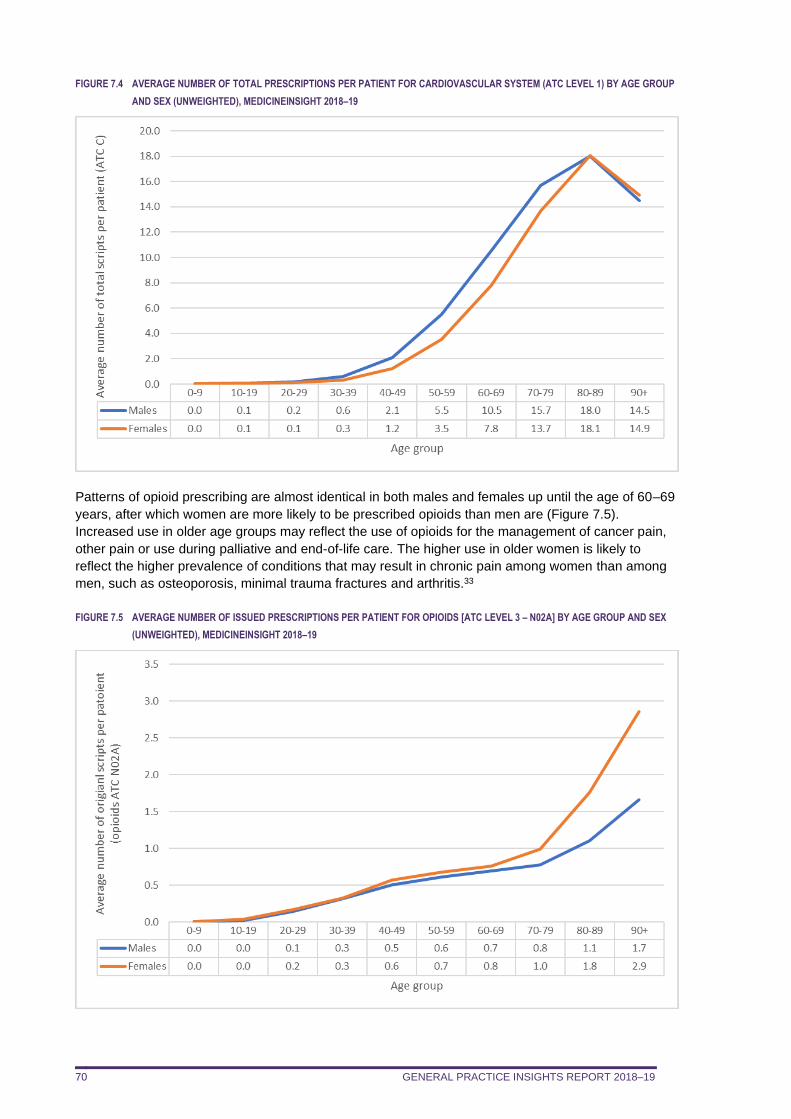
GENERAL PRACTICE INSIGHTS REPORT 2018–19 70
FIGURE 7.4 AVERAGE NUMBER OF TOTAL PRESCRIPTIONS PER PATIENT FOR CARDIOVASCULAR SYSTEM (ATC LEVEL 1) BY AGE GROUP
AND SEX (UNWEIGHTED), MEDICINEINSIGHT 2018–19
Patterns of opioid prescribing are almost identical in both males and females up until the age of 60–69
years, after which women are more likely to be prescribed opioids than men are (Figure 7.5).
Increased use in older age groups may reflect the use of opioids for the management of cancer pain,
other pain or use during palliative and end-of-life care. The higher use in older women is likely to
reflect the higher prevalence of conditions that may result in chronic pain among women than among
men, such as osteoporosis, minimal trauma fractures and arthritis.33
FIGURE 7.5 AVERAGE NUMBER OF ISSUED PRESCRIPTIONS PER PATIENT FOR OPIOIDS [ATC LEVEL 3 – N02A] BY AGE GROUP AND SEX
(UNWEIGHTED), MEDICINEINSIGHT 2018–19
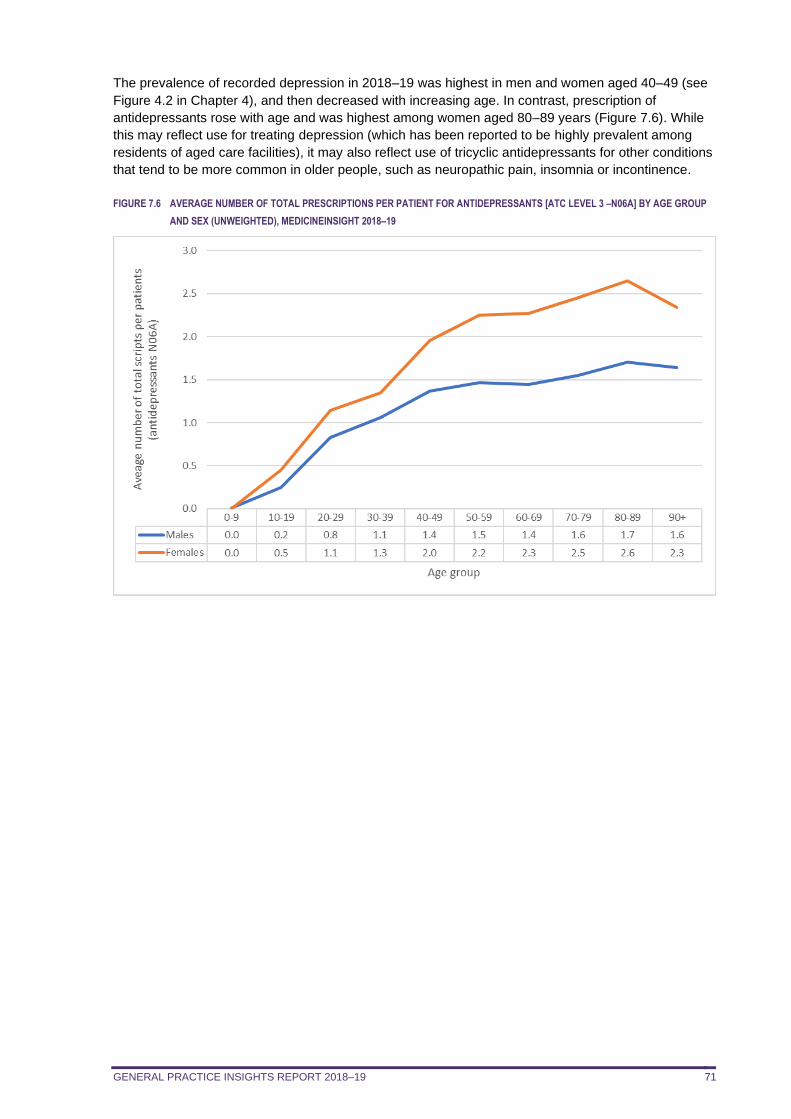
GENERAL PRACTICE INSIGHTS REPORT 2018–19 71
The prevalence of recorded depression in 2018–19 was highest in men and women aged 40–49 (see
Figure 4.2 in Chapter 4), and then decreased with increasing age. In contrast, prescription of
antidepressants rose with age and was highest among women aged 80–89 years (Figure 7.6). While
this may reflect use for treating depression (which has been reported to be highly prevalent among
residents of aged care facilities), it may also reflect use of tricyclic antidepressants for other conditions
that tend to be more common in older people, such as neuropathic pain, insomnia or incontinence.
FIGURE 7.6 AVERAGE NUMBER OF TOTAL PRESCRIPTIONS PER PATIENT FOR ANTIDEPRESSANTS [ATC LEVEL 3 –N06A] BY AGE GROUP
AND SEX (UNWEIGHTED), MEDICINEINSIGHT 2018–19
GENERAL PRACTICE INSIGHTS REPORT 2018–19 72
8. PATHOLOGY TESTING
In summary
Almost 72 million atomised pathology test results were recorded in MedicineInsight in 2018–19. There was an average of 24.8 atomised test results per patient in 2018–19, although 57.7% of
patients had no pathology tests recorded Age- and sex-specific rates showed an increase in the number of tests with age, and a higher
average number of tests for women compared to men. This was particularly apparent for
women of reproductive age, and could be due to testing related to pregnancy. Patients in the top 10% by pathology tests requested had more than 70 atomised pathology test
results during 2018–19. They were more likely to have chronic conditions such as type 2
diabetes and CKD and were also older. Using haemoglobin, creatinine and alanine aminotransferase as proxy measures, the
percentage of patients aged 20 years or older who had an FBC was 42.0%, a kidney function
test was 42.2% and a liver function LFT was 41.0%, respectively. Among patients with diagnosed diabetes who had their HbA1c level checked during 2018–19,
50.7% had at least one result which was higher than 53 mmol/mol (7.0%). Fewer than 10% of patients who had at least one TSH test had a result that fell outside the
reference range A quarter of patients with a vitamin D test had a result that fell outside the reference range.
This chapter reports on atomised pathology test results recorded in MedicineInsight in 2018–19 and
describes the following:
for selected pathology tests, the percentage of patients with results recorded and average number
of test results per 100 patients average number of atomised tests according to patient demographics age and sex-specific average numbers of pathology tests distribution of number of pathology tests per patient age and sex-specific distribution of patients in the top 10% by pathology test volume proportion and relative risk of selected conditions in patients in the top 10% by pathology test
volume for selected pathology tests, the percentage (%) of patients with results outside the reference
range.
8.1. Pathology test results by patient
There were 71,859,739 separate pathology test results recorded in MedicineInsight for 2017–18, or an
average of 24.8 atomised test results per patient using unweighted data.
Only 42.3% of patients (1,669,298) had one or more atomised pathology test result recorded in 2018–
19, and the remaining 57.7% of patients had no pathology tests recorded.
Pathology test results may come into the CIS from sources outside of the general practice, and the
results may not reflect tests ordered by each patient’s GP, such as if the patient is being tested
routinely as an inpatient, and the results are copied directly to the GP by the pathology laboratory. It is
also important to note that each component of a pathology test result is recorded separately
(atomised) in MedicineInsight. For example, a full blood count (FBC) would generate up to a dozen
individual test results, such as white cell count and haemoglobin concentration. Using proxy
measures, such as haemoglobin as a measure of an FBC, can give an indication of the volume per
patient of particular panels of commonly ordered tests. This is shown in Table 8.1, which gives the
proportion of patients who had results for selected pathology tests, and the average number of these
test results per 100 patients.
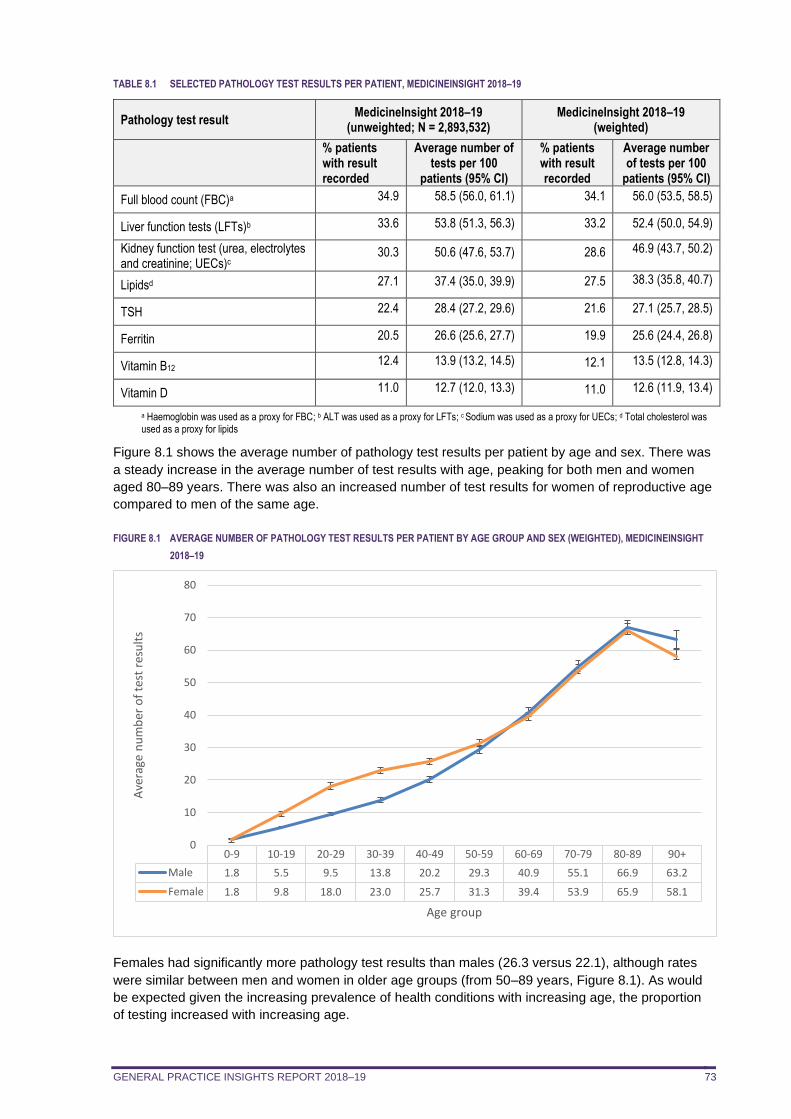
GENERAL PRACTICE INSIGHTS REPORT 2018–19 73
TABLE 8.1 SELECTED PATHOLOGY TEST RESULTS PER PATIENT, MEDICINEINSIGHT 2018–19
Pathology test result MedicineInsight 2018–19
(unweighted; N = 2,893,532) MedicineInsight 2018–19
(weighted)
% patients with result recorded
Average number of tests per 100
patients (95% CI)
% patients with result recorded
Average number of tests per 100
patients (95% CI)
Full blood count (FBC)a 34.9 58.5 (56.0, 61.1) 34.1 56.0 (53.5, 58.5)
Liver function tests (LFTs)b 33.6 53.8 (51.3, 56.3) 33.2 52.4 (50.0, 54.9)
Kidney function test (urea, electrolytes and creatinine; UECs)c
30.3 50.6 (47.6, 53.7) 28.6 46.9 (43.7, 50.2)
Lipidsd 27.1 37.4 (35.0, 39.9) 27.5 38.3 (35.8, 40.7)
TSH 22.4 28.4 (27.2, 29.6) 21.6 27.1 (25.7, 28.5)
Ferritin 20.5 26.6 (25.6, 27.7) 19.9 25.6 (24.4, 26.8)
Vitamin B12 12.4 13.9 (13.2, 14.5) 12.1 13.5 (12.8, 14.3)
Vitamin D 11.0 12.7 (12.0, 13.3) 11.0 12.6 (11.9, 13.4)
a Haemoglobin was used as a proxy for FBC; b ALT was used as a proxy for LFTs; c Sodium was used as a proxy for UECs; d Total cholesterol was used as a proxy for lipids
Figure 8.1 shows the average number of pathology test results per patient by age and sex. There was
a steady increase in the average number of test results with age, peaking for both men and women
aged 80–89 years. There was also an increased number of test results for women of reproductive age
compared to men of the same age.
FIGURE 8.1 AVERAGE NUMBER OF PATHOLOGY TEST RESULTS PER PATIENT BY AGE GROUP AND SEX (WEIGHTED), MEDICINEINSIGHT
2018–19
Females had significantly more pathology test results than males (26.3 versus 22.1), although rates
were similar between men and women in older age groups (from 50–89 years, Figure 8.1). As would
be expected given the increasing prevalence of health conditions with increasing age, the proportion
of testing increased with increasing age.
0-9 10-19 20-29 30-39 40-49 50-59 60-69 70-79 80-89 90+
Male 1.8 5.5 9.5 13.8 20.2 29.3 40.9 55.1 66.9 63.2
Female 1.8 9.8 18.0 23.0 25.7 31.3 39.4 53.9 65.9 58.1
0
10
20
30
40
50
60
70
80
Ave
rage
nu
mb
er o
f te
st r
esu
lts
Age group
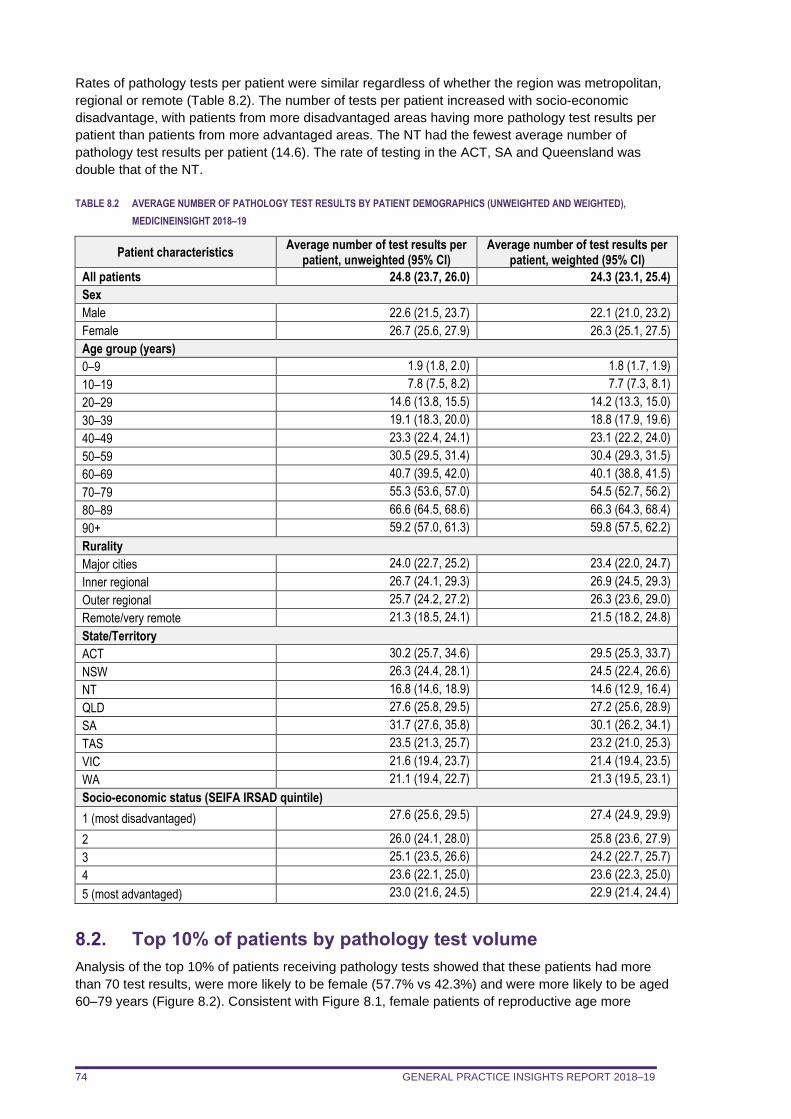
GENERAL PRACTICE INSIGHTS REPORT 2018–19 74
Rates of pathology tests per patient were similar regardless of whether the region was metropolitan,
regional or remote (Table 8.2). The number of tests per patient increased with socio-economic
disadvantage, with patients from more disadvantaged areas having more pathology test results per
patient than patients from more advantaged areas. The NT had the fewest average number of
pathology test results per patient (14.6). The rate of testing in the ACT, SA and Queensland was
double that of the NT.
TABLE 8.2 AVERAGE NUMBER OF PATHOLOGY TEST RESULTS BY PATIENT DEMOGRAPHICS (UNWEIGHTED AND WEIGHTED),
MEDICINEINSIGHT 2018–19
Patient characteristics Average number of test results per
patient, unweighted (95% CI) Average number of test results per
patient, weighted (95% CI)
All patients 24.8 (23.7, 26.0) 24.3 (23.1, 25.4)
Sex
Male 22.6 (21.5, 23.7) 22.1 (21.0, 23.2)
Female 26.7 (25.6, 27.9) 26.3 (25.1, 27.5)
Age group (years)
0–9 1.9 (1.8, 2.0) 1.8 (1.7, 1.9)
10–19 7.8 (7.5, 8.2) 7.7 (7.3, 8.1)
20–29 14.6 (13.8, 15.5) 14.2 (13.3, 15.0)
30–39 19.1 (18.3, 20.0) 18.8 (17.9, 19.6)
40–49 23.3 (22.4, 24.1) 23.1 (22.2, 24.0)
50–59 30.5 (29.5, 31.4) 30.4 (29.3, 31.5)
60–69 40.7 (39.5, 42.0) 40.1 (38.8, 41.5)
70–79 55.3 (53.6, 57.0) 54.5 (52.7, 56.2)
80–89 66.6 (64.5, 68.6) 66.3 (64.3, 68.4)
90+ 59.2 (57.0, 61.3) 59.8 (57.5, 62.2)
Rurality
Major cities 24.0 (22.7, 25.2) 23.4 (22.0, 24.7)
Inner regional 26.7 (24.1, 29.3) 26.9 (24.5, 29.3)
Outer regional 25.7 (24.2, 27.2) 26.3 (23.6, 29.0)
Remote/very remote 21.3 (18.5, 24.1) 21.5 (18.2, 24.8)
State/Territory
ACT 30.2 (25.7, 34.6) 29.5 (25.3, 33.7)
NSW 26.3 (24.4, 28.1) 24.5 (22.4, 26.6)
NT 16.8 (14.6, 18.9) 14.6 (12.9, 16.4)
QLD 27.6 (25.8, 29.5) 27.2 (25.6, 28.9)
SA 31.7 (27.6, 35.8) 30.1 (26.2, 34.1)
TAS 23.5 (21.3, 25.7) 23.2 (21.0, 25.3)
VIC 21.6 (19.4, 23.7) 21.4 (19.4, 23.5)
WA 21.1 (19.4, 22.7) 21.3 (19.5, 23.1)
Socio-economic status (SEIFA IRSAD quintile)
1 (most disadvantaged) 27.6 (25.6, 29.5) 27.4 (24.9, 29.9)
2 26.0 (24.1, 28.0) 25.8 (23.6, 27.9)
3 25.1 (23.5, 26.6) 24.2 (22.7, 25.7)
4 23.6 (22.1, 25.0) 23.6 (22.3, 25.0)
5 (most advantaged) 23.0 (21.6, 24.5) 22.9 (21.4, 24.4)
8.2. Top 10% of patients by pathology test volume
Analysis of the top 10% of patients receiving pathology tests showed that these patients had more
than 70 test results, were more likely to be female (57.7% vs 42.3%) and were more likely to be aged
60–79 years (Figure 8.2). Consistent with Figure 8.1, female patients of reproductive age more
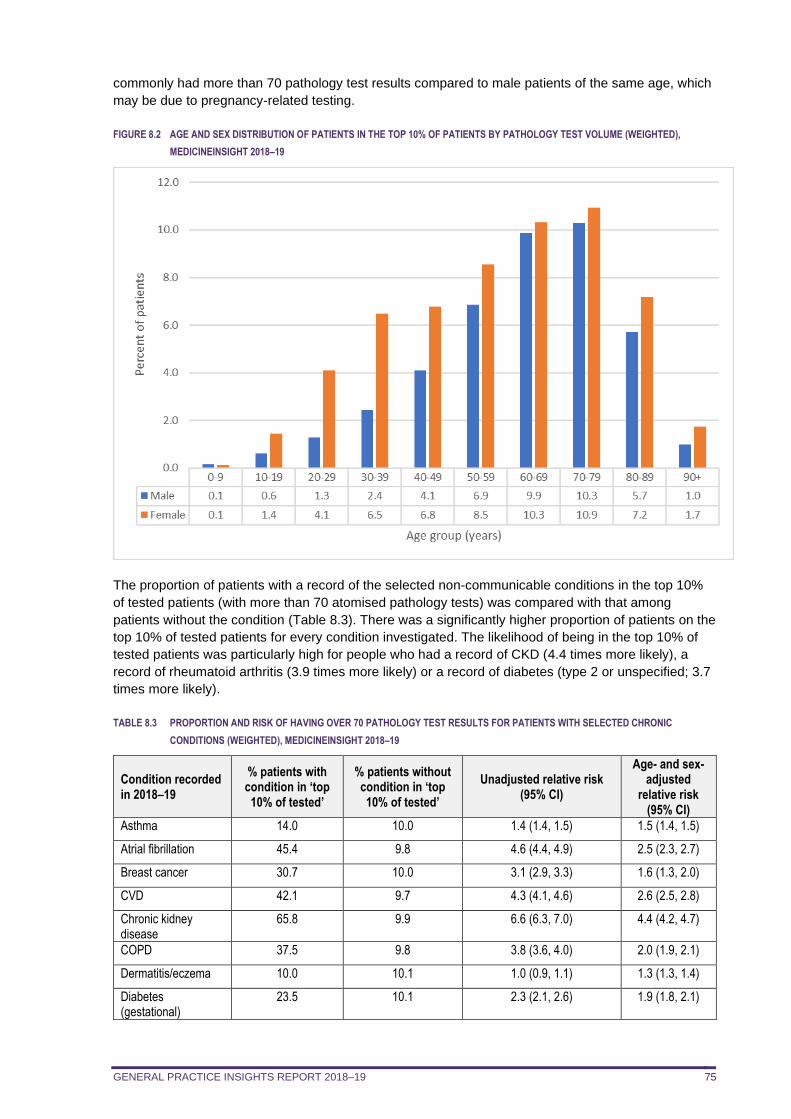
GENERAL PRACTICE INSIGHTS REPORT 2018–19 75
commonly had more than 70 pathology test results compared to male patients of the same age, which
may be due to pregnancy-related testing.
FIGURE 8.2 AGE AND SEX DISTRIBUTION OF PATIENTS IN THE TOP 10% OF PATIENTS BY PATHOLOGY TEST VOLUME (WEIGHTED),
MEDICINEINSIGHT 2018–19
The proportion of patients with a record of the selected non-communicable conditions in the top 10%
of tested patients (with more than 70 atomised pathology tests) was compared with that among
patients without the condition (Table 8.3). There was a significantly higher proportion of patients on the
top 10% of tested patients for every condition investigated. The likelihood of being in the top 10% of
tested patients was particularly high for people who had a record of CKD (4.4 times more likely), a
record of rheumatoid arthritis (3.9 times more likely) or a record of diabetes (type 2 or unspecified; 3.7
times more likely).
TABLE 8.3 PROPORTION AND RISK OF HAVING OVER 70 PATHOLOGY TEST RESULTS FOR PATIENTS WITH SELECTED CHRONIC
CONDITIONS (WEIGHTED), MEDICINEINSIGHT 2018–19
Condition recorded in 2018–19
% patients with condition in ‘top 10% of tested’
% patients without condition in ‘top 10% of tested’
Unadjusted relative risk (95% CI)
Age- and sex- adjusted
relative risk (95% CI)
Asthma 14.0 10.0 1.4 (1.4, 1.5) 1.5 (1.4, 1.5)
Atrial fibrillation 45.4 9.8 4.6 (4.4, 4.9) 2.5 (2.3, 2.7)
Breast cancer 30.7 10.0 3.1 (2.9, 3.3) 1.6 (1.3, 2.0)
CVD 42.1 9.7 4.3 (4.1, 4.6) 2.6 (2.5, 2.8)
Chronic kidney disease
65.8 9.9 6.6 (6.3, 7.0) 4.4 (4.2, 4.7)
COPD 37.5 9.8 3.8 (3.6, 4.0) 2.0 (1.9, 2.1)
Dermatitis/eczema 10.0 10.1 1.0 (0.9, 1.1) 1.3 (1.3, 1.4)
Diabetes (gestational)
23.5 10.1 2.3 (2.1, 2.6) 1.9 (1.8, 2.1)
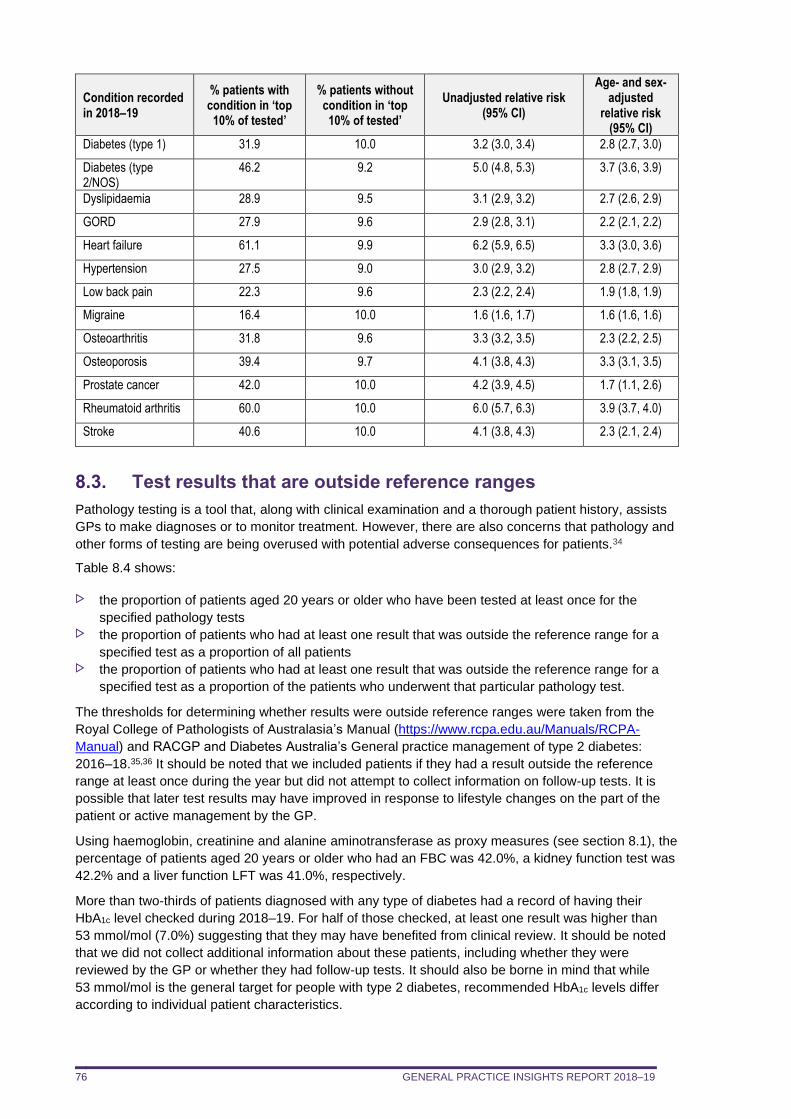
GENERAL PRACTICE INSIGHTS REPORT 2018–19 76
Condition recorded in 2018–19
% patients with condition in ‘top 10% of tested’
% patients without condition in ‘top 10% of tested’
Unadjusted relative risk (95% CI)
Age- and sex- adjusted
relative risk (95% CI)
Diabetes (type 1) 31.9 10.0 3.2 (3.0, 3.4) 2.8 (2.7, 3.0)
Diabetes (type 2/NOS)
46.2 9.2 5.0 (4.8, 5.3) 3.7 (3.6, 3.9)
Dyslipidaemia 28.9 9.5 3.1 (2.9, 3.2) 2.7 (2.6, 2.9)
GORD 27.9 9.6 2.9 (2.8, 3.1) 2.2 (2.1, 2.2)
Heart failure 61.1 9.9 6.2 (5.9, 6.5) 3.3 (3.0, 3.6)
Hypertension 27.5 9.0 3.0 (2.9, 3.2) 2.8 (2.7, 2.9)
Low back pain 22.3 9.6 2.3 (2.2, 2.4) 1.9 (1.8, 1.9)
Migraine 16.4 10.0 1.6 (1.6, 1.7) 1.6 (1.6, 1.6)
Osteoarthritis 31.8 9.6 3.3 (3.2, 3.5) 2.3 (2.2, 2.5)
Osteoporosis 39.4 9.7 4.1 (3.8, 4.3) 3.3 (3.1, 3.5)
Prostate cancer 42.0 10.0 4.2 (3.9, 4.5) 1.7 (1.1, 2.6)
Rheumatoid arthritis 60.0 10.0 6.0 (5.7, 6.3) 3.9 (3.7, 4.0)
Stroke 40.6 10.0 4.1 (3.8, 4.3) 2.3 (2.1, 2.4)
8.3. Test results that are outside reference ranges
Pathology testing is a tool that, along with clinical examination and a thorough patient history, assists
GPs to make diagnoses or to monitor treatment. However, there are also concerns that pathology and
other forms of testing are being overused with potential adverse consequences for patients.34
Table 8.4 shows:
the proportion of patients aged 20 years or older who have been tested at least once for the
specified pathology tests the proportion of patients who had at least one result that was outside the reference range for a
specified test as a proportion of all patients the proportion of patients who had at least one result that was outside the reference range for a
specified test as a proportion of the patients who underwent that particular pathology test.
The thresholds for determining whether results were outside reference ranges were taken from the
Royal College of Pathologists of Australasia’s Manual (https://www.rcpa.edu.au/Manuals/RCPA-
Manual) and RACGP and Diabetes Australia’s General practice management of type 2 diabetes:
2016–18.35,36 It should be noted that we included patients if they had a result outside the reference
range at least once during the year but did not attempt to collect information on follow-up tests. It is
possible that later test results may have improved in response to lifestyle changes on the part of the
patient or active management by the GP.
Using haemoglobin, creatinine and alanine aminotransferase as proxy measures (see section 8.1), the
percentage of patients aged 20 years or older who had an FBC was 42.0%, a kidney function test was
42.2% and a liver function LFT was 41.0%, respectively.
More than two-thirds of patients diagnosed with any type of diabetes had a record of having their
HbA1c level checked during 2018–19. For half of those checked, at least one result was higher than
53 mmol/mol (7.0%) suggesting that they may have benefited from clinical review. It should be noted
that we did not collect additional information about these patients, including whether they were
reviewed by the GP or whether they had follow-up tests. It should also be borne in mind that while
53 mmol/mol is the general target for people with type 2 diabetes, recommended HbA1c levels differ
according to individual patient characteristics.
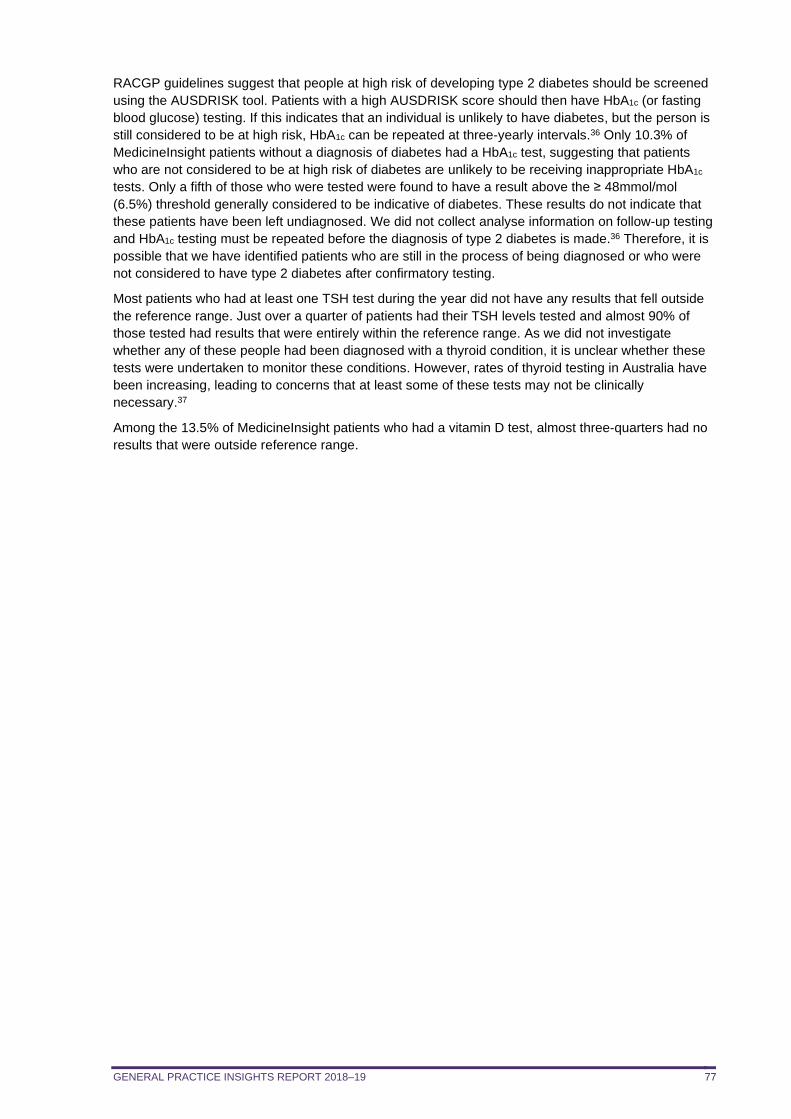
GENERAL PRACTICE INSIGHTS REPORT 2018–19 77
RACGP guidelines suggest that people at high risk of developing type 2 diabetes should be screened
using the AUSDRISK tool. Patients with a high AUSDRISK score should then have HbA1c (or fasting
blood glucose) testing. If this indicates that an individual is unlikely to have diabetes, but the person is
still considered to be at high risk, HbA1c can be repeated at three-yearly intervals.36 Only 10.3% of
MedicineInsight patients without a diagnosis of diabetes had a HbA1c test, suggesting that patients
who are not considered to be at high risk of diabetes are unlikely to be receiving inappropriate HbA1c
tests. Only a fifth of those who were tested were found to have a result above the ≥ 48mmol/mol
(6.5%) threshold generally considered to be indicative of diabetes. These results do not indicate that
these patients have been left undiagnosed. We did not collect analyse information on follow-up testing
and HbA1c testing must be repeated before the diagnosis of type 2 diabetes is made.36 Therefore, it is
possible that we have identified patients who are still in the process of being diagnosed or who were
not considered to have type 2 diabetes after confirmatory testing.
Most patients who had at least one TSH test during the year did not have any results that fell outside
the reference range. Just over a quarter of patients had their TSH levels tested and almost 90% of
those tested had results that were entirely within the reference range. As we did not investigate
whether any of these people had been diagnosed with a thyroid condition, it is unclear whether these
tests were undertaken to monitor these conditions. However, rates of thyroid testing in Australia have
been increasing, leading to concerns that at least some of these tests may not be clinically
necessary.37
Among the 13.5% of MedicineInsight patients who had a vitamin D test, almost three-quarters had no
results that were outside reference range.
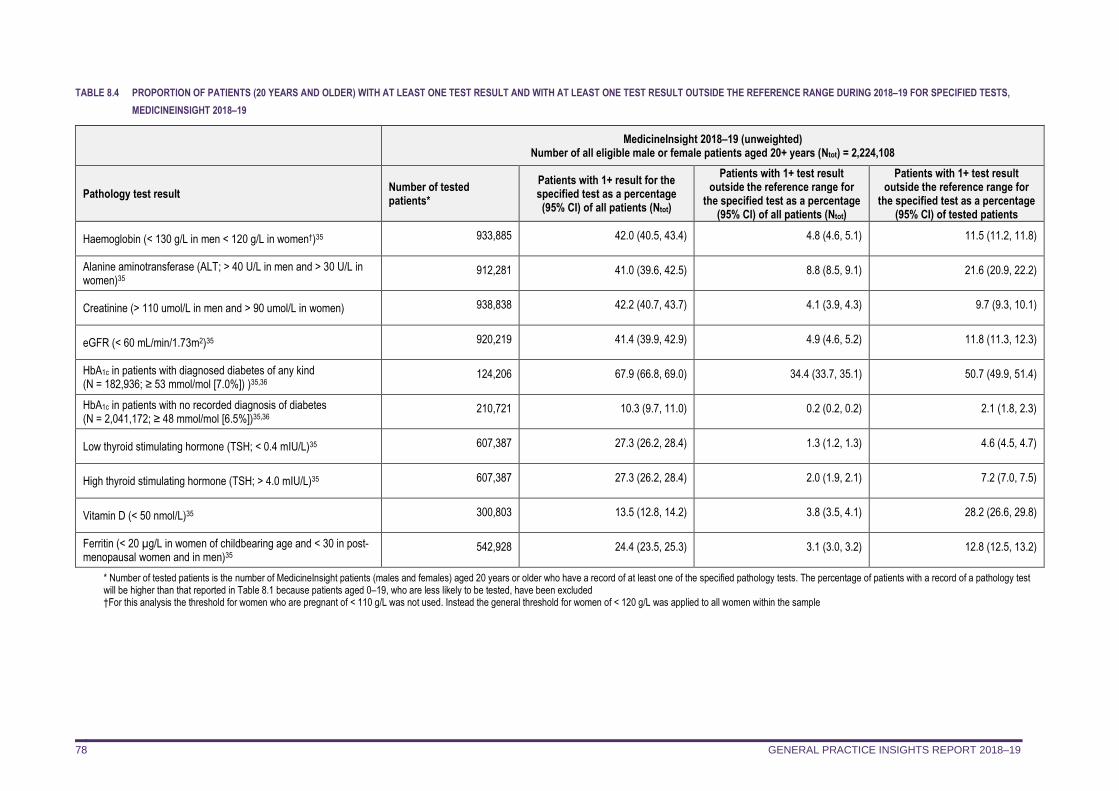
GENERAL PRACTICE INSIGHTS REPORT 2018–19 78
TABLE 8.4 PROPORTION OF PATIENTS (20 YEARS AND OLDER) WITH AT LEAST ONE TEST RESULT AND WITH AT LEAST ONE TEST RESULT OUTSIDE THE REFERENCE RANGE DURING 2018–19 FOR SPECIFIED TESTS,
MEDICINEINSIGHT 2018–19
MedicineInsight 2018–19 (unweighted)
Number of all eligible male or female patients aged 20+ years (Ntot) = 2,224,108
Pathology test result Number of tested patients*
Patients with 1+ result for the specified test as a percentage (95% CI) of all patients (Ntot)
Patients with 1+ test result outside the reference range for
the specified test as a percentage (95% CI) of all patients (Ntot)
Patients with 1+ test result outside the reference range for
the specified test as a percentage (95% CI) of tested patients
Haemoglobin (< 130 g/L in men < 120 g/L in women†)35 933,885 42.0 (40.5, 43.4) 4.8 (4.6, 5.1) 11.5 (11.2, 11.8)
Alanine aminotransferase (ALT; > 40 U/L in men and > 30 U/L in women)35
912,281 41.0 (39.6, 42.5) 8.8 (8.5, 9.1) 21.6 (20.9, 22.2)
Creatinine (> 110 umol/L in men and > 90 umol/L in women) 938,838 42.2 (40.7, 43.7) 4.1 (3.9, 4.3) 9.7 (9.3, 10.1)
eGFR (< 60 mL/min/1.73m2)35 920,219 41.4 (39.9, 42.9) 4.9 (4.6, 5.2) 11.8 (11.3, 12.3)
HbA1c in patients with diagnosed diabetes of any kind (N = 182,936; ≥ 53 mmol/mol [7.0%]) )35,36
124,206 67.9 (66.8, 69.0) 34.4 (33.7, 35.1) 50.7 (49.9, 51.4)
HbA1c in patients with no recorded diagnosis of diabetes (N = 2,041,172; ≥ 48 mmol/mol [6.5%])35,36
210,721 10.3 (9.7, 11.0) 0.2 (0.2, 0.2) 2.1 (1.8, 2.3)
Low thyroid stimulating hormone (TSH; < 0.4 mIU/L)35 607,387 27.3 (26.2, 28.4) 1.3 (1.2, 1.3) 4.6 (4.5, 4.7)
High thyroid stimulating hormone (TSH; > 4.0 mIU/L)35 607,387 27.3 (26.2, 28.4) 2.0 (1.9, 2.1) 7.2 (7.0, 7.5)
Vitamin D (< 50 nmol/L)35 300,803 13.5 (12.8, 14.2) 3.8 (3.5, 4.1) 28.2 (26.6, 29.8)
Ferritin (< 20 µg/L in women of childbearing age and < 30 in post-menopausal women and in men)35
542,928 24.4 (23.5, 25.3) 3.1 (3.0, 3.2) 12.8 (12.5, 13.2)
* Number of tested patients is the number of MedicineInsight patients (males and females) aged 20 years or older who have a record of at least one of the specified pathology tests. The percentage of patients with a record of a pathology test will be higher than that reported in Table 8.1 because patients aged 0–19, who are less likely to be tested, have been excluded †For this analysis the threshold for women who are pregnant of < 110 g/L was not used. Instead the general threshold for women of < 120 g/L was applied to all women within the sample
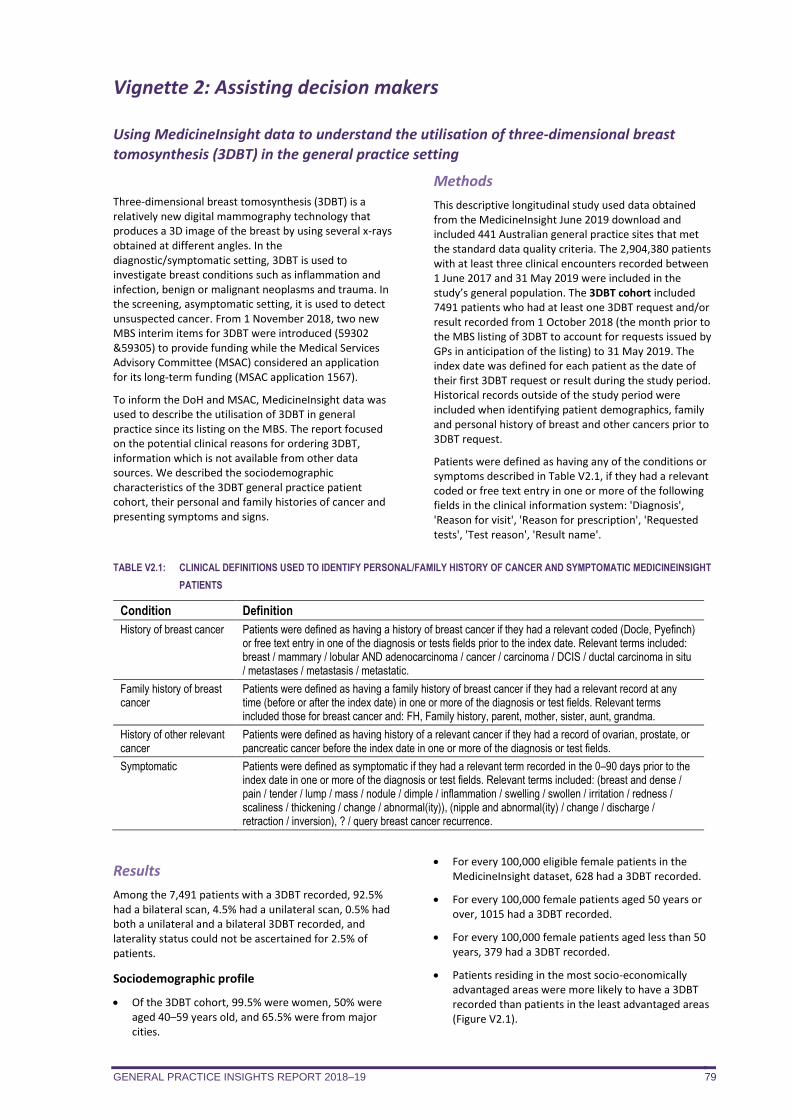
GENERAL PRACTICE INSIGHTS REPORT 2018–19 79
Vignette 2: Assisting decision makers
Using MedicineInsight data to understand the utilisation of three-dimensional breast tomosynthesis (3DBT) in the general practice setting
Three-dimensional breast tomosynthesis (3DBT) is a relatively new digital mammography technology that produces a 3D image of the breast by using several x-rays obtained at different angles. In the diagnostic/symptomatic setting, 3DBT is used to investigate breast conditions such as inflammation and infection, benign or malignant neoplasms and trauma. In the screening, asymptomatic setting, it is used to detect unsuspected cancer. From 1 November 2018, two new MBS interim items for 3DBT were introduced (59302 &59305) to provide funding while the Medical Services Advisory Committee (MSAC) considered an application for its long-term funding (MSAC application 1567).
To inform the DoH and MSAC, MedicineInsight data was used to describe the utilisation of 3DBT in general practice since its listing on the MBS. The report focused on the potential clinical reasons for ordering 3DBT, information which is not available from other data sources. We described the sociodemographic characteristics of the 3DBT general practice patient cohort, their personal and family histories of cancer and presenting symptoms and signs.
Methods
This descriptive longitudinal study used data obtained from the MedicineInsight June 2019 download and included 441 Australian general practice sites that met the standard data quality criteria. The 2,904,380 patients with at least three clinical encounters recorded between 1 June 2017 and 31 May 2019 were included in the study’s general population. The 3DBT cohort included 7491 patients who had at least one 3DBT request and/or result recorded from 1 October 2018 (the month prior to the MBS listing of 3DBT to account for requests issued by GPs in anticipation of the listing) to 31 May 2019. The index date was defined for each patient as the date of their first 3DBT request or result during the study period. Historical records outside of the study period were included when identifying patient demographics, family and personal history of breast and other cancers prior to 3DBT request.
Patients were defined as having any of the conditions or symptoms described in Table V2.1, if they had a relevant coded or free text entry in one or more of the following fields in the clinical information system: 'Diagnosis', 'Reason for visit', 'Reason for prescription', 'Requested tests', 'Test reason', 'Result name'.
TABLE V2.1: CLINICAL DEFINITIONS USED TO IDENTIFY PERSONAL/FAMILY HISTORY OF CANCER AND SYMPTOMATIC MEDICINEINSIGHT
PATIENTS
Condition Definition
History of breast cancer Patients were defined as having a history of breast cancer if they had a relevant coded (Docle, Pyefinch) or free text entry in one of the diagnosis or tests fields prior to the index date. Relevant terms included: breast / mammary / lobular AND adenocarcinoma / cancer / carcinoma / DCIS / ductal carcinoma in situ / metastases / metastasis / metastatic.
Family history of breast cancer
Patients were defined as having a family history of breast cancer if they had a relevant record at any time (before or after the index date) in one or more of the diagnosis or test fields. Relevant terms included those for breast cancer and: FH, Family history, parent, mother, sister, aunt, grandma.
History of other relevant cancer
Patients were defined as having history of a relevant cancer if they had a record of ovarian, prostate, or pancreatic cancer before the index date in one or more of the diagnosis or test fields.
Symptomatic Patients were defined as symptomatic if they had a relevant term recorded in the 0–90 days prior to the index date in one or more of the diagnosis or test fields. Relevant terms included: (breast and dense / pain / tender / lump / mass / nodule / dimple / inflammation / swelling / swollen / irritation / redness / scaliness / thickening / change / abnormal(ity)), (nipple and abnormal(ity) / change / discharge / retraction / inversion), ? / query breast cancer recurrence.
Results
Among the 7,491 patients with a 3DBT recorded, 92.5% had a bilateral scan, 4.5% had a unilateral scan, 0.5% had both a unilateral and a bilateral 3DBT recorded, and laterality status could not be ascertained for 2.5% of patients.
Sociodemographic profile
• Of the 3DBT cohort, 99.5% were women, 50% were aged 40–59 years old, and 65.5% were from major cities.
• For every 100,000 eligible female patients in the MedicineInsight dataset, 628 had a 3DBT recorded.
• For every 100,000 female patients aged 50 years or over, 1015 had a 3DBT recorded.
• For every 100,000 female patients aged less than 50 years, 379 had a 3DBT recorded.
• Patients residing in the most socio-economically advantaged areas were more likely to have a 3DBT recorded than patients in the least advantaged areas (Figure V2.1).
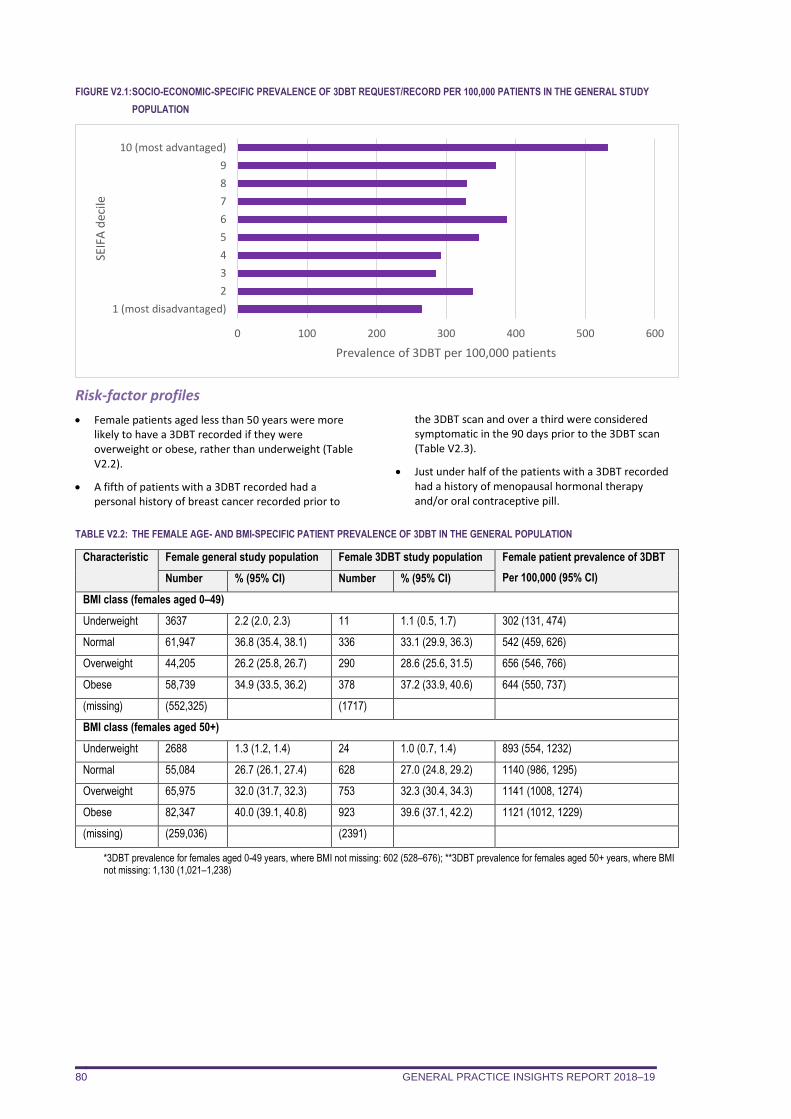
GENERAL PRACTICE INSIGHTS REPORT 2018–19 80
FIGURE V2.1: SOCIO-ECONOMIC-SPECIFIC PREVALENCE OF 3DBT REQUEST/RECORD PER 100,000 PATIENTS IN THE GENERAL STUDY
POPULATION
Risk-factor profiles
• Female patients aged less than 50 years were more likely to have a 3DBT recorded if they were overweight or obese, rather than underweight (Table V2.2).
• A fifth of patients with a 3DBT recorded had a personal history of breast cancer recorded prior to
the 3DBT scan and over a third were considered symptomatic in the 90 days prior to the 3DBT scan (Table V2.3).
• Just under half of the patients with a 3DBT recorded had a history of menopausal hormonal therapy and/or oral contraceptive pill.
TABLE V2.2: THE FEMALE AGE- AND BMI-SPECIFIC PATIENT PREVALENCE OF 3DBT IN THE GENERAL POPULATION
Characteristic Female general study population Female 3DBT study population Female patient prevalence of 3DBT
Per 100,000 (95% CI) Number % (95% CI) Number % (95% CI)
BMI class (females aged 0–49)
Underweight 3637 2.2 (2.0, 2.3) 11 1.1 (0.5, 1.7) 302 (131, 474)
Normal 61,947 36.8 (35.4, 38.1) 336 33.1 (29.9, 36.3) 542 (459, 626)
Overweight 44,205 26.2 (25.8, 26.7) 290 28.6 (25.6, 31.5) 656 (546, 766)
Obese 58,739 34.9 (33.5, 36.2) 378 37.2 (33.9, 40.6) 644 (550, 737)
(missing) (552,325) (1717)
BMI class (females aged 50+)
Underweight 2688 1.3 (1.2, 1.4) 24 1.0 (0.7, 1.4) 893 (554, 1232)
Normal 55,084 26.7 (26.1, 27.4) 628 27.0 (24.8, 29.2) 1140 (986, 1295)
Overweight 65,975 32.0 (31.7, 32.3) 753 32.3 (30.4, 34.3) 1141 (1008, 1274)
Obese 82,347 40.0 (39.1, 40.8) 923 39.6 (37.1, 42.2) 1121 (1012, 1229)
(missing) (259,036) (2391)
*3DBT prevalence for females aged 0-49 years, where BMI not missing: 602 (528–676); **3DBT prevalence for females aged 50+ years, where BMI not missing: 1,130 (1,021–1,238)
0 100 200 300 400 500 600
1 (most disadvantaged)
2
3
4
5
6
7
8
9
10 (most advantaged)
Prevalence of 3DBT per 100,000 patients
SEIF
A d
ecile
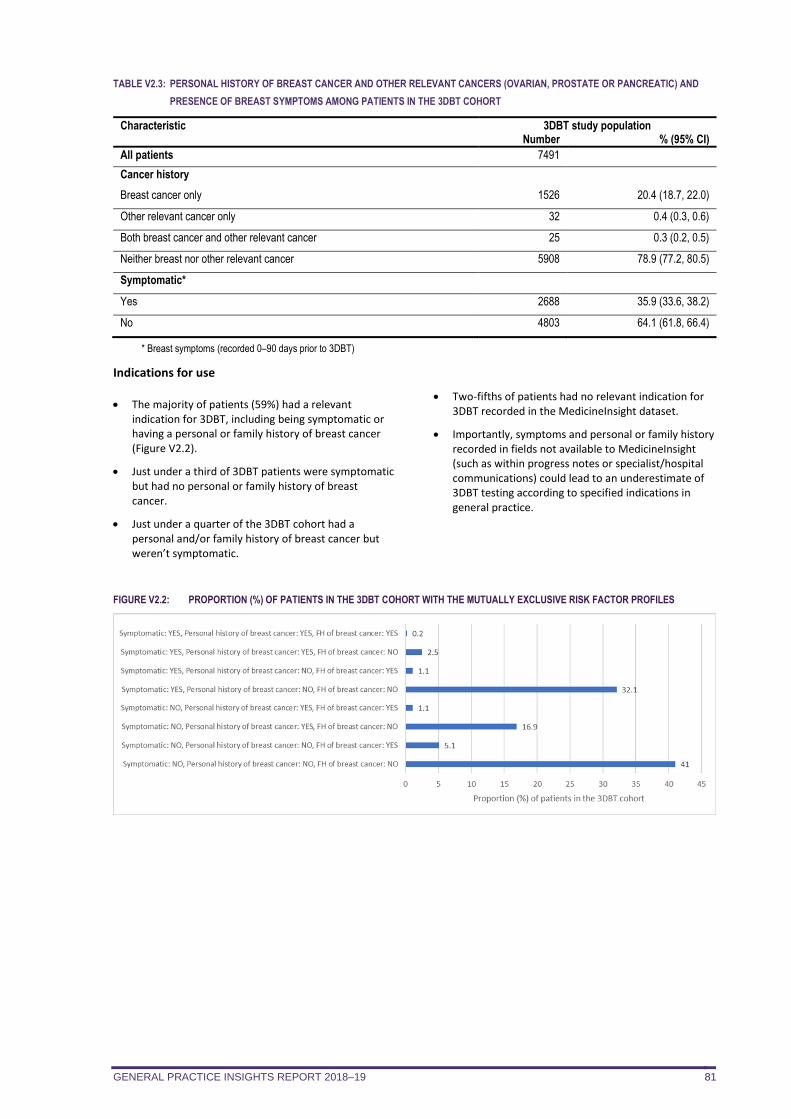
GENERAL PRACTICE INSIGHTS REPORT 2018–19 81
TABLE V2.3: PERSONAL HISTORY OF BREAST CANCER AND OTHER RELEVANT CANCERS (OVARIAN, PROSTATE OR PANCREATIC) AND
PRESENCE OF BREAST SYMPTOMS AMONG PATIENTS IN THE 3DBT COHORT
Characteristic 3DBT study population Number % (95% CI)
All patients 7491
Cancer history
Breast cancer only 1526 20.4 (18.7, 22.0)
Other relevant cancer only 32 0.4 (0.3, 0.6)
Both breast cancer and other relevant cancer 25 0.3 (0.2, 0.5)
Neither breast nor other relevant cancer 5908 78.9 (77.2, 80.5)
Symptomatic*
Yes 2688 35.9 (33.6, 38.2)
No 4803 64.1 (61.8, 66.4)
* Breast symptoms (recorded 0–90 days prior to 3DBT)
Indications for use
• The majority of patients (59%) had a relevant indication for 3DBT, including being symptomatic or having a personal or family history of breast cancer (Figure V2.2).
• Just under a third of 3DBT patients were symptomatic but had no personal or family history of breast cancer.
• Just under a quarter of the 3DBT cohort had a personal and/or family history of breast cancer but weren’t symptomatic.
• Two-fifths of patients had no relevant indication for 3DBT recorded in the MedicineInsight dataset.
• Importantly, symptoms and personal or family history recorded in fields not available to MedicineInsight (such as within progress notes or specialist/hospital communications) could lead to an underestimate of 3DBT testing according to specified indications in general practice.
FIGURE V2.2: PROPORTION (%) OF PATIENTS IN THE 3DBT COHORT WITH THE MUTUALLY EXCLUSIVE RISK FACTOR PROFILES
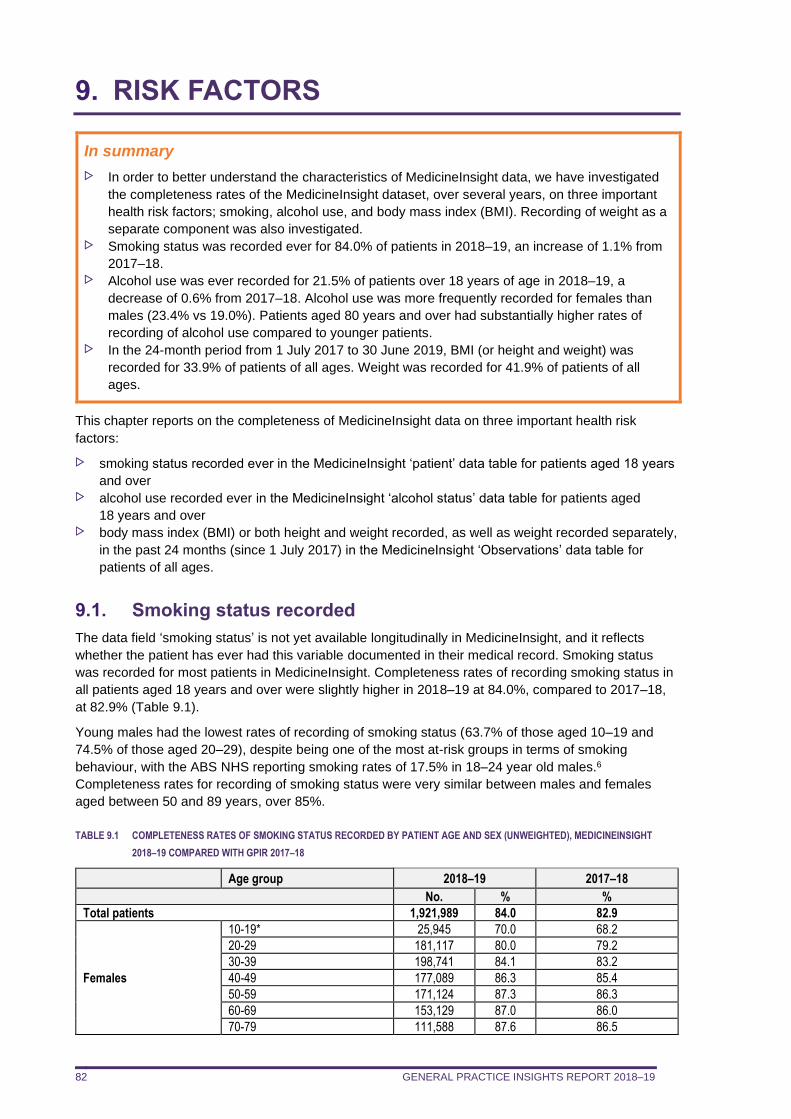
GENERAL PRACTICE INSIGHTS REPORT 2018–19 82
9. RISK FACTORS
In summary
In order to better understand the characteristics of MedicineInsight data, we have investigated
the completeness rates of the MedicineInsight dataset, over several years, on three important
health risk factors; smoking, alcohol use, and body mass index (BMI). Recording of weight as a
separate component was also investigated. Smoking status was recorded ever for 84.0% of patients in 2018–19, an increase of 1.1% from
2017–18. Alcohol use was ever recorded for 21.5% of patients over 18 years of age in 2018–19, a
decrease of 0.6% from 2017–18. Alcohol use was more frequently recorded for females than
males (23.4% vs 19.0%). Patients aged 80 years and over had substantially higher rates of
recording of alcohol use compared to younger patients. In the 24-month period from 1 July 2017 to 30 June 2019, BMI (or height and weight) was
recorded for 33.9% of patients of all ages. Weight was recorded for 41.9% of patients of all
ages.
This chapter reports on the completeness of MedicineInsight data on three important health risk
factors:
smoking status recorded ever in the MedicineInsight ‘patient’ data table for patients aged 18 years
and over alcohol use recorded ever in the MedicineInsight ‘alcohol status’ data table for patients aged
18 years and over body mass index (BMI) or both height and weight recorded, as well as weight recorded separately,
in the past 24 months (since 1 July 2017) in the MedicineInsight ‘Observations’ data table for
patients of all ages.
9.1. Smoking status recorded
The data field ‘smoking status’ is not yet available longitudinally in MedicineInsight, and it reflects
whether the patient has ever had this variable documented in their medical record. Smoking status
was recorded for most patients in MedicineInsight. Completeness rates of recording smoking status in
all patients aged 18 years and over were slightly higher in 2018–19 at 84.0%, compared to 2017–18,
at 82.9% (Table 9.1).
Young males had the lowest rates of recording of smoking status (63.7% of those aged 10–19 and
74.5% of those aged 20–29), despite being one of the most at-risk groups in terms of smoking
behaviour, with the ABS NHS reporting smoking rates of 17.5% in 18–24 year old males.6
Completeness rates for recording of smoking status were very similar between males and females
aged between 50 and 89 years, over 85%.
TABLE 9.1 COMPLETENESS RATES OF SMOKING STATUS RECORDED BY PATIENT AGE AND SEX (UNWEIGHTED), MEDICINEINSIGHT
2018–19 COMPARED WITH GPIR 2017–18
Age group 2018–19 2017–18
No. % %
Total patients 1,921,989 84.0 82.9
Females
10-19* 25,945 70.0 68.2
20-29 181,117 80.0 79.2
30-39 198,741 84.1 83.2
40-49 177,089 86.3 85.4
50-59 171,124 87.3 86.3
60-69 153,129 87.0 86.0
70-79 111,588 87.6 86.5
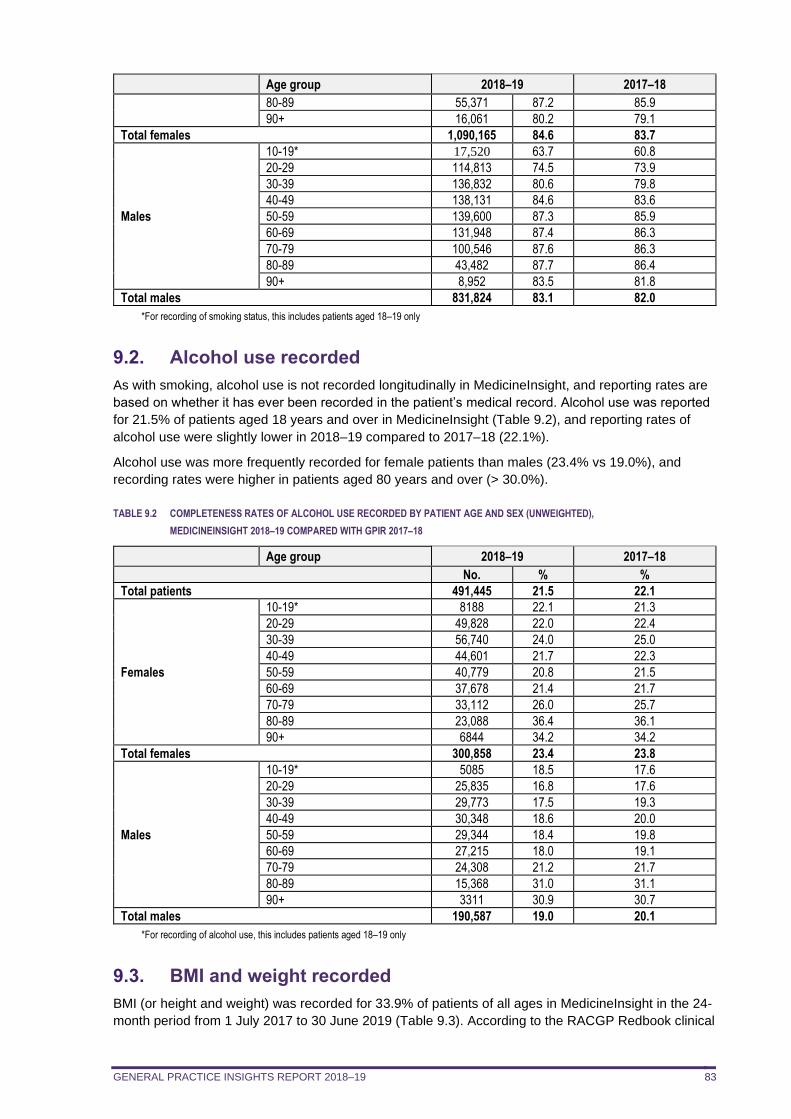
GENERAL PRACTICE INSIGHTS REPORT 2018–19 83
Age group 2018–19 2017–18
80-89 55,371 87.2 85.9
90+ 16,061 80.2 79.1
Total females 1,090,165 84.6 83.7
Males
10-19* 17,520 63.7 60.8
20-29 114,813 74.5 73.9
30-39 136,832 80.6 79.8
40-49 138,131 84.6 83.6
50-59 139,600 87.3 85.9
60-69 131,948 87.4 86.3
70-79 100,546 87.6 86.3
80-89 43,482 87.7 86.4
90+ 8,952 83.5 81.8
Total males 831,824 83.1 82.0
*For recording of smoking status, this includes patients aged 18–19 only
9.2. Alcohol use recorded
As with smoking, alcohol use is not recorded longitudinally in MedicineInsight, and reporting rates are
based on whether it has ever been recorded in the patient’s medical record. Alcohol use was reported
for 21.5% of patients aged 18 years and over in MedicineInsight (Table 9.2), and reporting rates of
alcohol use were slightly lower in 2018–19 compared to 2017–18 (22.1%).
Alcohol use was more frequently recorded for female patients than males (23.4% vs 19.0%), and
recording rates were higher in patients aged 80 years and over (> 30.0%).
TABLE 9.2 COMPLETENESS RATES OF ALCOHOL USE RECORDED BY PATIENT AGE AND SEX (UNWEIGHTED),
MEDICINEINSIGHT 2018–19 COMPARED WITH GPIR 2017–18
Age group 2018–19 2017–18
No. % %
Total patients 491,445 21.5 22.1
Females
10-19* 8188 22.1 21.3
20-29 49,828 22.0 22.4
30-39 56,740 24.0 25.0
40-49 44,601 21.7 22.3
50-59 40,779 20.8 21.5
60-69 37,678 21.4 21.7
70-79 33,112 26.0 25.7
80-89 23,088 36.4 36.1
90+ 6844 34.2 34.2
Total females 300,858 23.4 23.8
Males
10-19* 5085 18.5 17.6
20-29 25,835 16.8 17.6
30-39 29,773 17.5 19.3
40-49 30,348 18.6 20.0
50-59 29,344 18.4 19.8
60-69 27,215 18.0 19.1
70-79 24,308 21.2 21.7
80-89 15,368 31.0 31.1
90+ 3311 30.9 30.7
Total males 190,587 19.0 20.1
*For recording of alcohol use, this includes patients aged 18–19 only
9.3. BMI and weight recorded
BMI (or height and weight) was recorded for 33.9% of patients of all ages in MedicineInsight in the 24-
month period from 1 July 2017 to 30 June 2019 (Table 9.3). According to the RACGP Redbook clinical
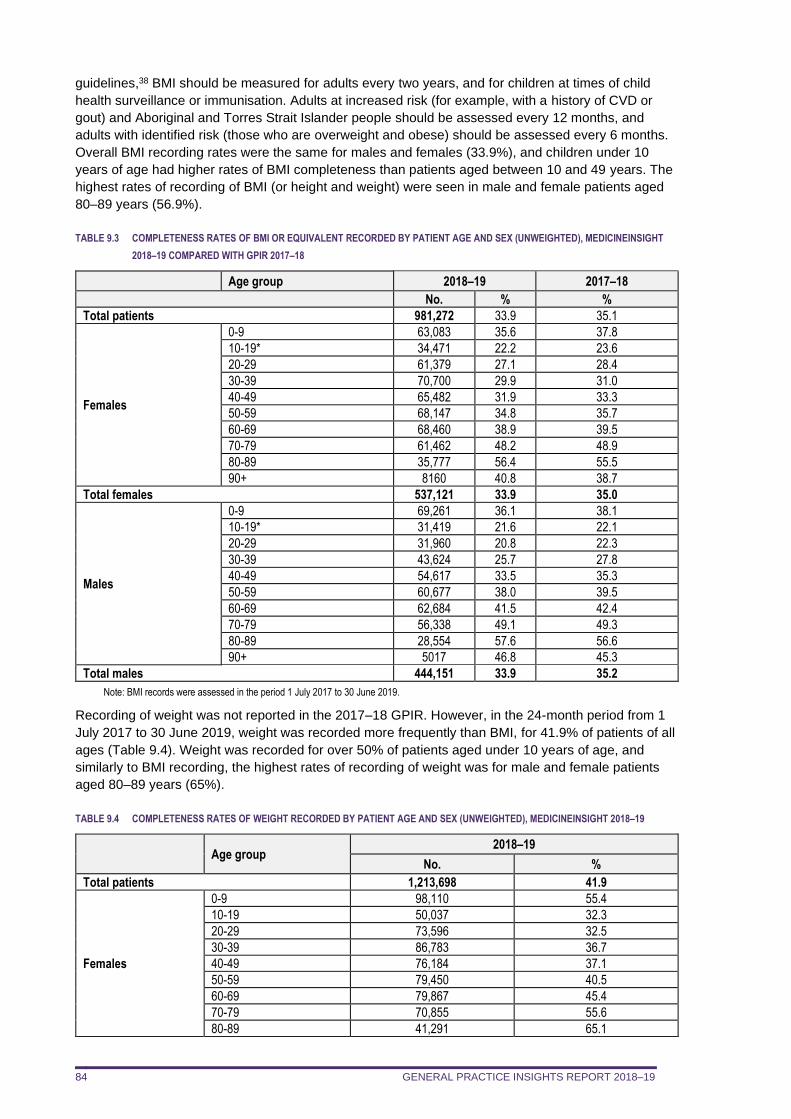
GENERAL PRACTICE INSIGHTS REPORT 2018–19 84
guidelines,38 BMI should be measured for adults every two years, and for children at times of child
health surveillance or immunisation. Adults at increased risk (for example, with a history of CVD or
gout) and Aboriginal and Torres Strait Islander people should be assessed every 12 months, and
adults with identified risk (those who are overweight and obese) should be assessed every 6 months.
Overall BMI recording rates were the same for males and females (33.9%), and children under 10
years of age had higher rates of BMI completeness than patients aged between 10 and 49 years. The
highest rates of recording of BMI (or height and weight) were seen in male and female patients aged
80–89 years (56.9%).
TABLE 9.3 COMPLETENESS RATES OF BMI OR EQUIVALENT RECORDED BY PATIENT AGE AND SEX (UNWEIGHTED), MEDICINEINSIGHT
2018–19 COMPARED WITH GPIR 2017–18
Age group 2018–19 2017–18
No. % %
Total patients 981,272 33.9 35.1
Females
0-9 63,083 35.6 37.8
10-19* 34,471 22.2 23.6
20-29 61,379 27.1 28.4
30-39 70,700 29.9 31.0
40-49 65,482 31.9 33.3
50-59 68,147 34.8 35.7
60-69 68,460 38.9 39.5
70-79 61,462 48.2 48.9
80-89 35,777 56.4 55.5
90+ 8160 40.8 38.7
Total females 537,121 33.9 35.0
Males
0-9 69,261 36.1 38.1
10-19* 31,419 21.6 22.1
20-29 31,960 20.8 22.3
30-39 43,624 25.7 27.8
40-49 54,617 33.5 35.3
50-59 60,677 38.0 39.5
60-69 62,684 41.5 42.4
70-79 56,338 49.1 49.3
80-89 28,554 57.6 56.6
90+ 5017 46.8 45.3
Total males 444,151 33.9 35.2
Note: BMI records were assessed in the period 1 July 2017 to 30 June 2019.
Recording of weight was not reported in the 2017–18 GPIR. However, in the 24-month period from 1
July 2017 to 30 June 2019, weight was recorded more frequently than BMI, for 41.9% of patients of all
ages (Table 9.4). Weight was recorded for over 50% of patients aged under 10 years of age, and
similarly to BMI recording, the highest rates of recording of weight was for male and female patients
aged 80–89 years (65%).
TABLE 9.4 COMPLETENESS RATES OF WEIGHT RECORDED BY PATIENT AGE AND SEX (UNWEIGHTED), MEDICINEINSIGHT 2018–19
Age group 2018–19
No. %
Total patients 1,213,698 41.9
Females
0-9 98,110 55.4
10-19 50,037 32.3
20-29 73,596 32.5
30-39 86,783 36.7
40-49 76,184 37.1
50-59 79,450 40.5
60-69 79,867 45.4
70-79 70,855 55.6
80-89 41,291 65.1
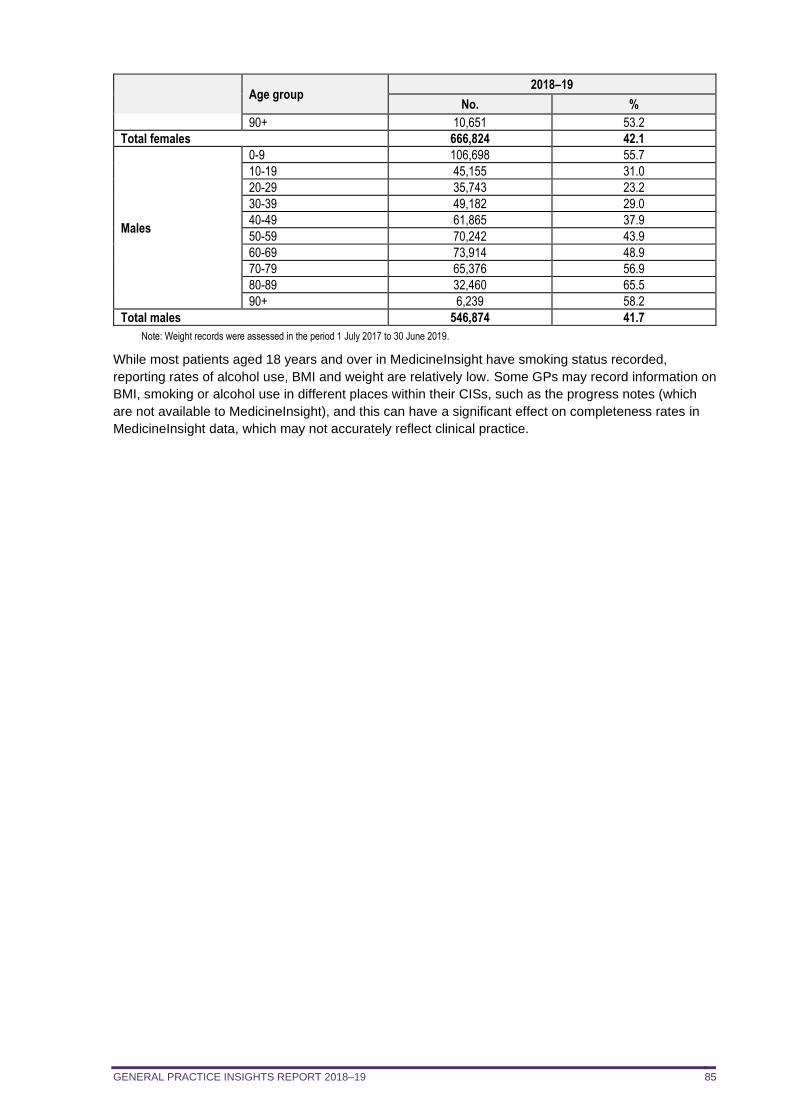
GENERAL PRACTICE INSIGHTS REPORT 2018–19 85
Age group 2018–19
No. %
90+ 10,651 53.2
Total females 666,824 42.1
Males
0-9 106,698 55.7
10-19 45,155 31.0
20-29 35,743 23.2
30-39 49,182 29.0
40-49 61,865 37.9
50-59 70,242 43.9
60-69 73,914 48.9
70-79 65,376 56.9
80-89 32,460 65.5
90+ 6,239 58.2
Total males 546,874 41.7
Note: Weight records were assessed in the period 1 July 2017 to 30 June 2019.
While most patients aged 18 years and over in MedicineInsight have smoking status recorded,
reporting rates of alcohol use, BMI and weight are relatively low. Some GPs may record information on
BMI, smoking or alcohol use in different places within their CISs, such as the progress notes (which
are not available to MedicineInsight), and this can have a significant effect on completeness rates in
MedicineInsight data, which may not accurately reflect clinical practice.
GENERAL PRACTICE INSIGHTS REPORT 2018–19 86
Vignette 3: Evaluating programs
Evaluating the ‘Chronic pain: opioids and beyond’ program
In 2015 NPS MedicineWise launched the national ‘Chronic pain: opioids and beyond’ visiting program in response to increased prescriptions of opioids between 2010 and 2015 despite limited evidence of benefit for chronic non-cancer pain and the resulting potential for misuse and harm.11,39 The overarching goal of the program was to improve well-being among patients with chronic non-cancer pain managed in general practice. This vignette describes the evaluation findings for part of this program.
Methods
Times series analysis was undertaken using data extracted from MedicineInsight practices before and after the launch of the program (June 2010 to May 2018). This involved using MedicineInsight data to compare the prescribing habits of GPs who participated in the MedicineInsight program, and who had also actively participated in the visiting program, with the prescribing habits of GPs who did not actively participate in the visiting program, and thus served as controls.k
Active participation was defined as the GP participating in at least one of the program activities: clinical audit, educational visit, interactive case study or case-based small group meeting. The evaluation explored the impact of the active elements of the program on prescribing of opioid medicines for chronic non-cancer pain and encounters with chronic non-cancer pain patients.
Both groups of GPs received personalised letters comparing their PBS prescribing patterns to those of their peers, an NPS MedicineWise newsletter on appropriate use of opioids and information on how to access consumer health resources developed for the program. However, only the GPs in the intervention group received one of the active interventions.
Comparisons between the control and intervention GPs were adjusted for the location of their practice, average patient numbers and average encounter numbers.
Results
There were 1,899 GPs in the intervention group and 586 GPs in the control group. The intervention GP group had a pool of 103,797 eligible patients and the control GP group had 13,516 eligible patients. The profiles of each GP group were consistent over the two periods, but the GP control group were more likely to practice in NSW or work in practices in major cities compared with the GP intervention group in both periods.
On average, the intervention GPs saw more patients with chronic non-cancer pain (76.6 pre-intervention and 74.6 post-intervention) than the control GPs (48.0 pre-intervention and 44.9 post-intervention).
The average monthly growth in volume of opioid prescriptions for patients with chronic non-cancer pain decreased between the pre-intervention period and the post-intervention period from 2.76% to 0.02% in the GP intervention group and from 1.78% to 0.71% in the GP control group. The actual volume of prescriptions after the active interventions was then compared with the expected volume of prescriptions in the absence of the active interventions. This suggested that the monthly volume of opioid prescriptions from the intervention GPs had been reduced by 7.5% (95% CI 2.8% to 12.0%) when compared to the control GPs.
Active participation in the visiting program was also associated with a 6.3% relative reduction (95% CI 3.0% to 9.5%) in encounters with patients with chronic non-cancer pain. Whether this reduction was because patients were referred to other health professionals or pain clinics for more appropriate management or because patients previously prescribed opioids switched to other practices is unclear.
.
k MedicineInsight GPs who worked in general practices where at least one GP had actively participated in the visiting program were not eligible to be a control GP
GENERAL PRACTICE INSIGHTS REPORT 2018–19 87
10. INTERPRETATION OF THE DATA
MedicineInsight provides an important source of national longitudinal general practice data. This report
provides information on activities that occur in general practices, including details of encounters, the
conditions patients present with and how they are managed.
MedicineInsight contains a huge volume of data, which provides countless opportunities to analyse
activities that occur within general practice, as well as to measure the health outcomes and quality of
general practice care. While some data may be incomplete, and a proportion of encounters may be
missing when patients attend other general practices, analysis of the MedicineInsight dataset offers
many important findings. It is possible to continue to draw significant inferences about the treatment,
risk factors and potential outcomes for different patient cohorts.
There are recognised limitations to MedicineInsight data, as they are real-world data entered by
clinicians into CISs for the purposes of providing patient care. When interpreting the information
presented in this report, the following limitations or caveats related to the MedicineInsight data should
be noted.
Information in the CIS is collected to provide clinical care to a patient, not for research purposes.
All analyses are therefore dependent upon on the accuracy and completeness of data recorded in,
and available for extraction from, the general practice CISs. Once chronic conditions are recorded in the medical record, and the patient is known to the GP,
the GP may not routinely record the reason for prescribing, or the reason for visit, at each visit. Conditions may be underreported in MedicineInsight data, depending on recording practices. A
validation study is currently underway to estimate the accuracy of condition definitions in
MedicineInsight. Calculation of the relative proportions of different conditions assumes that non-recording of
conditions occurs at random. Selection criteria were applied in order to maximise the likelihood that included GP encounters
were for clinical reasons, however, there may be remaining misclassification of clinical versus
administrative encounters, as these are sometimes difficult to distinguish in CISs. A validation
study is currently underway to help improve the clinical encounter definition in MedicineInsight. Although patients can have more than one encounter in a day, due to the nature of the information
available in CISs, only one clinical GP encounter per day per patient has been counted. The rates of conditions and prescriptions per 100 encounters were calculated with the caveat that
conditions and prescriptions are not linked directly to GP clinical encounters in MedicineInsight but
to patients. Therefore, our findings reflect all activity conducted by GPs when managing their
patients, not just the activity on the days when a clinical encounter occurred. MedicineInsight prescriptions relate to records of GP prescribing, and therefore differ in several
important ways from national PBS dispensing data. Not all prescriptions and repeats will be
dispensed, so prescription counts are an overestimate of dispensed prescription counts. There
may be a delay of up to 12 months between prescribing and dispensing. Specialist and hospital
prescriptions are not included. Practices were recruited to MedicineInsight using non-random sampling, and systematic sampling
differences between regions cannot be ruled out. Behaviour of MedicineInsight practices may not
be reflective of non-MedicineInsight practices. Comparisons between regions should be
interpreted with caution, although we have weighted the data to improve national
representativeness. While the 2018–19 population of patients with at least one MBS-billed GP visit was used as the
reference population for weighting, the MedicineInsight cohort may include patients not covered
under the MBS (eg, foreign citizens, workers compensation patients). For confidentiality reasons we do not have access to progress notes, which may contain further
information on reasons for prescriptions, reasons for encounters and diagnoses. Patients are free to visit multiple other practices. We do not have data on patients from non-
MedicineInsight clinics. Currently we cannot identify patients who have attended multiple
MedicineInsight practices.
GENERAL PRACTICE INSIGHTS REPORT 2018–19 88
REFERENCES
1. NPS MedicineWise. General Practice Insights Report July 2016–June 2017. Sydney: NPS MedicineWise, 2018. https://www.nps.org.au/medicine-insight (accessed 25 February 2020).
2. NPS MedicineWise. General Practice Insights Report July 2017–June 2018. Sydney: NPS MedicineWise, 2019. https://www.nps.org.au/medicine-insight (accessed 25 February 2020).
3. Australian Institute of Health and Welfare. Aboriginal and Torres Strait Islander Health Performance Framework (HPF) report 2017. Canberra: AIHW, 2017. https://www.aihw.gov.au/reports/indigenous-health-welfare/health-performance-framework/contents/summary (accessed 3 March 2020).
4. Department of Social Services. DSS Payment Demographic Data June 2019. Canberra: Australian Government, 2019. https://data.gov.au/data/dataset/dss-payment-demographic-data (accessed 5 March 2020).
5. Department of Veterans' Affairs. DVA Pensioner Summary - June 2019. Canberra: Australian Government, 2019. https://www.dva.gov.au/sites/default/files/files/publications/datastatistical/pensionsummary/pensumm_jun2019.pdf (accessed 5 March 2020).
6. Australian Bureau of Statistics. National Health Survey: First Results, 2017-18 (Catalogue No. 4364.0.55.001). Canberra: ABS, 2018. http://www.abs.gov.au/ausstats/[email protected]/mf/4364.0.55.001 (accessed 22 February 2019).
7. Royal Australian College of General Practitioners. General Practice: Health of the Nation 2019. East Melbourne: RACGP, 2019. https://www.racgp.org.au/general-practice-health-of-the-nation (accessed 24 February 2020).
8. Kidney Health Australia. Chronic kidney disease (CKD) management in general practice: Guidance and clinical tips to help identify, manage and refer patients with CKD in your practice. Melbourne: Kidney Health Australia, 2015. https://kidney.org.au/health-professionals/prevent/chronic-kidney-disease-management-handbook (accessed 29 March 2020).
9. Taylor CJ, Harrison C, Britt H, et al. Heart failure and multimorbidity in Australian general practice. J Comorb 2017;7:44-9. https://www.ncbi.nlm.nih.gov/pubmed/29090188
10. Australian Institute of Health and Welfare. Australia's health 2016. Canberra: AIHW, 2016. https://www.aihw.gov.au/reports/australias-health/australias-health-2016/contents/chapter-3-leading-causes-of-ill-health (accessed 27 February 2020).
11. Australian Institute of Health and Welfare. Australia's health 2018. Canberra: AIHW, 2018. https://www.aihw.gov.au/reports/australias-health/australias-health-2018/contents/table-of-contents (accessed 27 February 2020).
12. COAG Health Council. The fifth national mental health and suicide prevention plan. Canberra: Australian Government, 2017. http://www.coaghealthcouncil.gov.au/Portals/0/Fifth%20National%20Mental%20Health%20and%20Suicide%20Prevention%20Plan.pdf (accessed 12 September 2019).
13. Morgan V, Waterreus A, Jablensky A, et al. People living with psychotic illness 2010: Report on the second Australian national survey. Canberra: Department of Health, 2011. http://www.health.gov.au/internet/main/publishing.nsf/Content/mental-pubs-p-psych10 (accessed 7 June 2019).
14. Australian Bureau of Statistics. 4430.0 - Disability, Ageing and Carers, Australia: Summary of Findings, 2018. Canberra: ABS, 2019. https://www.abs.gov.au/AUSSTATS/[email protected]/DetailsPage/4430.02018?OpenDocument (accessed 20 April 2020).
15. Department of Health. 2018–19 Report on the Operation of the Aged Care Act 1997. Canberra: Department of Health, 2019. (accessed 21 February 2020).
16. Royal Australian and New Zealand College of Psychiatrists. Keeping body and mind together: improving the physical health and life expectancy of people with serious mental illness. Melbourne: RANZCP, 2015. https://www.ranzcp.org/files/resources/reports/keeping-body-and-mind-together.aspx (accessed 7 June 2019).
17. National Vascular Disease Prevention Alliance. Guidelines for the management of absolute cardiovascular disease risk. Melbourne: National Stroke Foundation, 2012.
GENERAL PRACTICE INSIGHTS REPORT 2018–19 89
https://www.heartfoundation.org.au/images/uploads/publications/Absolute-CVD-Risk-Full-Guidelines.pdf (accessed 27 November 2019).
18. Galletly CA, Foley DL, Waterreus A, et al. Cardiometabolic risk factors in people with psychotic disorders: the second Australian national survey of psychosis. Aust N Z J Psychiatry 2012;46:753-61. https://www.ncbi.nlm.nih.gov/pubmed/22761397
19. Australian Bureau of Statistics. 4329.0.00.004 - Mental Health and co-existing physical health conditions, Australia, 2014-15. Canberra: ABS, 2015. https://www.abs.gov.au/AUSSTATS/[email protected]/Lookup/4329.0.00.004Main+Features12014%20-%2015?OpenDocument (accessed 20 April 2020).
20. Andrews G, Henderson S, Hall W. Prevalence, comorbidity, disability and service utilisation. Overview of the Australian National Mental Health Survey. Br J Psychiatry 2001;178:145-53. https://www.ncbi.nlm.nih.gov/pubmed/11157427
21. Tran J, Danchin M, Steer AC, et al. Management of sore throat in primary care. Aust J Gen Pract 2018;47:485-9. https://www.ncbi.nlm.nih.gov/pubmed/30114874
22. Kong K, Coates HL. Natural history, definitions, risk factors and burden of otitis media. Med J Aust 2009;191:S39-43. https://www.ncbi.nlm.nih.gov/pubmed/19883355
23. National Asthma Council Australia. Australian Asthma Handbook, Version 2.0: Managing asthma in children. Melbourne: National Asthma Council Australia, 2019. https://www.asthmahandbook.org.au/management/children (accessed 8 May 2020).
24. Australasian Society of Clinical Immunology and Allergy. Eczema (Atopic Dermatitis). Sydney: ASCIA, 2019. https://www.allergy.org.au/patients/skin-allergy/eczema (accessed 12 March 2020).
25. Bayram C, Harrison C, Charles J, et al. 'The kids are alright' - Changes in GP consultations with children 2000-15. Aust Fam Physician 2015;44:877-9. https://www.ncbi.nlm.nih.gov/pubmed/27054203
26. Australian Institute of Health and Welfare. Asthma. Canberra: AIHW, 2018. https://www.aihw.gov.au/reports/chronic-respiratory-conditions/asthma (accessed 8 May 2020).
27. Stanford RH, Shah MB, D'Souza AO, et al. Short-acting beta-agonist use and its ability to predict future asthma-related outcomes. Ann Allergy Asthma Immunol 2012;109:403-7. https://www.ncbi.nlm.nih.gov/pubmed/23176877
28. Australian Bureau of Statistics. Australian Demographic Statistics, Jun 2019. Canberra: ABS, 2019. https://www.abs.gov.au/AUSSTATS/[email protected]/Lookup/3101.0Main+Features1Jun%202019?OpenDocument (accessed 5 March 2020).
29. Department of Health. PBS expenditure and prescriptions report 1 July 2018 to 30 June 2019. Canberra: Australian Government, 2019. http://www.pbs.gov.au/info/statistics/expenditure-prescriptions/pbs-expenditure-and-prescriptions-report (accessed 19 December 2019).
30. Therapeutic Goods Administration. Significant decrease in the amount of codeine supplied to Australians. Canberra: TGA, 2019. https://www.tga.gov.au/media-release/significant-decrease-amount-codeine-supplied-australians (accessed 26 June 2019).
31. Primary Health Tasmania. A guide to deprescribing statins. Hobart: Primary Health Tasmania, 2019. https://www.primaryhealthtas.com.au/wp-content/uploads/2018/09/A-Guide-to-Deprescribing-Statins-2019.pdf (accessed 18 March 2020).
32. Primary Health Tasmania. A guide to deprescribing antihypertensive agents. Hobart: Primary Health Tasmania, 2019. https://www.primaryhealthtas.com.au/wp-content/uploads/2018/09/A-Guide-to-Deprescribing-Antihypersensitive-Agents-2019.pdf (accessed 18 March 2020).
33. Australian Institute of Health and Welfare. Arthritis and other musculoskeletal conditions across the life stages. Canberra: AIHW, 2014. https://www.aihw.gov.au/reports/chronic-musculoskeletal-conditions/across-life-stages/contents/table-of-contents (accessed 22 May 2019).
34. Morgan S, Coleman J. We live in testing times - teaching rational test ordering in general practice. Aust Fam Physician 2014;43:273-6. https://www.ncbi.nlm.nih.gov/pubmed/24791766
35. Royal College of Pathologists of Australasia. Manual of use and interpretation of pathology tests (RCPA Manual) Sydney: RCPA, 2015. https://www.rcpa.edu.au/Manuals/RCPA-Manual (accessed 27 November 2019).
36. Royal Australian College of General Practitioners. General practice management of type 2 diabetes: 2016–18. Melbourne: RACGP, 2016.
GENERAL PRACTICE INSIGHTS REPORT 2018–19 90
https://www.racgp.org.au/FSDEDEV/media/documents/Clinical%20Resources/Guidelines/Diabetes/General-practice-management-of-type-2-diabetes_1.pdf (accessed 27 November 2019).
37. NPS MedicineWise. Thyroid disease: challenges in primary care. MedicineWise News. Sydney: NPS MedicineWise, 2019. https://www.nps.org.au/news/thyroid-disease-challenges-in-primary-care (accessed 8 May 2020).
38. Royal Australian College of General Practitioners. Guidelines for preventive activities in general practice 9th edition (Red Book). East Melbourne: RACGP, 2018. https://www.racgp.org.au/clinical-resources/clinical-guidelines/key-racgp-guidelines/view-all-racgp-guidelines/red-book (accessed 24 February 2020).
39. Therapeutic Goods Administration. Prescription strong (Schedule 8) opioid use and misuse in Australia – options for a regulatory response (consultation paper). Canberra: TGA, 2018. https://www.tga.gov.au/sites/default/files/consultation-prescription-strong-schedule-8-opiod-use-misuse-in-australia-options-for-regulatory-response.pdf (accessed 29 March 2020).
40. Family Medicine Research Centre. Bettering the Evaluation and Care of Health (BEACH). Sydney: University of Sydney, 2017. https://sydney.edu.au/medicine/fmrc/beach/ (accessed 20 September 2019).
41. Productivity Commission. Report on Government Services 2020 (Part E: Health). Canberra: Productivity Commission, 2020. https://www.pc.gov.au/research/ongoing/report-on-government-services/2020/health (accessed 8 May 2020).
42. Australian Bureau of Statistics. Indigenous status standard, 2014 (version 1.5). Canberra: ABS, 2015. https://www.abs.gov.au/AUSSTATS/[email protected]/Lookup/1200.0.55.008Main+Features12014,%20Version%201.5?OpenDocument (accessed 20 September 2019).
43. Australian Bureau of Statistics. Socio-Economic Indexes for Areas. Canberra: ABS, 2018. https://www.abs.gov.au/websitedbs/censushome.nsf/home/seifa (accessed 20 September 2019).
44. Australian Bureau of Statistics. Australian statistical geography standard (ASGS): Volume 5 - Remoteness structure, July 2016. Canberra: ABS, 2018. https://www.abs.gov.au/AUSSTATS/[email protected]/Lookup/1270.0.55.005Main+Features1July%202016?OpenDocument (accessed 20 September 2019).
45. Australian Digital Health Agency. National Clinical Terminology Service. Sydney: ADHA, 2020. https://www.healthterminologies.gov.au/ (accessed 29 March 2020).
46. Australian Digital Health Agency. SNOMED CT-AU and Australian Medicines Terminology August 2019 Release. Canberra: Australian Digital Health Agency, 2019. https://www.digitalhealth.gov.au/news-and-events/news/snomed-ct-au-and-australian-medicines-terminology-august-2019-release (accessed 20 September 2019).
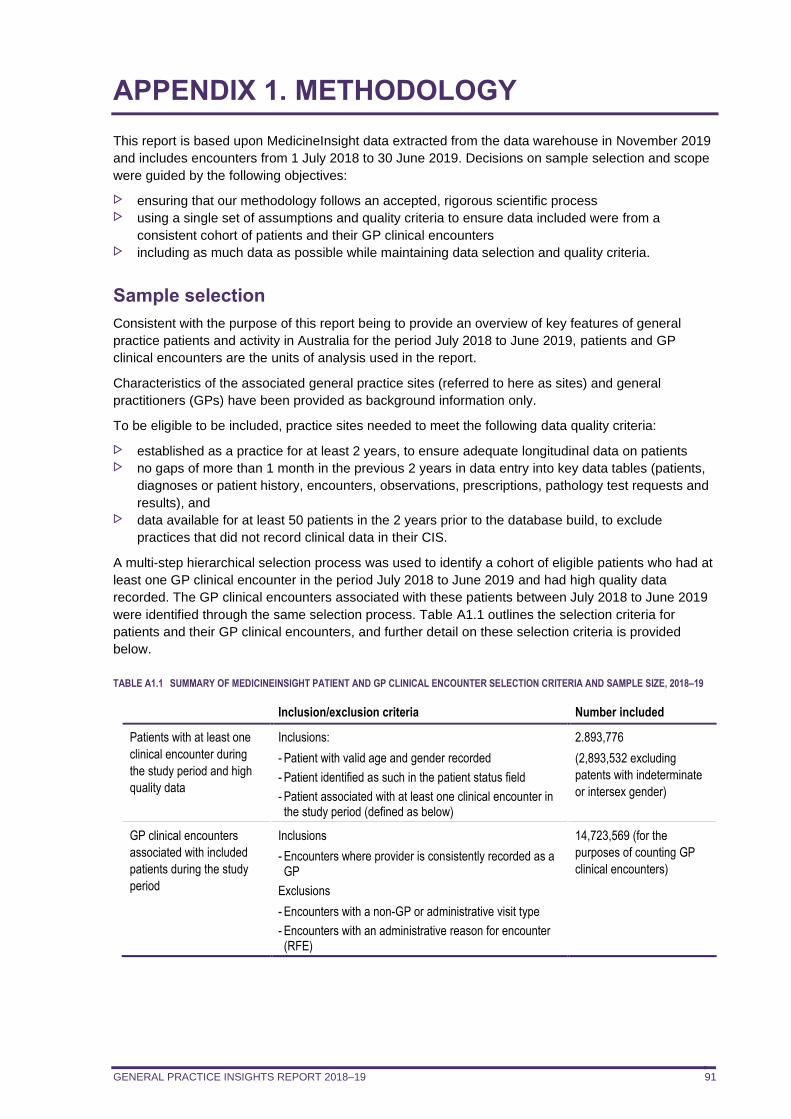
GENERAL PRACTICE INSIGHTS REPORT 2018–19 91
APPENDIX 1. METHODOLOGY
This report is based upon MedicineInsight data extracted from the data warehouse in November 2019
and includes encounters from 1 July 2018 to 30 June 2019. Decisions on sample selection and scope
were guided by the following objectives:
ensuring that our methodology follows an accepted, rigorous scientific process using a single set of assumptions and quality criteria to ensure data included were from a
consistent cohort of patients and their GP clinical encounters including as much data as possible while maintaining data selection and quality criteria.
Sample selection
Consistent with the purpose of this report being to provide an overview of key features of general
practice patients and activity in Australia for the period July 2018 to June 2019, patients and GP
clinical encounters are the units of analysis used in the report.
Characteristics of the associated general practice sites (referred to here as sites) and general
practitioners (GPs) have been provided as background information only.
To be eligible to be included, practice sites needed to meet the following data quality criteria:
established as a practice for at least 2 years, to ensure adequate longitudinal data on patients no gaps of more than 1 month in the previous 2 years in data entry into key data tables (patients,
diagnoses or patient history, encounters, observations, prescriptions, pathology test requests and
results), and data available for at least 50 patients in the 2 years prior to the database build, to exclude
practices that did not record clinical data in their CIS.
A multi-step hierarchical selection process was used to identify a cohort of eligible patients who had at
least one GP clinical encounter in the period July 2018 to June 2019 and had high quality data
recorded. The GP clinical encounters associated with these patients between July 2018 to June 2019
were identified through the same selection process. Table A1.1 outlines the selection criteria for
patients and their GP clinical encounters, and further detail on these selection criteria is provided
below.
TABLE A1.1 SUMMARY OF MEDICINEINSIGHT PATIENT AND GP CLINICAL ENCOUNTER SELECTION CRITERIA AND SAMPLE SIZE, 2018–19
Inclusion/exclusion criteria Number included
Patients with at least one
clinical encounter during
the study period and high
quality data
Inclusions:
- Patient with valid age and gender recorded
- Patient identified as such in the patient status field
- Patient associated with at least one clinical encounter in the study period (defined as below)
2.893,776
(2,893,532 excluding
patents with indeterminate
or intersex gender)
GP clinical encounters
associated with included
patients during the study
period
Inclusions
- Encounters where provider is consistently recorded as a GP
Exclusions
- Encounters with a non-GP or administrative visit type
- Encounters with an administrative reason for encounter (RFE)
14,723,569 (for the
purposes of counting GP
clinical encounters)
GENERAL PRACTICE INSIGHTS REPORT 2018–19 92
Patients
Patient information is entered in the CIS at the practice site and each patient is given a unique digital
number at each site visited. Patient loyalty data provided by the Commonwealth Department of Health
indicates that 63% of all patients attend only one practice. Another 26% attend two practices and 11%
attend three or more practices (data on file, Australian Government Department of Health).
Using this patient loyalty data, in combination with the estimates of the proportion of practices in
MedicineInsight (6.0%), we can also model the likely number of duplicate patient-ID numbers in
MedicineInsight. Assuming no change in patient behaviour, we estimate that 2.2% of patients in the
MedicineInsight GPIR 2018–19 cohort have two or more unique patient-ID numbers, due to visiting
more than one practice site.
Patients included in the sample were those recorded as having a valid age (0–112 years calculated as
the difference between 1 July 2019 and 1 July in the patient’s year of birth) and gender (male, female
or intersex/indeterminate). Patients recorded as either active, inactive, visitor (ie, not usual practice) or
deceased (but not emergency contact, next of kin or missing) within the patient status field and who
had at least one eligible clinical encounter in the study period were included (see section 2.3 for these
eligibility criteria).
Clinical encounters
Identifying GP clinical encounters in MedicineInsight data is a particular challenge because an
encounter is created in the CIS whenever a patient record is opened, irrespective of whether it was
opened for clinical reasons (such as a consultation) or for administrative purposes (such as reviewing
or updating a patient record). Additionally, there is no identifier recorded alongside all the clinical
records (eg, diagnoses or prescriptions) to indicate which encounter record they relate to. However, a
date is recorded alongside all diagnoses and prescriptions allowing records to be linked to a patient on
that date.
This report focuses on GP activity relating to general practice patients. For this reason, only
encounters where the provider is consistently identified as a GP or GP registrar were counted. Future
reports may include encounters with nurses and other health professionals, following appropriate
consultation and validation of the nurse indicator in MedicineInsight. Note that although we only
included encounters with GPs when calculating encounter rates, all the other information associated
with non-GP encounters was retained and used in the analyses.
The selection criteria in Box 1 were applied in order to maximise the likelihood that included
encounters were for clinical reasons and with a doctor.
GENERAL PRACTICE INSIGHTS REPORT 2018–19 93
BOX 1: ALGORITHM FOR IDENTIFYING CLINICAL ENCOUNTERS WITH A GP
An encounter was defined as clinical if at least one encounter record on a particular date met all of the
following criteria:
The clinical userl who created the contact record is consistently identified as a doctor (GP or GP
registrar) and the encounter is not an ‘imported’ record from another practice. To meet this criterion
both the ‘provider type’ and the ‘doctor indicator’ fields (which requires a complete prescriber number)
had to indicate the provider was a doctor;
AND
The visit type nominated for the encounter record does not clearly indicate the activity was
administrative and was clearly related to GP activity (not with another health professional). A pre-
defined list of administrative terms is consulted to determine whether the activity is administrative eg,
‘email’, ‘practice admin’, ‘non-visit’;
AND
The encounter reason on the encounter record does not clearly indicate the activity was administrative
Another pre-defined list of administrative terms is consulted to determine whether the activity is
administrative eg, ‘forms’, ‘prescription – no consult’.
If there is no encounter record on the encounter date that meets all of these criteria, the encounter is
considered non-clinical.
Capping GP clinical encounters at one per day
For the purposes of counting GP clinical encounters, only one GP clinical encounter per day per
patient was counted, because of the difficulty in distinguishing true multiple encounters on the same
day. Note that although the number of GP clinical encounters was capped at one, all the other
information associated with the encounters on that day was retained and used in the analyses.
Previous analysis has suggested that this strategy will not substantially underestimate the count of GP
clinical encounters, as only 1.9% of clinical GP encounter dates incorporate more than a single clinical
encounter. Although we identified certain encounters as ‘clinical’ for the purposes of patient selection
and describing characteristics of GP clinical encounters, all patient-relevant information on any date
during the financial year 2018–19 was used, even if associated with an administrative encounter.
Conditions
Conditions were selected for inclusion based upon burden of disease, if they were likely to be treated
in primary care, and under advice from the Advisory Group.
MedicineInsight condition flags are developed by clinical coders and reviewed by medical advisors
and indicate those records where the conditions of interest, or their relevant synonyms, are reported in
MedicineInsight. Both coded conditions (entered by GPs using drop-down lists in the CIS) and non-
coded conditions (free text) are searched for in all three of the 'Diagnosis', 'Reason for visit' or 'Reason
for prescription' fields. The condition flags are defined in Appendix 5.
Records identified by a free text string alone are not automatically flagged but are individually
reviewed by a clinical coder to determine whether the text string actually refers to the condition
indicated or is present in another context (eg, a search for 'cancer' may identify ‘partner died from
cancer'). Each record is flagged accordingly. Records indicating ‘suspected’, ‘query’ or ‘?’ records of
the condition were not flagged as the condition, unless otherwise specified.
l The CIS records the clinical user associated with each encounter and this includes any staff member who logged information in the CIS, including clinical
(GP, nurse, allied health) and administrative staff.
GENERAL PRACTICE INSIGHTS REPORT 2018–19 94
Records of medicines and tests can also be used to identify patients with a particular condition in
MedicineInsight, although this strategy was not used in this report.
Patient prevalence vs recently recorded management
Depending on individual GP recording practices, a diagnosis for a current condition may have been
recorded historically, but is not routinely recorded at subsequent GP clinical encounters. For example,
a GP may have recorded that a patient has type 2 diabetes many years ago but because they know
the patient’s history, they may not continue to record this as being the reason for visit despite
continuing to actively manage the condition. This can lead to an underestimate of recent management
of patients, if we only report on conditions recorded during a particular year. Information on conditions
by patient is typically presented in one of two ways throughout this report, to better reflect the nuances
of general practice records.
Information on the proportion of patients with the condition recorded at any time in their medical record
(referred to as ‘ever recorded’) is referred to as patient prevalence. While this method is considered
the most accurate way of estimating patient prevalence for chronic conditions, such as diabetes and
chronic obstructive pulmonary disease, it might overestimate the current prevalence for conditions that
can resolve over time, such as depression and anxiety disorder, or with age, such as asthma and
eczema.
Information on the recent management of conditions includes:
the proportion of patients with a condition recorded at least once during the 2018–19 study period the number of encounters with patient with the condition recorded at least once during the 2018–
19 study period per 100 clinical GP encounters the average number of encounters during 2018–19 for patients with selected conditions.
The patient prevalence (ever recorded) and recent management (recorded in 2018–19) of conditions
presented in this report, can be used as way of describing both the maximum, and minimum,
estimates of GP management of patients with these conditions, respectively.
Weighting
Weighting is a process of adjusting results from a sample survey to infer results for the in-scope total
population. To do this, a weight is allocated to each sample unit; for example, a patient or an
encounter. The weight is a value which indicates how many population units are represented by the
sample unit. As MedicineInsight data is more robust at the patient level rather than at the encounter
level and as we have access to relevant MBS patient reference data, we chose to weight to national
MBS data regarding patients who have each had at least one MBS-billed GP encounter in the 2018–
19 financial year (Table A1.2). The procedure is detailed below.
GPIR cohort and MBS reference population
TABLE A1.2 GPIR COHORT AND MBS REFERENCE POPULATION DEFINITIONS
GPIR 2018–19
patient cohort
Includes all patients with at least one clinical encounter, with a GP, recorded at a
MedicineInsight general practice-site in 2018–19 financial year.
MBS 2018–19 patient
population
Includes all patients with at least 1 MBS-billed GP attendance in 2018–19 financial year. MBS
encounters were defined by the Medicare claim groups listed in Table A6.2.
The broad type of service (BTOS) codes used to define the MBS population are shown in Table A1.3.
The GP consultations included GP non-referred attendances, other non-referred attendances and
Enhanced Primary Care services. Practice Nurse and Aboriginal Health Worker services were
excluded.
GENERAL PRACTICE INSIGHTS REPORT 2018–19 95
TABLE A1.3 MEDICARE CLAIM GROUPS USED TO DEFINE THE MBS PATIENT POPULATION
BTOS
code
BTOS name Group/Sub-group/item
A Non-referred attendances GP/VR GP A1, A7 (193,195,197), A11 (597, 599), A18, A22
M Non-referred attendances - Enhanced
Primary Care
A14, A15 (721-758), A17, A20 (subgroup 1)
B Non-referred attendances - Other A2, A5, A6, A7 (173), A11 (598, 600), A19, A20 (subgroup 2),
A23, A27, A30
BTOS: broad type of service VR: vocationally registered
Weighting procedure
A comparison of the sociodemographic distribution of the GPIR 2018–19 cohort and the MBS 2018–
19 reference population found that:
the age distribution of the GPIR cohort and the MBS reference population were similar males were under-represented in the GPIR cohort while broadly similar in terms of age-sex distribution, females aged 20–39 years were
overrepresented and males aged 20–39 years were underrepresented in the GPIR cohort patients from NSW and Tasmania were overrepresented and patients from SA underrepresented
in the GPIR cohort, mostly due to overrepresentation of patients in Hunter New England and
Tasmania PHNs, and underrepresentation in Adelaide PHN patients from ‘major cities’ and ‘remote/very remote’ were underrepresented and patients from
‘inner regional’ overrepresented in the GPIR cohort the SEIFA distribution of the GPIR cohort shows slight overrepresentation of the 3rd quintile, and
underrepresentation of the 5th (most advantaged) quintile.
Due to the differences in the sex and PHN distributions between the GPIR cohort and the chosen
MBS reference population and to mitigate potential confounding by age, sex and PHN, results were
weighted by age, sex and PHN. This step improved the state, remoteness and SEIFA differences in
representativeness.
The formula used to calculate patient weights is described below:
𝑤𝑝𝑎𝑡𝑖𝑒𝑛𝑡 𝑖,𝑎𝑔𝑒∗𝑠𝑒𝑥∗𝑃𝐻𝑁 𝑗 =𝑅𝑒𝑓𝑒𝑟𝑒𝑛𝑐𝑒 𝑝𝑜𝑝𝑢𝑙𝑎𝑡𝑖𝑜𝑛 𝑝𝑎𝑡𝑖𝑒𝑛𝑡 % 𝑖𝑛 [𝑎𝑔𝑒 ∗ 𝑠𝑒𝑥 ∗ 𝑃𝐻𝑁]𝑗
𝑆𝑎𝑚𝑝𝑙𝑒 𝑝𝑎𝑡𝑖𝑒𝑛𝑡 % 𝑖𝑛 [𝑎𝑔𝑒 ∗ 𝑠𝑒𝑥 ∗ 𝑃𝐻𝑁]𝑗
where 𝑤 is the weight applied to patient ‘I’ from group ‘j’ defined by age-sex-PHN; Reference
population % is the proportion of the MBS patient population within the ‘j’ age-sex-PHN group; and
Sample patient % is the proportion of the MedicineInsight patient cohort within the ‘j’ age-sex-PHN
group.
All patients included in the GPIR cohort had valid age and sex. The age groups (in years) used for
weighting are: 0–9, 10–19, 20–29, 30–39, 40–49, 50–59, 60–69, 70–79, 80–89 and 90+. Patients with
indeterminate or intersex gender were included describing the baseline (unweighted) study population
but excluded from all other analyses due to statistical reasons ie, small cell counts for gender
stratification leading to unreliable inference and potential concerns for patient confidentiality.
All patients were assigned to a PHN on the basis of their residential postcode. The exceptions were:
the small number of patients who resided in Western Queensland PHN as there are no
MedicineInsight practices represented in this PHN. These patients were re-assigned to their
practice-site postcode patients with a missing residential postcode who were re-assigned to their practice-site postcode.
GENERAL PRACTICE INSIGHTS REPORT 2018–19 96
Data that are not weighted
MedicineInsight is a collection of patient-centred datasets in which we can uniquely identify individual
patients within each MedicineInsight ‘practice-site’ (a collection of one or more associated general
practices).
GPIR practices within this report were not weighted to a national practice dataset, because (i) a
definitive national practice reference dataset is not publicly available and (ii) patients can be linked
only to the postcode of their ‘practice site’, which may occasionally differ from the postcode of some of
their constituent practices.
It is currently difficult to distinguish ‘clinical encounters’ from ‘non-clinical encounters’ (eg, purely
administrative entries into the medical records). We are waiting for results from the clinical encounter
validation study to be completed next year. Therefore, we chose not to weight to MBS patient
encounters.
Caveats
Although MedicineInsight patients may visit non-MedicineInsight and/or other MedicineInsight
practices during the financial year we estimate, based on MBS patient loyalty data, that there are no
more than 4 extra patient-IDs generated on average for every 100 individual patients. It is unlikely that
the activities of MedicineInsight patients recorded at non-MedicineInsight practices will become
available and no weighting enhancement can address this issue.
While the MBS 2018–19 population of patients with at least one billed GP visit was used as the
reference population for weighting, the MedicineInsight cohort may include patients not covered under
the MBS (eg, foreign citizens, workers compensation patients).
Mental health care plans
The use of GP mental health care plans (MHCP) was identified either via the MBS billing items in the
CIS (only available for practice sites where the billing system is integrated with the CIS) or via free text
entry in one of the three diagnosis fields recorded at any time during the 2018–19 financial year.
Patients were considered to have a GP mental health treatment plan if this was mentioned in a free
text entry or they had at least one of the following MBS items recorded: 272, 276, 277, 281, 2700,
2701, 2712, 2713, 2715, and 2717. This analysis was restricted to patients with a recorded diagnosis
of a long-term mental illness (bipolar disorder, schizophrenia, long-term depression or a long-term
anxiety disorder).
GENERAL PRACTICE INSIGHTS REPORT 2018–19 97
APPENDIX 2: THE MEDICINEINSIGHT PROGRAM
Recruitment of general practices and consent
General practice sites (both accredited and non-accredited) from all states and territories are recruited
into the MedicineInsight program and consent to the collection of de-identified patient information.
Practices included in the cohort used for this report use one of two clinical information systems (CISs),
‘Best Practice’ (BP) or ‘Medical Director 3’ (MD), which together account for the majority of general
practice software systems.
Initial recruitment focused on practice sites with more than three GPs as it was considered that these
practices were more likely to have electronic health records. Later, solo general practitioners and
corporate organisations were included in the cohort. More recently, there has been targeted
recruitment of practices into MedicineInsight to support local PHN quality improvement programs and
research.
The general practice owner or authorised person for a general practice must provide a signed
agreement to participate in MedicineInsight. Consistent with National Health and Medical Research
Council (NHMRC) ethical guidelines for the use of health-related data, patients are not required to give
written consent due to the non-identifiable nature of the data collected. This process has been
approved by the Royal Australian College of General Practitioners (RACGP) ethics committee.
However, general practices are required to inform patients of the practice’s participation in the
MedicineInsight program through poster displays and information leaflets. The posters and information
leaflets contain MedicineInsight contact information (email and phone line) in case there are any
patient concerns. Patients can opt out of the program through a process handled independently at the
practice if they do not wish their de-identified data to be shared via MedicineInsight.
Data collection
MedicineInsight uses third-party data extraction tools to de-identify, extract and securely transmit
whole-of-practice data from within each general practice’s CIS. An all-of-practice data collection,
containing all available historic and current de-identified electronic health records, is conducted when
a practice joins MedicineInsight. The extraction tool collects incremental data regularly, allowing the
development of a longitudinal database in which patients within practices can be tracked over time.
The data that MedicineInsight collects from general practice sites include:
general practice and GP information for the administration of quality improvement activities by
NPS MedicineWise patient demographic and clinical data entered by GPs and practice staff directly into the system, or
collected in the CIS from external sources (eg, pathology test results) system-generated data such as start time and date of a patient encounter.
The CIS uses coding systems such as ‘Docle’ in MD or ‘Pyefinch’ in BP to code conditions entered
into the system. However, it is not mandatory to use a code and clinicians can also enter terms as free
text. Both coded and free-text data are extracted from the CIS. However, data are not extracted from
fields such as the progress notes that may contain identifying information.
The data held in the MedicineInsight database are de-identified. However, each patient, practice site
and provider has a unique identifier, enabling patient data to be matched across multiple data tables
within each practice. Rigorous confidentiality controls are in place to prevent re-identification of patient
data.
The data are held by NPS MedicineWise in an external, secure data warehouse. General practices
are provided with transformed data via practice reports. These insights support general practices in
monitoring quality improvement activities and best practice patient management over time. Subject to
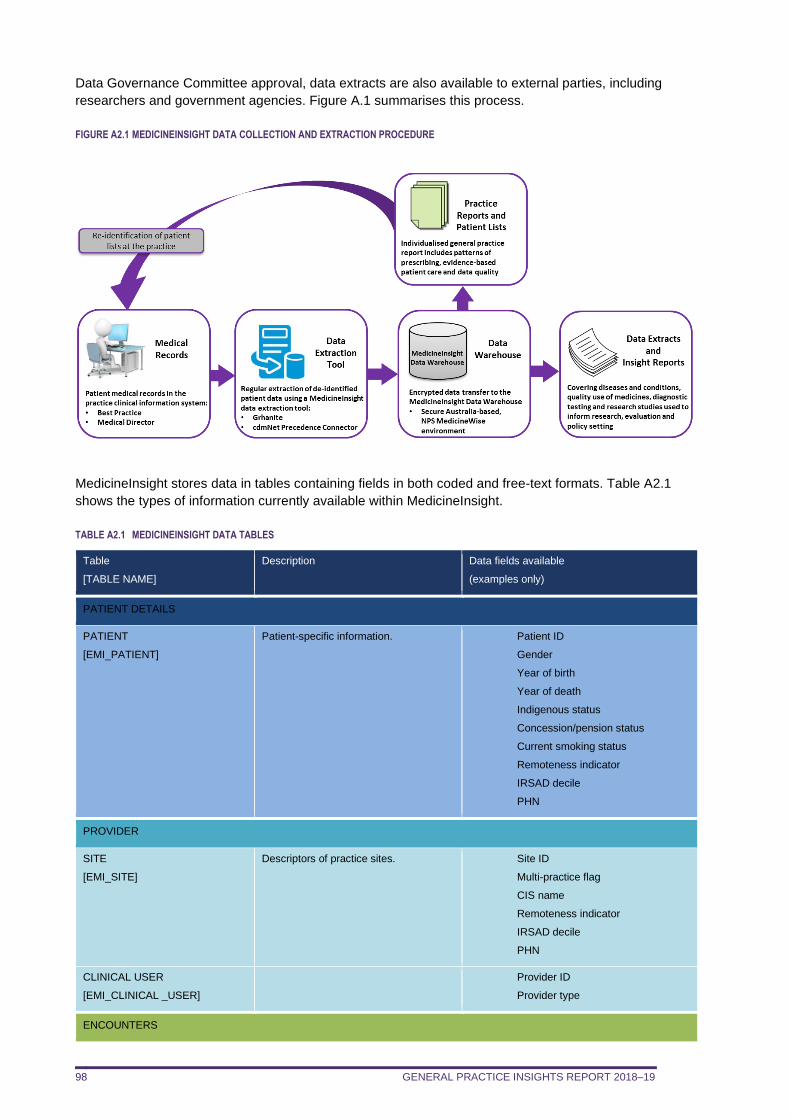
GENERAL PRACTICE INSIGHTS REPORT 2018–19 98
Data Governance Committee approval, data extracts are also available to external parties, including
researchers and government agencies. Figure A.1 summarises this process.
FIGURE A2.1 MEDICINEINSIGHT DATA COLLECTION AND EXTRACTION PROCEDURE
MedicineInsight stores data in tables containing fields in both coded and free-text formats. Table A2.1
shows the types of information currently available within MedicineInsight.
TABLE A2.1 MEDICINEINSIGHT DATA TABLES
Table
[TABLE NAME]
Description Data fields available
(examples only)
PATIENT DETAILS
PATIENT
[EMI_PATIENT]
Patient-specific information. Patient ID
Gender
Year of birth
Year of death
Indigenous status
Concession/pension status
Current smoking status
Remoteness indicator
IRSAD decile
PHN
PROVIDER
SITE
[EMI_SITE]
Descriptors of practice sites. Site ID
Multi-practice flag
CIS name
Remoteness indicator
IRSAD decile
PHN
CLINICAL USER
[EMI_CLINICAL _USER]
Provider ID
Provider type
ENCOUNTERS
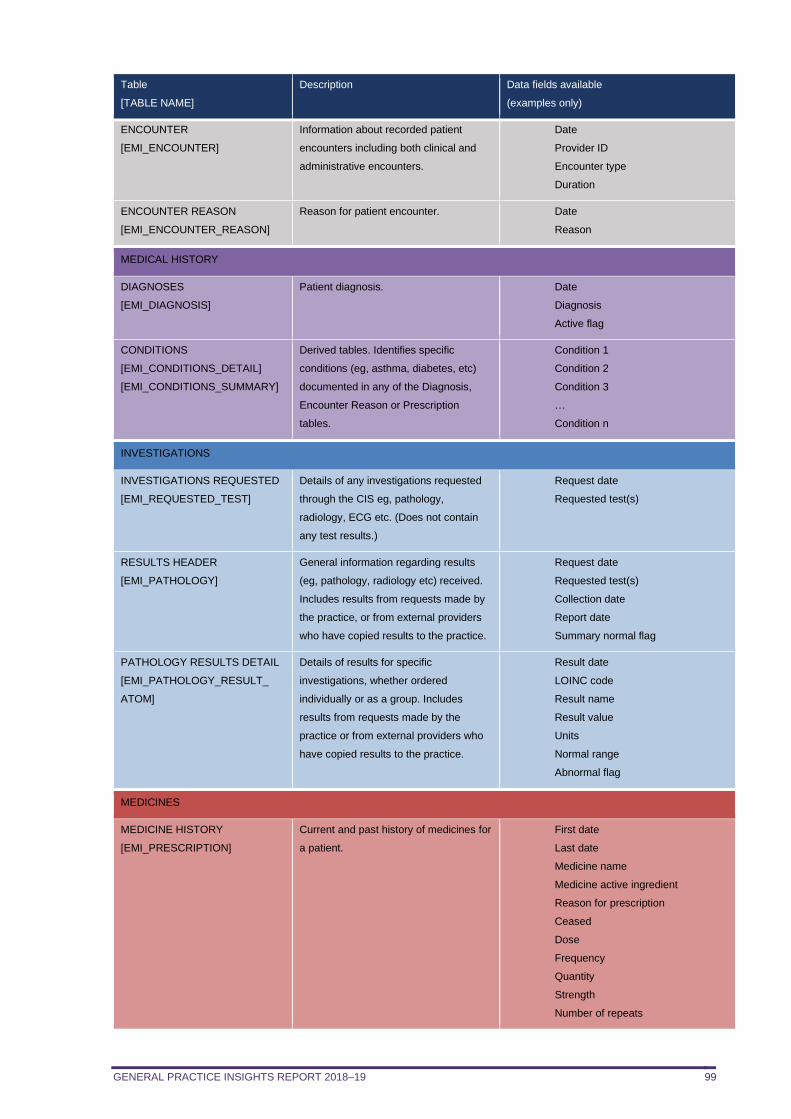
GENERAL PRACTICE INSIGHTS REPORT 2018–19 99
Table
[TABLE NAME]
Description Data fields available
(examples only)
ENCOUNTER
[EMI_ENCOUNTER]
Information about recorded patient
encounters including both clinical and
administrative encounters.
Date
Provider ID
Encounter type
Duration
ENCOUNTER REASON
[EMI_ENCOUNTER_REASON]
Reason for patient encounter. Date
Reason
MEDICAL HISTORY
DIAGNOSES
[EMI_DIAGNOSIS]
Patient diagnosis. Date
Diagnosis
Active flag
CONDITIONS
[EMI_CONDITIONS_DETAIL]
[EMI_CONDITIONS_SUMMARY]
Derived tables. Identifies specific
conditions (eg, asthma, diabetes, etc)
documented in any of the Diagnosis,
Encounter Reason or Prescription
tables.
Condition 1
Condition 2
Condition 3
…
Condition n
INVESTIGATIONS
INVESTIGATIONS REQUESTED
[EMI_REQUESTED_TEST]
Details of any investigations requested
through the CIS eg, pathology,
radiology, ECG etc. (Does not contain
any test results.)
Request date
Requested test(s)
RESULTS HEADER
[EMI_PATHOLOGY]
General information regarding results
(eg, pathology, radiology etc) received.
Includes results from requests made by
the practice, or from external providers
who have copied results to the practice.
Request date
Requested test(s)
Collection date
Report date
Summary normal flag
PATHOLOGY RESULTS DETAIL
[EMI_PATHOLOGY_RESULT_
ATOM]
Details of results for specific
investigations, whether ordered
individually or as a group. Includes
results from requests made by the
practice or from external providers who
have copied results to the practice.
Result date
LOINC code
Result name
Result value
Units
Normal range
Abnormal flag
MEDICINES
MEDICINE HISTORY
[EMI_PRESCRIPTION]
Current and past history of medicines for
a patient.
First date
Last date
Medicine name
Medicine active ingredient
Reason for prescription
Ceased
Dose
Frequency
Quantity
Strength
Number of repeats
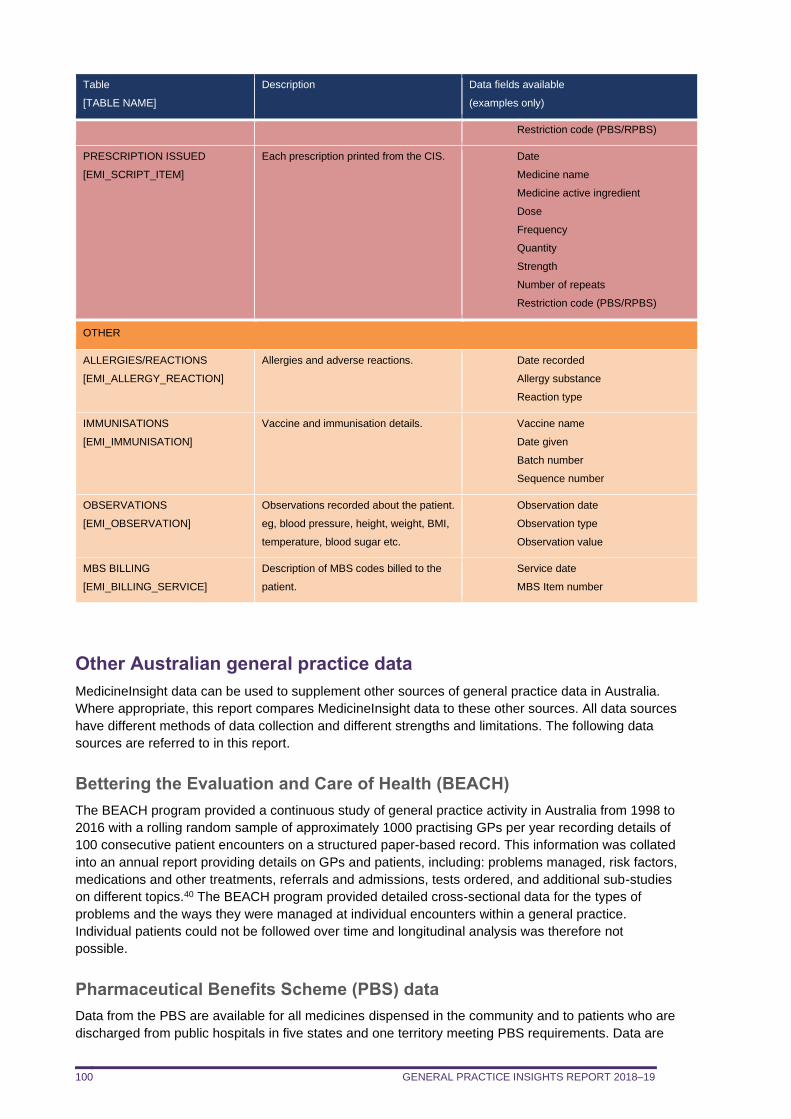
GENERAL PRACTICE INSIGHTS REPORT 2018–19 100
Table
[TABLE NAME]
Description Data fields available
(examples only)
Restriction code (PBS/RPBS)
PRESCRIPTION ISSUED
[EMI_SCRIPT_ITEM]
Each prescription printed from the CIS. Date
Medicine name
Medicine active ingredient
Dose
Frequency
Quantity
Strength
Number of repeats
Restriction code (PBS/RPBS)
OTHER
ALLERGIES/REACTIONS
[EMI_ALLERGY_REACTION]
Allergies and adverse reactions. Date recorded
Allergy substance
Reaction type
IMMUNISATIONS
[EMI_IMMUNISATION]
Vaccine and immunisation details. Vaccine name
Date given
Batch number
Sequence number
OBSERVATIONS
[EMI_OBSERVATION]
Observations recorded about the patient.
eg, blood pressure, height, weight, BMI,
temperature, blood sugar etc.
Observation date
Observation type
Observation value
MBS BILLING
[EMI_BILLING_SERVICE]
Description of MBS codes billed to the
patient.
Service date
MBS Item number
Other Australian general practice data
MedicineInsight data can be used to supplement other sources of general practice data in Australia.
Where appropriate, this report compares MedicineInsight data to these other sources. All data sources
have different methods of data collection and different strengths and limitations. The following data
sources are referred to in this report.
Bettering the Evaluation and Care of Health (BEACH)
The BEACH program provided a continuous study of general practice activity in Australia from 1998 to
2016 with a rolling random sample of approximately 1000 practising GPs per year recording details of
100 consecutive patient encounters on a structured paper-based record. This information was collated
into an annual report providing details on GPs and patients, including: problems managed, risk factors,
medications and other treatments, referrals and admissions, tests ordered, and additional sub-studies
on different topics.40 The BEACH program provided detailed cross-sectional data for the types of
problems and the ways they were managed at individual encounters within a general practice.
Individual patients could not be followed over time and longitudinal analysis was therefore not
possible.
Pharmaceutical Benefits Scheme (PBS) data
Data from the PBS are available for all medicines dispensed in the community and to patients who are
discharged from public hospitals in five states and one territory meeting PBS requirements. Data are
GENERAL PRACTICE INSIGHTS REPORT 2018–19 101
also available for Repatriation Pharmaceutical Benefits Scheme (RPBS) prescriptions for eligible war
veterans and their families. PBS data do not include medicines prescribed for hospital inpatients or
private prescriptions. Data from the PBS are limited, with only sociodemographic data routinely
available for individual patients. PBS data do not include information on relevant diagnoses, test
results, risk factors and service use, which are important to the interpretation of medicines data.
Medicare Benefits Schedule (MBS) data
The MBS claims data are an administrative by-product of the administration of the Medicare fee-for-
service payment system. MBS data are available on eligible general practice attendances. Data are
also available on pathology tests, but generally only for the three most expensive items undertaken
(called ‘coning’). The MBS data do not cover all services, for example those qualifying for a benefit
under the Department of Veterans’ Affairs (DVA) National Treatment Account or some services
conducted through state and territory community-controlled health centres.
RACGP General Practice: Health of the Nation 2019
This 2019 report from the RACGP has used a number of data sources, and also draws information
from an RACGP-commissioned online survey by EY Sweeney, incorporating responses from 1174
RACGP Fellows on a broad range of questions, from experiences and challenges in clinical practice to
opinions of government health policy.7
Productivity Commission Report on Government Services 2020
The annual Report on Government Services (RoGS) provides information on the equity, effectiveness
and efficiency of government services in Australia, including primary healthcare via the MBS,
Department of Veterans’ Affairs and initiatives such as the Practice Incentives Program (PIP) and
Primary Health Networks (PHNs). It includes information on the number of general practices in
Australia, rate of accredited general practices across jurisdictions, availability of GPs by region and by
sex (number of FTE GPs per 100 000 people), waiting times and patient satisfaction.41
GENERAL PRACTICE INSIGHTS REPORT 2018–19 102
APPENDIX 3. DEFINITIONS OF VARIABLES USED IN THIS REPORT
Demographics
Age
MedicineInsight does not collect a patient’s actual date of birth to preserve privacy. As a result, age is
calculated assuming that all patients have been born on 1 July of the year of their birth and their age
was calculated as of 1 July 2019. However, patients whose age was calculated to be more than 112
years were not considered valid and removed from analysis.
Gender
Information on patient gender (male, female, intersex or indeterminate) is extracted from the CIS.
However, due to the small number of intersex or indeterminate patients, these patients were not
included in analyses conducted from Chapter 3 onwards.
Aboriginal and/or Torres Strait Islander patients
Information on patients’ Aboriginal or Torres Strait Islander status is extracted from the CIS and
imported into MedicineInsight using the ABS standard classification.42
Socio-economic status
Socio-Economic Indexes for Areas (SEIFA) are assigned to patients and practices based on their
postcodes. If patient postcode is missing, socio-economic status can be reported as missing, or can
be inferred from the relevant practice site postcode. SEIFA is determined in accordance with the ABS
Index of Relative Socio-Economic Advantage and Disadvantage (IRSAD) deciles.43
Rurality
Rurality is assigned to both practices and patients based on postcode. If patient postcode is missing,
rurality can be reported as missing, or can be inferred from the relevant practice site postcode. Rurality
is determined in accordance with the ABS geographical framework ‘Remoteness Areas’.44
Conditions
There is no consistent national classification system used within general practice to code conditions,
and each CIS has its own classification system. MedicineInsight extracts Docle- and Pyefinch-coded
and free-text data from fields including diagnosis and medical history, the reason for encounter (ie,
reason for visit or consultation) and the reason for prescription. To maintain patient confidentiality, we
are unable to access or extract information from patient progress notes.
In conjunction with medical, pharmaceutical and clinical coding experts, we have developed coding
algorithms to identify conditions and symptoms of interest within the MedicineInsight database, using
commonly accepted clinical definitions, terms and synonyms from SNOMED CT-AU.45,46 Both free-text
and coded data extracted from the fields listed above are used to identify conditions. Please refer to
Appendix 5 for more detailed definitions of conditions used in this report.
While clinicians may record in the CIS whether a condition is ‘active’ or ‘inactive’, based on experience
from delivering practice reports, it appears that this information is not regularly updated within the CIS,
thus may not be reliable. For this analysis, conditions are included irrespective of whether they are
marked as ‘active’ or ‘inactive’ in the CIS.
GENERAL PRACTICE INSIGHTS REPORT 2018–19 103
When reporting data on conditions ‘ever’ experienced by patients, one or more conditions have been
assigned to each patient if each condition was recorded in at least one of the above-listed fields in any
encounter record, including records from 2018–19 and from previous years.
Prescriptions
Prescription data are restricted to medicines prescribed by GPs using their CIS to print the
prescription. These prescriptions include medicines that are partly or wholly government-rebated from
the PBS and RPBS, and also private (non-rebated) prescriptions. Private prescriptions are those paid
for entirely by the patient or their private health insurer as they do not meet PBS/RPBS requirements
related to the medicine prescribed, its indication for use, the amount supplied or the number of
repeats. Prescription data do not necessarily indicate whether a medicine was dispensed or used by
the patient. Dispensing data for rebatable medicines are available from the PBS.
Prescription data are available for both ‘issued’ prescriptions and a stated number of repeats recorded
in the CIS. Whenever a new (but not necessarily first-time) prescription is recorded, this is counted as
an ‘issued’ prescription. When reporting the volume of prescriptions, the number of issued
prescriptions and the total number of prescriptions, including both issued and repeats, are both used.
For example, when a prescription for a medicine with five repeats is entered in the CIS it will be
counted once when the analysis focuses on issued prescriptions and will be counted six times when
the analysis is for the issued-plus-repeat prescriptions, which we refer to here as the total number of
prescriptions.
All medicines recorded, whether by generic or brand name, will be grouped to one of the 14 categories
of the ATC level 1.
Pathology tests
Most Australian practices receive pathology test results electronically, transferred directly into the CIS
from pathology providers. There are three potential sources of information about pathology within the
CIS – tests requested, result summaries and the associated result details – which are all linked to the
patient. This report uses the pathology test result details as not all tests requested are recorded
electronically. The result summaries and result details also include data from tests ordered by
specialists or doctors outside the practice, when they have requested that a GP receive a copy of a
result.
Most of the common pathology test results are recorded using Logical Observation Identifiers Names
and Codes (LOINC), and contain the detailed results, often including whether the result is normal or
abnormal depending on the normal ranges for that laboratory. Each component of a pathology test
result is recorded separately, eg, for full blood counts there would be over a dozen separate test
results documented, such as white blood cell count, haemoglobin, and so on.
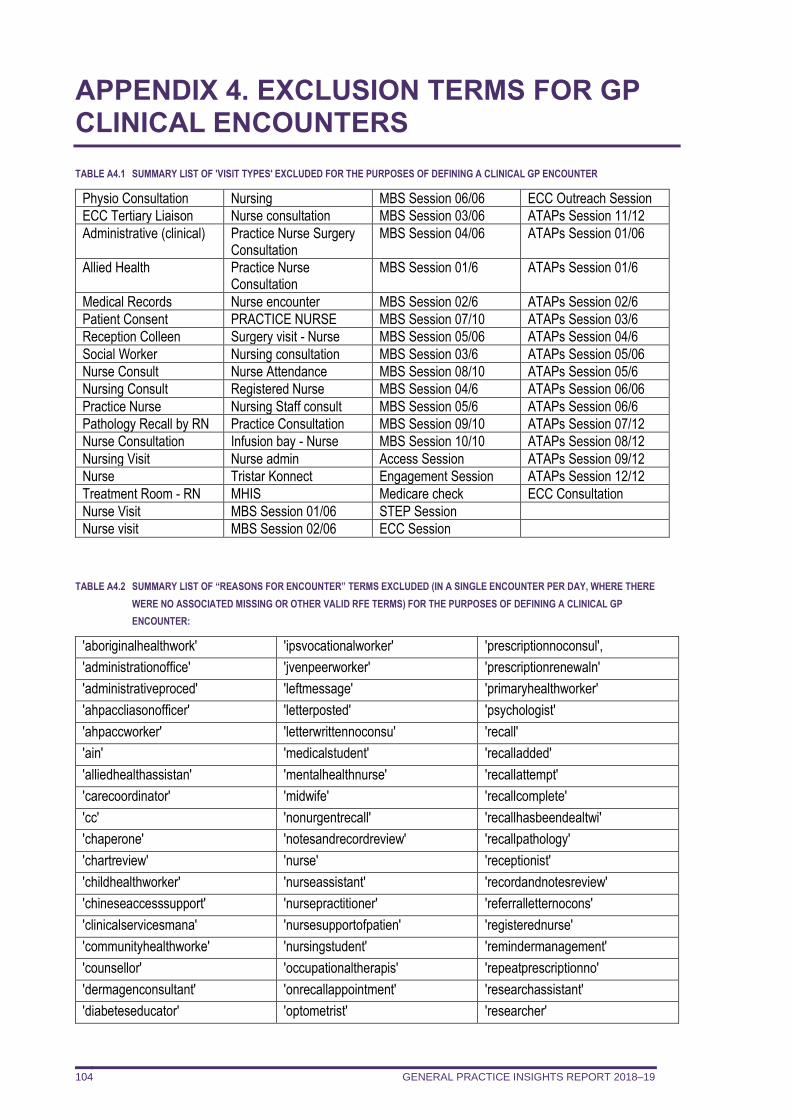
GENERAL PRACTICE INSIGHTS REPORT 2018–19 104
APPENDIX 4. EXCLUSION TERMS FOR GP CLINICAL ENCOUNTERS
TABLE A4.1 SUMMARY LIST OF 'VISIT TYPES' EXCLUDED FOR THE PURPOSES OF DEFINING A CLINICAL GP ENCOUNTER
Physio Consultation Nursing MBS Session 06/06 ECC Outreach Session
ECC Tertiary Liaison Nurse consultation MBS Session 03/06 ATAPs Session 11/12
Administrative (clinical) Practice Nurse Surgery Consultation
MBS Session 04/06 ATAPs Session 01/06
Allied Health Practice Nurse Consultation
MBS Session 01/6 ATAPs Session 01/6
Medical Records Nurse encounter MBS Session 02/6 ATAPs Session 02/6
Patient Consent PRACTICE NURSE MBS Session 07/10 ATAPs Session 03/6
Reception Colleen Surgery visit - Nurse MBS Session 05/06 ATAPs Session 04/6
Social Worker Nursing consultation MBS Session 03/6 ATAPs Session 05/06
Nurse Consult Nurse Attendance MBS Session 08/10 ATAPs Session 05/6
Nursing Consult Registered Nurse MBS Session 04/6 ATAPs Session 06/06
Practice Nurse Nursing Staff consult MBS Session 05/6 ATAPs Session 06/6
Pathology Recall by RN Practice Consultation MBS Session 09/10 ATAPs Session 07/12
Nurse Consultation Infusion bay - Nurse MBS Session 10/10 ATAPs Session 08/12
Nursing Visit Nurse admin Access Session ATAPs Session 09/12
Nurse Tristar Konnect Engagement Session ATAPs Session 12/12
Treatment Room - RN MHIS Medicare check ECC Consultation
Nurse Visit MBS Session 01/06 STEP Session
Nurse visit MBS Session 02/06 ECC Session
TABLE A4.2 SUMMARY LIST OF “REASONS FOR ENCOUNTER” TERMS EXCLUDED (IN A SINGLE ENCOUNTER PER DAY, WHERE THERE
WERE NO ASSOCIATED MISSING OR OTHER VALID RFE TERMS) FOR THE PURPOSES OF DEFINING A CLINICAL GP
ENCOUNTER:
'aboriginalhealthwork' 'ipsvocationalworker' 'prescriptionnoconsul',
'administrationoffice' 'jvenpeerworker' 'prescriptionrenewaln'
'administrativeproced' 'leftmessage' 'primaryhealthworker'
'ahpaccliasonofficer' 'letterposted' 'psychologist'
'ahpaccworker' 'letterwrittennoconsu' 'recall'
'ain' 'medicalstudent' 'recalladded'
'alliedhealthassistan' 'mentalhealthnurse' 'recallattempt'
'carecoordinator' 'midwife' 'recallcomplete'
'cc' 'nonurgentrecall' 'recallhasbeendealtwi'
'chaperone' 'notesandrecordreview' 'recallpathology'
'chartreview' 'nurse' 'receptionist'
'childhealthworker' 'nurseassistant' 'recordandnotesreview'
'chineseaccesssupport' 'nursepractitioner' 'referralletternocons'
'clinicalservicesmana' 'nursesupportofpatien' 'registerednurse'
'communityhealthworke' 'nursingstudent' 'remindermanagement'
'counsellor' 'occupationaltherapis' 'repeatprescriptionno'
'dermagenconsultant' 'onrecallappointment' 'researchassistant'
'diabeteseducator' 'optometrist' 'researcher'
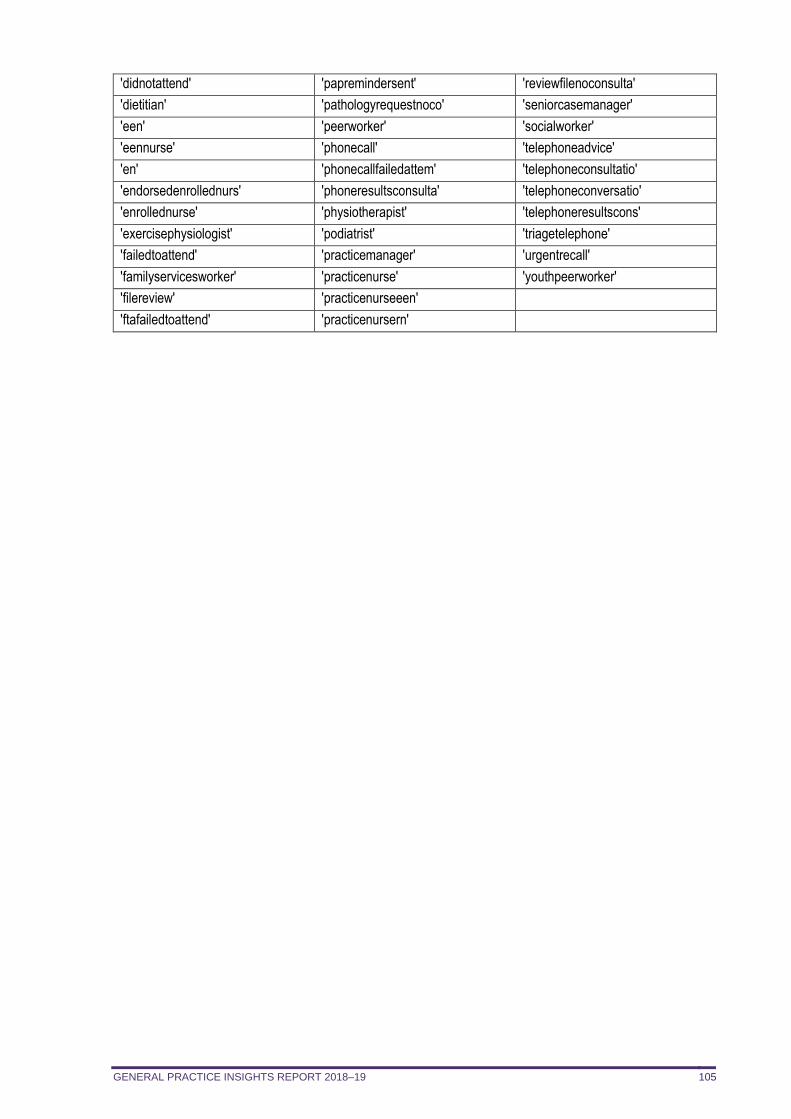
GENERAL PRACTICE INSIGHTS REPORT 2018–19 105
'didnotattend' 'papremindersent' 'reviewfilenoconsulta'
'dietitian' 'pathologyrequestnoco' 'seniorcasemanager'
'een' 'peerworker' 'socialworker'
'eennurse' 'phonecall' 'telephoneadvice'
'en' 'phonecallfailedattem' 'telephoneconsultatio'
'endorsedenrollednurs' 'phoneresultsconsulta' 'telephoneconversatio'
'enrollednurse' 'physiotherapist' 'telephoneresultscons'
'exercisephysiologist' 'podiatrist' 'triagetelephone'
'failedtoattend' 'practicemanager' 'urgentrecall'
'familyservicesworker' 'practicenurse' 'youthpeerworker'
'filereview' 'practicenurseeen'
'ftafailedtoattend' 'practicenursern'
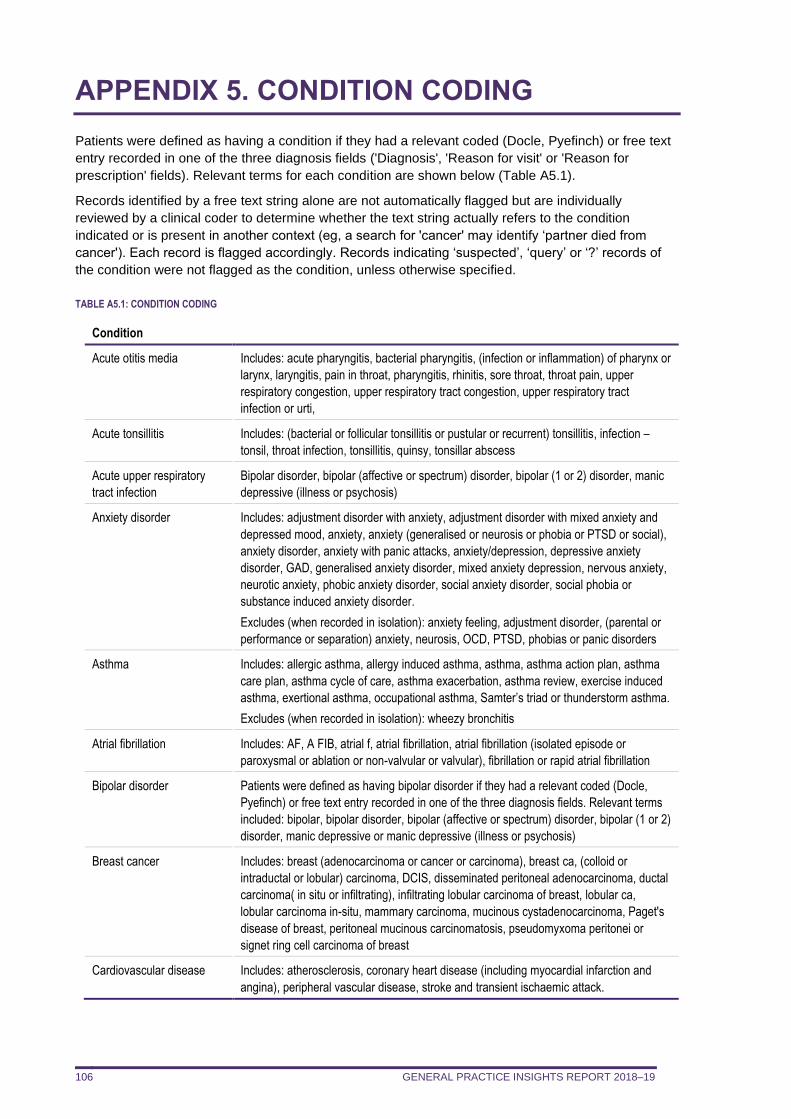
GENERAL PRACTICE INSIGHTS REPORT 2018–19 106
APPENDIX 5. CONDITION CODING
Patients were defined as having a condition if they had a relevant coded (Docle, Pyefinch) or free text
entry recorded in one of the three diagnosis fields ('Diagnosis', 'Reason for visit' or 'Reason for
prescription' fields). Relevant terms for each condition are shown below (Table A5.1).
Records identified by a free text string alone are not automatically flagged but are individually
reviewed by a clinical coder to determine whether the text string actually refers to the condition
indicated or is present in another context (eg, a search for 'cancer' may identify ‘partner died from
cancer'). Each record is flagged accordingly. Records indicating ‘suspected’, ‘query’ or ‘?’ records of
the condition were not flagged as the condition, unless otherwise specified.
TABLE A5.1: CONDITION CODING
Condition
Acute otitis media Includes: acute pharyngitis, bacterial pharyngitis, (infection or inflammation) of pharynx or
larynx, laryngitis, pain in throat, pharyngitis, rhinitis, sore throat, throat pain, upper
respiratory congestion, upper respiratory tract congestion, upper respiratory tract
infection or urti,
Acute tonsillitis Includes: (bacterial or follicular tonsillitis or pustular or recurrent) tonsillitis, infection –
tonsil, throat infection, tonsillitis, quinsy, tonsillar abscess
Acute upper respiratory
tract infection
Bipolar disorder, bipolar (affective or spectrum) disorder, bipolar (1 or 2) disorder, manic
depressive (illness or psychosis)
Anxiety disorder Includes: adjustment disorder with anxiety, adjustment disorder with mixed anxiety and
depressed mood, anxiety, anxiety (generalised or neurosis or phobia or PTSD or social),
anxiety disorder, anxiety with panic attacks, anxiety/depression, depressive anxiety
disorder, GAD, generalised anxiety disorder, mixed anxiety depression, nervous anxiety,
neurotic anxiety, phobic anxiety disorder, social anxiety disorder, social phobia or
substance induced anxiety disorder.
Excludes (when recorded in isolation): anxiety feeling, adjustment disorder, (parental or
performance or separation) anxiety, neurosis, OCD, PTSD, phobias or panic disorders
Asthma Includes: allergic asthma, allergy induced asthma, asthma, asthma action plan, asthma
care plan, asthma cycle of care, asthma exacerbation, asthma review, exercise induced
asthma, exertional asthma, occupational asthma, Samter’s triad or thunderstorm asthma.
Excludes (when recorded in isolation): wheezy bronchitis
Atrial fibrillation Includes: AF, A FIB, atrial f, atrial fibrillation, atrial fibrillation (isolated episode or
paroxysmal or ablation or non-valvular or valvular), fibrillation or rapid atrial fibrillation
Bipolar disorder Patients were defined as having bipolar disorder if they had a relevant coded (Docle,
Pyefinch) or free text entry recorded in one of the three diagnosis fields. Relevant terms
included: bipolar, bipolar disorder, bipolar (affective or spectrum) disorder, bipolar (1 or 2)
disorder, manic depressive or manic depressive (illness or psychosis)
Breast cancer Includes: breast (adenocarcinoma or cancer or carcinoma), breast ca, (colloid or
intraductal or lobular) carcinoma, DCIS, disseminated peritoneal adenocarcinoma, ductal
carcinoma( in situ or infiltrating), infiltrating lobular carcinoma of breast, lobular ca,
lobular carcinoma in-situ, mammary carcinoma, mucinous cystadenocarcinoma, Paget's
disease of breast, peritoneal mucinous carcinomatosis, pseudomyxoma peritonei or
signet ring cell carcinoma of breast
Cardiovascular disease Includes: atherosclerosis, coronary heart disease (including myocardial infarction and
angina), peripheral vascular disease, stroke and transient ischaemic attack.
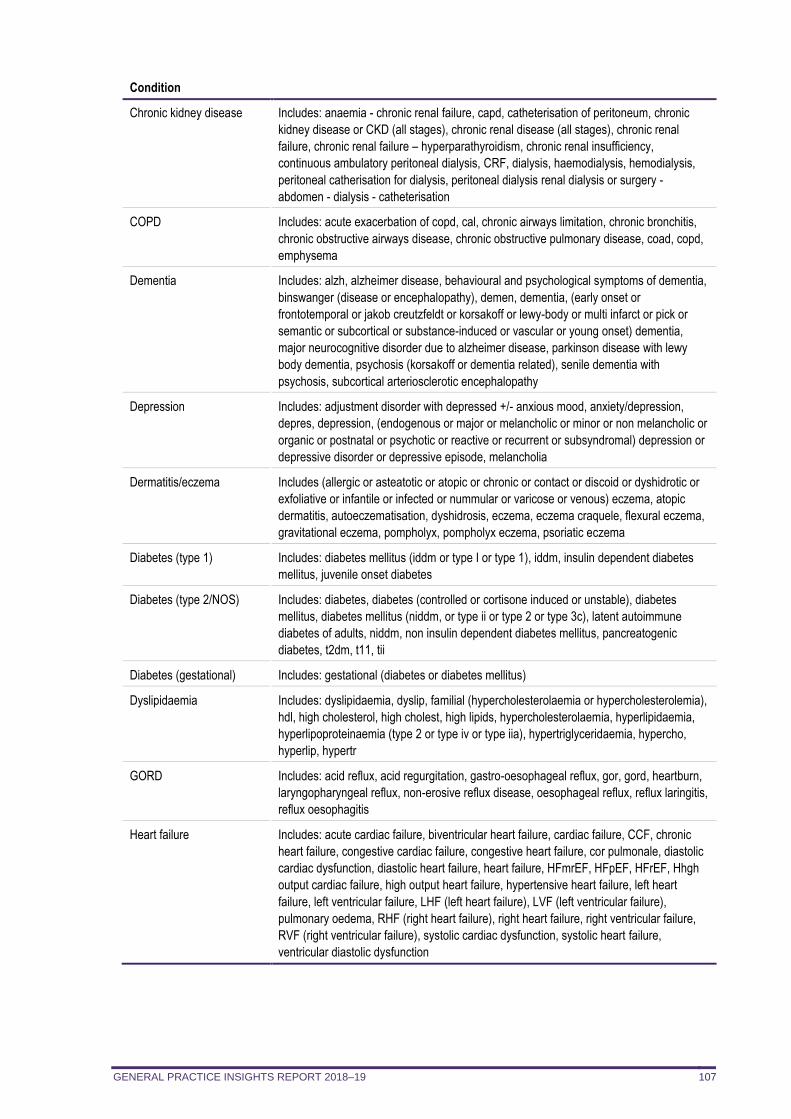
GENERAL PRACTICE INSIGHTS REPORT 2018–19 107
Condition
Chronic kidney disease Includes: anaemia - chronic renal failure, capd, catheterisation of peritoneum, chronic
kidney disease or CKD (all stages), chronic renal disease (all stages), chronic renal
failure, chronic renal failure – hyperparathyroidism, chronic renal insufficiency,
continuous ambulatory peritoneal dialysis, CRF, dialysis, haemodialysis, hemodialysis,
peritoneal catherisation for dialysis, peritoneal dialysis renal dialysis or surgery -
abdomen - dialysis - catheterisation
COPD Includes: acute exacerbation of copd, cal, chronic airways limitation, chronic bronchitis,
chronic obstructive airways disease, chronic obstructive pulmonary disease, coad, copd,
emphysema
Dementia Includes: alzh, alzheimer disease, behavioural and psychological symptoms of dementia,
binswanger (disease or encephalopathy), demen, dementia, (early onset or
frontotemporal or jakob creutzfeldt or korsakoff or lewy-body or multi infarct or pick or
semantic or subcortical or substance-induced or vascular or young onset) dementia,
major neurocognitive disorder due to alzheimer disease, parkinson disease with lewy
body dementia, psychosis (korsakoff or dementia related), senile dementia with
psychosis, subcortical arteriosclerotic encephalopathy
Depression Includes: adjustment disorder with depressed +/- anxious mood, anxiety/depression,
depres, depression, (endogenous or major or melancholic or minor or non melancholic or
organic or postnatal or psychotic or reactive or recurrent or subsyndromal) depression or
depressive disorder or depressive episode, melancholia
Dermatitis/eczema Includes (allergic or asteatotic or atopic or chronic or contact or discoid or dyshidrotic or
exfoliative or infantile or infected or nummular or varicose or venous) eczema, atopic
dermatitis, autoeczematisation, dyshidrosis, eczema, eczema craquele, flexural eczema,
gravitational eczema, pompholyx, pompholyx eczema, psoriatic eczema
Diabetes (type 1) Includes: diabetes mellitus (iddm or type I or type 1), iddm, insulin dependent diabetes
mellitus, juvenile onset diabetes
Diabetes (type 2/NOS) Includes: diabetes, diabetes (controlled or cortisone induced or unstable), diabetes
mellitus, diabetes mellitus (niddm, or type ii or type 2 or type 3c), latent autoimmune
diabetes of adults, niddm, non insulin dependent diabetes mellitus, pancreatogenic
diabetes, t2dm, t11, tii
Diabetes (gestational) Includes: gestational (diabetes or diabetes mellitus)
Dyslipidaemia Includes: dyslipidaemia, dyslip, familial (hypercholesterolaemia or hypercholesterolemia),
hdl, high cholesterol, high cholest, high lipids, hypercholesterolaemia, hyperlipidaemia,
hyperlipoproteinaemia (type 2 or type iv or type iia), hypertriglyceridaemia, hypercho,
hyperlip, hypertr
GORD Includes: acid reflux, acid regurgitation, gastro-oesophageal reflux, gor, gord, heartburn,
laryngopharyngeal reflux, non-erosive reflux disease, oesophageal reflux, reflux laringitis,
reflux oesophagitis
Heart failure Includes: acute cardiac failure, biventricular heart failure, cardiac failure, CCF, chronic
heart failure, congestive cardiac failure, congestive heart failure, cor pulmonale, diastolic
cardiac dysfunction, diastolic heart failure, heart failure, HFmrEF, HFpEF, HFrEF, Hhgh
output cardiac failure, high output heart failure, hypertensive heart failure, left heart
failure, left ventricular failure, LHF (left heart failure), LVF (left ventricular failure),
pulmonary oedema, RHF (right heart failure), right heart failure, right ventricular failure,
RVF (right ventricular failure), systolic cardiac dysfunction, systolic heart failure,
ventricular diastolic dysfunction
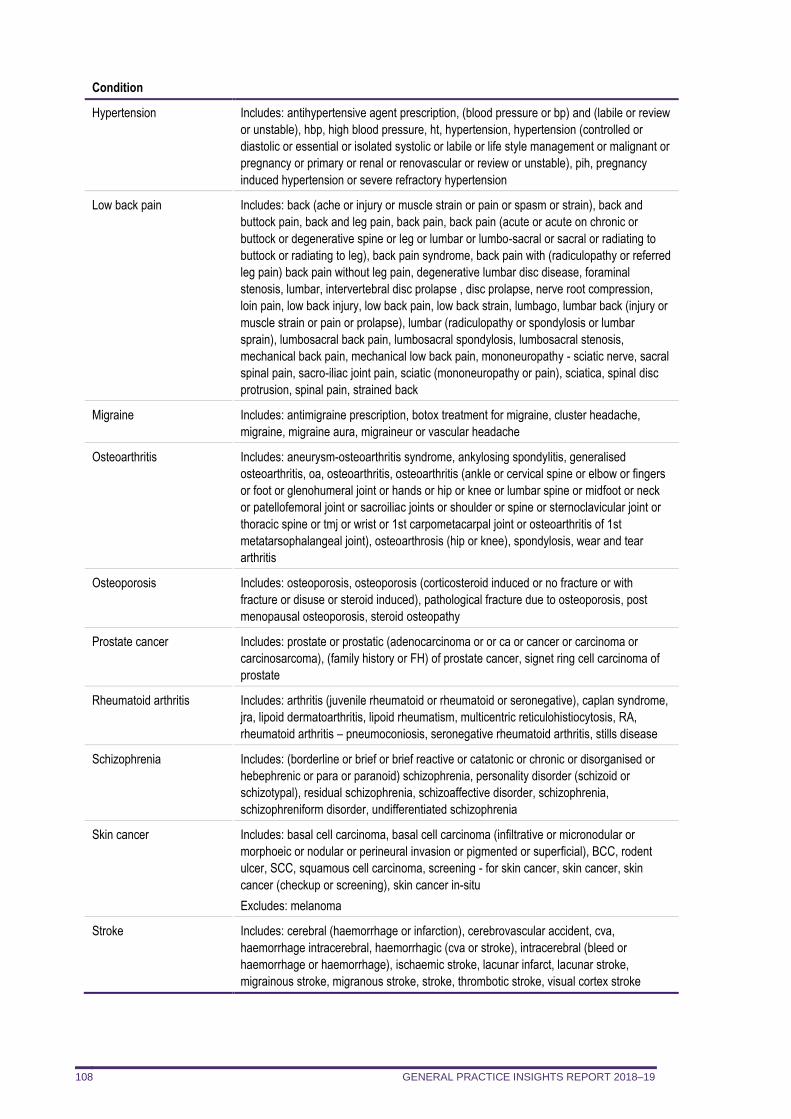
GENERAL PRACTICE INSIGHTS REPORT 2018–19 108
Condition
Hypertension Includes: antihypertensive agent prescription, (blood pressure or bp) and (labile or review
or unstable), hbp, high blood pressure, ht, hypertension, hypertension (controlled or
diastolic or essential or isolated systolic or labile or life style management or malignant or
pregnancy or primary or renal or renovascular or review or unstable), pih, pregnancy
induced hypertension or severe refractory hypertension
Low back pain Includes: back (ache or injury or muscle strain or pain or spasm or strain), back and
buttock pain, back and leg pain, back pain, back pain (acute or acute on chronic or
buttock or degenerative spine or leg or lumbar or lumbo-sacral or sacral or radiating to
buttock or radiating to leg), back pain syndrome, back pain with (radiculopathy or referred
leg pain) back pain without leg pain, degenerative lumbar disc disease, foraminal
stenosis, lumbar, intervertebral disc prolapse , disc prolapse, nerve root compression,
loin pain, low back injury, low back pain, low back strain, lumbago, lumbar back (injury or
muscle strain or pain or prolapse), lumbar (radiculopathy or spondylosis or lumbar
sprain), lumbosacral back pain, lumbosacral spondylosis, lumbosacral stenosis,
mechanical back pain, mechanical low back pain, mononeuropathy - sciatic nerve, sacral
spinal pain, sacro-iliac joint pain, sciatic (mononeuropathy or pain), sciatica, spinal disc
protrusion, spinal pain, strained back
Migraine Includes: antimigraine prescription, botox treatment for migraine, cluster headache,
migraine, migraine aura, migraineur or vascular headache
Osteoarthritis Includes: aneurysm-osteoarthritis syndrome, ankylosing spondylitis, generalised
osteoarthritis, oa, osteoarthritis, osteoarthritis (ankle or cervical spine or elbow or fingers
or foot or glenohumeral joint or hands or hip or knee or lumbar spine or midfoot or neck
or patellofemoral joint or sacroiliac joints or shoulder or spine or sternoclavicular joint or
thoracic spine or tmj or wrist or 1st carpometacarpal joint or osteoarthritis of 1st
metatarsophalangeal joint), osteoarthrosis (hip or knee), spondylosis, wear and tear
arthritis
Osteoporosis Includes: osteoporosis, osteoporosis (corticosteroid induced or no fracture or with
fracture or disuse or steroid induced), pathological fracture due to osteoporosis, post
menopausal osteoporosis, steroid osteopathy
Prostate cancer Includes: prostate or prostatic (adenocarcinoma or or ca or cancer or carcinoma or
carcinosarcoma), (family history or FH) of prostate cancer, signet ring cell carcinoma of
prostate
Rheumatoid arthritis Includes: arthritis (juvenile rheumatoid or rheumatoid or seronegative), caplan syndrome,
jra, lipoid dermatoarthritis, lipoid rheumatism, multicentric reticulohistiocytosis, RA,
rheumatoid arthritis – pneumoconiosis, seronegative rheumatoid arthritis, stills disease
Schizophrenia Includes: (borderline or brief or brief reactive or catatonic or chronic or disorganised or
hebephrenic or para or paranoid) schizophrenia, personality disorder (schizoid or
schizotypal), residual schizophrenia, schizoaffective disorder, schizophrenia,
schizophreniform disorder, undifferentiated schizophrenia
Skin cancer Includes: basal cell carcinoma, basal cell carcinoma (infiltrative or micronodular or
morphoeic or nodular or perineural invasion or pigmented or superficial), BCC, rodent
ulcer, SCC, squamous cell carcinoma, screening - for skin cancer, skin cancer, skin
cancer (checkup or screening), skin cancer in-situ
Excludes: melanoma
Stroke Includes: cerebral (haemorrhage or infarction), cerebrovascular accident, cva,
haemorrhage intracerebral, haemorrhagic (cva or stroke), intracerebral (bleed or
haemorrhage or haemorrhage), ischaemic stroke, lacunar infarct, lacunar stroke,
migrainous stroke, migranous stroke, stroke, thrombotic stroke, visual cortex stroke
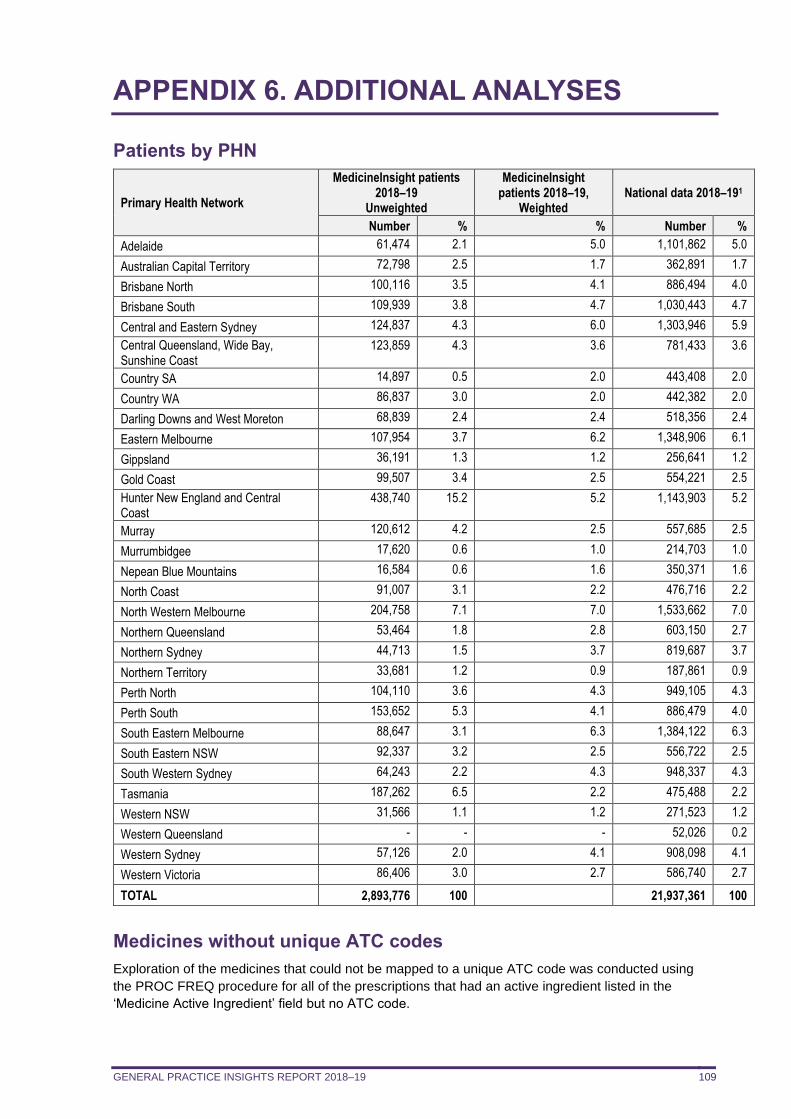
GENERAL PRACTICE INSIGHTS REPORT 2018–19 109
APPENDIX 6. ADDITIONAL ANALYSES
Patients by PHN
Primary Health Network
MedicineInsight patients 2018–19
Unweighted
MedicineInsight patients 2018–19,
Weighted National data 2018–191
Number % % Number %
Adelaide 61,474 2.1 5.0 1,101,862 5.0
Australian Capital Territory 72,798 2.5 1.7 362,891 1.7
Brisbane North 100,116 3.5 4.1 886,494 4.0
Brisbane South 109,939 3.8 4.7 1,030,443 4.7
Central and Eastern Sydney 124,837 4.3 6.0 1,303,946 5.9
Central Queensland, Wide Bay, Sunshine Coast
123,859 4.3 3.6 781,433 3.6
Country SA 14,897 0.5 2.0 443,408 2.0
Country WA 86,837 3.0 2.0 442,382 2.0
Darling Downs and West Moreton 68,839 2.4 2.4 518,356 2.4
Eastern Melbourne 107,954 3.7 6.2 1,348,906 6.1
Gippsland 36,191 1.3 1.2 256,641 1.2
Gold Coast 99,507 3.4 2.5 554,221 2.5
Hunter New England and Central Coast
438,740 15.2 5.2 1,143,903 5.2
Murray 120,612 4.2 2.5 557,685 2.5
Murrumbidgee 17,620 0.6 1.0 214,703 1.0
Nepean Blue Mountains 16,584 0.6 1.6 350,371 1.6
North Coast 91,007 3.1 2.2 476,716 2.2
North Western Melbourne 204,758 7.1 7.0 1,533,662 7.0
Northern Queensland 53,464 1.8 2.8 603,150 2.7
Northern Sydney 44,713 1.5 3.7 819,687 3.7
Northern Territory 33,681 1.2 0.9 187,861 0.9
Perth North 104,110 3.6 4.3 949,105 4.3
Perth South 153,652 5.3 4.1 886,479 4.0
South Eastern Melbourne 88,647 3.1 6.3 1,384,122 6.3
South Eastern NSW 92,337 3.2 2.5 556,722 2.5
South Western Sydney 64,243 2.2 4.3 948,337 4.3
Tasmania 187,262 6.5 2.2 475,488 2.2
Western NSW 31,566 1.1 1.2 271,523 1.2
Western Queensland - - - 52,026 0.2
Western Sydney 57,126 2.0 4.1 908,098 4.1
Western Victoria 86,406 3.0 2.7 586,740 2.7
TOTAL 2,893,776 100 21,937,361 100
Medicines without unique ATC codes
Exploration of the medicines that could not be mapped to a unique ATC code was conducted using
the PROC FREQ procedure for all of the prescriptions that had an active ingredient listed in the
‘Medicine Active Ingredient’ field but no ATC code.
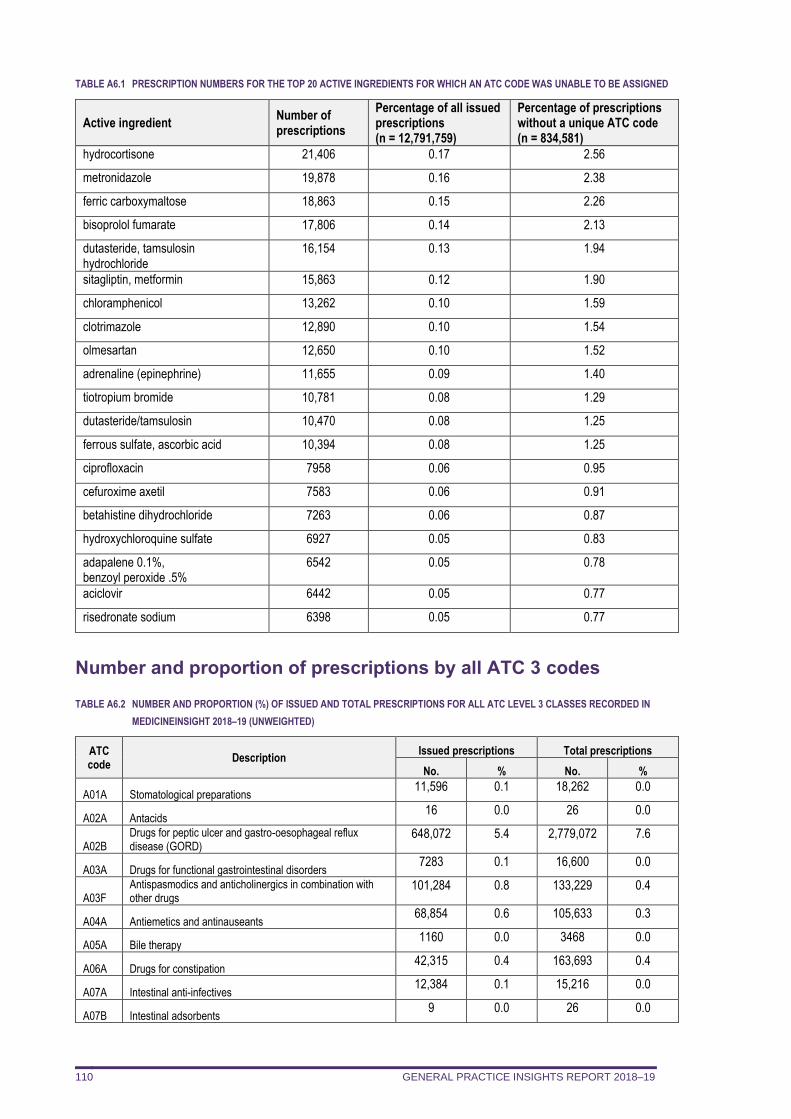
GENERAL PRACTICE INSIGHTS REPORT 2018–19 110
TABLE A6.1 PRESCRIPTION NUMBERS FOR THE TOP 20 ACTIVE INGREDIENTS FOR WHICH AN ATC CODE WAS UNABLE TO BE ASSIGNED
Active ingredient Number of prescriptions
Percentage of all issued prescriptions (n = 12,791,759)
Percentage of prescriptions without a unique ATC code (n = 834,581)
hydrocortisone 21,406 0.17 2.56
metronidazole 19,878 0.16 2.38
ferric carboxymaltose 18,863 0.15 2.26
bisoprolol fumarate 17,806 0.14 2.13
dutasteride, tamsulosin hydrochloride
16,154 0.13 1.94
sitagliptin, metformin 15,863 0.12 1.90
chloramphenicol 13,262 0.10 1.59
clotrimazole 12,890 0.10 1.54
olmesartan 12,650 0.10 1.52
adrenaline (epinephrine) 11,655 0.09 1.40
tiotropium bromide 10,781 0.08 1.29
dutasteride/tamsulosin 10,470 0.08 1.25
ferrous sulfate, ascorbic acid 10,394 0.08 1.25
ciprofloxacin 7958 0.06 0.95
cefuroxime axetil 7583 0.06 0.91
betahistine dihydrochloride 7263 0.06 0.87
hydroxychloroquine sulfate 6927 0.05 0.83
adapalene 0.1%, benzoyl peroxide .5%
6542 0.05 0.78
aciclovir 6442 0.05 0.77
risedronate sodium 6398 0.05 0.77
Number and proportion of prescriptions by all ATC 3 codes
TABLE A6.2 NUMBER AND PROPORTION (%) OF ISSUED AND TOTAL PRESCRIPTIONS FOR ALL ATC LEVEL 3 CLASSES RECORDED IN
MEDICINEINSIGHT 2018–19 (UNWEIGHTED)
ATC code
Description Issued prescriptions Total prescriptions
No. % No. %
A01A Stomatological preparations 11,596 0.1 18,262 0.0
A02A Antacids 16 0.0 26 0.0
A02B Drugs for peptic ulcer and gastro-oesophageal reflux disease (GORD)
648,072 5.4 2,779,072 7.6
A03A Drugs for functional gastrointestinal disorders 7283 0.1 16,600 0.0
A03F Antispasmodics and anticholinergics in combination with other drugs
101,284 0.8 133,229 0.4
A04A Antiemetics and antinauseants 68,854 0.6 105,633 0.3
A05A Bile therapy 1160 0.0 3468 0.0
A06A Drugs for constipation 42,315 0.4 163,693 0.4
A07A Intestinal anti-infectives 12,384 0.1 15,216 0.0
A07B Intestinal adsorbents 9 0.0 26 0.0
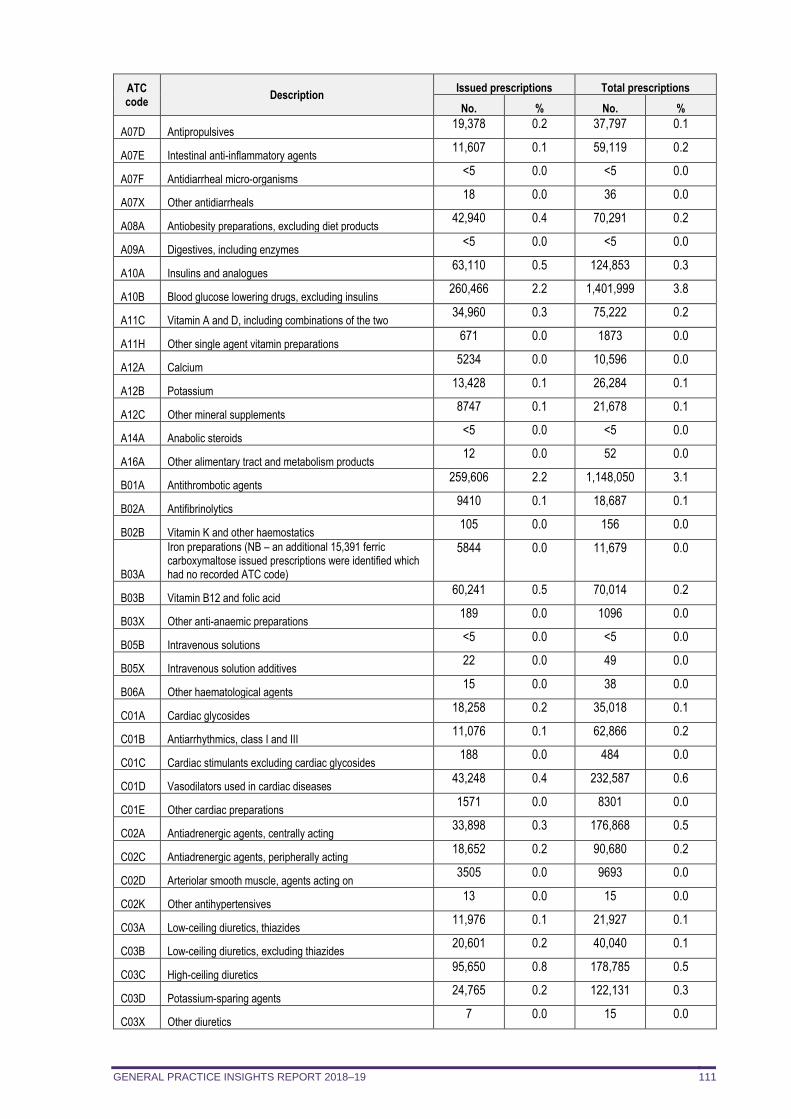
GENERAL PRACTICE INSIGHTS REPORT 2018–19 111
ATC code
Description Issued prescriptions Total prescriptions
No. % No. %
A07D Antipropulsives 19,378 0.2 37,797 0.1
A07E Intestinal anti-inflammatory agents 11,607 0.1 59,119 0.2
A07F Antidiarrheal micro-organisms <5 0.0 <5 0.0
A07X Other antidiarrheals 18 0.0 36 0.0
A08A Antiobesity preparations, excluding diet products 42,940 0.4 70,291 0.2
A09A Digestives, including enzymes <5 0.0 <5 0.0
A10A Insulins and analogues 63,110 0.5 124,853 0.3
A10B Blood glucose lowering drugs, excluding insulins 260,466 2.2 1,401,999 3.8
A11C Vitamin A and D, including combinations of the two 34,960 0.3 75,222 0.2
A11H Other single agent vitamin preparations 671 0.0 1873 0.0
A12A Calcium 5234 0.0 10,596 0.0
A12B Potassium 13,428 0.1 26,284 0.1
A12C Other mineral supplements 8747 0.1 21,678 0.1
A14A Anabolic steroids <5 0.0 <5 0.0
A16A Other alimentary tract and metabolism products 12 0.0 52 0.0
B01A Antithrombotic agents 259,606 2.2 1,148,050 3.1
B02A Antifibrinolytics 9410 0.1 18,687 0.1
B02B Vitamin K and other haemostatics 105 0.0 156 0.0
B03A
Iron preparations (NB – an additional 15,391 ferric carboxymaltose issued prescriptions were identified which had no recorded ATC code)
5844 0.0 11,679 0.0
B03B Vitamin B12 and folic acid 60,241 0.5 70,014 0.2
B03X Other anti-anaemic preparations 189 0.0 1096 0.0
B05B Intravenous solutions <5 0.0 <5 0.0
B05X Intravenous solution additives 22 0.0 49 0.0
B06A Other haematological agents 15 0.0 38 0.0
C01A Cardiac glycosides 18,258 0.2 35,018 0.1
C01B Antiarrhythmics, class I and III 11,076 0.1 62,866 0.2
C01C Cardiac stimulants excluding cardiac glycosides 188 0.0 484 0.0
C01D Vasodilators used in cardiac diseases 43,248 0.4 232,587 0.6
C01E Other cardiac preparations 1571 0.0 8301 0.0
C02A Antiadrenergic agents, centrally acting 33,898 0.3 176,868 0.5
C02C Antiadrenergic agents, peripherally acting 18,652 0.2 90,680 0.2
C02D Arteriolar smooth muscle, agents acting on 3505 0.0 9693 0.0
C02K Other antihypertensives 13 0.0 15 0.0
C03A Low-ceiling diuretics, thiazides 11,976 0.1 21,927 0.1
C03B Low-ceiling diuretics, excluding thiazides 20,601 0.2 40,040 0.1
C03C High-ceiling diuretics 95,650 0.8 178,785 0.5
C03D Potassium-sparing agents 24,765 0.2 122,131 0.3
C03X Other diuretics 7 0.0 15 0.0
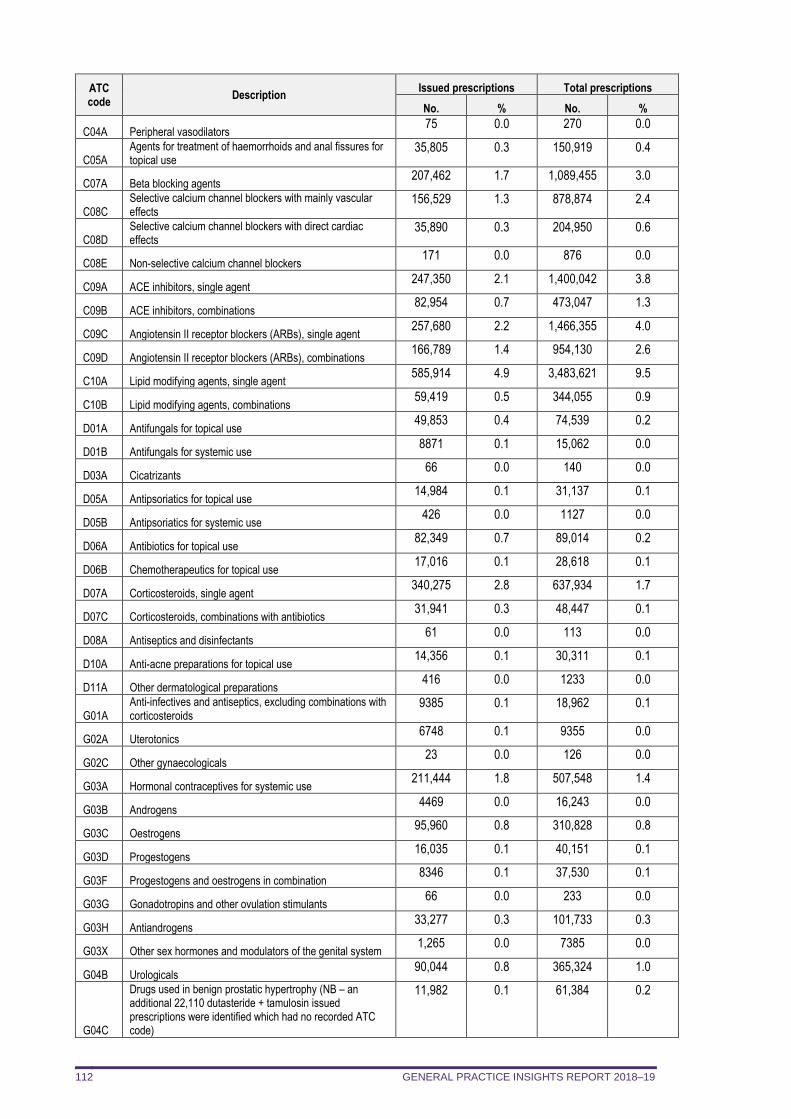
GENERAL PRACTICE INSIGHTS REPORT 2018–19 112
ATC code
Description Issued prescriptions Total prescriptions
No. % No. %
C04A Peripheral vasodilators 75 0.0 270 0.0
C05A Agents for treatment of haemorrhoids and anal fissures for topical use
35,805 0.3 150,919 0.4
C07A Beta blocking agents 207,462 1.7 1,089,455 3.0
C08C Selective calcium channel blockers with mainly vascular effects
156,529 1.3 878,874 2.4
C08D Selective calcium channel blockers with direct cardiac effects
35,890 0.3 204,950 0.6
C08E Non-selective calcium channel blockers 171 0.0 876 0.0
C09A ACE inhibitors, single agent 247,350 2.1 1,400,042 3.8
C09B ACE inhibitors, combinations 82,954 0.7 473,047 1.3
C09C Angiotensin II receptor blockers (ARBs), single agent 257,680 2.2 1,466,355 4.0
C09D Angiotensin II receptor blockers (ARBs), combinations 166,789 1.4 954,130 2.6
C10A Lipid modifying agents, single agent 585,914 4.9 3,483,621 9.5
C10B Lipid modifying agents, combinations 59,419 0.5 344,055 0.9
D01A Antifungals for topical use 49,853 0.4 74,539 0.2
D01B Antifungals for systemic use 8871 0.1 15,062 0.0
D03A Cicatrizants 66 0.0 140 0.0
D05A Antipsoriatics for topical use 14,984 0.1 31,137 0.1
D05B Antipsoriatics for systemic use 426 0.0 1127 0.0
D06A Antibiotics for topical use 82,349 0.7 89,014 0.2
D06B Chemotherapeutics for topical use 17,016 0.1 28,618 0.1
D07A Corticosteroids, single agent 340,275 2.8 637,934 1.7
D07C Corticosteroids, combinations with antibiotics 31,941 0.3 48,447 0.1
D08A Antiseptics and disinfectants 61 0.0 113 0.0
D10A Anti-acne preparations for topical use 14,356 0.1 30,311 0.1
D11A Other dermatological preparations 416 0.0 1233 0.0
G01A Anti-infectives and antiseptics, excluding combinations with corticosteroids
9385 0.1 18,962 0.1
G02A Uterotonics 6748 0.1 9355 0.0
G02C Other gynaecologicals 23 0.0 126 0.0
G03A Hormonal contraceptives for systemic use 211,444 1.8 507,548 1.4
G03B Androgens 4469 0.0 16,243 0.0
G03C Oestrogens 95,960 0.8 310,828 0.8
G03D Progestogens 16,035 0.1 40,151 0.1
G03F Progestogens and oestrogens in combination 8346 0.1 37,530 0.1
G03G Gonadotropins and other ovulation stimulants 66 0.0 233 0.0
G03H Antiandrogens 33,277 0.3 101,733 0.3
G03X Other sex hormones and modulators of the genital system 1,265 0.0 7385 0.0
G04B Urologicals 90,044 0.8 365,324 1.0
G04C
Drugs used in benign prostatic hypertrophy (NB – an additional 22,110 dutasteride + tamulosin issued prescriptions were identified which had no recorded ATC code)
11,982 0.1 61,384 0.2
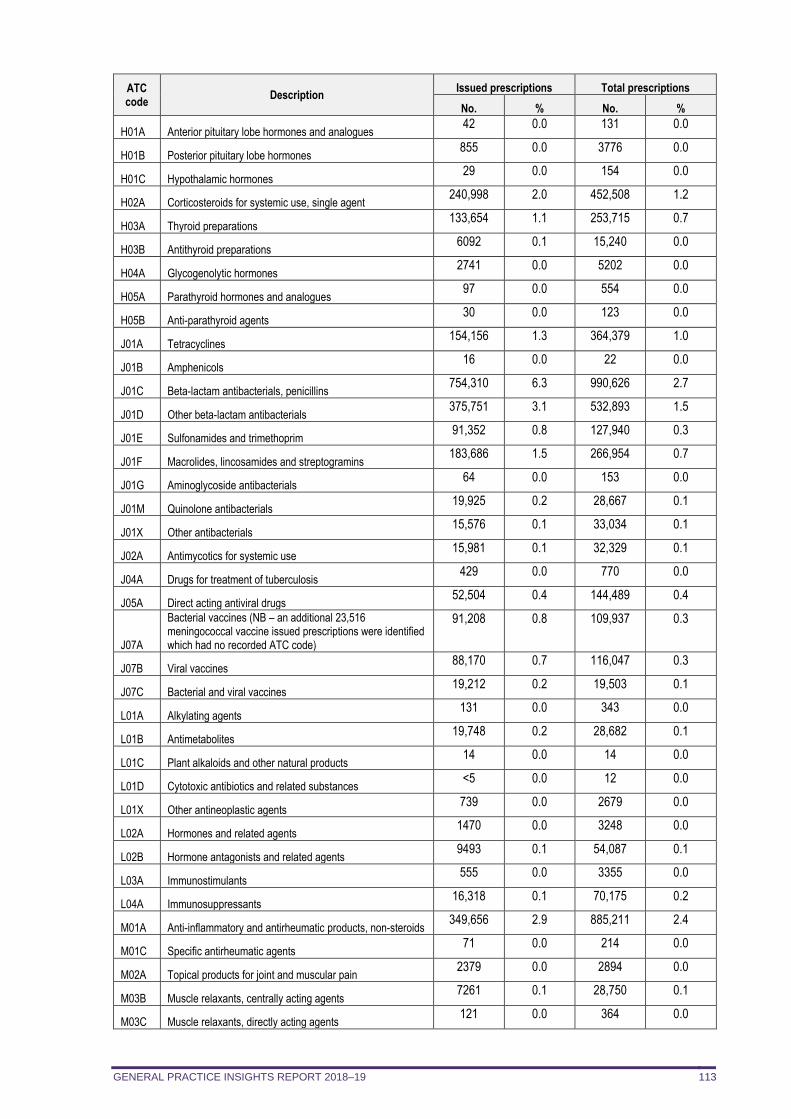
GENERAL PRACTICE INSIGHTS REPORT 2018–19 113
ATC code
Description Issued prescriptions Total prescriptions
No. % No. %
H01A Anterior pituitary lobe hormones and analogues 42 0.0 131 0.0
H01B Posterior pituitary lobe hormones 855 0.0 3776 0.0
H01C Hypothalamic hormones 29 0.0 154 0.0
H02A Corticosteroids for systemic use, single agent 240,998 2.0 452,508 1.2
H03A Thyroid preparations 133,654 1.1 253,715 0.7
H03B Antithyroid preparations 6092 0.1 15,240 0.0
H04A Glycogenolytic hormones 2741 0.0 5202 0.0
H05A Parathyroid hormones and analogues 97 0.0 554 0.0
H05B Anti-parathyroid agents 30 0.0 123 0.0
J01A Tetracyclines 154,156 1.3 364,379 1.0
J01B Amphenicols 16 0.0 22 0.0
J01C Beta-lactam antibacterials, penicillins 754,310 6.3 990,626 2.7
J01D Other beta-lactam antibacterials 375,751 3.1 532,893 1.5
J01E Sulfonamides and trimethoprim 91,352 0.8 127,940 0.3
J01F Macrolides, lincosamides and streptogramins 183,686 1.5 266,954 0.7
J01G Aminoglycoside antibacterials 64 0.0 153 0.0
J01M Quinolone antibacterials 19,925 0.2 28,667 0.1
J01X Other antibacterials 15,576 0.1 33,034 0.1
J02A Antimycotics for systemic use 15,981 0.1 32,329 0.1
J04A Drugs for treatment of tuberculosis 429 0.0 770 0.0
J05A Direct acting antiviral drugs 52,504 0.4 144,489 0.4
J07A
Bacterial vaccines (NB – an additional 23,516 meningococcal vaccine issued prescriptions were identified which had no recorded ATC code)
91,208 0.8 109,937 0.3
J07B Viral vaccines 88,170 0.7 116,047 0.3
J07C Bacterial and viral vaccines 19,212 0.2 19,503 0.1
L01A Alkylating agents 131 0.0 343 0.0
L01B Antimetabolites 19,748 0.2 28,682 0.1
L01C Plant alkaloids and other natural products 14 0.0 14 0.0
L01D Cytotoxic antibiotics and related substances <5 0.0 12 0.0
L01X Other antineoplastic agents 739 0.0 2679 0.0
L02A Hormones and related agents 1470 0.0 3248 0.0
L02B Hormone antagonists and related agents 9493 0.1 54,087 0.1
L03A Immunostimulants 555 0.0 3355 0.0
L04A Immunosuppressants 16,318 0.1 70,175 0.2
M01A Anti-inflammatory and antirheumatic products, non-steroids 349,656 2.9 885,211 2.4
M01C Specific antirheumatic agents 71 0.0 214 0.0
M02A Topical products for joint and muscular pain 2379 0.0 2894 0.0
M03B Muscle relaxants, centrally acting agents 7261 0.1 28,750 0.1
M03C Muscle relaxants, directly acting agents 121 0.0 364 0.0
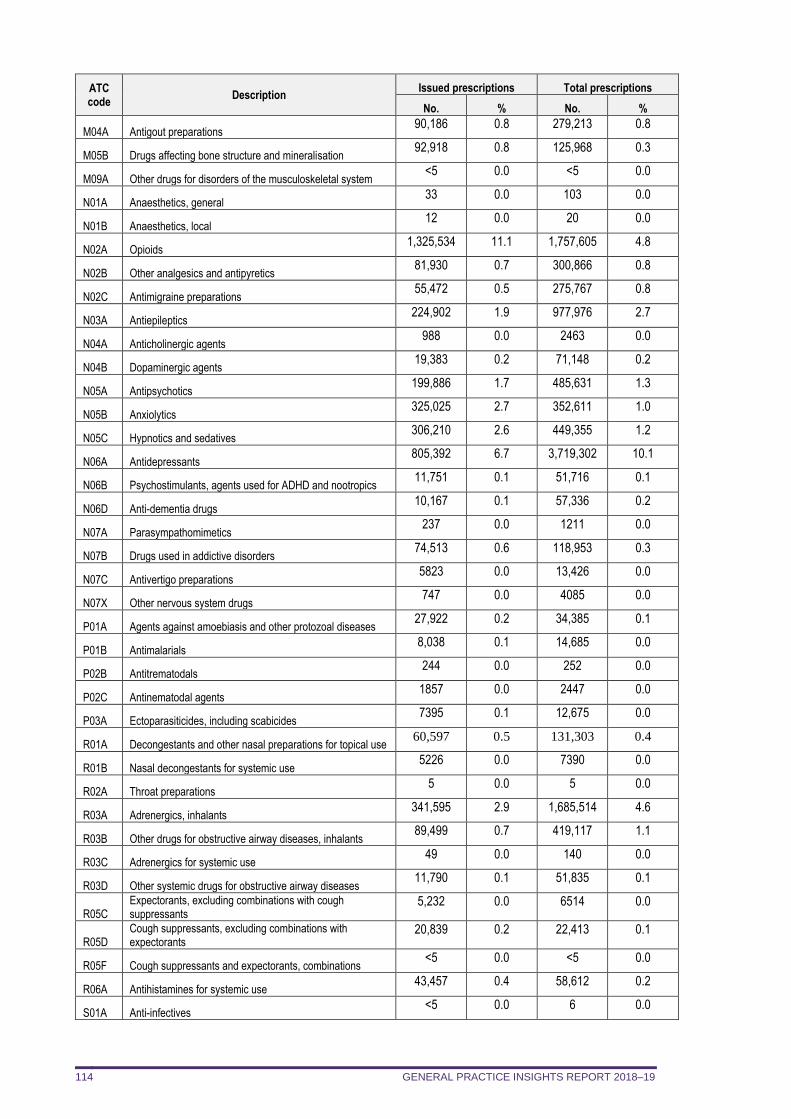
GENERAL PRACTICE INSIGHTS REPORT 2018–19 114
ATC code
Description Issued prescriptions Total prescriptions
No. % No. %
M04A Antigout preparations 90,186 0.8 279,213 0.8
M05B Drugs affecting bone structure and mineralisation 92,918 0.8 125,968 0.3
M09A Other drugs for disorders of the musculoskeletal system <5 0.0 <5 0.0
N01A Anaesthetics, general 33 0.0 103 0.0
N01B Anaesthetics, local 12 0.0 20 0.0
N02A Opioids 1,325,534 11.1 1,757,605 4.8
N02B Other analgesics and antipyretics 81,930 0.7 300,866 0.8
N02C Antimigraine preparations 55,472 0.5 275,767 0.8
N03A Antiepileptics 224,902 1.9 977,976 2.7
N04A Anticholinergic agents 988 0.0 2463 0.0
N04B Dopaminergic agents 19,383 0.2 71,148 0.2
N05A Antipsychotics 199,886 1.7 485,631 1.3
N05B Anxiolytics 325,025 2.7 352,611 1.0
N05C Hypnotics and sedatives 306,210 2.6 449,355 1.2
N06A Antidepressants 805,392 6.7 3,719,302 10.1
N06B Psychostimulants, agents used for ADHD and nootropics 11,751 0.1 51,716 0.1
N06D Anti-dementia drugs 10,167 0.1 57,336 0.2
N07A Parasympathomimetics 237 0.0 1211 0.0
N07B Drugs used in addictive disorders 74,513 0.6 118,953 0.3
N07C Antivertigo preparations 5823 0.0 13,426 0.0
N07X Other nervous system drugs 747 0.0 4085 0.0
P01A Agents against amoebiasis and other protozoal diseases 27,922 0.2 34,385 0.1
P01B Antimalarials 8,038 0.1 14,685 0.0
P02B Antitrematodals 244 0.0 252 0.0
P02C Antinematodal agents 1857 0.0 2447 0.0
P03A Ectoparasiticides, including scabicides 7395 0.1 12,675 0.0
R01A Decongestants and other nasal preparations for topical use 60,597 0.5 131,303 0.4
R01B Nasal decongestants for systemic use 5226 0.0 7390 0.0
R02A Throat preparations 5 0.0 5 0.0
R03A Adrenergics, inhalants 341,595 2.9 1,685,514 4.6
R03B Other drugs for obstructive airway diseases, inhalants 89,499 0.7 419,117 1.1
R03C Adrenergics for systemic use 49 0.0 140 0.0
R03D Other systemic drugs for obstructive airway diseases 11,790 0.1 51,835 0.1
R05C Expectorants, excluding combinations with cough suppressants
5,232 0.0 6514 0.0
R05D Cough suppressants, excluding combinations with expectorants
20,839 0.2 22,413 0.1
R05F Cough suppressants and expectorants, combinations <5 0.0 <5 0.0
R06A Antihistamines for systemic use 43,457 0.4 58,612 0.2
S01A Anti-infectives <5 0.0 6 0.0
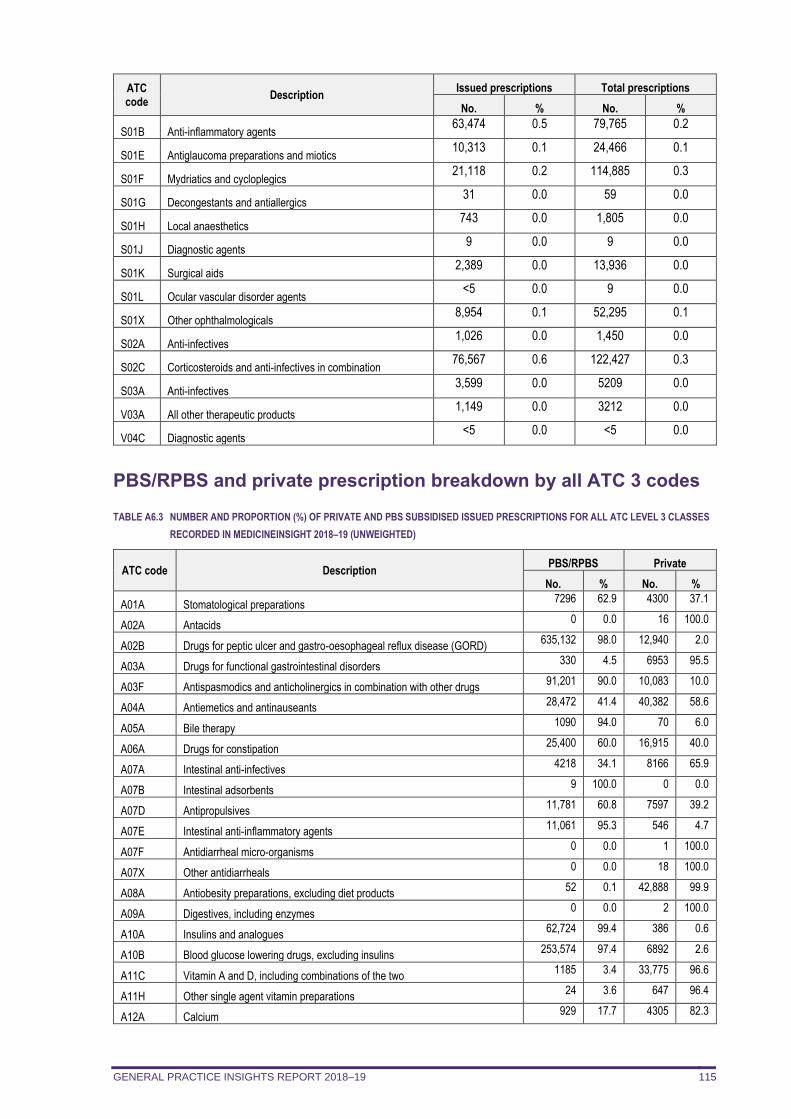
GENERAL PRACTICE INSIGHTS REPORT 2018–19 115
ATC code
Description Issued prescriptions Total prescriptions
No. % No. %
S01B Anti-inflammatory agents 63,474 0.5 79,765 0.2
S01E Antiglaucoma preparations and miotics 10,313 0.1 24,466 0.1
S01F Mydriatics and cycloplegics 21,118 0.2 114,885 0.3
S01G Decongestants and antiallergics 31 0.0 59 0.0
S01H Local anaesthetics 743 0.0 1,805 0.0
S01J Diagnostic agents 9 0.0 9 0.0
S01K Surgical aids 2,389 0.0 13,936 0.0
S01L Ocular vascular disorder agents <5 0.0 9 0.0
S01X Other ophthalmologicals 8,954 0.1 52,295 0.1
S02A Anti-infectives 1,026 0.0 1,450 0.0
S02C Corticosteroids and anti-infectives in combination 76,567 0.6 122,427 0.3
S03A Anti-infectives 3,599 0.0 5209 0.0
V03A All other therapeutic products 1,149 0.0 3212 0.0
V04C Diagnostic agents <5 0.0 <5 0.0
PBS/RPBS and private prescription breakdown by all ATC 3 codes
TABLE A6.3 NUMBER AND PROPORTION (%) OF PRIVATE AND PBS SUBSIDISED ISSUED PRESCRIPTIONS FOR ALL ATC LEVEL 3 CLASSES
RECORDED IN MEDICINEINSIGHT 2018–19 (UNWEIGHTED)
ATC code Description PBS/RPBS Private
No. % No. %
A01A Stomatological preparations 7296 62.9 4300 37.1
A02A Antacids 0 0.0 16 100.0
A02B Drugs for peptic ulcer and gastro-oesophageal reflux disease (GORD) 635,132 98.0 12,940 2.0
A03A Drugs for functional gastrointestinal disorders 330 4.5 6953 95.5
A03F Antispasmodics and anticholinergics in combination with other drugs 91,201 90.0 10,083 10.0
A04A Antiemetics and antinauseants 28,472 41.4 40,382 58.6
A05A Bile therapy 1090 94.0 70 6.0
A06A Drugs for constipation 25,400 60.0 16,915 40.0
A07A Intestinal anti-infectives 4218 34.1 8166 65.9
A07B Intestinal adsorbents 9 100.0 0 0.0
A07D Antipropulsives 11,781 60.8 7597 39.2
A07E Intestinal anti-inflammatory agents 11,061 95.3 546 4.7
A07F Antidiarrheal micro-organisms 0 0.0 1 100.0
A07X Other antidiarrheals 0 0.0 18 100.0
A08A Antiobesity preparations, excluding diet products 52 0.1 42,888 99.9
A09A Digestives, including enzymes 0 0.0 2 100.0
A10A Insulins and analogues 62,724 99.4 386 0.6
A10B Blood glucose lowering drugs, excluding insulins 253,574 97.4 6892 2.6
A11C Vitamin A and D, including combinations of the two 1185 3.4 33,775 96.6
A11H Other single agent vitamin preparations 24 3.6 647 96.4
A12A Calcium 929 17.7 4305 82.3
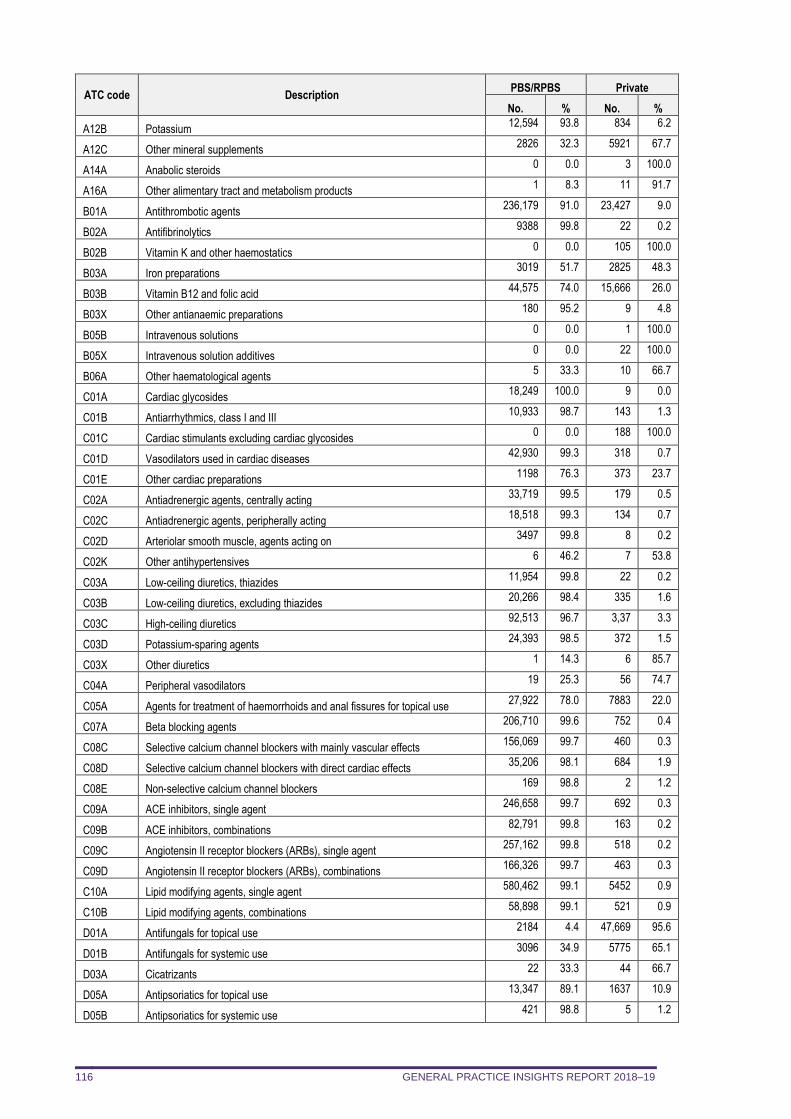
GENERAL PRACTICE INSIGHTS REPORT 2018–19 116
ATC code Description PBS/RPBS Private
No. % No. %
A12B Potassium 12,594 93.8 834 6.2
A12C Other mineral supplements 2826 32.3 5921 67.7
A14A Anabolic steroids 0 0.0 3 100.0
A16A Other alimentary tract and metabolism products 1 8.3 11 91.7
B01A Antithrombotic agents 236,179 91.0 23,427 9.0
B02A Antifibrinolytics 9388 99.8 22 0.2
B02B Vitamin K and other haemostatics 0 0.0 105 100.0
B03A Iron preparations 3019 51.7 2825 48.3
B03B Vitamin B12 and folic acid 44,575 74.0 15,666 26.0
B03X Other antianaemic preparations 180 95.2 9 4.8
B05B Intravenous solutions 0 0.0 1 100.0
B05X Intravenous solution additives 0 0.0 22 100.0
B06A Other haematological agents 5 33.3 10 66.7
C01A Cardiac glycosides 18,249 100.0 9 0.0
C01B Antiarrhythmics, class I and III 10,933 98.7 143 1.3
C01C Cardiac stimulants excluding cardiac glycosides 0 0.0 188 100.0
C01D Vasodilators used in cardiac diseases 42,930 99.3 318 0.7
C01E Other cardiac preparations 1198 76.3 373 23.7
C02A Antiadrenergic agents, centrally acting 33,719 99.5 179 0.5
C02C Antiadrenergic agents, peripherally acting 18,518 99.3 134 0.7
C02D Arteriolar smooth muscle, agents acting on 3497 99.8 8 0.2
C02K Other antihypertensives 6 46.2 7 53.8
C03A Low-ceiling diuretics, thiazides 11,954 99.8 22 0.2
C03B Low-ceiling diuretics, excluding thiazides 20,266 98.4 335 1.6
C03C High-ceiling diuretics 92,513 96.7 3,37 3.3
C03D Potassium-sparing agents 24,393 98.5 372 1.5
C03X Other diuretics 1 14.3 6 85.7
C04A Peripheral vasodilators 19 25.3 56 74.7
C05A Agents for treatment of haemorrhoids and anal fissures for topical use 27,922 78.0 7883 22.0
C07A Beta blocking agents 206,710 99.6 752 0.4
C08C Selective calcium channel blockers with mainly vascular effects 156,069 99.7 460 0.3
C08D Selective calcium channel blockers with direct cardiac effects 35,206 98.1 684 1.9
C08E Non-selective calcium channel blockers 169 98.8 2 1.2
C09A ACE inhibitors, single agent 246,658 99.7 692 0.3
C09B ACE inhibitors, combinations 82,791 99.8 163 0.2
C09C Angiotensin II receptor blockers (ARBs), single agent 257,162 99.8 518 0.2
C09D Angiotensin II receptor blockers (ARBs), combinations 166,326 99.7 463 0.3
C10A Lipid modifying agents, single agent 580,462 99.1 5452 0.9
C10B Lipid modifying agents, combinations 58,898 99.1 521 0.9
D01A Antifungals for topical use 2184 4.4 47,669 95.6
D01B Antifungals for systemic use 3096 34.9 5775 65.1
D03A Cicatrizants 22 33.3 44 66.7
D05A Antipsoriatics for topical use 13,347 89.1 1637 10.9
D05B Antipsoriatics for systemic use 421 98.8 5 1.2
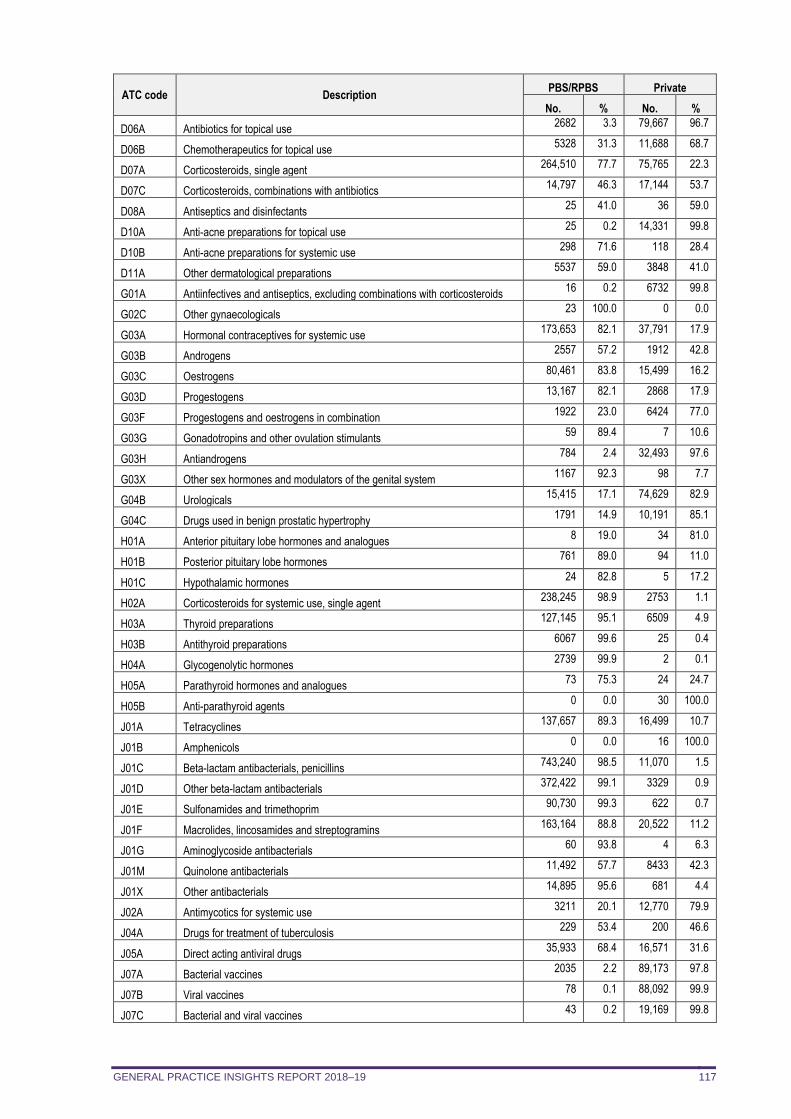
GENERAL PRACTICE INSIGHTS REPORT 2018–19 117
ATC code Description PBS/RPBS Private
No. % No. %
D06A Antibiotics for topical use 2682 3.3 79,667 96.7
D06B Chemotherapeutics for topical use 5328 31.3 11,688 68.7
D07A Corticosteroids, single agent 264,510 77.7 75,765 22.3
D07C Corticosteroids, combinations with antibiotics 14,797 46.3 17,144 53.7
D08A Antiseptics and disinfectants 25 41.0 36 59.0
D10A Anti-acne preparations for topical use 25 0.2 14,331 99.8
D10B Anti-acne preparations for systemic use 298 71.6 118 28.4
D11A Other dermatological preparations 5537 59.0 3848 41.0
G01A Antiinfectives and antiseptics, excluding combinations with corticosteroids 16 0.2 6732 99.8
G02C Other gynaecologicals 23 100.0 0 0.0
G03A Hormonal contraceptives for systemic use 173,653 82.1 37,791 17.9
G03B Androgens 2557 57.2 1912 42.8
G03C Oestrogens 80,461 83.8 15,499 16.2
G03D Progestogens 13,167 82.1 2868 17.9
G03F Progestogens and oestrogens in combination 1922 23.0 6424 77.0
G03G Gonadotropins and other ovulation stimulants 59 89.4 7 10.6
G03H Antiandrogens 784 2.4 32,493 97.6
G03X Other sex hormones and modulators of the genital system 1167 92.3 98 7.7
G04B Urologicals 15,415 17.1 74,629 82.9
G04C Drugs used in benign prostatic hypertrophy 1791 14.9 10,191 85.1
H01A Anterior pituitary lobe hormones and analogues 8 19.0 34 81.0
H01B Posterior pituitary lobe hormones 761 89.0 94 11.0
H01C Hypothalamic hormones 24 82.8 5 17.2
H02A Corticosteroids for systemic use, single agent 238,245 98.9 2753 1.1
H03A Thyroid preparations 127,145 95.1 6509 4.9
H03B Antithyroid preparations 6067 99.6 25 0.4
H04A Glycogenolytic hormones 2739 99.9 2 0.1
H05A Parathyroid hormones and analogues 73 75.3 24 24.7
H05B Anti-parathyroid agents 0 0.0 30 100.0
J01A Tetracyclines 137,657 89.3 16,499 10.7
J01B Amphenicols 0 0.0 16 100.0
J01C Beta-lactam antibacterials, penicillins 743,240 98.5 11,070 1.5
J01D Other beta-lactam antibacterials 372,422 99.1 3329 0.9
J01E Sulfonamides and trimethoprim 90,730 99.3 622 0.7
J01F Macrolides, lincosamides and streptogramins 163,164 88.8 20,522 11.2
J01G Aminoglycoside antibacterials 60 93.8 4 6.3
J01M Quinolone antibacterials 11,492 57.7 8433 42.3
J01X Other antibacterials 14,895 95.6 681 4.4
J02A Antimycotics for systemic use 3211 20.1 12,770 79.9
J04A Drugs for treatment of tuberculosis 229 53.4 200 46.6
J05A Direct acting antiviral drugs 35,933 68.4 16,571 31.6
J07A Bacterial vaccines 2035 2.2 89,173 97.8
J07B Viral vaccines 78 0.1 88,092 99.9
J07C Bacterial and viral vaccines 43 0.2 19,169 99.8
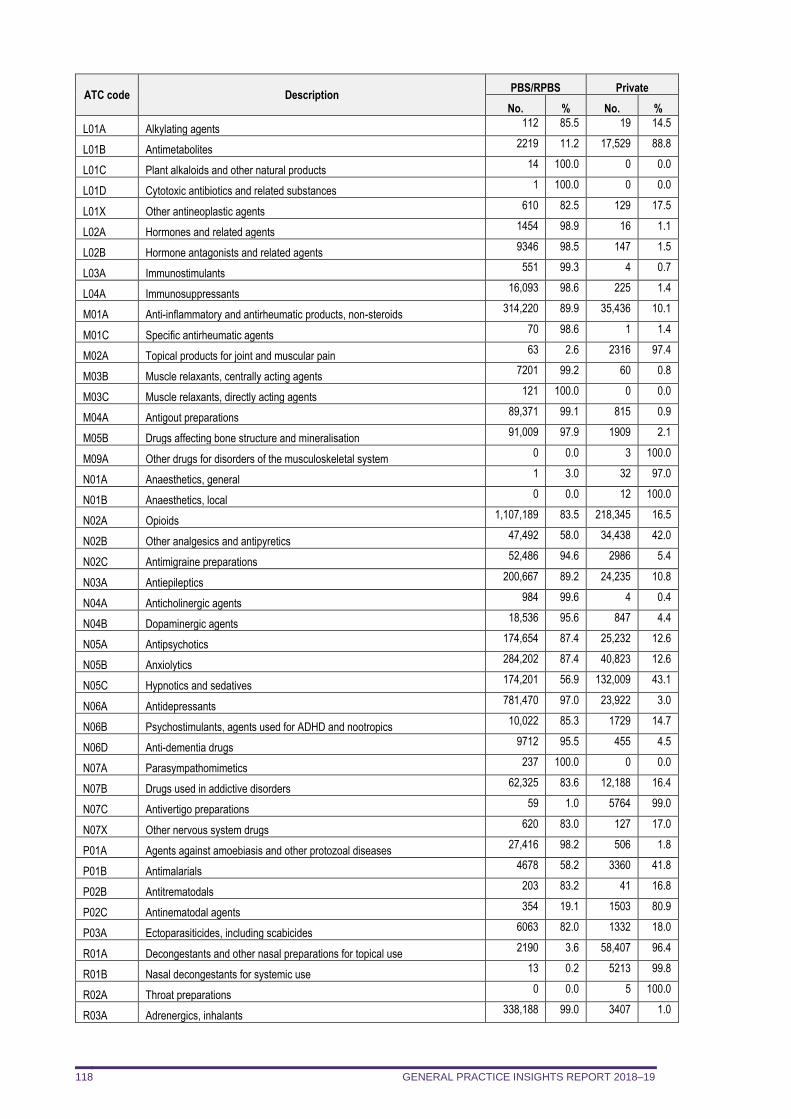
GENERAL PRACTICE INSIGHTS REPORT 2018–19 118
ATC code Description PBS/RPBS Private
No. % No. %
L01A Alkylating agents 112 85.5 19 14.5
L01B Antimetabolites 2219 11.2 17,529 88.8
L01C Plant alkaloids and other natural products 14 100.0 0 0.0
L01D Cytotoxic antibiotics and related substances 1 100.0 0 0.0
L01X Other antineoplastic agents 610 82.5 129 17.5
L02A Hormones and related agents 1454 98.9 16 1.1
L02B Hormone antagonists and related agents 9346 98.5 147 1.5
L03A Immunostimulants 551 99.3 4 0.7
L04A Immunosuppressants 16,093 98.6 225 1.4
M01A Anti-inflammatory and antirheumatic products, non-steroids 314,220 89.9 35,436 10.1
M01C Specific antirheumatic agents 70 98.6 1 1.4
M02A Topical products for joint and muscular pain 63 2.6 2316 97.4
M03B Muscle relaxants, centrally acting agents 7201 99.2 60 0.8
M03C Muscle relaxants, directly acting agents 121 100.0 0 0.0
M04A Antigout preparations 89,371 99.1 815 0.9
M05B Drugs affecting bone structure and mineralisation 91,009 97.9 1909 2.1
M09A Other drugs for disorders of the musculoskeletal system 0 0.0 3 100.0
N01A Anaesthetics, general 1 3.0 32 97.0
N01B Anaesthetics, local 0 0.0 12 100.0
N02A Opioids 1,107,189 83.5 218,345 16.5
N02B Other analgesics and antipyretics 47,492 58.0 34,438 42.0
N02C Antimigraine preparations 52,486 94.6 2986 5.4
N03A Antiepileptics 200,667 89.2 24,235 10.8
N04A Anticholinergic agents 984 99.6 4 0.4
N04B Dopaminergic agents 18,536 95.6 847 4.4
N05A Antipsychotics 174,654 87.4 25,232 12.6
N05B Anxiolytics 284,202 87.4 40,823 12.6
N05C Hypnotics and sedatives 174,201 56.9 132,009 43.1
N06A Antidepressants 781,470 97.0 23,922 3.0
N06B Psychostimulants, agents used for ADHD and nootropics 10,022 85.3 1729 14.7
N06D Anti-dementia drugs 9712 95.5 455 4.5
N07A Parasympathomimetics 237 100.0 0 0.0
N07B Drugs used in addictive disorders 62,325 83.6 12,188 16.4
N07C Antivertigo preparations 59 1.0 5764 99.0
N07X Other nervous system drugs 620 83.0 127 17.0
P01A Agents against amoebiasis and other protozoal diseases 27,416 98.2 506 1.8
P01B Antimalarials 4678 58.2 3360 41.8
P02B Antitrematodals 203 83.2 41 16.8
P02C Antinematodal agents 354 19.1 1503 80.9
P03A Ectoparasiticides, including scabicides 6063 82.0 1332 18.0
R01A Decongestants and other nasal preparations for topical use 2190 3.6 58,407 96.4
R01B Nasal decongestants for systemic use 13 0.2 5213 99.8
R02A Throat preparations 0 0.0 5 100.0
R03A Adrenergics, inhalants 338,188 99.0 3407 1.0
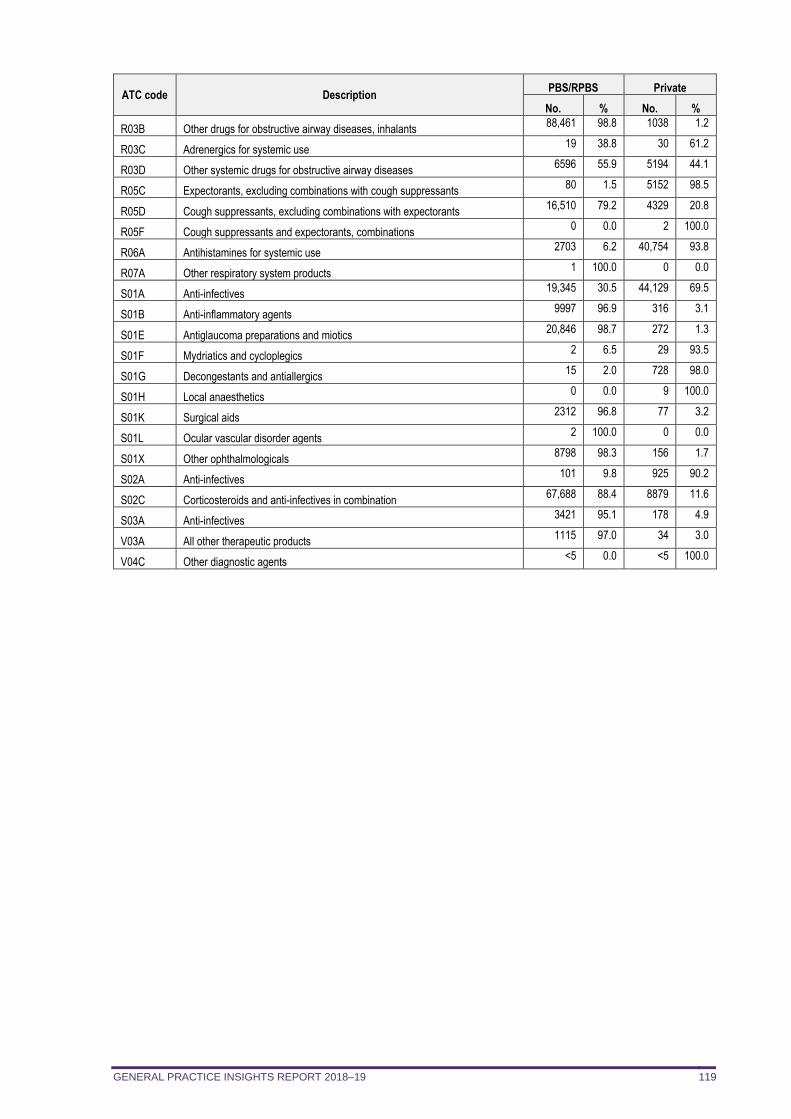
GENERAL PRACTICE INSIGHTS REPORT 2018–19 119
ATC code Description PBS/RPBS Private
No. % No. %
R03B Other drugs for obstructive airway diseases, inhalants 88,461 98.8 1038 1.2
R03C Adrenergics for systemic use 19 38.8 30 61.2
R03D Other systemic drugs for obstructive airway diseases 6596 55.9 5194 44.1
R05C Expectorants, excluding combinations with cough suppressants 80 1.5 5152 98.5
R05D Cough suppressants, excluding combinations with expectorants 16,510 79.2 4329 20.8
R05F Cough suppressants and expectorants, combinations 0 0.0 2 100.0
R06A Antihistamines for systemic use 2703 6.2 40,754 93.8
R07A Other respiratory system products 1 100.0 0 0.0
S01A Anti-infectives 19,345 30.5 44,129 69.5
S01B Anti-inflammatory agents 9997 96.9 316 3.1
S01E Antiglaucoma preparations and miotics 20,846 98.7 272 1.3
S01F Mydriatics and cycloplegics 2 6.5 29 93.5
S01G Decongestants and antiallergics 15 2.0 728 98.0
S01H Local anaesthetics 0 0.0 9 100.0
S01K Surgical aids 2312 96.8 77 3.2
S01L Ocular vascular disorder agents 2 100.0 0 0.0
S01X Other ophthalmologicals 8798 98.3 156 1.7
S02A Anti-infectives 101 9.8 925 90.2
S02C Corticosteroids and anti-infectives in combination 67,688 88.4 8879 11.6
S03A Anti-infectives 3421 95.1 178 4.9
V03A All other therapeutic products 1115 97.0 34 3.0
V04C Other diagnostic agents <5 0.0 <5 100.0
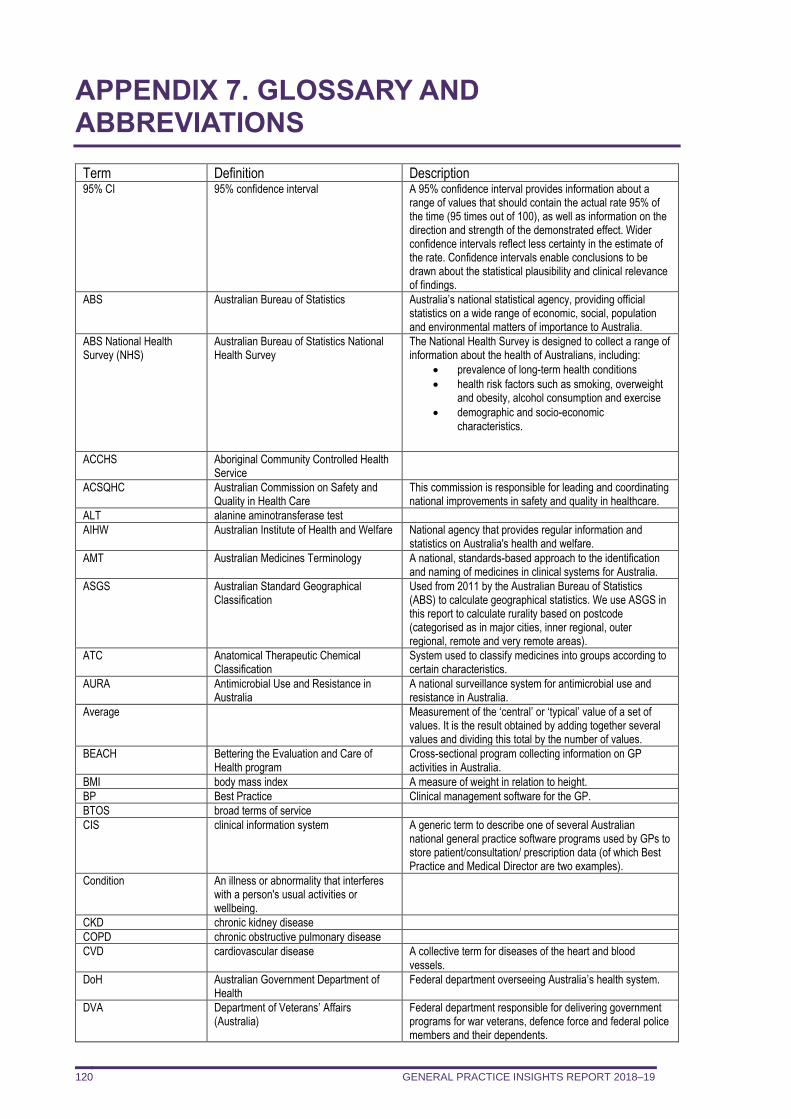
GENERAL PRACTICE INSIGHTS REPORT 2018–19 120
APPENDIX 7. GLOSSARY AND ABBREVIATIONS
Term Definition Description 95% CI 95% confidence interval A 95% confidence interval provides information about a
range of values that should contain the actual rate 95% of the time (95 times out of 100), as well as information on the direction and strength of the demonstrated effect. Wider confidence intervals reflect less certainty in the estimate of the rate. Confidence intervals enable conclusions to be drawn about the statistical plausibility and clinical relevance of findings.
ABS Australian Bureau of Statistics Australia’s national statistical agency, providing official statistics on a wide range of economic, social, population and environmental matters of importance to Australia.
ABS National Health Survey (NHS)
Australian Bureau of Statistics National Health Survey
The National Health Survey is designed to collect a range of information about the health of Australians, including:
• prevalence of long-term health conditions
• health risk factors such as smoking, overweight and obesity, alcohol consumption and exercise
• demographic and socio-economic characteristics.
ACCHS Aboriginal Community Controlled Health Service
ACSQHC Australian Commission on Safety and Quality in Health Care
This commission is responsible for leading and coordinating national improvements in safety and quality in healthcare.
ALT alanine aminotransferase test
AIHW Australian Institute of Health and Welfare National agency that provides regular information and statistics on Australia's health and welfare.
AMT Australian Medicines Terminology A national, standards-based approach to the identification and naming of medicines in clinical systems for Australia.
ASGS Australian Standard Geographical Classification
Used from 2011 by the Australian Bureau of Statistics (ABS) to calculate geographical statistics. We use ASGS in this report to calculate rurality based on postcode (categorised as in major cities, inner regional, outer regional, remote and very remote areas).
ATC Anatomical Therapeutic Chemical Classification
System used to classify medicines into groups according to certain characteristics.
AURA Antimicrobial Use and Resistance in Australia
A national surveillance system for antimicrobial use and resistance in Australia.
Average Measurement of the ‘central’ or ‘typical’ value of a set of values. It is the result obtained by adding together several values and dividing this total by the number of values.
BEACH Bettering the Evaluation and Care of Health program
Cross-sectional program collecting information on GP activities in Australia.
BMI body mass index A measure of weight in relation to height.
BP Best Practice Clinical management software for the GP.
BTOS broad terms of service
CIS clinical information system A generic term to describe one of several Australian national general practice software programs used by GPs to store patient/consultation/ prescription data (of which Best Practice and Medical Director are two examples).
Condition An illness or abnormality that interferes with a person's usual activities or wellbeing.
CKD chronic kidney disease
COPD chronic obstructive pulmonary disease
CVD cardiovascular disease A collective term for diseases of the heart and blood vessels.
DoH Australian Government Department of Health
Federal department overseeing Australia’s health system.
DVA Department of Veterans’ Affairs (Australia)
Federal department responsible for delivering government programs for war veterans, defence force and federal police members and their dependents.
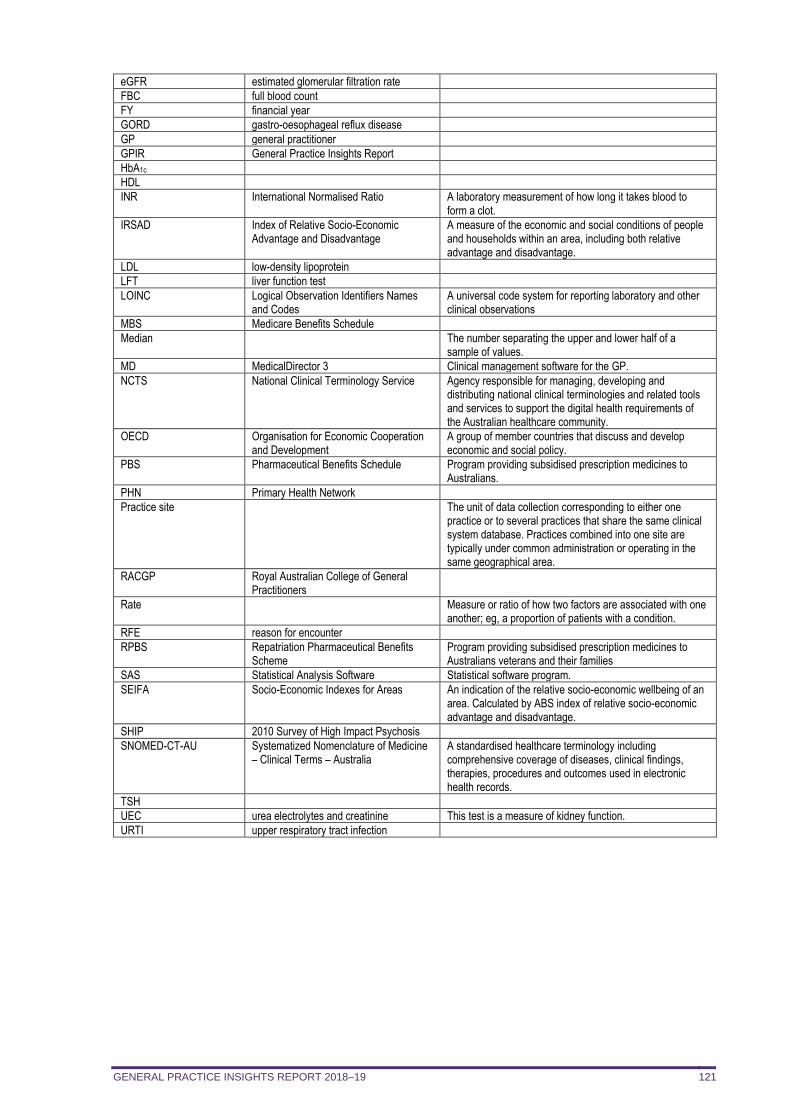
GENERAL PRACTICE INSIGHTS REPORT 2018–19 121
eGFR estimated glomerular filtration rate
FBC full blood count
FY financial year
GORD gastro-oesophageal reflux disease
GP general practitioner
GPIR General Practice Insights Report
HbA1c
HDL
INR International Normalised Ratio A laboratory measurement of how long it takes blood to form a clot.
IRSAD Index of Relative Socio-Economic Advantage and Disadvantage
A measure of the economic and social conditions of people and households within an area, including both relative advantage and disadvantage.
LDL low-density lipoprotein
LFT liver function test
LOINC Logical Observation Identifiers Names and Codes
A universal code system for reporting laboratory and other clinical observations
MBS Medicare Benefits Schedule
Median The number separating the upper and lower half of a sample of values.
MD MedicalDirector 3 Clinical management software for the GP.
NCTS National Clinical Terminology Service Agency responsible for managing, developing and distributing national clinical terminologies and related tools and services to support the digital health requirements of the Australian healthcare community.
OECD Organisation for Economic Cooperation and Development
A group of member countries that discuss and develop economic and social policy.
PBS Pharmaceutical Benefits Schedule Program providing subsidised prescription medicines to Australians.
PHN Primary Health Network
Practice site The unit of data collection corresponding to either one practice or to several practices that share the same clinical system database. Practices combined into one site are typically under common administration or operating in the same geographical area.
RACGP Royal Australian College of General Practitioners
Rate Measure or ratio of how two factors are associated with one another; eg, a proportion of patients with a condition.
RFE reason for encounter
RPBS Repatriation Pharmaceutical Benefits Scheme
Program providing subsidised prescription medicines to Australians veterans and their families
SAS Statistical Analysis Software Statistical software program.
SEIFA Socio-Economic Indexes for Areas An indication of the relative socio-economic wellbeing of an area. Calculated by ABS index of relative socio-economic advantage and disadvantage.
SHIP 2010 Survey of High Impact Psychosis
SNOMED-CT-AU Systematized Nomenclature of Medicine – Clinical Terms – Australia
A standardised healthcare terminology including comprehensive coverage of diseases, clinical findings, therapies, procedures and outcomes used in electronic health records.
TSH
UEC urea electrolytes and creatinine This test is a measure of kidney function.
URTI upper respiratory tract infection