medium-term coal market report 2013 · market report 2013 coal market trends and projections to...
TRANSCRIPT

Medium-Term Market Report 2013
COAL
Market Trends and Projections to 2018
Please note that this PDF is subject to specific restrictions that limit its use and distribution. The terms and conditions are available online at http://www.iea.org/termsandconditionsuseandcopyright/
© O
EC
D/IE
A, 2
013

© O
EC
D/IE
A, 2
013

Market Trends and Projections to 2018
Medium-Term Market Report 2013
COAL©
OE
CD
/IEA
, 201
3

INTERNATIONAL ENERGY AGENCY
The International Energy Agency (IEA), an autonomous agency, was established in November 1974. Its primary mandate was – and is – two-fold: to promote energy security amongst its member
countries through collective response to physical disruptions in oil supply, and provide authoritative research and analysis on ways to ensure reliable, affordable and clean energy for its 28 member countries and beyond. The IEA carries out a comprehensive programme of energy co-operation among its member countries, each of which is obliged to hold oil stocks equivalent to 90 days of its net imports. The Agency’s aims include the following objectives:
n Secure member countries’ access to reliable and ample supplies of all forms of energy; in particular, through maintaining effective emergency response capabilities in case of oil supply disruptions.
n Promote sustainable energy policies that spur economic growth and environmental protection in a global context – particularly in terms of reducing greenhouse-gas emissions that contribute to climate change.
n Improve transparency of international markets through collection and analysis of energy data.
n Support global collaboration on energy technology to secure future energy supplies and mitigate their environmental impact, including through improved energy
efficiency and development and deployment of low-carbon technologies.
n Find solutions to global energy challenges through engagement and dialogue with non-member countries, industry, international
organisations and other stakeholders.IEA member countries:
Australia Austria
Belgium Canada
Czech RepublicDenmark
FinlandFrance
GermanyGreece
HungaryIreland
ItalyJapan
Korea (Republic of)LuxembourgNetherlandsNew Zealand NorwayPolandPortugalSlovak RepublicSpainSwedenSwitzerlandTurkeyUnited Kingdom
United States
The European Commission also participates in
the work of the IEA.
Please note that this publication is subject to specific restrictions that limit its use and distribution.
The terms and conditions are available online at http://www.iea.org/termsandconditionsuseandcopyright/
© OECD/IEA, 2013International Energy Agency
9 rue de la Fédération 75739 Paris Cedex 15, France
www.iea.org
40Years_Page02_2013_20x27_Q.indd 1 03/10/2013 09:47:39
© O
EC
D/IE
A, 2
013

FOREWORD
MEDIUM-TERM COAL MARKET REPORT 2013 3
FOREWORD There is no denying the controversial reality of coal and its dominance in power generation worldwide. No fuel draws the same ire, particularly for its polluting qualities both locally and in terms of greenhouse gas emissions. And yet no fuel is as responsible for powering the economic growth that has pulled billions out of poverty in the past decades. As we look towards the long term we must ask what role coal has to play in the energy mix that we want to achieve – because there will be a role. But without mitigating the polluting effects of coal, pursuing business as usual will have enormous and tragic consequences. Coal is abundant and geopolitically secure, and coal-fired plants are easily integrated into existing power systems. Modern plants are also flexible, providing affordable, base-load power while backing up variable renewable generation. If coal-fired plants are well-designed and well-operated, emissions of local pollutants can be minimised. The ability to switch relatively quickly between coal and gas also reinforces gas security. With advantages like these, it is easy to see why coal demand continues to grow at a relentless rate: in this report, we project the use of coal to rise by 2.3% per year on average until 2018. The bulk of this increase will come from China, as has been the case for the last decade. But it is important to emphasise that coal in its current form is simply unsustainable. Coal-fired heat and power generation is the biggest single source of carbon dioxide (CO2) emissions resulting from fuel combustion today. More than three-fifths of the rise in global CO2 emissions since 2000 is due to the burning of coal to produce electricity and heat. And we should not overlook the health problems tied to local pollution produced by coal combustion. There are solutions to both the issues of local pollution and CO2 emissions. Underground coal gasification is a form of clean coal technology that mainly addresses the former. Some major countries have recently announced policies to encourage the construction and use of highly efficient coal-fired power plants and to promote carbon capture and storage (CCS). We welcome these efforts as part of the broader push to reduce the environmental impact of coal. Yet if nothing more than those emissions-reduction policy commitments and pledges announced to date are implemented, we project that the long-term increase in global temperatures will reach 4 degrees Celsius (°C). This would exceed the globally agreed target of limiting the long-term rise in temperatures to 2°C and would lead to a devastating and costly change in climate, the first signs of which we are already seeing today. Radical action is needed to curb greenhouse gas emissions, yet that radical action is disappointingly absent. Progress on CCS is effectively stalled, and a meaningful carbon price is missing. Moreover, even though we’ve known how to build efficient, super-critical coal-fired power plants since the 1960s, most of the coal plants built since then – and a large proportion of the ones being developed today – are of the inefficient, sub-critical kind. If these sub-critical plants under development in India and in ASEAN states (including Indonesia) were completed with the latest technology, it would save as much CO2 as will be saved by all the wind turbines in Europe.
© O
EC
D/IE
A, 2
013

FOREWORD
4 MEDIUM-TERM COAL MARKET REPORT 2013
When it comes to a sustainable energy profile, we are simply off track – and coal in its current form is the prime culprit. Yet with coal set to remain an integral part of our energy mix for decades to come, the challenge is to make it cleaner. This report is produced under my authority as executive director of the IEA. Maria van der Hoeven Executive Director International Energy Agency
© O
EC
D/IE
A, 2
013

ACKNOWLEDGEMENTS
MEDIUM-TERM COAL MARKET REPORT 2013 5
ACKNOWLEDGEMENTS The Medium-Term Coal Market Report 2013 was prepared by the Gas, Coal and Power Division (GCP) of the International Energy Agency (IEA), headed by László Varró. The report was managed and co-ordinated by Carlos Fernández Alvarez. Harald Hecking, Timo Panke and Carlos Fernández Alvarez are the authors. Keisuke Sadamori, Director of the IEA Energy Markets and Security (EMS) Directorate, provided expert guidance and advice. We are grateful for the data provided by the IEA Energy Data Centre (EDC). Julian Smith’s assistance in aggregating and making the data user-friendly was invaluable. Many colleagues from the IEA provided us with important advice and input: Anne-Sophie Corbeau, Ian Cronshaw, Keith Burnard, Pawel Olejarnik, Johannes Trüby, Rodrigo Pinto Scholtbach, Michael Waldron, Dagmar Graczyk, Kevin Tu and Florian Kitt. Romy de Courtay edited the report. The IEA Communication and Information Office (CIO) also provided editorial and production guidance. Rebecca Gaghen, Greg Frost, Phillip Cornell, Muriel Custodio, Cheryl Haines, Angela Gosmann, Astrid Dumond and Bertrand Sadin made this publication possible. Dennis Volk authored the Box “Water in China: Growing needs, bigger issue”. Thijs van Hittersum authored the Box “Does coal price follow oil and gas prices?”. Our gratitude goes to the Institute of Energy Economics (EWI) at the University of Cologne for sharing its breadth of coal expertise and coal market models. Essential inputs were obtained at the joint CIAB/IEA workshops held 25-26 April on energy modelling and supply costs with Wood MacKenzie, represented by Ricardo Monte Alto, Andy Roberts, Jeff Watkins and Stephen O’Rourke. The IEA would like to thank the Coal Industry Advisory Board (CIAB) for their support. A special thanks goes to the many CIAB associates and analysts who provided the IEA with timely data, information and advice. Fernando Zancan from the Brazilian Coal Association, Mick Buffier, from Glencore, Alex Zapantis from Rio Tinto plc, Maggi Rademacher from E.On Kraftwerke GmbH, Hans-Wilhelm Schiffer from RWE AG, Roland Luebke from the German Coal Association, Lu Bin from Shenhua Group Corporation Ltd., Gatut Adisoma from the Indonesian Mining Coal Association, Masato Uchiyama from J-Power, Sergey Tverdokhleb from the Siberian Coal Energy Company (SUEK), Gina Downes from Eskom, Peter Schmitz, Julian Beere and Nikki Fisher from Anglo Operations Ltd., Gueorgui Pirinski from BHP Billiton Ltd., Rick Axthelm from Alpha Natural Resources Inc., Cartan Sumner and Jacob Williams from Peabody Energy Co. Inc., and J. Gordon Stephens from Joy Global Inc., as well as Brian Heath, Executive Co-ordinator of the CIAB. Comments and questions are welcome. Please address to: Carlos Fernández Alvarez ([email protected])
© O
EC
D/IE
A, 2
013

TABLE OF CONTENTS
6 MEDIUM-TERM COAL MARKET REPORT 2013
TABLE OF CONTENTS
Foreword ..................................................................................................................................... 3
Acknowledgements ...................................................................................................................... 5
Executive Summary .................................................................................................................... 11
1. Recent Trends in Demand and Supply ..................................................................................... 14
Summary ............................................................................................................................................... 14
Demand ................................................................................................................................................. 14 OECD demand trends ........................................................................................................................ 15 Regional focus: United States............................................................................................................ 19 Non-OECD demand trends ................................................................................................................ 21 Regional focus: India ......................................................................................................................... 24
Supply .................................................................................................................................................... 26 OECD supply trends ........................................................................................................................... 27 Non-OECD supply trends ................................................................................................................... 28 Special focus: coal supply in India ..................................................................................................... 29 Special focus: met coal in Russia ....................................................................................................... 34
References ............................................................................................................................................. 36
2. Recent Trends in International Coal Trading ............................................................................ 38
Summary ............................................................................................................................................... 38
The seaborne hard coal market ............................................................................................................ 38 Seaborne thermal coal trade ............................................................................................................. 38 Seaborne met coal trade ................................................................................................................... 40
Regional analysis ................................................................................................................................... 41 Exporters ........................................................................................................................................... 41 Importers ........................................................................................................................................... 45 Special focus: coal transportation in Russia ...................................................................................... 48
Coal trading ........................................................................................................................................... 51 Regional analysis ............................................................................................................................... 52 Derivatives ......................................................................................................................................... 53
Prices ..................................................................................................................................................... 53 Seaborne thermal coal prices and regional arbitrage ....................................................................... 55 Seaborne met coal prices .................................................................................................................. 63 Coal forward prices ........................................................................................................................... 63
Coal supply costs ................................................................................................................................... 66 Development of input factor prices .................................................................................................. 66 Currency exchange rates ................................................................................................................... 69 Dry bulk shipping market .................................................................................................................. 70 Development of coal supply costs ..................................................................................................... 72 References ......................................................................................................................................... 74
© O
EC
D/IE
A, 2
013

TABLE OF CONTENTS
MEDIUM-TERM COAL MARKET REPORT 2013 7
3. Medium-Term Projections of Demand and Supply ................................................................... 76 Summary ............................................................................................................................................... 76 Introduction ........................................................................................................................................... 76 Assumptions .......................................................................................................................................... 77 Projections of global coal demand in the BCS ....................................................................................... 79
OECD coal demand projection, 2013-18 ........................................................................................... 79 Non-OECD coal demand projection, 2013-18 ................................................................................... 81
Projections of global coal demand in alternative scenarios (CLDC and IHDC) ...................................... 89 Projections of global coal demand in the CLDC, 2013-18 ................................................................. 89 Projections of global coal demand in the IHDC, 2013-18 .................................................................. 90
Projections of global coal supply ........................................................................................................... 90 Thermal coal and lignite supply projection, 2013-18 ........................................................................ 90 Met coal supply projection, 2013-18 ................................................................................................ 91
References ............................................................................................................................................. 94
4. Medium-Term Projections of Seaborne Coal Trade .................................................................. 95 Summary ............................................................................................................................................... 95 Assumptions and methodology............................................................................................................. 95 Seaborne trade in the BCS ..................................................................................................................... 96
Seaborne thermal coal trade projection, 2013-18 ............................................................................ 97 Seaborne met coal trade projection, 2013-18 ................................................................................ 100
Seaborne thermal coal trade projections in alternative scenarios, 2013-18 ...................................... 103 The CLDC.......................................................................................................................................... 103 The IHDC .......................................................................................................................................... 105
References ........................................................................................................................................... 107
5. Export Capacity Investment Outlook ...................................................................................... 108 Summary ............................................................................................................................................. 108 Investment in export mining capacity ................................................................................................. 108 Investment in export infrastructure capacity ..................................................................................... 111 Regional analysis ................................................................................................................................. 111
Australia .......................................................................................................................................... 111 Colombia ......................................................................................................................................... 113 South Africa ..................................................................................................................................... 114 Mozambique ................................................................................................................................... 115 Russia ............................................................................................................................................... 116 Indonesia ......................................................................................................................................... 116 Canada ............................................................................................................................................. 117 United States ................................................................................................................................... 118
References ........................................................................................................................................... 121
Annex ....................................................................................................................................... 122
Glossary .................................................................................................................................... 134 Regional and country groupings .......................................................................................................... 134 Acronyms, abbreviations, currency codes and units of measure ....................................................... 135
© O
EC
D/IE
A, 2
013

TABLE OF CONTENTS
8 MEDIUM-TERM COAL MARKET REPORT 2013
LIST OF FIGURES
Figure 1.1 Coal-based gross power generation in the OECD: absolute changes, 2011-12 ................ 18 Figure 1.2 Monthly year-on-year differences in crude steel production in OECD member countries, 2011-13 ............................................................................................................................. 18 Figure 1.3 Development of power generation by fuel and natural gas prices, 2011-13 ................... 19 Figure 1.4 Coal transports from US mining regions to power plants in 2011-12 ............................... 21 Figure 1.5 Number of years needed for other countries to consume China’s 2012 coal consumption .. 22 Figure 1.6 Evolution of coal-based electricity generation in non-OECD countries ............................ 23 Figure 1.7 Quarterly year-on-year differences in steel production in non-OECD countries, 2011-13 ... 23 Figure 1.8 Indian coal demand overview ........................................................................................... 24 Figure 1.9 Actual versus targeted generation capacity additions in India ......................................... 25 Figure 1.10 Development of DRI production in India, 2000-11 ........................................................... 26 Figure 1.11 Indicative breakdown of coking coal export costs (free-on-board) for Siberian production .. 36 Figure 2.1 Development of the seaborne hard coal market, 2000-12 ............................................... 39 Figure 2.2 Trade flows in the seaborne steam coal market, 2012 ..................................................... 39 Figure 2.3 Trade flows in the seaborne met coal market, 2012 ........................................................ 40 Figure 2.4 Development of Indonesian export destinations, 2000-12 .............................................. 41 Figure 2.5 Destinations of United States (US) coal exports, 2002-12 (left) and ports of US coal exports, 2002-12 (right)................................................................................................................... 43 Figure 2.6 Development of South African export destinations, 2003-12 .......................................... 44 Figure 2.7 Development of Indian import sources, 2000-12 ............................................................. 47 Figure 2.8 Development of railed coal volumes in Russia, 2006-12 .................................................. 49 Figure 2.9 Development of the number of railcars and productivity in Russia ................................. 50 Figure 2.10 Development of rental fees of railcars in Russia ............................................................... 50 Figure 2.11 Development of Russian Railways transport tariffs for select commodities, 2005-13 ..... 50 Figure 2.12 Indicative coal transport costs in Russia by component and distance ............................. 51 Figure 2.13 Distance-dependent transport costs in Russia .................................................................. 51 Figure 2.14 Development of trade volumes for coal derivatives, 2000-12.......................................... 53 Figure 2.15 Development of coal marker prices for different types of coal, 2011-13 ......................... 55 Figure 2.16 Thermal coal price markers in Europe and Asia, 2011-13 ................................................ 56 Figure 2.17 Development of Colombian and South African exports to Europe and European prices ... 56 Figure 2.18 South China marker prices (CFR) and Chinese imports from Colombia ............................ 57 Figure 2.19 Richards Bay and Newcastle marker prices (FOB), 2012-13 ............................................. 57 Figure 2.20 Marker prices of different coal qualities in South China (left, CFR) and Australia/Indonesia (right, FOB) standardised to an energy content of 6 000 kcal/kg, 2012-13 ...................... 58 Figure 2.21 Price time series for API2 coal, TTF gas and Brent oil ....................................................... 59 Figure 2.22 252-day rolling correlations of coal with gas and oil ........................................................ 60 Figure 2.23 252-day rolling correlations based on year-ahead forwards ............................................ 62 Figure 2.24 Development of met coal prices and monthly year-on-year differences in BFI production, 2011-13 ............................................................................................................................. 63 Figure 2.25 Forward curves of API2 and API4, 2012-13 ....................................................................... 64 Figure 2.26 International coal and stock prices of coal exporter Adaro .............................................. 65 Figure 2.27 Development of revenues and operational margin of three large mining companies ..... 65 Figure 2.28 Indexed price development of select commodities used in coal mining .......................... 67 Figure 2.29 Indexed labour cost development (in local currency) in select countries ........................ 67 Figure 2.30 Australian steam coal supply cost curves, export volumes and price levels, 2012 .......... 68
© O
EC
D/IE
A, 2
013

TABLE OF CONTENTS
MEDIUM-TERM COAL MARKET REPORT 2013 9
Figure 2.31 Indexed development of the USD against select currencies ............................................ 69 Figure 2.32 FOB steam coal prices in USD and local currency (left: Newcastle, right: Richards Bay) ..... 70 Figure 2.33 Seaborne bulk trade, 2003-12 ........................................................................................... 71 Figure 2.34 Development of the bulk carrier fleet, 2006-15 ............................................................... 71 Figure 2.35 Development of selected freight rates, 2002-13 .............................................................. 71 Figure 2.36 Indicative steam coal supply costs to northwest Europe by supply chain component and by country, 2009-12 ................................................................................................... 72 Figure 2.37 Indicative met coal FOB cost curve and FOB price levels, 2012 ........................................ 74 Figure 3.1 Regional (real) steam coal price assumptions, 2012-18, delivered to the power plant ... 78 Figure 3.2 Projection of thermal coal and lignite demand for OECD member countries .................. 80 Figure 3.3 Projection of met coal demand for OECD member countries .......................................... 81 Figure 3.4 Projection of thermal coal and lignite demand for non-OECD economies ....................... 82 Figure 3.5 Uncertainties of Chinese coal demand until 2018 ............................................................ 83 Figure 3.6 Projection of met coal demand for non-OECD economies ............................................... 87 Figure 3.7 Coal consumption of OECD member countries versus non-OECD countries, 1980-2018 ...... 88 Figure 3.8 Per-capita coal consumption of OECD member countries versus non-OECD countries, 1980-2018 ......................................................................................................................... 88 Figure 3.9 Per-capita coal consumption in power generation, 2011 ................................................. 88 Figure 3.10 Projection of Chinese and rest of world (ROW) coal demand in the BCS and CLDC ......... 89 Figure 3.11 Projection of thermal coal and lignite supply ................................................................... 91 Figure 3.12 Projection of met coal supply............................................................................................ 94 Figure 3.13 Crude steel production overview ...................................................................................... 92 Figure 4.1 Development of international seaborne hard coal trade in the BCS, CLDC and Indian High-Demand Case (IHDC) ............................................................................... 96 Figure 4.2 Seaborne thermal coal imports in the BCS ....................................................................... 98 Figure 4.3 Seaborne thermal coal exports in the BCS ...................................................................... 100 Figure 4.4 Seaborne met coal imports in the BCS ............................................................................ 101 Figure 4.5 Seaborne met coal exports in the BCS ............................................................................ 102 Figure 4.6 Differences in seaborne thermal coal trade between the BCS and CLDC ....................... 104 Figure 4.7 Differences in seaborne thermal coal trade between the BCS and IHDC ....................... 105 Figure 5.1 Cumulative probable expansion of hard coal export mining capacity, 2013-18............. 109 Figure 5.2 Cumulative probable and potential expansion of hard coal export mining capacity, 2013-18 ... 109 Figure 5.3 Projected cumulative additions to coal terminal capacity, 2013-18 .............................. 111 Figure 5.4 Short-term global FOB supply cost curve ........................................................................ 120 Figure 5.5 Indicative long-term global mine-mouth supply cost curve ........................................... 120
LIST OF MAPS
Map 1.1 Regional distribution of India’s coal reserves and production .............................................. 30 Map 3.1 Water resource scarcity in China in 2012 and 2018 .............................................................. 85
LIST OF TABLES
Table 1.1 Coal demand overview ....................................................................................................... 15 Table 1.2 Hard coal and brown coal consumption in select OECD member countries (Mt) ............. 16 Table 1.3 Retirements of US coal-fired power plants by state, 2009-12 (megawatt [MW]) ............. 20 Table 1.4 Coal supply overview .......................................................................................................... 27
© O
EC
D/IE
A, 2
013

TABLE OF CONTENTS
10 MEDIUM-TERM COAL MARKET REPORT 2013
Table 1.5 Hard coal and brown coal production among select OECD member countries (Mt) ........ 27 Table 1.6 Hard coal and brown coal production among select non-OECD countries (Mt) ................ 28 Table 1.7 India’s hard coal and lignite production by company (in Mt) ............................................ 31 Table 1.8 ROM prices for non-coking coal produced by CIL (USD/t) ................................................. 32 Table 1.9 Development of average royalties paid by largest Indian coal producers (USD/t) ............ 32 Table 1.10 Characteristics of different Russian coking coal types ....................................................... 34 Table 1.11 Selected Russian coking coal producing companies (Mt) .................................................. 35 Table 2.1 ADF test results .................................................................................................................. 61 Table 2.2 Production volumes of select mining companies in 2012 (Mt) ......................................... 73 Table A.1 Coal demand, 2011-18, Base Case Scenario (BCS) (million tonnes of coal-equivalent [Mtce]) .. 122 Table A.2 Coal demand, 2011-18, Chinese Low-Demand Case (CLDC) (Mtce) ................................ 122 Table A.3 Coal demand, 2011-18, Indian High-Demand Case (IHDC) (Mtce) .................................. 123 Table A.4 Coal production, 2011-18, BCS (Mtce) ............................................................................. 123 Table A.5 Coal production, 2011-18, CLDC (Mtce) ........................................................................... 123 Table A.6 Coal production, 2011-18, IHDC (Mtce) ........................................................................... 124 Table A.7 Hard coal net imports, 2011-18, BCS (Mtce) .................................................................... 124 Table A.8 Hard coal net imports, 2011-18, CLDC (Mtce) ................................................................. 124 Table A.9 Hard coal net imports, 2011-18, IHDC (Mtce) .................................................................. 125 Table A.10 Seaborne steam coal imports, 2011-18, BCS (Mtce) ....................................................... 125 Table A.11 Seaborne steam coal exports, 2011-18, BCS (Mtce) ........................................................ 125 Table A.12 Seaborne metallurgical coal (met coal) imports, 2011-18, BCS, in Mtce ........................ 126 Table A.13 Seaborne met coal exports, 2011-18, BCS (Mtce) ........................................................... 126 Table A.14 Seaborne steam coal imports, 2011-18, CLDS (Mtce) ..................................................... 126 Table A.15 Seaborne steam coal exports, 2011-18, CLDS (Mtce) ...................................................... 126 Table A.16 Seaborne steam coal imports, 2011-18, IHDC (Mtce) ..................................................... 127 Table A.17 Seaborne steam coal exports, 2011-18, IHDC (Mtce) ...................................................... 127 Table A.18 Coal demand, 2011-18, BCS (million tonnes [Mt]) .......................................................... 127 Table A.19 Coal production, 2011-18, BCS (Mt) ................................................................................ 128 Table A.20 Seaborne steam coal imports, 2011-18, BCS (Mt) ........................................................... 128 Table A.21 Seaborne steam coal exports, 2011-18, BCS (Mt) ........................................................... 128 Table A.22 Seaborne met coal imports, 2011-18, BCS (Mt) .............................................................. 129 Table A.23 Seaborne met coal exports, 2011-18, BCS (Mt) ............................................................... 129 Table A.24 Current coal mining projects ............................................................................................ 129
LIST OF BOXES
Box 1.1 To wash or not to wash, that is the question .......................................................................... 33 Box 2.1 The many prices of coal decoded ............................................................................................ 54 Box 2.2 Does coal price follow oil and gas prices? ............................................................................... 58 Box 2.3 Boom and bust: the development of mining companies’ stock prices and profits ................ 64 Box 2.4 The interdependency of the markets for coking coal and iron ore ........................................ 73 Box 3.1 Water in China: growing needs, bigger issue .......................................................................... 84 Box 3.2 Who is more dependent on coal? ........................................................................................... 88 Box 3.3 The “oxygen route” versus the “electric route”: two routes for steel making ....................... 92 Box 4.1 Are we overstating China’s importance? .............................................................................. 106 Box 5.1 Resources and reserves ......................................................................................................... 110 Box 5.2 The PRB: a little bit more coal on the supply side ................................................................. 119
© O
EC
D/IE
A, 2
013

EXECUTIVE SUMMARY
MEDIUM-TERM COAL MARKET REPORT 2013 11
EXECUTIVE SUMMARY The never-ending story In 2012, coal once again exhibited the largest demand growth of all fossil fuels, with an additional 134 million tonnes of coal-equivalent (Mtce) compared with 2011. Global coal demand grew to 7 697 million tonnes (Mt) in 2012 – 170 Mt (+2.3%) more than the previous year – despite weak demand from the world’s two largest consumers, China and the United States. In China, flat demand for power (largely driven by huge hydro production and lower-than-expected economic growth) led to weak 4.7% growth (+165 Mt), the second-lowest in over a decade. In the United States, abnormally low gas prices led to a 10.7% (-98 Mt) decrease in coal demand, the second-largest in five decades. The United States (US) decline was, however, largely offset by growth in India, Russia and other countries. Global metallurgical coal (met coal) demand, closely linked to iron and steel production and unaffected by hydro and gas competition, grew 4.2% in 2012. China remains the centre of the coal world. While coal demand grew by 170 Mt globally, China’s growth accounted for 165 Mt of this total. Measured in energy units, China used 2 806 Mtce in 2012, representing more than half of global consumption (5 530 Mtce) and 60% of global met coal demand. Chinese production in 2012 is estimated at 3 549 Mt, or 45% of global production (7 831 Mt). Imports to China totalled 301 Mt, the highest figure ever for any country. With the addition of more than 600 Mt of domestic coal shipped from northern ports to the south, China is receiving roughly as much seaborne coal as the rest of the world combined. This makes arbitrage between domestic and imported coal in China’ southern coast pivotal to coal markets developments. Coal is becoming cheaper Oversupply and lower-than-expected demand have driven steam coal prices down to a three-year low. The shale gas revolution, combined with the mildest winter in decades and United States Environmental Protection Agency regulations, shrank US markets for domestic coal, moving exports to Europe. At the same time, major exporting countries (particularly Australia and Indonesia, but also Colombia, Russia and to a lesser extent, South Africa) saw significant expansions of mining capacity. Despite Chinese and Indian growth and the temporary European coal fever, the market could not absorb so much coal. In 2013, rains, strikes and other disruptions affected major exporters – particularly Colombia. However, these events caused little (if any) price reaction. Overall, there is simply too much coal on the market. Although subject to different supply and demand dynamics, met coal prices have followed the trend, declining to levels below the marginal supply cost. This also indicates a market oversupply. Low coal prices impact on demand and supply differently. Low international coal prices push gas out of the power generation sector, where competition is possible (except in the United States, where low gas prices are isolated from international levels). Coal prices below marginal supply cost indicate that some exporters are losing money. Export-oriented companies are generally focused on reducing costs, cutting jobs, optimising operations and maximising profits. Many domestic-oriented producers are struggling to survive against competition from international coal. European hard coal producers are a good example of this. In China, while many small and medium-sized producers are losing money, big companies are expanding operations, taking advantage of lower costs stemming from rationalisation and better economies of scale. In principle, met coal producers could react earlier than steam coal producers, as greater concentration on the supply side facilitates production discipline.
© O
EC
D/IE
A, 2
013

EXECUTIVE SUMMARY
12 MEDIUM-TERM COAL MARKET REPORT 2013
Demand: from a quick step to a slow march International Energy Agency projections show that coal demand will grow at 2.3% per year on average during the outlook period, for both thermal and met coal. This growth rate is slower than indicated in the previous forecast. The more bearish perspective on China has driven down projections compared with last year. Whereas low coal prices could suggest a strong increase in thermal coal use, demand in the regions concentrating growth is relatively inelastic in the short term. Coal plants are capital-intensive assets. Hence, fuel cost is only one component of the levellised cost of the plants, which are largely designed for high load factors owing to growing power needs and frequent power shortages. Met coal demand is more inelastic. It is strongly dependent on iron and steel production, where met coal has almost no possible substitute, apart from scrap recycling. China, which produces roughly 60% of global pig iron, is therefore pivotal. Many of the new projects announced will be delayed, postponed or simply abandoned. Not only do current low coal prices decrease the cash flow of current operations, but they also shrink the net value of the developing projects. Thus, the huge number of announced capacity expansion and greenfield projects needs rethinking. Every major coal exporter (i.e. Indonesia, Australia, Russia, United States, Colombia and South Africa, as well as Canada for met coal) has expansion plans. The number and size of the new projects announced in Australia is particularly significant. Most involve simultaneous mining, rail and port capacity commitments. Whereas low coal prices have not hindered many expansions from coming online in recent years, their persistency will cause many projects to be put on hold until the coal market improves.
OECD: coal is not over yet In the United States, a combination of low gas prices, environmental regulation and uncertainty about future carbon policy will keep coal consumption far below the 2005-07 peak. Coal consumption is projected to total 606 Mtce by 2018, close to the 2012 level and far below the 718 Mtce consumed in 2010. While growing shale gas production will push coal prices down, environmental emissions regulation will cause the closure of considerable coal capacity and carbon dioxide (CO2) policy will prevent investments in new coal plants. International markets can alleviate the situation for US coal producers, but current low coal prices are not helping. Uncertainties surrounding future demand in China and actions by environmental and anti-coal groups will also hamper the growth of US coal exports, despite the existence of promising low-cost production areas, including the Illinois and Powder River basins. While the gas and coal price differential temporarily triggered coal demand in Organisation for Economic Co-operation and Development (OECD) Europe, we will see a steady decline from now on. Despite the public attention and press coverage received, the increase in OECD Europe 2012-13 coal use is far from the historical peak. In fact, it is only a temporary spike caused by the relative competitiveness of cheap coal compared with expensive gas. Coal consumption will decline during the outlook period. Sluggish economic growth projections, increasing renewable generation and efficiency gains (including from replacing old coal plants with new plants) will shrink demand. However, issues affecting nuclear power plants in Japan and, to a lesser extent, Korea will cause their coal-fired power plants to run at high load factors. In addition, new plants that come online will further drive demand in OECD Asia Oceania. Hence, total OECD coal demand will be basically flat throughout the outlook period.
© O
EC
D/IE
A, 2
013

EXECUTIVE SUMMARY
MEDIUM-TERM COAL MARKET REPORT 2013 13
Coal lights up non-OECD countries The projected growth in coal demand is driven by non-OECD countries, which account for an additional 817 Mtce, including 500 Mtce of power generation. With 164 Mtce of growth in coal demand by the end of the outlook period, India leads the way behind China. However, lower economic growth and persistent project development difficulties decrease India’s average annual growth rate from 6.3%, as projected in the MTCMR 2012, to 4.9% in this report. Nevertheless, 1 billion people in India and over 600 million people in the Association of Southeast Asian Nations (ASEAN) countries have per-capita electricity consumption of around 1 000 kilowatt hours per year, versus consumption of more than 8 000 kilowatt hours per capita in OECD member countries. This includes the more than 400 million people without access to electricity. Given the vast coal availability in these regions, China, India, Indonesia, Viet Nam and other countries will rely on coal to provide people with power. Non-OECD imports will nearly match global imports by 2018 as the growing needs of non-OECD countries, combined with the competitiveness of US and Australian coal, render the OECD close to self-sufficient. Despite a recent cost ramp-up, Australia strengthens its position as the biggest value exporter of coal. It also maintains its position as the (by far) top exporter of met coal, despite some growth in Canada, Russia and Mongolia. Bearish projections for Mozambique continue, due to ongoing issues concerning coal quality and transportation restrictions. Coking coal from Indonesia and Colombia will increase to 2018, but only slightly. Despite its growing domestic market needs, Indonesia will keep its position as the top exporter, underpinned by its low costs and proximity to coal-thirsty Asian markets. Our projections show growth among all the major steam coal exporters, i.e. Russia, Colombia, South Africa and the United States. In the end, it is all about China Given China’s absolute dominance over coal markets, our projections are strongly subject to Chinese uncertainties. The staunch commitment of the new Chinese government towards more efficient, sustainable and environmentally friendly growth, together with air pollution problems that have exacerbated public and governmental concerns over environmental issues, will accelerate the phasing-out of old facilities, the adoption of cleaner technologies and the implementation of coal consumption cuts in some regions. However, the degree to which curtailed coal demand can prove compatible with high gross domestic product growth is unclear. Two opposing trends appear – a rebalancing of the economy into a less energy-intensive model and the establishment of an urban middle class with increasing power needs. Efforts to diversify the energy supply will face drawbacks, such as domestic gas scarcity and renewable costs. On the supply side, where many coal producers’ costs are over price levels, any reaction in any direction will have strong implications on international markets. Coal conversion emerges as an important driver of coal demand in China. After some years of active debate, a number of coal conversion projects have been approved. If the announced projects are finally completed, conversion will need to be considered not only for coal, but also for the gas market and (to a lesser extent) the oil market. However, there are significant uncertainties, largely related to capital needs, environmental impacts (especially CO2 emissions) and water issues (since coal conversion is water-intensive). Hence, this report approaches coal conversion cautiously, assuming that 100 Mtce of additional coal will be consumed to make liquids, synthetic natural gas and chemicals by 2018. If the concerns mentioned above can be addressed in the years to come, we may revise this figure upward. Government policy, influenced by the industry’s solutions to those issues, will be key.
© O
EC
D/IE
A, 2
013

RECENT TRENDS IN DEMAND AND SUPPLY
14 MEDIUM-TERM COAL MARKET REPORT 2013
1. RECENT TRENDS IN DEMAND AND SUPPLY Summary • Coal was the fastest growing fossil fuel in absolute and relative terms in 2012. Approximately
29% of global primary energy consumption derives from coal. Coal strengthened its position as the second-largest primary energy source, behind oil.
• Global coal consumption grew by 2.3%, from 7 527 million tonnes (Mt) in 2011 to an estimated
7 697 Mt in 2012. Although coal demand increased by 170 Mt, demand growth was the third-lowest on record over the last ten years.
• China was once again the growth engine of global coal demand. In 2012, China posted the
second-lowest demand growth (4.7%) since 2001. Nevertheless, coal consumption increased by 165 Mt, to an estimated 3 678 Mt.
• Measured in energy units, China alone accounted for more than 50% of global coal demand in
2012. Total 2012 Chinese coal consumption was roughly equal to total coal demand of the United States since 2009, Japan since 1993 and Germany since 1990. Put differently, China consumes over four times more thermal coal and almost ten times more metallurgical coal (met coal), than the world’s two largest consumers, the United States (thermal coal) and Russia (met coal).
• In 2012, coal demand in the United States decreased1 by 98 Mt – the second-strongest decline ever
in the country. Due to the mild winter, low gas prices and plant retirements, coal-fired generation decreased by 235 terawatt hours (TWh) in 2012, while coal demand plummeted to an estimated 822 Mt.
• Coal consumption increased in Organisation for Economic Co-operation and Development
(OECD) Europe (+17 Mt) and OECD Asia Oceania countries (+12 Mt) in 2012. Demand was the highest ever in OECD Asia Oceania (467 Mt) and the highest since 2008 in OECD Europe (810 Mt).
• In 2012, global coal supply reached an estimated 7 831 Mt. Compared to 2011, supply increased
by 223 Mt, an amount greater than the annual consumption of Japan. Additional supply came mainly from China (+130 Mt) and Indonesia (+82 Mt), whereas production declined strongly (-71 Mt) in the United States.
Demand Coal again outpaced other fossil fuels in terms of both absolute and relative growth in 2012. As a result, coal strengthened its position as the second-largest primary energy source behind oil, accounting for around 29% of total primary energy consumption. Total global coal demand for 2012 was an estimated 7 697 Mt, up 2.3% from 7 527 Mt in 2011. Although overall coal consumption increased by 170 Mt, demand growth slowed compared to the trend of the last ten years (a compound average growth rate [CAGR] of 5.1%) for two main reasons. First, United States (US) coal demand dropped significantly (-10.7%) in 2012. Second, Chinese coal demand growth slowed, from 9.4% in 2011 to 4.7% in 2012. This is the second-lowest growth rate for China of the past ten years. 1 The relative decrease in energy content (-11%) is the largest ever. In 2009, the decline was larger than in 2012, both in absolute physical tonnes and energy content and in relative physical tonnes.
© O
EC
D/IE
A, 2
013

RECENT TRENDS IN DEMAND AND SUPPLY
MEDIUM-TERM COAL MARKET REPORT 2013 15
Table 1.1 Coal demand overview
Total coal demand (Mt)
2011
Total coal demand (Mt)
2012*
Absolute growth (Mt)
2011-12
Relative growth (%)
2011-12
CAGR (% per year)
2002-11
Share 2012 (%)
China 3 514 3 678 165 4.7% 9.8% 47.8% United States 920 822 -98 -10.7% -0.4% 10.7% India 710 753 43 6.1% 6.8% 9.8% Russia 225 251 26 11.7% 0.1% 3.3% Germany 235 241 7 2.9% -0.4% 3.1% European Union 771 783 12 1.5% -0.7% 10.2% OECD 2 240 2 169 -70 -3.1% 0.0% 28.2% Non-OECD 5 287 5 527 241 4.6% 7.4% 71.8% World 7 527 7 697 170 2.3% 5.1% 100.0%
* Estimate.
Notes: unless otherwise indicated, all material in figures and tables derives from International Energy Agency (IEA) data and analysis. Differences in totals are due to rounding. Non-OECD countries consume the vast majority (71.8%) of total coal. China, the world’s largest coal consumer since 1984, accounts for nearly half of global coal consumption.2 Despite a 98 Mt reduction in coal use in 2012, the United States remains the second-largest coal consumer, slightly ahead of India. Having increased its coal demand by 43 Mt, India accounts for 9.8% of global demand, just 0.9 percentage points below the United States. Total global hard coal consumption grew 2.7% to 6 790 Mt in 2012, a lower rate than in 2010 and 2011. As observed in recent years, non-OECD countries spurred global hard coal consumption. Whereas OECD member countries decreased hard coal use by 4.5% between 2011 and 2012, non-OECD countries intensified consumption by 5.0%. Global steam coal consumption increased by 139 Mt, implying a slowdown of growth from 4.9% to 2.4%. Although met coal use also increased by 38 Mt, consumption growth is slowing significantly. Whereas global met coal consumption increased by 6.8% on average between 2002 and 2011, the growth rate from 2011 to 2012 dropped to 4.2%. Total global brown coal3 consumption decreased slightly, from 914 Mt in 2011 to 907 Mt in 2012.4 Whereas OECD member countries increased demand by 4 Mt, non-OECD countries reduced demand by 10 Mt. In 2012, brown coal comprised 11.8% of total global coal consumption, as measured in million-tonne units. Measured in million tonnes of coal-equivalent (Mtce), the share of brown coal as energy content is only 5.6% because of its lower calorific value. OECD demand trends OECD hard coal consumption totalled 1 556 Mt in 2012, a 74 Mt decrease over 2011. OECD member countries accounted for 23% of total global hard coal consumption, compared with 42% in 2000. This continuously declining share is due to high growth rates in hard coal demand in non-OECD countries. The 4.5% decrease in total OECD hard coal demand in 2012 is mainly due to OECD Americas (-97 Mt), since both OECD Europe (+13 Mt) and OECD Asia Oceania (+9 Mt) increased their consumption from 2 Measured in energy content, China consumes even more than 50% of global coal demand. 3 Lignite and brown coal are used interchangeably. See Box 1 of IEA (2012) and Box 1 of IEA (2011). 4 For China, there is no differentiation between brown coal and thermal coal consumption. Entire Chinese coal production, except for met coal, is counted as thermal coal. This leads to some statistical distortions that have to be taken into account throughout the entire report.
© O
EC
D/IE
A, 2
013

RECENT TRENDS IN DEMAND AND SUPPLY
16 MEDIUM-TERM COAL MARKET REPORT 2013
2011 to 2012. The plummeting demand in the OECD Americas results mostly from a strong decrease in the US power sector’s thermal coal consumption. In OECD Europe and OECD Asia Oceania, low coal prices spurred demand for thermal coal-fired power generation. OECD total consumption of met coal dropped by 7.3 Mt (-3.8%) in 2012 after two consecutive years of growth. While thermal coal use decreased strongly, it still accounted for the lion’s share of hard coal demand (88%, or 1 370 Mt), while met coal consumption amounted to 186 Mt.
Table 1.2 Hard coal and brown coal consumption in select OECD member countries (Mt)
Hard coal Brown coal
2011 2012* 2011 2012* Australia 62.7 63.8 71.0 73.5 Austria 3.9 3.5 0.0 0.0 Belgium 4.4 4.4 0.3 0.3 Canada 33.4 32.4 9.6 9.4 Chile 9.8 10.4 0.0 0.0 Czech Republic 8.0 7.3 44.1 42.6 Denmark 5.5 4.2 0.0 0.0 Finland 5.5 4.6 0.0 0.0 France 14.5 16.8 0.1 0.1 Germany 58.0 56.2 176.7 185.2 Greece 0.4 0.1 60.0 63.7 Hungary 2.0 1.8 9.7 9.6 Ireland 2.1 2.4 0.0 0.0 Israel** 12.7 15.2 0.4 0.4 Italy 24.4 24.1 0.0 0.0 Japan 174.1 183.8 0.0 0.0 Korea 130.9 127.3 0.0 0.0 Mexico 18.6 18.4 0.0 0.0 Netherlands 11.7 12.8 0.0 0.0 New Zealand 2.6 2.5 0.3 0.3 Poland 83.5 75.6 62.7 64.1 Portugal 3.7 4.9 0.0 0.0 Slovak Republic 4.1 3.9 3.2 3.0 Spain 24.2 28.9 0.0 0.0 Turkey 27.2 32.2 73.9 66.0 United Kingdom 51.5 64.0 0.0 0.0 United States 845.5 749.7 74.8 72.2
* Estimate.
** The statistical data for Israel are supplied by and under the responsibility of the relevant Israeli authorities. The use of such data by the OECD and/or the IEA is without prejudice to the status of the Golan Heights, East Jerusalem and Israeli settlements in the West Bank under the terms of international law.
The coal-to-gas switch in power generation, combined with an extremely mild winter and coal plant retirements driven by US Environmental Protection Agency (EPA) regulations, caused US thermal coal demand to decline by 95 Mt between 2011 and 2012 and by 200 Mt overall since 2008. Nevertheless, the United States is still by far the largest consumer of all OECD member countries, accounting for over 53% of OECD thermal coal demand. The second-largest OECD thermal coal consumer is Japan, with a share of around 10%. The strongest absolute increase in thermal coal demand (+13 Mt) is seen
© O
EC
D/IE
A, 2
013

RECENT TRENDS IN DEMAND AND SUPPLY
MEDIUM-TERM COAL MARKET REPORT 2013 17
in the United Kingdom, where the low prices of carbon dioxide (CO2) and coal drove coal-fired power generation. With a demand of 52 Mt (28% of the OECD total), Japan retains its status as the largest OECD consumer of met coal, followed by Korea, which consumed 32 Mt in 2012. Total OECD brown coal demand rose slightly, from 610 Mt in 2011 to 614 Mt in 2012. Consequently, OECD member countries make up 67.7% of total global brown coal demand. In OECD Americas, particularly the United States, brown coal demand decreased by 3 Mt, compensated by increases in OECD Europe (+4 Mt) and OECD Asia Oceania (+3 Mt). OECD Europe accounts for 75% of total OECD brown coal consumption. Demand in Germany, the world’s largest brown coal consumer, grew by 8.5 Mt. Power sector Total coal-fired power generation within the OECD was estimated at 3 453 TWh in 2012, down 4.3% from 3 609 TWh in 2011. Thus, coal-fired generation in the OECD decreased for the second year in a row. This development can be explained in small part by decreasing overall power generation in OECD member countries, from 10 802 TWh in 2011 to an estimated 10 771 TWh in 2012. As a consequence, coal’s share of total OECD electricity generation dropped from 33.4% in 2011 to 32.1% in 2012. Decreasing OECD coal-fired power generation was mainly due to the United States (see Figure 1.1), which reduced coal-fired generation by 235 TWh (12.5%) in 2012, due to the combination of a very mild winter and increasing shale gas production. This gave rise to extremely low gas prices which triggered further gas-to-coal fuel-switching.5 The decommissioning of coal plant capacities driven by EPA regulation also played a part in this decrease. By contrast, coal-fired generation in OECD Asia increased by 20 TWh, to an estimated 736 TWh in 2012. Whereas Korea slightly decreased generation from coal-fired power plants compared with 2011, Japan increased coal-fired generation by 10 TWh between 2011 and 2012. Several coal plants were damaged by the Great East Japan Earthquake and temporarily stopped operations. Most units resumed normal operations in 2012. Since coal plants in Japan are less expensive than gas- or oil-fired plants in terms of marginal generating costs, their higher operating capacity resulted in increased coal-fired generation, totalling 292 TWh. In OECD Europe, coal-based electricity generation increased 54 TWh year-on-year, reaching an estimated 942 TWh in 2012. This 6.1% increase was mainly driven by developments in the United Kingdom, Spain and Germany. Although total gross power generation in the United Kingdom decreased by 5 TWh, coal-fired generation increased by 34 TWh. The United Kingdom has seen a massive fuel switch from gas to coal, due to pronounced differences in gas and coal prices, combined with low prices for carbon emission certificates. Gas-fired generation in the United Kingdom decreased by 47 TWh. In Germany, coal-fired generation grew by 15 TWh, although power demand slightly decreased and renewable generation increased. This development can be explained not only by the fuel switch from gas-to-coal and lower nuclear power generation, but also by higher net exports to neighbouring countries (such as the Netherlands). Since Germany is well integrated with neighbouring power systems, low-cost German coal-fired power plants push more expensive gas-fired power plants in neighbouring countries out of the market. Given that lignite power plants in Germany currently run at maximum capacity, further increases in coal-fired generation would necessarily derive from hard coal plants. In Spain, coal-fired generation grew by 11 TWh, due to lower hydro and gas generation. Coal-fired power generation in Poland decreased by 5 TWh due to sluggish power demand and growth in renewable generation. 5 For more details, see “Regional focus: United States” in this chapter.
© O
EC
D/IE
A, 2
013

RECENT TRENDS IN DEMAND AND SUPPLY
18 MEDIUM-TERM COAL MARKET REPORT 2013
Figure 1.1 Coal-based gross power generation in the OECD: absolute changes, 2011-12
Non-power sector
Non-power coal consumption in OECD member countries accounted for 287 Mtce (19%) of total coal use in 2011. It is mainly determined by the iron and steel industry, which consumed 162 Mtce in 2011, a 5 Mtce increase from 2010. Total consumption in the cement industry, the next-largest sector, was 26 Mtce in 2011.
Figure 1.2 Monthly year-on-year differences in crude steel production in OECD member countries, 2011-13
Source: World Steel Association (various years), Crude Steel Production, Brussels, World Steel, www.worldsteel.org/statistics/crude-steel-production.html.
As seen in Figure 1.2, whereas in 2011 rising steel production gave a positive impulsion (+5.5 Mt) to met coal consumption in OECD member countries, steel output began to decrease in 2012, particularly
-250
-200
-150
-100
-50
0
50
100
OECD Americas OECD Asia Oceania OECD Europe
TWh
Total country aggregate USA Japan United Kingdom Spain Germany Other
-1.5
-1
-0.5
0
0.5
1
1.5
2
2.5Mt
OECD Europe OECD Americas OECD Asia Oceania
© O
EC
D/IE
A, 2
013

RECENT TRENDS IN DEMAND AND SUPPLY
MEDIUM-TERM COAL MARKET REPORT 2013 19
in OECD Europe and OECD Asia Oceania. Consequently, OECD met coal use fell by 7.3 Mt in 2012. As of early 2013, the trend of diminishing steel production seemed to persist in OECD member countries. Regional focus: United States Total coal consumption in the United States dropped 10.7%, from 920 Mt in 2011 to 822 Mt in 2012. Although the use of coking coal (-0.4 Mt) and lignite (-2.6 Mt) also declined, thermal coal demand suffered by far the largest decrease compared with 2011, with coal use dropping from 826 Mt in 2011 to 731 Mt in 2012 (-95 Mt). Coal use for power generation, which represents over 90% of US coal demand, took the biggest hit. The share of coal in total US power generation was almost 5 percentage points lower in 2012 (38.3%) than in 2011 (43.3%).
Figure 1.3 Development of power generation by fuel and natural gas prices, 2011-13
Notes: GWh = gigawatt hour. Industry includes coal consumptions of coke plants and other industrial coal use, as defined by the US Energy Information Administration (EIA).
Source: EIA (US Energy Information Administration) (2013a), Quarterly Coal Reports 2002 through 2012, EIA, Washington, DC; EIA (2013b), Annual Energy Review, EIA, Washington, DC; EIA (2013c), Natural Gas Prices, EIA, Washington, DC.
The reasons for the decline in coal-fired power generation are threefold: first, the total US power supply decreased year-on-year by approximately 1% (45 TWh) in 2012, owing mainly to an extremely mild winter in the country and increasing shale gas production. Second, the Henry Hub gas price was more than 31% lower on average in 2012 (at United States dollars (USD) 2.75 per million British thermal units [USD/MBtu]) than in 2011 (USD 4/MBtu), causing a significant coal-to-gas fuel switch. Consequently, the share of gas in the total US power supply grew 5.7 percentage points, to 29.8% in 2012. Third, US coal-fired gross power generation capacity dropped by an estimated 8 gigawatt (GW) (see Table 1.3 for an overview of coal-fired power plant retirements by US state).6 Theoretically, this net reduction in coal-fired power plant capacity could have resulted in higher full-load hours for the remaining coal-fired generating units. However, due to the merit order and capacity mix in the various US regional electricity markets, the retirements have also partly contributed to a decrease in power sector coal use.
6 Besides retirements of 11 GW of installed capacity, approximately 3.6 GW of new coal-fired capacity came online in 2012.
020406080
100120140160180200
0.00.51.01.52.02.53.03.54.04.55.0
GWh (thousand)
Coal Gas Henry Hub price (right axis)
USD/MBtu
0
© O
EC
D/IE
A, 2
013

RECENT TRENDS IN DEMAND AND SUPPLY
20 MEDIUM-TERM COAL MARKET REPORT 2013
The Figure 1.3 shows the quarterly Henry Hub price (black line) falling for four consecutive quarters, starting with the second quarter of 2011. This decline was accompanied by an absolute increase (on a year-to-year basis) in the negative quarterly growth rates of US coal consumption (grey bars). However, having started to rise again in the third quarter of 2012, the quarterly Henry Hub price surpassed USD 3/MBtu in October 2012, reaching approximately the same levels as the previous year. Interestingly, fourth-quarter coal consumption remained almost flat on a year-to-year basis, underlying the importance of coal-to-gas competition.
Table 1.3 Retirements of US coal-fired power plants by state, 2009-12 (megawatt [MW])
2009 2010 2011 2012
Arkansas 0 0 0 0 Colorado 0 75 100 0 Georgia 0 0 250 0 Iowa 0 150 0 0 Illinois 75 300 625 850 Indiana 0 350 0 675 Massachusetts 0 0 100 150 Maryland 0 0 0 100 Michigan 125 0 175 0 Minnesota 225 0 0 0 North Carolina 0 0 475 1 000 New Mexico 0 0 0 0 Nevada 0 0 0 1 575 New York 100 0 0 575 Ohio 0 500 0 1 725 Pennsylvania 0 50 425 1 125 South Carolina 0 0 0 850 Tennessee 0 0 225 925 Virginia 0 0 0 475 Wisconsin 0 0 75 200 West Virginia 0 0 0 1 075 Total 525 1 425 2 450 11 300
Note: figures shown in this table are rounded to 25 MW units.
In 2011, 40 US states used at least 1 Mt of coal to produce electricity, with the largest power use in Texas (112 Mt in 2011), Illinois (58 Mt), Missouri (41 Mt) and Ohio (40 Mt).7 In 2012, the growing competitiveness of gas-fired power plants had varying impacts on coal-based electricity production depending on the state. By far the largest decline in power sector coal consumption was observed in Texas, where coal transportation to power plants dropped more than 21 Mt in 2012 over 2011. This comes as no surprise, as Texas (home to the second-largest US gas resource, the Barnett Shale) is the largest producer of shale gas in the country and produced over 85 billion cubic metres of shale gas in 2011. Besides Texas, other states that saw significant changes in power sector coal use include Ohio (-7.5 Mt), Wisconsin (-7.1 Mt), Georgia (-6.8 Mt), North Carolina (-5.3 Mt), Tennessee (-5.3 Mt) and Indiana (-4.9 Mt). In terms of the supply side, railway transport comprised almost 70% of total coal shipments in 2012. Besides railways, other important transportation modes were barging (12%), trucking (11%) and
7 This paragraph uses coal delivered to power plants and coal use in the power sector interchangeably, ignoring stock changes at US power plants in 2012.
© O
EC
D/IE
A, 2
013

RECENT TRENDS IN DEMAND AND SUPPLY
MEDIUM-TERM COAL MARKET REPORT 2013 21
tramways, conveyor belts, or slurry pipelines (7%). As Figure 1.4 shows, the mining region that registered the strongest reactions in sales to the power sector in 2012 was the Powder River basin. Coal shipments from the PRB to US power plants in 2012 were over 60 Mt lower than in 2011. Transport volumes to electricity-generating units in Texas were affected most severely (-18.6 Mt), followed by transports to Illinois (-7.4 Mt), where some volumes (2.6 Mt) from the PRB were swapped with coal from the eastern interior, and Wisconsin (-5.7 Mt). In 2012, coal sales to the US power sector also declined strongly in Central Appalachia, with coal transport dropping from 93 Mt in 2011 to 57 Mt in 2012 (-36 Mt). The remaining mining regions faced only minor decreases in sales to the power sector, while the eastern interior even recorded an increase (albeit a small one, 1.3 Mt) coal transport volumes to power plants.
Figure 1.4 Coal transports from US mining regions to power plants, 2011-12
Notes: NAPP = Northern Appalachia; CAPP = Central Appalachia; SAPP = Southern Appalachia; PRB = Powder River Basin. Figure only includes US mining regions where coal transport to the electric power sector decreased between 2011 and 2012.
Sources: EIA (US Energy Information Administration) (2013d), Quarterly Coal Distribution Report, EIA, Washington, DC; IEA analysis.
Non-OECD demand trends Non-OECD countries registered another year of coal demand growth in 2012, increasing their total demand to 5 527 Mt (+241 Mt), 72% of total global coal demand. While coal use in non-OECD countries grew impressively (by an amount equal to Germany’s annual coal consumption), demand growth declined from 7.9% in 2011 to 4.6% in 2012, the second-lowest growth rate of the last ten years. China’s consumption grew by 165 Mt to an estimated 3 678 Mt in 2012, accounting for 67% of non-OECD coal consumption. In energy units, the amount of coal (2 805 Mtce) consumed by China within the last year would have satisfied US coal demand over the last four years (see Figure 1.5). The absolute rise in non-OECD coal demand was driven mainly by a 4.8% year-on-year increase (+206 Mt) in thermal coal consumption, to 4 485 Mt in 2012. The major driver was China, which consumed an estimated 3 099 Mt of thermal coal (+126 Mt) in 2012, 53% of global consumption. India, the second-largest non-OECD consumer, raised thermal coal demand from 628 Mt to 668 Mt in 2012. China and India combined accounted for over 80% of incremental non-OECD thermal coal consumption.
-80
-60
-40
-20
0
20
0
100
200
300
400
500
NAPP CAPP SAPP Eastern Interior
Texas PRB Uinta basin
MtMt
2011 2012 Absolute change 2011-12 (right axis)
© O
EC
D/IE
A, 2
013

RECENT TRENDS IN DEMAND AND SUPPLY
22 MEDIUM-TERM COAL MARKET REPORT 2013
Figure 1.5 Number of years needed for other countries to consume China’s 2012 coal consumption
Non-OECD countries increased met coal use by 45 Mt, reaching a total of 749 Mt in 2012. Here again, the major driver was China, which consumed an estimated 579 Mt (+38 Mt) in 2012, 62% of global demand. China consumed nearly ten times as much as Russia, the second-largest met coal user. Unlike thermal and met coal, brown coal use in non-OECD countries dropped from 303 Mt in 2011 to 293 Mt (-10 Mt) in 2012, due mainly to a 10% (-11 Mt) drop in consumption in Serbia, Romania and Bulgaria. Consumption remained constant in Russia and India, the two largest non-OECD countries using brown coal. Power sector
Total power generation in non-OECD countries grew 7.0%, from 10 582 TWh in 2010 to 11 324 TWh in 2011. Coal-powered generation amounted to 5 526 TWh in 2011, up 12.3% over 2010. Thus, coal increased its share of total non-OECD power generation from 46.5% in 2010 to 48.8% in 2011. China is by far the world’s largest producer of coal-fired power. In 2011, coal-fired generation totalled 3 751 TWh, 17% of global power generation. Additionally, 94% of incremental Chinese power generation came from coal plants. Chinese coal-fired generation grew 14.6% (+477 TWh) in one year (see Figure 1.6), an amount larger than total wind, biomass and solar generation in OECD Europe in 2012. This huge increase caused China’s share of coal-fired generation to rise from 77% of total generation in 2010 to 79% in 2011. After China and the United States, India has the world’s third-largest power generation from coal. In 2011, Indian coal-fired generation stood at 715 TWh, an 11% (+71 TWh) increase over 2010. Coal contributed over 75% of incremental power generation in India, with over 96% of power generated from burning thermal coal and the rest from brown coal. South Africa, the third-largest non-OECD coal-fired power generator, slightly increased production by 0.7% between 2010 and 2011. However, coal-fired power plants in the country are reported to be operating at close to full capacity. Among other non-OECD countries, Chinese Taipei, Indonesia, Malaysia, Thailand, the Philippines and Viet Nam strongly stepped up coal-fired generation. In 2011, these six countries generated a total 342 TWh in coal-fired power, a 10.5% (+32 TWh) increase over 2010.
4
7
7
17
19
23
1989 1992 1995 1998 2001 2004 2007 2010 2013
United States
European Union
India
Russia
Japan
Germany
© O
EC
D/IE
A, 2
013

RECENT TRENDS IN DEMAND AND SUPPLY
MEDIUM-TERM COAL MARKET REPORT 2013 23
Figure 1.6 Evolution of coal-based electricity generation in non-OECD countries
Non-power sector
Non-power coal consumption plays a stronger role among non-OECD countries than among OECD member countries. In 2011, non-OECD countries consumed approximately 1 500 Mtce of coal in non-power sectors, with roughly 42% directed at iron and steel production. Cement production, the second-largest non-power sector, consumed approximately 240 Mtce (16%) in 2011. The chemical and petrochemical industry (76 Mtce) and residential coal burn (90 Mtce) also accounted for significant volumes.
Figure 1.7 Quarterly year-on-year differences in steel production in non-OECD countries, 2011-13
Source: World Steel Association (various years), Crude Steel Production, Brussels, World Steel, www.worldsteel.org/statistics/crude-steel-production.html.
In China, non-power coal consumption is mainly driven by iron and steel, and cement production. Coal consumption in the cement sector stood at 183 Mtce in 2011, an 11 Mtce increase from 2010. Most
0%
5%
10%
15%
20%
25%
0100200300400500600700800TWh
2010 2011 Relative growth 2010-11 (right axis)
Absolute growth in 2010-11
Total coal-based electricity generation in 2010-11
-5
0
5
10
15
20
25Mt
China Other non-OECD India
© O
EC
D/IE
A, 2
013

RECENT TRENDS IN DEMAND AND SUPPLY
24 MEDIUM-TERM COAL MARKET REPORT 2013
incremental consumption came from iron and steel production, which amounted to 450 Mtce, a 15% increase over 2010. This development can be explained by steel production, which reached 684 Mt in 2011, a 61 Mt (9.8%) increase compared with 2010. Despite low 3.6% growth (see Figure 1.7) during the first three quarters of 2012, steel production recovered afterwards. In the first half of 2013, China’s steel production increased by 33 Mt, or 9.2% year-on-year, indicating another year of impressive growth. Non-power coal consumption in India is also driven by iron and steel production. Indian iron and steel factories consumed 65 Mtce of coal in 2011, 9 Mtce more than in 2010. Steel also registered 6% growth over 2010, a persisting trend in 2012. However, it is worth mentioning that over 25% of total Indian iron is direct reduced iron (DRI), which does not use coking coal in the production process. Regional focus: India India became the world’s third-largest coal volume consumer in the mid-1990s, surpassing Russia in 1994 and Germany in 1995. Since then, Indian coal consumption has grown on average 5.7% per year, from less than 300 Mt in 1995 to an estimated 753 Mt in 2012, the second-largest volume increase after China for this period. Met coal and lignite demand did not increase dramatically in the first decade of the 21st century, with steam coal accounting for almost the entire growth in volume (Figure 1.8). When studying Figure 1.8, one can see that India managed to decrease the coal intensity of its gross domestic product (GDP) – i.e. grams of coal-equivalent (gce) used per GDP measured in USD at constant 2005 prices (gce/USD2005) – from close to 382 gce/USD2005 in 2000 to 351 gce/USD2005 in 2011. However, two counteracting effects come to light. On the one hand, the coal share of total primary energy consumption increased, from 35% in 2000 to 43% in 2011. On the other hand, India decreased the primary energy intensity of GDP by 26%, from 1 092 gce/USD2005 in 2000 to 809 gce/USD2005 in 2011. The ratio is still relatively high. The United States, for example, had a ratio of 237 gce/USD2005 in 2011.
Figure 1.8 Indian coal demand overview
Sources: UNSD (United Nations Statistics Division) (2013), GDP and its breakdown at constant 2005 prices in US Dollars, New York, http://unstats.un.org/unsd/snaama/dnllist.asp; IEA (International Energy Agency) (2013), Coal Information 2013, OECD/IEA, Paris.
0
100
200
300
400
500
600
700
800
900
0
100
200
300
400
500
600
700Mt
Steam coal Metallurgical coal Lignite Coal int. GDP (r. axis)
gce/USD2005
© O
EC
D/IE
A, 2
013

RECENT TRENDS IN DEMAND AND SUPPLY
MEDIUM-TERM COAL MARKET REPORT 2013 25
The most important driver of India’s surging coal demand has been its rapidly increasing electricity consumption, fuelled by ongoing electrification, population growth and increasing GDP per capita. Consequently, electricity consumption per capita grew by more than 60%, from 387 kilowatt hours per capita (kWh/capita) in 2000 to 623 kWh/capita in 2011. Yet India still has a long way to go to reach the global average of 2 640 kWh/capita in 2011. As Figure 1.9 shows, India has a history of failing to meet power generation capacity-addition targets established in its Five-Year Plans (FYPs), which is one reason why its generation capacity is not high enough to meet electricity demand (particularly at peak hours).8
Figure 1.9 Actual versus targeted generation capacity additions in India
Sources: Planning Commission (Government of India) (various years), Twelfth Five-Year Plan, Planning Commission, New Delhi.
Although the share of coal in total electricity supply dropped significantly in the first five years of the past decade (-8.8 percentage points), it has remained roughly constant since then, standing at the still-high level of around 68% in 2011. Not only is coal the most important fuel in power generation, coal consumption in the power sector accounted for 69% of total coal demand in Mtce in 2011, after adjusting metric tonnes for energy content. The second- and third-largest consumers of Indian coal were the steel industry (14.4%) and the non-metallic minerals sector (mainly cement production) (3.9%). India is the fourth-largest producer of crude steel, with an estimated supply of 76.7 Mt in 2012 (World Steel Association, 2013). India’s steel output stood at 26.9 Mt in 2000, with incremental production totalling almost 50 Mt, an average annual growth rate of 9.2%. Although approximately 70% of global crude steel is produced through the oxygen route, which necessarily relies on met coal (see Box 3.3 for details on steel production methods), Indian coking coal consumption failed to post similarly impressive growth rates, growing by just 1.1% per year since the beginning of the 21st century. India’s coking coal reserves generally have high ash content (average ash content of run-of-mine [ROM] production stands at 30% to 45%). Beneficiation is therefore inevitable if India wants to rely on indigenous coking coal to produce crude steel using BFs. It is, however, costly – as is importing
8One other reason is that the domestic coal supply cannot keep up with demand, thus keeping coal-fired power plant load factors lower than optimal from a profit-maximising point of view (see also “Special focus: coal supply in India” in this chapter).
0%
20%
40%
60%
80%
100%
0
20
40
60
80
100GW
Indian FYPTarget Actual Achievement (right axis)
© O
EC
D/IE
A, 2
013

RECENT TRENDS IN DEMAND AND SUPPLY
26 MEDIUM-TERM COAL MARKET REPORT 2013
prime coking coal. As a result, India has over the last decade increased its reliance on DRI, also referred to as sponge iron. The country, which has posted an impressive average annual growth of 15.8% since 2000, has become the world’s largest producer of DRI (see Figure 1.10), with an output of 27.6 Mt in 2011. In addition to relying more heavily on DRI, it has also increased its scrap imports, from around 1 Mt in 2000 to 3.6 Mt in 2010. Both aspects helped decouple coking coal from steel demand growth in recent years.
Figure 1.10 Development of DRI production in India, 2000-11
Notes: DRI production information for 2011 is only available for 14 countries. These countries were responsible for 87% of global DRI production in 2010. Assuming that this share applies to 2011 as well, total DRI production amounts to 72.9 Mt in 2011 (+2.4% compared with 2010).
Source: World Steel Association (various years), Crude Steel Production, World Steel, Brussels, www.worldsteel.org/statistics/crude-steel-production.html.
Supply Global coal supply totalled an estimated 7 831 Mt by the end of 2012, a 223 Mt increase in production compared with 2011. Although it has increased by an amount larger than the total annual coal consumption of Japan, global coal production growth is slowing. In 2012, it grew 2.9% on a year-on-year basis, significantly below the 4.6% average of the last ten years. Global supply growth has slowed down, mainly due to the three largest producing countries, China, the United States and India. In China and India, growth has been more than 50% lower than in the last decade. In the United States, production has declined by 7.1%. Above-average production growth in Australia and Indonesia has partly compensated for this development. Incremental coal production came predominantly from thermal coal (+218 Mt). The thermal coal supply grew 3.8% year-on-year, totalling 5 984 Mt in 2012. The met coal supply also increased by 12 Mt. This relative 1.2% growth was, however, well below that of thermal coal. Lignite production decreased slightly last year (-6 Mt). While non-OECD countries have mined mostly thermal coal (81%) and met coal (69%), OECD member countries have produced 68% of worldwide lignite.
0%
5%
10%
15%
20%
25%
30%
35%
40%
0
20
40
60
80
2000 2001 2002 2003 2004 2005 2006 2007 2008 2009 2010 2011
Mt
Total DRI productionIndian DRI productionAnnual growth of Indian DRI production (right axis)
© O
EC
D/IE
A, 2
013

RECENT TRENDS IN DEMAND AND SUPPLY
MEDIUM-TERM COAL MARKET REPORT 2013 27
Table 1.4 Coal supply overview
Total coal supply (Mt)
2011
Total coal supply (Mt)
2012*
Absolute growth (Mt)
2011-12
Relative growth (%)
2011-12
CAGR (% per year)
2002-11 China 3 419 3 549 130 3.8% 9.0% United States** 1 006 935 -71 -7.1% -0.2% India 582 595 13 2.2% 5.2% Australia 402 421 19 4.6% 2.0% Indonesia 360 443 82 22.9% 14.4% OECD 2 082 2 032 -50 -2.4% -0.1% Non-OECD 5 526 5 799 273 4.9% 7.2% World 7 608 7 831 223 2.9% 4.6%
* Estimate.
** According to the EIA, coal production decreased from 994 Mt in 2011 to 922 Mt in 2012.
Note: differences in totals are due to rounding.
OECD supply trends In OECD member countries, 2010 coal production dropped 2.4% (-50 Mt) over 2011. Total 2012 coal supply amounted to 2 032 Mt, down from 2 082 Mt in 2011. Brown coal production slightly increased (+4 Mt), met coal production remained constant (288 Mt) and thermal coal output decreased (from 1 187 to 1 133 Mt) between 2011 and 2012.
Table 1.5 Hard coal and brown coal production among select OECD member countries (Mt)
Hard coal Brown coal
2011 2012* 2011 2012* Australia 331 347 71 74 Canada 57 57 10 9 Czech Republic 11 11 47 44 Germany 12 12 177 185 Greece 0 0 59 62 Hungary 0 0 10 9 Korea 2 2 0 0 Mexico 16 15 0 0 New Zealand 5 5 0 0 Norway 1 1 0 0 Poland 76 80 63 64 Slovak Republic 0 0 2 2 Spain 7 6 0 0 Turkey 4 4 73 66 United Kingdom 19 17 0 0 United States 932 863 74 72
* Estimate.
The sharp decrease in OECD thermal coal production stems mainly from the output of the United States, the biggest OECD thermal coal producer. Between 2011 and 2012, thermal coal production shrank by 69 Mt, mainly because of plummeting coal demand for power generation stemming from low gas prices, decreasing coal-fired power plant capacity and a warm winter. Growing thermal coal exports
© O
EC
D/IE
A, 2
013

RECENT TRENDS IN DEMAND AND SUPPLY
28 MEDIUM-TERM COAL MARKET REPORT 2013
(+16 Mt) and dwindling imports (mainly from Colombia) mitigated the decline of US coal production. Australia’s thermal coal supply totalled 200 Mt in 2012, a 16 Mt (+8.5%) increase over 2011, strengthening the country’s position as the second-largest thermal coal producer in the OECD. Incremental supplies, which accounted for 7.3% of global incremental coal supplies, were mainly enhanced by higher exports. Total brown coal output in OECD member countries grew slightly, from 607 Mt in 2011 to 611 Mt in 2012, thanks to production in OECD Europe (456 Mt). Germany, the world’s largest brown coal producer, produced 185 Mt (+9 Mt), with power generation from brown coal growing more than 5% over 2011. Mined brown coal volumes in OECD Americas (81 Mt) and OECD Oceania (74 Mt) were close to their 2011 levels. Non-OECD supply trends Total coal output of non-OECD countries in 2012 was an estimated 5 799 Mt, a 273 Mt (+4.9%) increase over 2011. Thermal coal production grew 5.9%, to 4 851 Mt. Met coal production saw more moderate 1.7% growth, from 643 Mt to 654 Mt. Brown coal supplies declined by 10 Mt, to an estimated 294 Mt in 2012. China, by far the world’s largest hard coal supplier, mined 51% of global hard coal in 2012. Its production grew to 3 549 Mt (+130 Mt compared with 2011). While met coal production only increased by 1 Mt (to 510 Mt) in 2012, nearly all incremental demand stemmed from thermal coal. China produced an estimated 3 039 Mt of thermal coal in 2012. Although the country’s incremental coal production is (once again) impressive in absolute numbers, growth is slowing, from a 9.0% annual average between 2001 and 2011 to 3.8% between 2011 and 2012. The reasons are twofold: Chinese demand growth has also slowed and the relatively low prices in the international seaborne trade have enhanced the attractiveness of imports over domestic coal production.
Table 1.6 Hard coal and brown coal production among select non-OECD countries (Mt)
Hard coal Brown coal
2011 2012* 2011 2012* Bulgaria 0 0 37 33 Colombia 86 89 0 0 India 540 552 42 43 Indonesia** 360 443 0 0 Kazakhstan 108 121 8 6 People’s Republic of China 3 419 3 549 0 0 Romania 0 0 35 34 Russia 245 276 76 78 Serbia 0 0 41 38 South Africa 253 259 0 0 Ukraine 70 72 0 0 Viet Nam 44 42 0 0
* Estimate.
** Actually, part of that coal is lignite.
Behind India (see “Special focus: coal supply in India”), Indonesia is the third-largest hard coal producer of all non-OECD countries and 2012 estimates point to a spectacular upsurge in production. Within one year, Indonesia increased production by 83 Mt, to a total of 440 Mt. The country’s 22.9% annual growth has even outperformed its last ten-year average of 14.4%. With respect to the energy content, Indonesian coal production grew 21%, pointing to the declining calorific value of incremental production.
© O
EC
D/IE
A, 2
013

RECENT TRENDS IN DEMAND AND SUPPLY
MEDIUM-TERM COAL MARKET REPORT 2013 29
Russia, Kazakhstan and Ukraine account for 45 Mt of incremental hard coal production. Russia increased its hard coal supply from 245 Mt in 2011 to 276 Mt in 2012. The country produced 202 Mt of thermal coal and 75 Mt of met coal in 2012, contributing 9 Mt of the 14 Mt global incremental met coal production. Hard coal production also grew in Colombia (from 86 Mt to 89 Mt) and South Africa (from 253 Mt to 259 Mt), mainly due to rising exports. Four eastern European countries (Bulgaria, Romania, Russia and Serbia) account for more than 60% of total non-OECD brown coal production. While their combined production decreased by 8 Mt between 2011 and 2012, their total 182 Mt production was still 7 Mt higher than in 2010. Among non-OECD countries, India (44 Mt), Thailand (18 Mt) and Mongolia (10 Mt) are other important brown coal suppliers. Special focus: coal supply in India As of April 2012, India had 118 gigatonnes (Gt) of proven hard coal reserves, with another 175 Gt of indicated and inferred resources. Approximately 85% of its proven hard coal reserve is thermal coal. According to India’s Ministry of Coal, 4.6 Gt (4%) of the proven reserves have prime coking coal properties; the remainder (11%) comprise semi-soft and other types of coking coal endowed with less valuable coking properties. While total lignite resources are estimated at 42 Gt, only slightly over 6 Gt are considered as proven. Map 1.1 depicts the regional distribution of India’s proven reserves. Lignite reserves are concentrated in three states, Rajasthan and Gujarat in northwest India and Tamil Nadu in south India. Of the three, Tamil Nadu has the most important resources, with over 80% of India’s total lignite resources. Even more impressively, its Mannargudi lignite field alone contains more than 24 Gt (58%) of the country’s lignite. India’s only relevant source of coking coal is Jharkhand state, near the northeast coast, which is home to over 98% of the country’s proven reserves. (This also explains why all Indian steel mills that produce crude steel from pig iron are located at or close to the coast, since they either rely on production from Jharkhand or on coking coal imports.) In contrast to coking coal and lignite, steam coal is more evenly distributed across India. Among its 28 states, 11 possess thermal coal deposits and 7 have at least 1 Gt of proven reserves.9 India is the second-largest non-OECD coal producer and the third-largest coal producer worldwide. In 2012, India’s coal production was 595 Mt, up from 582 Mt in 2011. Its hard coal production consisted of 546 Mt of thermal coal and 6 Mt of met coal;10 it also produced 44 Mt of lignite. The three most important states in terms of annual coal output are Chhattisgarh (114 Mt in 2011-12), Odisha (106 Mt) and Jharkhand (110 Mt). On 1 May 1973, India’s legislature passed the Coal Mines (Nationalisation) Act 1973, with the goal of re-organising the coal mining sector by initially reserving coal production exclusively for public sector companies. Subsequent amendments allowed specific end-user industries, e.g. the power sector in 1993, to engage in captive coal mining. Under the captive coal mining policy, the government assigns coal blocks to a private or state-owned company, with the requirement that it use the produced coal for a predefined purpose. Since 1993, 218 coal blocks totalling approximately 50 Gt in resources have been allocated, including 106 to private companies. As of the end of 2012, 40 blocks had already been de-allocated, leaving 178 allocated blocks with a total 40 Gt in resources (Indian Ministry of Coal, 2013). Although the 9 This paragraph is somewhat a simplification, as it does not discuss the coal resources located in the seven union territories that are also part of the Indian Federal Union of States. 10 This amount only considers coking coal used to produce coke. Coking coal for thermal use is considered steam or thermal coal.
© O
EC
D/IE
A, 2
013

RECENT TRENDS IN DEMAND AND SUPPLY
30 MEDIUM-TERM COAL MARKET REPORT 2013
captive mining policy was intended to increase India’s indigenous coal supply, it has yet to prove its effectiveness as a policy instrument. By 2011/12, only 34 blocks had begun operating, with an annual output of only 36 Mt, compared with the original target of 105 Mt. While there are many reasons for this underachievement, difficulties in obtaining the necessary permits (such as forestry clearance) and acquiring land are most often cited. Most captive coal blocks also suffer from unfavourable geological conditions.
Map 1.1 Regional distribution of India’s coal reserves and production
Notes: UT = Union Territory. Map shows geographical distribution of reserves and production. Different colours reflect which coal type is the predominant resource in the respective state.
Source: Indian Ministry of Coal (2013), Annual Report 2012-2013, Indian Ministry of Coal, New Delhi.
© O
EC
D/IE
A, 2
013

RECENT TRENDS IN DEMAND AND SUPPLY
MEDIUM-TERM COAL MARKET REPORT 2013 31
India’s coal mining industry therefore remains largely in public hands, with more than 90% of hard coal produced in mines operated by a public company. As Table 1.7 also shows, 2010/11 marked the first year in recent Indian history that private companies produced lignite, yet public companies’ share of lignite output was still close to 98% in 2011/12. The largest public coal mining company is Coal India Limited (Ltd.) (CIL), which consists of eight regional subsidiaries. The company supplies around 80% of total Indian hard coal supply per year; three of its eight subsidiaries have a higher output than any other coal mining company in India.
Table 1.7 India’s hard coal and lignite production by company (in Mt)
Company Type of coal 2009/10 2010/11 2011/12
CAGR (2009/10-2011/12)
Share of production in 2011/12
CIL Hard coal 431.3 431.3 435.8 0.5% 80.7% South Eastern Coalfields Ltd.
(SECL) Hard coal 108.0 112.7 113.8 2.7% 21.1%
Mahanadi Coalfields Ltd. (MCL) Hard coal 104.1 100.3 103.1 -0.5% 19.1%
Northern Coalfields Ltd. (NCL) Hard coal 67.7 66.3 66.4 -0.9% 12.3% Central Coalfields Ltd. (CCL) Hard coal 47.1 47.5 48.0 1.0% 8.9% Western Coalfields Ltd. (WCL) Hard coal 45.7 43.7 43.1 -2.9% 8.0% Remaining three CIL subsidiaries Hard coal 58.7 60.9 61.4 2.3% 11.4%
Singareni Collieries Company Ltd. (SCCL) Hard coal 50.4 51.3 52.2 1.8% 9.7%
Other public companies Hard coal 2.4 2.4 2.7 7.2% 0.5% All public companies Hard coal 484.0 485.1 490.7 0.7% 90.9% All private companies Hard coal 48.0 47.6 49.2 1.2% 9.1% Total Hard coal 532.0 532.7 539.9 0.7% 100.0% Neyveli Lignite Corporation (NLC) Brown coal 22.3 23.1 24.6 4.9% 57.0% Gujarat Mineral Development Corporation Ltd. (GMDCL) Brown coal 8.4 10.2 11.3 16.4% 26.3%
All public companies Brown coal 34.1 37.1 42.3 11.4% 98.0% All private companies Brown coal 0.0 0.6 0.8 - 2.0% Total Brown coal 34.1 37.7 43.1 12.5% 100.0%
Source: Indian Ministry of Coal (2012), Annual Report 2011-2012, Indian Ministry of Coal, New Delhi.
Table 1.7 reveals another of India’s main challenges in sustaining high economic growth, i.e. the stagnating domestic coal supply. CIL in particular has failed to meet the expected output growth targets, posting a CAGR of only 0.5% per year over the last three fiscal years. Accordingly, CIL missed (by 85 Mt) its original 521 Mt production target for 2011/12, as stated in the previous 11th FYP. Overall deviation of India’s hard coal production from target exceeded 140 Mt. While total coal demand was also not in line with initial projections (696 Mt versus a projected 731 Mt for 2011/12), it did grow fast enough to cause a strong increase in Indian coal imports during the 11th FYP period (see “Recent trends in international coal trading”). Coal mined in India typically has low to medium calorific value (net calorific value ranges from 3 500 kilocalories per kilogram (kcal/kg) to 5 000 kcal/kg), high ash content (30% to 45%), and low sulphur and moisture content. Around 90% of Indian coal is mined in open-cast operations, and the remainder underground. Productivity is still relatively low, with a reported average output per manshift of 0.7 t in underground operations and 10 t in open-cast mines. An estimated 12% of underground mines still use
© O
EC
D/IE
A, 2
013

RECENT TRENDS IN DEMAND AND SUPPLY
32 MEDIUM-TERM COAL MARKET REPORT 2013
manual loading operations and suffer from particularly low productivity (Indian Ministry of Coal, 2011). Hence, one key to increasing indigenous coal supply in India would be to raise the share of automated production technologies, such as longwall mining and continuous miners in underground operations.
Table 1.8 ROM prices for non-coking coal produced by CIL (USD/t)
Gross calorific value (GCV) (in kcal/kg) Power sector (USD/t) Non-power sector (USD/t) > 7 000 86 + 2.66 * (GCV - 7 000) 86 + 2.66 * (GCV - 7 000) 6 100-7 000 62-86 62-86 5 200-6 100 25-50 33-50 4 300-5 200 15-22 21-30 3 400-4 300 11-12 15-17 2 200-3 400 7-10 10-13
Notes: USD/t = USD per tonne. Here, power sector includes the fertiliser and defence sectors. Prices as of 27 May 2013. For WCL, different prices apply. Conversion from Indian rupees to USD used the average exchange rate of 30 May 2013.
Source: Coal India Limited (CIL) (2013), Annual Report & Accounts 2011-2012, CIL, Kolkata.
Since 1 January 2000, CIL has been allowed to set the prices of ROM coal production for all its subsidiaries in relation with market prices. Before that date, prices were determined by the government, which used a production cost index to update prices every six months. CIL fixes its ROM prices at different levels, depending on which of its subsidiaries produces the coal, the GCV of the coal and the end-user. Table 1.8 shows that as of 27 May 2013, ROM prices for non-coking coal spanned a wide range, from USD 7/t for coal with a GCV as low as 2 200 kcal/kg to USD 86/t for coal with a GCV up to 7 000 kcal/kg. Should the GCV of the mined coal exceed the latter threshold – which rarely happens in India – USD 2.66/t are added to the USD 86/t for each 100 kcal/kg in excess of 7 000 kcal/kg.
Table 1.9 Development of average royalties paid by largest Indian coal producers (USD/t)
2009/10 2010/11 2011/12
CIL 2.30 2.43 2.51 SCCL 2.67 3.31 3.03 NLC 1.47 1.49 1.49
Sources: Indian Ministry of Coal (2013), Annual Report 2012-2013, Indian Ministry of Coal, New Delhi; IEA analysis.
India’s mining companies used to pay royalties to the Indian government based on a system that included both a fixed and a variable component. Table 1.9 displays the development of the average royalties paid per tonne under this system. Hard coal producers (as shown in Table 1.7, CIL and SCCL accounted for almost 90% of Indian hard coal production) were charged between USD 2.5/t and USD 3/t in 2011/12. By contrast, India’s largest brown coal producer, NCL, paid only USD 1.50/t. Since 10 May 2012, royalties are no longer based on a fixed and a variable component; rather, they are calculated solely as a constant percentage of value, i.e. the ROM prices. The royalty is fixed at 6% of the value of brown coal and at 14% of the value if the sold product is classified as hard coal. Besides royalties and mining and processing costs (see Box 1.1 for details), transport costs are another important component that determines the price of coal to Indian end-users. In 2012, railway transport (sometimes combined with coastal shipping) accounted for around 73% of total hard coal transport (if merry-go-round [MGR] systems11 are included), with the remainder distributed among road transport (circa 25%) and belt-conveyors or ropeways (circa 2%). The Indian railway system belongs to Indian 11An MGR system is defined as a closed-circuit dedicated rail transportation system.
© O
EC
D/IE
A, 2
013

RECENT TRENDS IN DEMAND AND SUPPLY
MEDIUM-TERM COAL MARKET REPORT 2013 33
Railways, which is owned and operated by the Indian government. In India, railway tariffs increase in absolute terms with total transport distance, but decrease in relative terms. While transporting coal over 100 kilometres (km) currently costs USD 2.80/t, transporting the same amount over 1 000 km costs USD 20.75/t – a reduction of more than 25% per tonne-kilometre. With an average transport distance of 600 km to 650 km, transport costs add another USD 14/t to mining cash-costs and royalties.
Box 1.1 To wash or not to wash, that is the question
Coal is a sedimentary rock made from buried vegetation, transformed through the action of pressure and temperature along tens or hundreds of millions of years. The organic material was usually accompanied by some inorganic material, impurities in the form of mineral matter, also commonly known as ash. Sometimes, the impurities have been added during the stripping process while mining. The proportion of ash in coal is very variable, from less than 10% in high-quality coal to more than 40% in poorer coal.
Coal washing (when combined with crushing, it is also called preparation, processing or beneficiation) is the process in which the raw (or ROM) coal is cleaned to remove a fraction of the ash and sulphur. Different processes exist for cleaning coal, most of them based on density difference between lighter coal and heavier rock, although finer-size coal can be cleaned by flotation, with very few other methods to separate coal from ash. The most common way to wash coal is by (usually magnetite-based) dense media separation, in which crushed ROM coal is introduced into cyclones or a bath, where the heavier rock goes to the bottom while the lighter coal floats in suspension and is removed for drying.
Ash has several negative effects: transportation costs per energy unit are higher, since ash (which has no useful heating value) is also being transported together with coal; power plant efficiency is lower, since heat transmission is hampered by ash; and plant operation and maintenance are generally more difficult due to corrosion, fly and bottom ash removal, etc. Higher ash contents also lead to higher pollutant emissions, while the lower efficiencies lead to higher CO2 emissions. Therefore, ash is an undesirable component of coal. End-users want coal of a certain quality; furthermore, consistent quality is as important as quality itself. Blending may help in this regard. The question is why most of the thermal coal worldwide is not washed, considering that coal washing improves coal quality, and hence coal prices, and saves money in coal transportation and end-use at the consumption point.
To begin with, coal and ash discrimination is not perfect and the final result is two fractions with higher and lower calorific value than the original ROM coal. Unless there is a power plant nearby that is able to burn the rejected fraction, part of the energy contained in the ROM coal is lost. While it is difficult to assign a number to that rejection fraction, it can typically range from 5% to 20%. This fraction, when it is not burned in a power plant, also needs to be disposed of in an environmentally friendly manner, which may be very problematic. Finally, in places (like India) with a coal shortage, the energy contained in the rejected fraction is an issue.
Costs are very variable. For example, if we clean raw coal of 4 000 kcal/kg and 38% ash, one of the possibilities is to obtain two fractions: a fraction (0.8 of the original raw coal) with 4 500 kcal/kg and 30% ash and another one (0.2 of the raw coal) with 2 000 kcal/kg and 70% ash. If the poorer fraction is not used, we lose 10% of the energy contained in the raw coal. Regarding the economics, if we assume USD 50/t as variable mining costs and USD 5/t as washing costs, the cost of washed coal is 37% higher on a tonnage basis and 22% higher on an energy basis.
Consequently, washing coal that does not need to travel too far is a complex issue. Theoretically, washing should be driven by the market, but market failure (largely associated with skipped externalities) often makes it unprofitable. A policy or regulatory framework that makes it obligatory to internalise externalities (such as emissions) would help promote the use of cleaner coal, with positive impacts on plant efficiencies, emissions and the environment.
Where met coal is concerned, its higher specifications generally make washing an obligation rather than an option.
© O
EC
D/IE
A, 2
013

RECENT TRENDS IN DEMAND AND SUPPLY
34 MEDIUM-TERM COAL MARKET REPORT 2013
Special focus: met coal in Russia According to the German Federal Institute of Geosciences and Natural Resources, global hard coal reserves total 755 Gt (BGR, 2012). Russia accounts for approximately 9% (69 Gt) of global hard coal reserves, ranking it as the forth-largest holder of hard coal reserves worldwide. The total balance of coking coal reserves is 36 Gt, of which almost four-fifths are located in Siberia’s Kuznetsky basin. The other two important basins are the South Yakutsky basin (4 Gt) in the Far East Federal District and the Pechorsky basin (3.2 Gt) in northwest Russia. Minor resources are also found in Sakhalin (close to the Pacific Ocean and the Chinese border), the Irkutsky basin (another Siberian coal deposit) and the Donetsky basin (close to the Russian border with Ukraine). In 2012, Russian coking coal production totalled 75 Mt, up from 65 Mt in 2011. The Kuznetsky basin is the main source of coking coal, accounting for over 70% of Russian coking coal production in 2012, followed by the Pechorsky basin (15%) and the Yakutsky basin (13%). The remainder is mined mainly in the Donetsky basin. As Table 1.10 shows, the single most common type of coking coal mined in Russia is fat coal, comprising approximately one-quarter of the country’s annual production. Fat coal refers to medium-rank bituminous coals with relatively strong caking properties, which are usually blended with gas-coal and lean coal to improve coke quality.12
Table 1.10 Characteristics of different Russian coking coal types
Coal type Coal grade (Russia)
Yield of volatile matter on dry,
ash-free basis (%)
Vitrinite reflectance index, Ro (%)
Indicative share of Russian coking
coal production (%) Gas fat coal GZh > 38 0.5-0.99 5 Gas fat semi-lean coal GZhO < 38 < 0.99 5 Coke coal K 24-28 1.0-1.69 15 Coke semi-lean coal KO 24-28 0.8-1.39 10 Coke (low caking) KS < 30 1.1-1.69 20 Coke (low caking, low metamorphic) KSN < 30 0.8-1.09 4
Semi-lean caking coal OS < 20 1.3-1.79 5 Fat coal Zh 28-36 0.8-1.19 25
Note: Ro = reflectance in oil.
Sources: IEA analysis based on various sources.
Mechel – or to be more precise, its subsidiary Yakutugol – is responsible for the bulk share of coking coal production in the South Yakutsk basin. Yakutian coking coal is produced in the Neryungrinsky and Elga mines. While Neryungrinsky coking coal has mostly low-volatile content, Elga’s main product is high-volatile coking coal. In 2012, Mechel’s ROM coking coal production totalled 9 Mt (8.8 Mt from the Neryungrinsky mine and the remainder from the Elga mine – marking the first year it supplied coking coal). One of the world’s largest coking coal deposits, Elga was projected to ramp-up its annual coal production capacity to 9 Mt by 2015 and 27 Mt by 2021, but it will be delayed two or three years due to current low prices. According to Mechel’s 2012 annual report (Mechel, 2012), ROM production resulted in 5.4 Mt of saleable coking coal. 12 Strong caking properties are defined as the ability of a coal to be softened, liquefied and re-solidified into hard and porous lumps that are strong enough to resist the weight of overburden in the blast furnace.
© O
EC
D/IE
A, 2
013

RECENT TRENDS IN DEMAND AND SUPPLY
MEDIUM-TERM COAL MARKET REPORT 2013 35
The Pechorsky basin, the second-largest coal producing region in Russia, is located in the Komi Republic in Russia’s northeast. The basin’s coking coal is produced in Vorkutaugol (for example, in the Vorgashorskaya underground mine) using longwall mining techniques. Coking coal production from Vorgashorskaya is currently primarily GZhO coal (semi-soft coking coal), but the mine’s southwestern coking coal reserves (around 12 Mt), which will be developed over the next years, also include higher quality Zh coal. In 2012, ROM production totalled 13 Mt, including 8.3 Mt sold as beneficiated coking coal concentrate (more than 90%) or raw coking coal. Kemorovo, home of the Kuznetsky basin, is by far the most important mining region in Russia in terms of both thermal and coking coal. Among the biggest producers in the Kuznetsk basin is Yuzhkuzbassugol, a subsidiary of the Russian vertically integrated steel company Evraz, which is listed in London. In 2012, Yuzhkuzbassugol produced 8.5 Mt of raw coking coal (mainly hard and semi-hard coking coal, Russian grades Zh, GZh and KS) from its six coking coal mines in Kemorovo, a 35% increase over 2011 levels (6.3 Mt). The company used its 2012 production to generate 5 Mt of coking coal concentrate (+14% compared with 2011) from three washing plants. Since the beginning of 2013, Evraz has been the major stakeholder (81% interest) in Raspadskaya, another important coking coal miner in the Kemorovo region (7 Mt of ROM coking coal production in 2012 from three underground and one open-pit mine in the Kuznetsky basin). Due to this interest, Evraz has become Russia’s largest coking coal miner, in front of Mechel, which previously held this position.
Table 1.11 Selected Russian coking coal producing companies (Mt)
Company name Location of mines
Coking coal concentrate Raw production
2011 2012 Change (2011-12) 2011 2012 Change
(2011-12)
Mechel South Yakutsky and Kuznetsky basins 9.8 9.5 -3% 13.1 14.7 12%
Severstal Pechorsky basin 7.9 8.1 3% x x x Sibuglemet Kuznetsky basin 6.3 7 12% x x x Raspadskaya Kuznetsky basin 4.6 5.0 8% 6.3 7.0 12% Evraz* Kuznetsky basin 4.4 5.0 13% 6.3 8.5 35%
* Evraz also processes coal from third parties (2.1 Mt in 2011 and 1.5 Mt in 2012).
Sources: IEA analysis based on various sources.
In addition to its status as an important country for coking coal, Russia is also the third-largest supplier of anthracite, behind China and Viet Nam. Anthracite is categorised as standard grade (SG), high grade (HG) and ultra-high grade (UHG). While SG is mainly used in power generation, the other two are used in metallurgy, either for sintering or (in the case of UHG) as a direct substitute for coke. Russian anthracite production currently derives from five mines: two in the Kuznetsky basin and three in the Donetsky basin in southwest Russia. In addition to ranking third in total global anthracite production, Russia ranks first in supply of HG and UHG anthracite to the global coal market, with annual exports of approximately 9 Mt in 2012. In general, Russian miners benefit from good geological conditions, allowing them to produce coking coal mostly in open-pit mines. As seen in Figure 1.11, production costs are therefore modest (from as low as USD 22/t to up to USD 60/t) compared with countries like Australia and the United States. However, the large transport distances result in high railway transport costs (see “Special focus: coal transportation in Russia” in the chapter “Recent Trends in International Coal Trading”). This is particularly
© O
EC
D/IE
A, 2
013

RECENT TRENDS IN DEMAND AND SUPPLY
36 MEDIUM-TERM COAL MARKET REPORT 2013
true for the Kuznetsky basin in Siberia. Coking coal railway transport from this region to the export ports in eastern and western Russia costs on average USD 45/t. Another USD 8/t to USD 10/t must be tacked on for washing, loading and port handling, although these costs (particularly port handling fees) can vary widely depending on the export port.
Figure 1.11 Indicative breakdown of coking coal export costs (free-on-board) for Siberian production
Notes: “other costs” include loading, port handling and washing costs. Transports costs are calculated based on typical distance to export port.
Sources: Wood MacKenzie (2013), “Coal modelling”, workshop presentation at the IEA, Paris, 25-26 April; IEA analysis.
Between 2006 and 2012, global coking coal export capacity increased by 79 Mt, from 209 Mt in 2006 to 286 Mt in 2012. While export capacity grew substantially in the United States (+37 Mt), Mongolia (+19 Mt) and Australia (+18 Mt), Russian export potential rose by 7 Mt, to a total of 18 Mt in 2012. That same year, Russia exported 18 Mt of coking coal, a 4 Mt increase over 2011 (14 Mt). Most Russian coking coal exports via the far eastern ports are mined in the South Yakutsky basin; more than 4 Mt is exported from this region to Asia. References BGR (Bundesanstalt für Geowissenschaften und Rohstoffe) (2012), Energy Study 2012: Reserves, Resources and Availability of Energy Resources, BGR, Hannover. CIL (Coal India Limited) (2013), Annual Report & Accounts 2011-2012, CIL, Kolkata. EIA (US Energy Information Administration) (2013a), Quarterly Coal Reports 2002 through 2012, EIA, Washington, DC. EIA (2013b), Annual Energy Review, EIA, Washington, DC. EIA (2013c), Natural Gas Prices, EIA, Washington, DC. EIA (2013d), Quarterly Coal Distribution Report, EIA, Washington, DC.
0
20
40
60
80
100
120
140
0 5 10
USD/t
Export capacity (Mt)Kuznetski basin (transport costs)Kuznetski basin (other costs)Kuznetski basin (cash mining costs)
0 5
Other Russia (transport costs)Other Russia (other costs)Other Russia (cash mining costs)
© O
EC
D/IE
A, 2
013

RECENT TRENDS IN DEMAND AND SUPPLY
MEDIUM-TERM COAL MARKET REPORT 2013 37
IEA (International Energy Agency) (2013), Coal Information 2013, OECD/IEA, Paris. IEA (2012), Medium-Term Coal Market Report 2012, OECD/IEA, Paris. IEA (2011), Medium-Term Coal Market Report 2011, OECD/IEA, Paris. Indian Ministry of Coal (2013), Annual Report 2012-2013, Indian Ministry of Coal, New Delhi. Indian Ministry of Coal (2012), Annual Report 2011-2012, Indian Ministry of Coal, New Delhi. Indian Ministry of Coal (2011), Annual Report 2010-2011, Indian Ministry of Coal, New Delhi. Mechel (2012), Annual Report, Mechel, Moscow. Planning Commission (government of India) (various years), Twelfth Five-Year Plan, Planning Commission, New Delhi. World Steel Association (various years), Crude Steel Production, Brussels, World Steel, www.worldsteel.org/statistics/crude-steel-production.html. UNSD (United Nations Statistics Division) (2013), GDP and its breakdown at constant 2005 prices in US Dollars, New York, http://unstats.un.org/unsd/snaama/dnllist.asp. Wood MacKenzie (2013), “Coal modelling”, workshop presentation at the IEA, Paris, 25-26 April.
© O
EC
D/IE
A, 2
013

RECENT TRENDS IN INTERNATIONAL COAL TRADING
38 MEDIUM-TERM COAL MARKET REPORT 2013
2. RECENT TRENDS IN INTERNATIONAL COAL TRADING
Summary • International seaborne coal trade again grew strongly in 2012. Total trade volume reached an
estimated 1 137 million tonnes (Mt) in 2012 – 250 Mt from metallurgical coal (met coal) and 887 Mt from steam coal. This is a 12% growth from 2011 figures.
• International seaborne steam coal trade volume increased for the 19th year in a row. While total trade volume has doubled since 2003, coal remains a mainly domestic primary energy source: less than 17% of global demand is traded internationally.
• People’s Republic of China imported more coal than ever before. China imported 301 Mt, an amount until now never imported by any country in one year. Taking into account domestic shipments along the Chinese coast, China alone received nearly as much coal by ship in 2012 as the rest of the world combined.
• Based on energy content, Indonesia became the world’s leading exporter of coal in 2012, with total annual exports reaching an estimated 383 Mt. Indonesia has more than sextupled coal export volumes since 2000. The country accounted for 43% of global steam coal trades in 2012.
• In 2013, thermal and met coal prices have been driven to a three-year low. Oversupplies of coal, combined with lower-than-expected demand, have put pressure on prices. In July 2013, import prices for steam coal dropped to United States dollar (USD) 73 per tonne (USD/t) in Europe and USD 85/t in Asia.
• Current coal prices squeeze margins or make mines produce below operating costs. This has triggered drastic cuts – including cost reductions, layoffs and optimisation – in the mining business worldwide.
The seaborne hard coal market The market for seaborne traded hard coal has again seen substantial growth (see Figure 2.1). In 2012, the total traded volume amounted to 1 137 Mt. A significant portion can be attributed to the seaborne thermal coal market, which grew for the 19th consecutive year, with a total of 887 Mt traded in 2012. After a slight decline in 2011, seaborne met coal trade increased by 7 Mt, to a total of 250 Mt in 2012. Seaborne thermal coal trade Although the seaborne thermal coal trade has seen a history of continuous and strong market growth in recent years, its share of total global thermal consumption is still relatively small. In 2012, only 15.3% of globally consumed thermal coal was traded on the seaborne market and an additional 1.3% traded overland. Most global consumption, therefore, is domestically produced. Nevertheless, seaborne thermal coal trade has increased its share of total consumption by 3.1 percentage points since 2008.
© O
EC
D/IE
A, 2
013

RECENT TRENDS IN INTERNATIONAL COAL TRADING
MEDIUM-TERM COAL MARKET REPORT 2013 39
Figure 2.1 Development of the seaborne hard coal market, 2000-12
* Estimate.
Notes: unless otherwise indicated, all material in figures and tables derives from International Energy Agency (IEA) data and analysis. Due to a methodological change in deriving seaborne trade volumes, the 12% growth rate in 2012 must be taken with some caution. Nevertheless, the markets for both the seaborne met and thermal coal trades grew substantially between 2011 and 2012.
Figure 2.2 Trade flows in the seaborne steam coal market, 2012
Note: statistical differences have been corrected to match import and export flows. This figure must therefore be regarded as indicative.
0%
2%
4%
6%
8%
10%
12%
14%
0
200
400
600
800
1 000
1 200
2000 2001 2002 2003 2004 2005 2006 2007 2008 2009 2010 2011 2012*
Mt
Steam coal Metallurgical coal Annual growth (right axis)
Seaborneimports to the Atlantic basin
206 Mt(+2)
Seaborneimports to the Pacific basin
681 Mt(+111)
Seaborneexports from the
Atlantic basin135 Mt(+18)
Seaborneexports from the
Pacific basin582 Mt(+82)
Seaborne exports from South Africa
74 Mt(+6)
113 Mt (+15) 22 Mt (+3)
563 Mt (+85)18 Mt (-3)
Seaborne exports from
Russia97 Mt
(+7)
51 Mt (-4)
49 Mt (+12)
46 Mt (+11)
24 Mt (-5)
Atlantic basin Suppliers to both markets Pacific basin
Total global trade volume 887 Mt (2012)
(+113 Mt 2011/12)
© O
EC
D/IE
A, 2
013

RECENT TRENDS IN INTERNATIONAL COAL TRADING
40 MEDIUM-TERM COAL MARKET REPORT 2013
The seaborne coal market is generally divided into two geographic areas, the Atlantic and the Pacific basins, which are both represented in Figure 2.2. The Pacific basin comprises all Asian countries, Australia and the west coast of North America and South America; the Atlantic basin comprises the remaining countries. Because of their geographic location, Russia and South Africa supply relevant volumes of coal to both basins and are labelled “swing suppliers” in the seaborne thermal coal market. The Pacific basin continued its massive market growth, reaching 681 Mt of total imports in 2012 and attracting more than 75% of the global seaborne thermal coal trade. Trade to the Atlantic basin increased slightly (+2 Mt). Imports from the Pacific basin grew by over 20% (111 Mt) between 2011 and 2012. Incremental volumes were supplied mainly by Pacific basin exporters, which increased total exports to 582 Mt in 2012. However, Atlantic basin exporters and the swing suppliers, South Africa and Russia, also increased their trade volumes to the Pacific basin. The flow shift is apparent when looking at both Russia and South Africa, which increased exports to the Pacific basin while reducing exports to the Atlantic basin. In 2012, 66% of South African exports were destined for the Pacific basin, compared to earlier in this century, when more than 80% were destined for the Atlantic basin. Although Russia is still a major supplier to the Atlantic basin via its northern and western ports, its exports increasingly tend eastward to satisfy surging Asian import demand. Seaborne met coal trade At least in relative terms, met coal is considered more of an internationally traded commodity than thermal coal. In 2012, countries imported roughly 30% of their global met coal consumption, 85% of it seaborne. Hence, global seaborne trade of met coal reached a record level of 250 Mt in 2012, up from 243 Mt in 2011 (see Figure 2.3).
Figure 2.3 Trade flows in the seaborne met coal market, 2012
Note: statistical differences have been corrected to match import and export flows. This figure should therefore be regarded as indicative.
Imports of met coal to the Atlantic basin, i.e. Europe and Latin America, slightly decreased (-5 Mt) to 70 Mt in 2012. The entire market growth can therefore be attributed to Pacific basin imports, which
Seaborneimports to the Atlantic basin
70 Mt(-5)
Seaborneimports to the Pacific basin
179 Mt(+12)
Seaborneexports from the
Atlantic basin90 Mt
(+3)
Seaborneexports from the
Pacific basin159 Mt
(+4)
45 Mt (-6) 45 Mt (+9)
134 Mt (+3)25 Mt (0)
Atlantic basin Pacific basin
Total global trade volume 250 Mt (2012)
(+7 Mt 2011/12)
© O
EC
D/IE
A, 2
013

RECENT TRENDS IN INTERNATIONAL COAL TRADING
MEDIUM-TERM COAL MARKET REPORT 2013 41
stood at an estimated 179 Mt in 2012, a 12 Mt increase over 2011. While some incremental volumes came from the Pacific basin (namely Australia), most came from the Atlantic basin, namely major met coal exporters Canada and the United States, which decreased exports to the Atlantic basin to satisfy surging import demand in the Pacific basin. Nonetheless, most (75%) Pacific basin imports are still sourced in the region. Regional analysis The following section will focus on recent trends in international coal trading on a country basis for the main importing and exporting countries. Exporters Indonesia
In 2012, Indonesia increased total hard coal exports to 383 Mt, replacing Australia as the world’s largest exporter of hard coal on the basis of both tonnage and energy content. The country has seen impressive export growth since the beginning of the 21st century: in 2000, Indonesia exported around 57 Mt, an amount that has increased by a factor greater than 6 in 12 years. Thus, Indonesia is one of the driving forces behind the spectacular growth of the global coal seaborne trade, accounting for more than 60% of incremental thermal coal seaborne trade since 2000 (see Figure 2.4). While the country produces less than 6% of global coal, it has a market share of 43% of global thermal coal seaborne export volume.
Figure 2.4 Development of Indonesian export destinations, 2000-12
*Excludes Chinese Taipei.
Note: ROW= rest of world. Due to a methodological change in deriving Indonesian exports, export growth in 2010/11 and 2011/12 might have been slightly different than the figure suggests.
Sources: McCloskey (2013), McCloskey Coal Reports 2010-2013, McCloskey’s, London, http://cr.mccloskeycoal.com; IEA analysis.
Indonesian coal exports have been surging, particularly since 2008. Incremental exports from then to now total over 180 Mt. China and India are the main drivers of that growth, as China increased its
0
50
100
150
200
250
300
350
400
450
2000 2001 2002 2003 2004 2005 2006 2007 2008 2009 2010 2011 2012
Mt
China India Korea Other developing Asia* Japan Chinese Taipei ROW
© O
EC
D/IE
A, 2
013

RECENT TRENDS IN INTERNATIONAL COAL TRADING
42 MEDIUM-TERM COAL MARKET REPORT 2013
Indonesian imports by 101 Mt and India by 70 Mt over the last five years. In 2012, China accounted for 33% of Indonesian exports, and India for 25%. Due to its relatively low calorific values and high moisture, Indonesian coal is sold at a discount when comparing prices adjusted for energy content. This attracts importers from India and China, where coal plants are suited to handle this kind of coal quality. Preliminary figures indicate that the export surge will continue in 2013, although torrential rains were reported in Kalimantan and Sumatra in the first quarter of 2013. The production volumes of big players such as Bumi and Adaro rose in the first half of 2013. The average selling price, however, dropped by 20%, resulting in tougher economic conditions, particularly for smaller producers. Furthermore, competition for barge loading slots in South Kalimantan has increased. Australia
Replaced by Indonesia as the largest hard coal exporter on a tonnage basis in 2011, Australia was once again surpassed by Indonesia in 2012, this time on an energy content basis. However, it is still the world’s largest coal exporter in terms of revenue, with 4.5% average growth per year since 2007. The commissioning of new mine, rail and port capacity in Queensland and New South Wales, combined with surging import demand in Asia, has driven this trend. Total hard coal exports were an estimated 302 Mt in 2012 (+17 Mt over 2011), mainly driven by thermal coal exports (+15 Mt). At 142 Mt in 2012 (+2 Mt over 2011), met coal exports remained below their record level of 157 Mt in 2010. Nevertheless, Australia remains the world’s largest met coal exporter by far. Incremental exports were almost entirely destined for China, which accounted for 20% of Australian exports in 2012; they were also fostered by increasing imports from Japan. In 2012, Australia exported 87% of total Australian hard coal production, generating revenues of USD 42 billion (-USD 5.6 billion compared with 2011). The lower prices for met coal resulted in decreased revenues (-USD 6.8 billion). While thermal coal exports rose more than 10%, thermal coal revenues grew less than 8%, also indicating lower prices. Russia
Russia remains the world’s third-largest hard coal exporter, with total exports of 134 Mt (+10 Mt) in 2012 comprising 116 Mt of thermal coal and 18 Mt of met coal. Reacting to higher demand and higher prices in Asia, Russia is increasingly shifting its exports to the Asian market: 41% of its total hard coal exports were destined for Asia in 2012. Organisation for Economic Co-operation and Development (OECD) Europe and Non-OECD Europe/Eurasia remain the most important destination for Russian exports, with a share of 56%. A portion of Russian exports are overland transports to Non-OECD Europe/Eurasia. Russian seaborne exports are handled via various ports on the east coast (such as Vostochny and Vanino), the Black Sea (Tuapse in Russia and Mariupol in the Ukraine), the Barents Sea (Murmansk) or the Baltic Sea (Ust-Luga in Russia and Riga and Ventspils in Latvia). The crucial cost disadvantage for Russian coal exports stems from the enormous inland transport distances (see “Special focus: coal transportation in Russia”). United States
In 2012, coal exports from the United States reached an all-time high of 114 Mt, up from 97 Mt in 2011. Whereas the amount of exported met coal remained constant at 63 Mt, incremental exports derived entirely from steam coal. The bulk of incremental steam coal exports (+14 Mt) was destined
© O
EC
D/IE
A, 2
013

RECENT TRENDS IN INTERNATIONAL COAL TRADING
MEDIUM-TERM COAL MARKET REPORT 2013 43
for Europe and the Mediterranean region (particularly ports in the United Kingdom, the Netherlands and Italy), while exports to Asia increased by 3 Mt. A portion (2 Mt) of met coal trade shifted from Europe to Asia. More than 50% of total exports were shipped from east coast ports, including Baltimore and Norfolk/ Hampton Roads. The Gulf of Mexico coal terminals (in Mobile and New Orleans) doubled their export volumes between 2010 and 2012, to 38 Mt. Exports shipped from those ports are destined for Europe and Asia. Some minor volumes are exported via the west coast Canadian coal terminals, primarily destined for Korea (see Figure 2.5). Although hard coal exports grew 17% year-on-year, total export revenues shrank from USD 16 billion in 2011 to USD 14.9 billion in 2012. This was mainly due to the plummeting met coal prices in 2012, which drove down revenues by 18% compared to 2011. Although met coal export revenues declined significantly, to USD 10.6 billion, they were still over 10 times higher than in 2003. As for steam coal export revenues, they increased to USD 4.3 billion (+USD 1.2 billion).
Figure 2.5 Destinations of United States (US) coal exports, 2002-12 (left) and ports of US coal exports, 2002-12 (right)
Sources: EIA (US Energy Information Administration) (2013a), Quarterly Coal Reports 2002 through 2012, EIA, Washington, DC; IEA analysis.
Colombia
Colombian exports totalled 82 Mt in 2012, up from 78 Mt in 2011, almost all of which was thermal coal. This makes the country the fourth-largest thermal coal exporter in the world. The increase in exports is remarkable given the impediments to coal production and transport in 2012: strikes hit the La Jagua and La Franca mines and the Fenoco railway (one of the most important inland transport routes), reducing exports by an estimated 2 Mt to 3 Mt (VDKI, 2013). Additionally, Colombian producer Cerrejón suffered seven terrorist attacks on its railway and mines. Three companies/consortia accounted for more than 90% of all exports. Cerrejón, a consortium of BHP Billiton (BHPB), Glencore Xstrata and Anglo American, accounts for more than 40% of total exports. The second-largest, Drummond (which controls the open-pit mine Mina Pribbenow/El Descanso), increased year-on-year exports by 3 Mt, accounting for 32% of total exports. The third-largest, Prodeco, with an 18% share, belongs to Glencore Xstrata and operates the Calenturitas and La Jagua mines. All companies cover the entire export value chain of production, inland transport and port infrastructure.
0
10
20
30
40
50
60
70Mt
ROW Europe Asia Canada
0
10
20
30
40
50
60
70Mt
North West South East
© O
EC
D/IE
A, 2
013

RECENT TRENDS IN INTERNATIONAL COAL TRADING
44 MEDIUM-TERM COAL MARKET REPORT 2013
Colombian exports are traditionally destined for the Atlantic basin. In 2012, over 70% of exports went to Europe and over 20% to North and South America. However, exports to the United States (which purchased one-third of Colombian exports in 2006) declined by 2 Mt in 2012. In the first half of 2012, low freight rates and the free-on-board (FOB) price differentials (between USD 15/t and USD 25/t) of Colombian and Australian steam coal made Colombia more competitive in the Pacific basin, doubling its exports to Asia to 4 Mt (+2 Mt) compared with 2011. In the second half of 2012, the FOB price gap closed and Colombian exports to the Pacific basin were only slight. South Africa
Thanks to its geographic location, South Africa can competitively export coal to both the Atlantic and Pacific basins. Almost all hard coal exported from South Africa is thermal coal, most of which is exported through the Richards Bay Coal Terminal (RBCT), with some minor volumes shipped through Durban or Maputo (Mozambique). Although RBCT has an annual capacity of 91 Mt per year, South African exports stagnated in the last decade at around 70 Mt as bottlenecks in the rail infrastructure constrained exports. Nonetheless, in 2012 South Africa increased exports to 74 Mt (+6 Mt), retaining its status as the fifth-largest thermal coal exporter. This performance was helped by local railway operator Transnet, which reduced load and track maintenance times. While South Africa is still a rather low-cost coal producer, it has suffered significant cost increases in recent years.
Figure 2.6 Development of South African export destinations, 2003-12
Sources: McCloskey (2013), McCloskey Coal Reports 2010-2013, McCloskey’s, London, http://cr.mccloskeycoal.com; IEA analysis.
The structure of South African exports has completely changed within the last decade (see Figure 2.6). In 2003, 80% of South African coal was destined for Europe, compared with 15% in 2012. One reason is an oversupply of coal from the United States, Colombia and Russia, leading to comparatively low prices in Europe. Another reason is surging demand (and therefore higher prices) in Asia. Further, many Asian countries, such as China and India, require lower coal qualities than Atlantic market countries, and the quality of the South African coal has decreased. Since 2006, South African exports to Asia have increased from 3 Mt to 48 Mt. India was the major importer (23 Mt).
0
10
20
30
40
50
60
70
80
2003 2004 2005 2006 2007 2008 2009 2010 2011 2012
Mt
Japan and Korea China India Other developing Asia Europe ROW©
OE
CD
/IEA
, 201
3

RECENT TRENDS IN INTERNATIONAL COAL TRADING
MEDIUM-TERM COAL MARKET REPORT 2013 45
Canada
In 2012, Canada exported 31 Mt (+3 Mt) of met coal (making it the world’s third-largest exporter of met coal) and 4 Mt of steam coal. Exports were boosted by China (10 Mt, with an increase of 5 Mt), Japan (9 Mt) and Korea (6 Mt). Canadian met coal is primarily mined in the country’s western provinces of British Colombia and Alberta and shipped to Asia via important west coast coal terminals such as Westshore, Ridley and Neptune Bulk. Other countries
Poland (7 Mt in 2012) and the Czech Republic (6 Mt) are the largest hard coal exporters in OECD Europe. Poland exported more than 50% of its 5 Mt steam coal exports to Germany and most if its met coal exports to the Czech Republic. Around 3 Mt of Czech exports are met coal. Because of high mining cash-costs, European coal producers struggle especially hard at current coal price levels. Mongolia is the world’s fourth-largest met coal exporter, exporting exclusively to China. In 2012, Mongolia exported 19 Mt of met coal and 2 Mt of thermal coal to China. Transport is entirely by truck, since the production regions are close to the Chinese border and there is no railway infrastructure. Viet Nam exported 19 Mt of steam coal in 2012, mostly to China, with minor volumes destined for Japan and Korea. Vietnamese coal is anthracite quality. Sluggish domestic demand caused Viet Nam to grow exports by 1 Mt. However, the country’s coal exports have trended downward since their high of 32 Mt in 2007. Annual production has never exceeded 45 Mt. Domestic demand rose steadily over the last decade. Mozambique has attracted the attention of international mining companies, such as Rio Tinto, Anglo American and the Brazilian iron ore giant Vale. The Tete coal fields are among the largest and last remaining undeveloped coal regions in the world, with an especially high resource endowment of hard coking coal. While Mozambique saw its first year of significant exports (3 Mt) in 2012, the mining companies faced numerous problems: Rio Tinto had to write down 75% of its acquisition of Riversdale Mining, the Mozambican coal developer; the quality and quantity of the country’s met coal had been overestimated; the inland transport infrastructure in the impoverished country seemed to greatly constrain miners; and Rio Tinto’s plans to use the Zambezi River faced governmental opposition. Mining companies were said to be discussing building a shared infrastructure. Importers China
China increased its hard coal imports to 301 Mt in 2012, more coal than any country had ever imported in one year. China thus remains the largest coal importer, with a 24% market share of global imports. In 2012, it imported 234 Mt of steam coal and 67 Mt of met coal (+11 Mt). Preliminary data indicate that Chinese imports are likely to further increase (although at a slower rate) in 2013. Imports, however, comprised only a small part of total coal landings in China: the country shipped roughly 620 Mt of its domestic production through the China Sea from the coal-rich north to the south. With a market share of 41% in 2012 (+20 Mt over 2011), Indonesia is the main supplier of Chinese imports. In fact, Indonesian exports to China have risen by over 800% since 2008. Australia increased exports (+27 Mt) as well, accounting for 21% of Chinese imports in 2012. China also stepped up
© O
EC
D/IE
A, 2
013

RECENT TRENDS IN INTERNATIONAL COAL TRADING
46 MEDIUM-TERM COAL MARKET REPORT 2013
steam coal imports from Russia (+9 Mt), the United States (+4 Mt) and South Africa (+5 Mt), as well as met coal imports from Canada (+5 Mt). However, Mongolia remains its most important met coal supplier, as it exports its entire production to China. This spectacular increase in imports can be explained by the generally lower level of international coal prices compared to domestic prices. Despite a 17% import tax, purchasing coal from the international market can be a viable alternative to coal deliveries from the northern and central provinces, which often entail high transportation costs. This holds particularly true for coal importers in the coastal or southern regions. Additionally, the steady appreciation of the Yuan renminbi (CNY) against the USD and the Indonesian rupiah (IDR) since 2010 has created a competitive advantage for coal imports versus domestic coal. Chinese domestic producers (particularly small and medium-sized producers) are reported to incur higher production costs than current prices, whereas big companies continue to expand their operations. Japan
Japan has no significant domestic coal resources and depends entirely on imports. In 2012, Japan increased its hard coal imports to 184 Mt (+10 Mt). Growing coal-fired power generation had a positive impact on steam coal imports, which were higher than before the Great East Japan Earthquake. Met coal imports, on the other hand, slightly declined (-2 Mt). Japan is the second-largest steam and met coal importer, behind China. Although the country mainly purchases bituminous coal, transactions of sub-bituminous coal are increasing. With a 62% share of total hard coal imports in 2012, Australia is Japan’s dominant supplier. Japan purchased 32 Mt of coking coal and 81 Mt of steam coal from Australian coal producers, who provided nearly all of its incremental imports. The second-largest import source (20%, or 37 Mt) is Indonesia, followed by Russia (13 Mt), Canada (9 Mt) and the United States (6 Mt) – the latter two mainly providing met coal. India
India is the third-largest hard coal importer, with a total of 160 Mt (+28 Mt) imported in 2012. Thermal coal comprises the bulk of incremental imports (+25 Mt). While domestic coal production supplied around 80% of Indian demand in 2012, it was not able to keep up with recent demand growth. While coal demand grew annually by 6.8% since 2009, production only increased by 3.2% on average. Three countries, Indonesia, Australia and South Africa, contribute over 95% of Indian hard coal imports, as seen in Figure 2.7. Australia supplies 85% of India’s met coal imports. Indonesia (78%) and South Africa (19%) are the dominant exporters in the thermal coal market, tripling their exports to India since 2008 thanks to low production costs and comparatively short seaborne transport distances. United States contributes 4% of Indian hard coal imports of both met coal and steam coal and has also increased volume recently. Korea
For the first time since 2005, Korea slightly decreased its hard coal imports to 126 Mt in 2012 (-4 Mt over 2011). However, imports are still well above 2010 levels. Met coal imports decreased (-1 Mt) due to a slight decline in Korean pig iron production, while lower power generation from coal had a negative impact on steam coal imports (-3 Mt). Korea has only minimal domestic coal reserves, and is therefore the fourth-largest importer of both thermal and met coal. Its primary hard coal supplier is
© O
EC
D/IE
A, 2
013

RECENT TRENDS IN INTERNATIONAL COAL TRADING
MEDIUM-TERM COAL MARKET REPORT 2013 47
Australia (with a market share of 36%), directly followed by Indonesia (30%), Russia (10%) and Canada (5%). The United States, China, Colombia and South Africa also provide minor volumes.
Figure 2.7 Development of Indian import sources, 2000-12
Sources: McCloskey (2013), McCloskey Coal Reports 2010-2013, McCloskey’s, London, http://cr.mccloskeycoal.com; IEA analysis.
Europe
The countries of OECD Europe increased hard coal net imports to 220 Mt (+5.8%) in 2012,1 in line with increasing demand. Whereas net imports of met coal slightly decreased (-2 Mt), steam coal imports rose (+14 Mt) thanks to low coal and carbon prices, driving coal-fired generation. The United States (40%) and Australia (nearly 30%) are the main suppliers of met coal. Russia is the most important source of steam coal (31%), followed by Colombia (27%) and the United States (16%). Main net importers in OECD Europe are Germany (20%), the United Kingdom (20%), Turkey (13%), Italy (11%) and Spain (9%). Besides seaborne imports, Europe is also supplied by significant overland transport volumes. Germany’s hard coal net imports decreased from 48 Mt in 2011 to 45 Mt in 2012, as higher consumption was absorbed by growing domestic production and less stock building. The country sources 90% of its met coal imports from Australia, the United States and Canada. Russia (30%), Colombia (27%) and the United States (22%) are its main sources of steam coal. Surging steam coal demand in the United Kingdom due to increased coal-fired generation drove up net imports by 38% compared with 2011. In 2012, the United Kingdom imported 44 Mt (net) of hard coal, including 39 Mt of steam coal. Russia (+4 Mt), the United States (+4 Mt) and Colombia (+3 Mt) most increased their trades to the United Kingdom. Turkey increased hard coal net imports (particularly of steam coal) in 2012 to 29 Mt (+5 Mt) and Spain to 21 Mt (+6 Mt). Russia, Colombia, South Africa and Spain are important suppliers of Turkish steam coal demand, although Indonesia (6 Mt) also plays an important role. 1 OECD Europe imports focus on net imports only, given that hard coal is traded among countries in OECD Europe (e.g. imports to the Netherlands are re-exported to Germany). Since there are no significant exports from OECD Europe to other regions, net imports represent those volumes that are imported by OECD Europe from other world regions, thereby accounting for coal transports within OECD Europe.
0
20
40
60
80
100
120
140
160
180
2000 2001 2002 2003 2004 2005 2006 2007 2008 2009 2010 2011 2012
Mt
United States South Africa Indonesia Australia Other
© O
EC
D/IE
A, 2
013

RECENT TRENDS IN INTERNATIONAL COAL TRADING
48 MEDIUM-TERM COAL MARKET REPORT 2013
Others
Chinese Taipei is fully dependent on hard coal imports, given that it has no significant coal resources. Chinese Taipei is the fifth-largest hard coal importer, importing an estimated 65 Mt in 2012 (-1 Mt compared to 2011). Its main suppliers are Indonesia (29 Mt, or 45%) and Australia (24 Mt, or 37%). Russia (3 Mt in 2012) and South Africa (5 Mt) provide additional significant seaborne imports. Malaysia and Thailand imported respectively a total of 22 Mt and 17 Mt of hard coal in 2012. Thailand satisfies around 50% of its coal demand through imports and the rest through local lignite production. Although the country relies predominantly on gas, coal-fired generation increased to 22% of total generation in 2011. More than three-quarters of total imports are sub-bituminous coal deliveries from Indonesia. Malaysia is much more dependent on imports, since only 10% of coal demand is produced locally. Although gas has traditionally played a major role in Malaysian power generation, the share of coal has increased to 40% in recent years. Brazilian hard coal imports stagnated at 18 Mt in 2012; 60% of imports are met coal, making Brazil the world’s fifth-largest met coal importer. Key suppliers are the United States (39%), Australia (16%) and Colombia (16%). For the fifth year in a row, US hard coal imports have declined. In 2010, the United States imported 18 Mt, compared with only 12 Mt in 2011 and 8 Mt in 2012. This development is not surprising, given sluggish US coal demand and growing US exports. Colombia has traditionally been a key supplier, accounting for more than 76% of total US imports in 2012. That said, US imports of Colombian coal were almost four times higher in 2006 than in 2012. Russia imported an estimated 31 Mt of hard coal in 2012, most of it transported overland from Kazakhstan. Special focus: coal transportation in Russia An analysis of the coal industry in Russia necessarily entails an in-depth look at railway coal transportation. No other country rails its coal production over larger distances than Russia. The average transport distance of Russian coal is almost 2 200 kilometres (km); some coal destined for export is even transported up to 6 000 km (see Figure 2.8). To put this into perspective, the mine-to-port distance for nearly the entire Colombian coal production destined for export does not exceed 210 km (the distance from Mina Pribbenow/La Loma to the port of Santa Marta). From 2006 to 2012, the export share of total Russian coal production grew by approximately 6 percentage points and consequently, the average transport distance of Russian coal was around 150 km higher in 2012 than in 2006. Given the large distances, transport costs account for a large share of Russian FOB costs. Depending on the port of export, Russian coal exporters typically pay between USD 40/t and USD 50/t for railway transport. Coking coal exports from the Yakutsky basin are a major exception, since the mines are located relatively close (1 500 km to 2 000 km) to the far eastern ports of Vanino and Vostochny. This means that transport costs comprise circa 45% to 55% of Russian FOB prices in the case of thermal coal exports and 25% to 30% (due to higher export prices) in the case of coking coal. Railway transport costs for Russian coal are essentially determined by two components, the daily railcar rental fee and the transport tariff. Coal exporters must pay rental fees to railcar owners. The market for gondola cars (a type of railcar used to transport coal; hereafter, railcar and gondola car are used interchangeably) is liberalised. This
© O
EC
D/IE
A, 2
013

RECENT TRENDS IN INTERNATIONAL COAL TRADING
MEDIUM-TERM COAL MARKET REPORT 2013 49
means that in addition to the large state-owned incumbent Russian Railways, a small number of privately owned companies (such as UCL Rail) offer their services. As a result, the cost of renting a railcar for 24 hours results from the interplay between supply and demand. Railcar rental fees can exhibit considerable volatility over time. Since June 2012, for example, daily rental rates for a railcar at least seven years old have fallen more than 50%, from around USD 45 per day (USD/d) to below USD 20/d in April 2013 (see Figure 2.10). In addition, the gap between rental fees for newer railcars (less than seven years old) and older ones has decreased substantially. While the difference amounted to almost USD 11/d on average from January 2011 until September 2012, it has since decreased to as low as USD 2.9/d in March 2013. This price drop is the result of a railcar oversupply caused by a large increase (on average 7% per year) in the total number of railcars since 2002 and a slower than expected increase in total freight (see Figure 2.9). A simple way to measure oversupply is productivity per railcar, i.e. the average number of tonne-kilometres per year per railcar. A closer look at Figure 2.9 shows that railcar productivity dropped significantly during the recent economic crisis and has yet to recover. While the initial decrease can mainly be attributed to the drop in economic activity (and hence in total transport volume), the absence of a substantial recovery during the last three years can be explained by a significant increase in available railcars, triggered by high rental fees prior to the economic crisis.
Figure 2.8 Development of railed coal volumes in Russia, 2006-12
Source: RZD (Russian Railways) (various years), Annual Report, RZD, Moscow.
Taking the average April 2013 daily rental rate (USD 22.80/d) of a new railcar with a transport volume of approximately 70 tonnes (t) and assuming that the average speed of a train transporting coal in Russia is 8 kilometres per hour (km/h) to 10 km/h according to industry sources, exporters had to pay USD 6.5/t to USD 8.5/t for railcar rental to transport 1 t tonne of coal over 5 000 km in the second quarter of 2013, compared with USD 15/t to USD 19/t in 2012. Besides railcar rental costs, coal transporters must pay a usage fee to state-controlled Russian Railways, which owns approximately 95% of the domestic railway system. Russian Railways freight tariffs differ according to the commodity transported (see Figure 2.11). It is obvious that coal producers pay the lowest freight rates of all the commodities shown, whereas oil producers pay the highest rates. One
0
20
40
60
80
100
120
140
160
< 499 500-1 999 2 000-3 999 4 000-5 999 > 6 000
Mt
km2006 2009 2012
Mainly domestically consumed coal Exported coal
© O
EC
D/IE
A, 2
013

RECENT TRENDS IN INTERNATIONAL COAL TRADING
50 MEDIUM-TERM COAL MARKET REPORT 2013
might therefore conclude that coal transport is cross-subsidised by oil transport, since the freight rate for oil is almost 3.5 times higher than for coal. However, having adjusted the freight rates of oil and coal for value (see the yellow line in Figure 2.11), measured as the export price per tonne, we find that freight rates for coal transportation have been more than twice higher on average than oil freight rates over 2005-13. Although no comprehensive data are available, this picture would likely look even more favourable to oil if industry profits were used instead of export prices to adjust freight rates.
Figure 2.9 Development of the number Figure 2.10 Development of rental fees of railcars and productivity in Russia of railcars in Russia
*Estimate.
Note: railcar productivity is measured in tonne-kilometres per year.
Sources: IEA analysis based on various sources.
Figure 2.11 Development of Russian Railways transport tariffs for select commodities, 2005-13
Notes: transport costs displayed in the figure are valid for a transport distance of 2 053 km. The ratio of value-adjusted transport tariffs refers to coal and oil (value-adjusted transport tariff of coal/value-adjusted transport tariff of oil). Export prices (FOB) of coal and oil were used to adjust the transport tariffs.
Sources: IEA analysis based on various sources.
0
20
40
60
80
100
0
20
40
60
80
100
Total number of railcarsIndexed productivity (right axis, 100 = 2007)
Railcars (thousand)
0
10
20
30
40
50
60USD/d
Older railcars (seven years or older)Newer railcars (less than seven years old)
0
0.5
1
1.5
2
2.5
3
0.00
0.01
0.02
0.03
0.04
2005 2006 2007 2008 2009 2010 2011 2012 2013
USD/tkm
Coal (left axis) Minerals and fertilizer (left axis)Oil (left axis) Ratio of value-adjusted transport tariffs
0
© O
EC
D/IE
A, 2
013

RECENT TRENDS IN INTERNATIONAL COAL TRADING
MEDIUM-TERM COAL MARKET REPORT 2013 51
Figure 2.11 compares the freight tariffs of different commodities over a transport distance of 2 053 km. However, as shown in Figure 2.13, the railway tariffs of coal (which also include fuel costs) differ widely depending on the transport distance. In other words, the tariff for transporting 1 t of coal over 50 km (USD 4.5 per tonne-kilometre [USD/tkm]) is almost nine times the tariff for 6 000 km (USD 0.5/tkm). Since most Russian coal used domestically is transported over a distance of less than 500 km (see Figure 2.8), domestic transport costs typically do not exceed USD 10/t, whereas export transport costs easily exceed USD 40/t (see Figure 2.12).
Figure 2.12 Indicative coal transport costs in Russia Figure 2.13 Distance-dependent by component and distance transport costs in Russia
Notes: the daily rental prices of railcars in Russia were based on the average price in 2012. The assumption on the average train speed is 8 km/h to 10 km/h; fuel efficiency was assumed to be 150 km per litre and the price of gasoline was assumed to be USD 0.40 per litre.
Source: IEA analysis based on various sources.
Besides the costs of coal transport, the inadequacy of the railway infrastructure in some regions in relation to transport volumes is another important issue for Russian coal producers. Transport bottlenecks are the result of underinvestment in railway infrastructure by Russian Railways over the last five to ten years. While Russian Railways should have invested approximately USD 4.3 billion per year to maintain and improve Russia’s railway system, it only spent USD 2.9 billion on average per year between 2006 and 2011. As a result, approximately 6 100 km (7.2% of the total length of the Russian railway system) were considered by Russia’s Federal Ministry of Transport and Communications as a bottleneck hampering railway transport in 2011. No improvement is in sight in the medium term.
Coal trading Since the Medium-Term Coal Market Report 2012 was released, the main developments in coal trading have taken place in the United States and China. This section will therefore focus on both countries, which also are the world’s main coal consumers. First, it is worth mentioning that the trend, first observed in 2011, of a large off-specs (low calorific or high sulphur) coal trade has been confirmed. This stems from the declining quality of coal in some of the main exporting countries, i.e. Australia, South Africa and Colombia, combined with growing demand on the part of countries accepting lower qualities, i.e. China, India and Korea. In order to reflect this growing demand, a new API5 index has been introduced, assessing the price of Australian coal for 5 500 kilocalories per kilogram (kcal/kg) FOB in Newcastle. It complements the API8 index, assessing imported coal in China, and the API3 index, launched in October 2013 and assessing FOB prices in Richards Bay (South Africa) for 5 500 kcal/kg net-as-received (NAR).
0
10
20
30
40
50
60USD/t
Transport distance (km)Railway tariff Fuel costs Railcar rental costs
0.00
0.02
0.04
0.06
0.08USD/tkm
Transport distance (km)
0
© O
EC
D/IE
A, 2
013

RECENT TRENDS IN INTERNATIONAL COAL TRADING
52 MEDIUM-TERM COAL MARKET REPORT 2013
The largest flow of low calorific value coal by far still goes from Indonesia to China. It is hard to know how long this will last, given the continuous rumours of a ban on low calorific value exports in Indonesia and low calorific value imports in China. Regional analysis
United States
After some years when gas prices were highly competitive with coal in the domestic market, leading to higher use of natural gas in power generation, the share of long-term and very long-term contract trading dropped, from more than 90% in 2011 to probably less than 40% in 2013. Most coal is therefore traded on shorter-term contracts (half-year to one year) and spot contracts (one- or two-month transactions). In the export market, coal is traded either at a fixed price or indexed basis, according to international practices. Since there are only three liquid indexes for US coals – 12 000 British thermal units per imperial pound (Btu/lb) Central Appalachian Big Sandy barge coal, 12 500 Btu/lb Central Appalachian CSX rail coal and 8 800 Btu/lb Powder River basin coal – some US coals are indexed to API2 or API4, the most liquid indexes worldwide. China
In December 2012, the General Office of the State Council of China issued the Guideline on Deepening the Market-oriented Reform of the Thermal Coal Sector, which featured a liberalisation plan for the coal sector. The gist of the guideline is that key contracts are cancelled and the allocation rights of railway transportation capacity are released, since coal firms and Independent Power Producers can now sign contracts at their own discretion without government intervention and contracting parties must negotiate directly with railway departments to secure transport capacity. While spot prices have been liberalised since 2003, the National Development and Reform Commission (NDRC) initially still published reference prices for key contracts at an Annual Coal Trade Fair. This mechanism, however, did not work well and the NDRC was often forced to intervene in disputes between coal and power consumers. In addition, the NDRC still released a framework for interprovincial railway transportation capacity allocation, according to key contracts signed between major coal miners and utilities. This new step towards full market liberalisation has been accompanied by other measures to establish a competitive and transparent market. In May 2013, it was announced that licensing producer and trader licensing were soon to be abolished. New indexes are being developed: apart from the most frequently used Bohai Rim Steam Coal Index reflecting steam coal prices at major loading ports, China Coal Price Index reflects price levels in eight different Chinese regions; this year, the China Taiyuan Coal Transaction Center launched the China Taiyuan Coal Transaction Price Index, covering steam coal, coking coal and pulverised coal injection (PCI) coal in Shanxi. A new internet-based trading platform was also launched in May in Shanxi. Combined, these developments show that China is moving towards a fully competitive and transparent market. Included in the guideline, the NDRC will no longer allocate or guarantee railway capacity. The government will encourage market-oriented coal transport, despite some priorities for long-term contracts signed by big coal firms. The NDRC is also trying to improve the coal-fired power linkage system, as on-grid electricity prices will be adjusted annually if coal prices change more than 5%. Further, utilities are required to absorb only 10% of the higher fuel costs, instead of 30% as previously mandated. Finally, the guideline tasked the China National Coal Association with collecting
© O
EC
D/IE
A, 2
013

RECENT TRENDS IN INTERNATIONAL COAL TRADING
MEDIUM-TERM COAL MARKET REPORT 2013 53
data on contract signatures and the manner in which these contracts are being honoured, as well as nurturing and developing a national coal market trading system. To secure rail capacity, the main coal and power producers signed term contracts in early 2013 for a large part of their production, with prices mostly linked at some discount to the Bohai index. Small producers, however, could not sign indexed contracts and sold at fixed prices. Having pushed for indexed price contracts, the big companies now seem willing to increase spot sales. It is too early to assess how this movement will evolve. Derivatives After dropping in 2011, coal derivative trade increased in 2012, as seen in Figure 2.14. API2 derivatives are still the most traded by far, with a churn ratio of well over 10. However, given API2 liquidity, it is used well beyond where the physical coal trade occurs. As with coal trading, the most interesting developments in coal derivatives occurred in China. The first swaps based on Chinese coal emerged in 2011. The API8 index for Chinese coal was launched in 2012 and is now a new reference for coal swaps. The first coal derivatives emerged in China in 2013 in what should be another step towards a transparent, liquid market. In March 2013, Dalian Commodity Exchange launched coking coal futures. In September 2013, Zhengzhou Commodity Exchange launched steam coal futures, based on 5 500 kcal/kg material with a sulphur content of less than 1%.
Figure 2.14 Development of trade volumes for coal derivatives, 2000-12
Note: API = Argus McCloskey’s Coal Price Index.
Source: IEA estimation based on various sources.
Prices Coal is not a homogeneous product, which is why there are different coal markets and coal prices (see Box 2.1). Figure 2.15 displays the development of three different Australian coal marker export prices between 2011 and 2013 for three different coal products: prime hard coking coal, low-volatile PCI coal and steam coal. The price curves indicate that different market dynamics drive the prices for different coal products, e.g. the Queensland flooding in late 2010 boosted coking coal prices in 2011, whereas steam coal prices did not react significantly.
0
500
1 000
1 500
2 000
2 500
3 000
2000 2001 2002 2003 2004 2005 2006 2007 2008 2009 2010 2011 2012
Mt
API2 API4 Other
© O
EC
D/IE
A, 2
013

RECENT TRENDS IN INTERNATIONAL COAL TRADING
54 MEDIUM-TERM COAL MARKET REPORT 2013
Box 2.1 The many prices of coal decoded
What is the price of coal? That is the first question that usually arises when discussing coal. The only answer is another question: which price? Unlike oil, coal is a domestic fuel: 85% of coal produced worldwide is consumed in the country where it was mined. Domestic markets are more or less exposed to international prices, which can vary significantly because of quality, geographic, contractual and regulatory aspects. In addition, different types of coal and purchase conditions, including time and point of delivery, make for a plethora of coal prices.
To begin with, coal is not a single product, but a family of many types of different rocks. While many classifications are in use, the main split for prices is non-coking (steam or thermal coal and lignite) and coking coal. Coking coal, which produces coke largely used for iron making, is of better quality – mainly in terms of caking properties – than non-coking coal. Hence, it commands a price premium, which makes it too expensive to burn for electricity or heat. Different supply and demand dynamics on coking and non-coking coal mean that prices follow different trends. For example, from November 2010 to May 2013 FOB thermal coal prices in Australia ranged from USD 80/t to USD 120/t and FOB prices for hard coking coal ranged from USD 150/t to USD 330/t.
Coking coal is not, however, a homogenous product: there are various qualities, of which the highest is hard coking coal. Other types, such as semi-soft or high-volatile coking coal, are generally sold at set discounts to hard coking coal. In addition, some high-quality non-coking coals are used in metallurgy, as PCI coal injected in the blast furnace (BF) to reduce coke consumption. Their prices are also related to coking coal, still at a discount. Finally, some market niches exist. Whereas high-grade anthracite can also be used for PCI, and follows those prices, ultra-high grade anthracite can partially replace coke in the BF, and is thus related to coke price at a discount.
In non-coking coal (steam or thermal coal) used for heat and power generation, calorific value is the main parameter for defining performance and hence price. But pricing is not that simple. A lower calorific value generally entails poorer performance in the boiler, with the price falling faster than the energy content. Consequently, different calorific values entail different prices, and the discount also varies according to demand and supply conditions. Argus, for example, lists five different price indexes for Indonesian coal – one each for kilocalorie counts of 6 500, 5 800, 5 000, 4 200 and 3 400 per kilogram. In addition, calorific values can be referred to as “gross” or “net” calorific values and as different conditions of coal (as received, air-dried basis, etc.). Still more factors, such as sulphur content, can discount the price of steam coal.
Different geographic markets are generally well integrated, as seaborne transport costs are much lower than for liquefied natural gas (for example). Nevertheless, different prices apply to different importing and exporting regions. In the case of seaborne coal, freight and insurance are major price components; FOB, CIF (cost insurance freight) and CFR (cost freight) therefore feature in prices. FOB prices are usually used for exporting points, meaning that the buyer pays for transportation to the destination port and assumes the risks in transit. CIF prices are used in delivery points, meaning that the buyer takes title in the destination port, while the seller pays freight and insurance and assumes the risks in transit. CFR prices are also used and are similar to CIF, except that the buyer pays the insurance.
A further aspect of coal prices is whether the price refers to contracted coal or spot purchases. For example, Japanese utilities buy most of their thermal coal through one-year term contracts (compared to one-quarter or one-month contracts for coking coal). However, most coal is generally traded internationally on a spot basis, hence most price markers and indexes refer to spot purchases. Since coal is one of the largest traded commodities, there are of course liquid derivative markets comprising a great variety of futures, locations and coal specifications, as well as forwards and swaps for different dates. In short, it helps to be specific when inquiring about the price of coal.
© O
EC
D/IE
A, 2
013

RECENT TRENDS IN INTERNATIONAL COAL TRADING
MEDIUM-TERM COAL MARKET REPORT 2013 55
Since 2011, coal prices worldwide have declined irrespective of coal type. Australian prime hard coking coal plummeted from almost USD 330/t in March 2011 to USD 133/t in July 2013; Australian low-volatile PCI coal also dropped from USD 273/t to USD 117/t over the same period. The Newcastle FOB steam coal marker price stood at USD 77/t, losing USD 50/t between March 2011 and July 2013.
Figure 2.15 Development of coal marker prices for different types of coal, 2011-13
Source: McCloskey (2013), McCloskey Coal Reports 2010-2013, McCloskey’s, London, http://cr.mccloskeycoal.com.
Seaborne thermal coal prices and regional arbitrage Whereas global seaborne thermal coal trade has grown steadily in recent years, even setting a record in 2012, thermal coal prices have plummeted since 2011 in both Europe and Asia, as seen in Figure 2.16. Between September 2011 and May 2012, the Amsterdam Rotterdam Antwerpen (ARA) CIF price declined by USD 38/t, to USD 87/t. The downward trend continued and by July 2013, the price had dropped to USD 73/t. Asian prices moved in a similar fashion, but a price gap to the ARA CIF price opened up, leaving the Asian CIF marker price at USD 85/t in July 2013. The pressure on international thermal coal prices can best be explained by the interaction of increasing supply capacities and regional arbitrage. Export capacity has increased substantially since 2010. Low-cost exporters increased their exports. For example, Colombia increased exports by 15 Mt and Indonesia by more than 100 Mt from 2010 to 2012. Additional market growth also came from Australia (+24 Mt), South Africa (+7 Mt), the United States (+28 Mt) and Russia (+2 Mt). US exports increased thanks to the 2012 drop in domestic demand caused by a mild winter and increased competition from shale gas. The coal oversupply pushed prices southward in Europe. As Figure 2.17 illustrates, increasing trade volumes between Colombia and Europe have changed the European import structure and price development over the last decade. Between 2003 and 2007, South Africa exported roughly 50 Mt annually to Europe; the ARA CIF price could be widely explained by the Richards Bay FOB price, plus freight costs. Back then, the United States was an important alternative buyer of Colombian coal. Since 2010, the picture has changed: Colombian exports to the United States have declined significantly, flooding instead the European market. Attracted by higher prices in the Pacific basin (or deterred by intense competition in Europe), South African trades to Europe have decreased substantially.
0
50
100
150
200
250
300
350USD/t
Newcastle steam coal (FOB) Australian prime hard coking (FOB)Australian low-volatile PCI (FOB)
© O
EC
D/IE
A, 2
013

RECENT TRENDS IN INTERNATIONAL COAL TRADING
56 MEDIUM-TERM COAL MARKET REPORT 2013
Figure 2.16 Thermal coal price markers in Europe and Asia, 2011-13
Source: McCloskey (2013), McCloskey Coal Reports 2010-2013, McCloskey’s, London, http://cr.mccloskeycoal.com.
Figure 2.17 Development of Colombian and South African exports to Europe and European prices
*Estimate.
Notes: each bar displays annual exports of Colombia and South Africa respectively.
Sources: McCloskey (2013), McCloskey Coal Reports 2010-2013, McCloskey’s, London, http://cr.mccloskeycoal.com; IEA analysis.
Even though higher Asian prices shifted South African coal exports from Europe to Asia, coal prices have also declined since late 2011 in the Pacific basin for numerous reasons. While thermal coal demand in Asia (principally in China and India) grew in 2012, demand growth was slower than the trend of the previous decade. Nonetheless, Indonesia and Australia increased exports massively, creating, together with South African export volumes, a comfortable supply situation in the Pacific basin. Additionally, price differences between the Atlantic and the Pacific basins are somewhat
70
90
110
130
150USD/t
Northwest Europe (ARA CIF) Asian marker (CIF)
0
35
70
105
140USD/t
South African exports to Europe (right axis)Colombian exports to Europe (right axis)Richards Bay (FOB + freight)Puerto Bolivar (FOB + freight)Northwest Europe (ARA CIF)
0
50
100
150
200Mt
* *
© O
EC
D/IE
A, 2
013

RECENT TRENDS IN INTERNATIONAL COAL TRADING
MEDIUM-TERM COAL MARKET REPORT 2013 57
limited by the arbitrage potential of traditional Atlantic basin suppliers, particularly the United States and Colombia. Figure 2.18 shows an example thereof in early 2012. In January 2012, the Colombian FOB price began to decrease in line with the ARA CIF price, while the Qinhuangdao FOB price for domestic transports to South China stayed flat. Taking into account all freight costs and taxes, a price difference of about USD 10/t to USD 20/t opened up between Colombian and Chinese coal. This arbitrage opportunity was closed by the markets when a few weeks later, imports from Colombia were observed in China and Chinese prices also began dropping. South African and Australian export prices have moved in line with Asian price development, indicating strong competition in the Pacific basin (Figure 2.19). This suggests that any increase in freight cost difference between South African and Australian transports to China has a direct negative impact on the Richards Bay price, implying lower profits for South African exporters. Such a situation occurred, for example, in early 2013. Figure 2.19 shows another interesting implication. If prices in Europe were high enough to attract more South African coal, the Richards Bay FOB price should increase to the same level (minus freight costs) and Australians should also be able to realise higher prices in Asia. Thus, swing suppliers such as South Africa and (as exemplified above) Colombia link European and Asian import markets.
Figure 2.18 South China marker prices (CFR) Figure 2.19 Richards Bay and Newcastle and Chinese imports from Colombia marker prices (FOB), 2012-13
Notes: VAT = value-added tax. All price markers are for calorific values of 6 000 kcal/kg. Bars represent monthly Chinese imports from Colombia. Trade volume data was only available until June 2013.
Sources: McCloskey (2013), McCloskey Coal Reports 2010-2013, McCloskey’s, London, http://cr.mccloskeycoal.com; IEA analysis.
The trend of decreasing thermal coal prices can be observed irrespective of coal quality. The left chart of Figure 2.20 displays marker prices in South China for different coal qualities, derived from the Qinhuangdao FOB price plus freight. Prices have been standardised to an energy content of 6 000 kcal/kg. Buyers usually pay a premium for coal with higher calorific values, meaning that even when prices are standardised to energy content, low calorific coal (4 900 kcal/kg) is worth between USD 5/t and USD 10/t (at 6 000 kcal/kg) less than higher calorific coal (6 000 kcal/kg). Interestingly, this gap disappeared in South China for both 6 000 kcal/kg and 5 500 kcal/kg coal between November 2012 and June 2013. Focusing on Australian coal exports, FOB prices reveals higher differences between coal qualities, e.g. between the Newcastle price and the Australian off-spec index. Because of the lower energy
0
1
2
3
90
110
130
150MtUSD/t
Chinese imports from Colombia (right axis)Bolivar (FOB + freight + import tax)Qinhuangdao (FOB + freight + VAT)
70
90
110
130USD/t
Richards Bay (FOB) Newcastle (FOB)
© O
EC
D/IE
A, 2
013

RECENT TRENDS IN INTERNATIONAL COAL TRADING
58 MEDIUM-TERM COAL MARKET REPORT 2013
content, freight costs of Australian off-spec coal are higher, and marketable prices lower, than for Newcastle specification coal. It is surprising that Indonesian low calorific coal (4 900 kcal/kg) had an FOB price close to the Australian Newcastle FOB (6 000 kcal/kg) when standardised to energy content.
Figure 2.20 Marker prices of different coal qualities in South China (left, CFR) and Australia/Indonesia (right, FOB) standardised to an energy content of 6 000 kcal/kg, 2012-13
Sources: McCloskey (2013), McCloskey Coal Reports 2010-2013, McCloskey’s, London, http://cr.mccloskeycoal.com; IEA analysis.
Box 2.2 Does coal price follow oil and gas prices?
While coal prices should be largely driven by market fundamentals, together with external factors (e.g. currency exchange or market liquidity), there are reasons for supporting correlation with the prices of other commodities like oil and gas. For example, the price of oil is an important cost component in coal mining and transportation, while natural gas and coal are competing fuels for power generation in many world regions. In this box, we shall analyse recent coal, gas and oil prices, using (basic) statistical methods and without any predetermined position to assess whether these fuel prices show significant correlation and/or co-integration. We investigate daily European benchmark prices for coal (API2), gas (title transfer facility [TTF])2 and oil (Brent) over the January 2008 to April 2013 observation period.
Correlations
When two time series are correlated, a strong and often linear relation between the two can be established. In the case of fuel prices, this means that if the price of fuel “x” goes up, the price of fuel “y” will go up or down by factor “z”, with “z” being the exact same number during the whole observation period in case of a perfect correlation. Correlation does not mean, however, that “x” is always causing “y” to move in a certain direction; the opposite (“y” causing “x”) could just as well be true. Also, two time series can show a high correlation without the presence of a causal relationship.
Figure 2.21 shows the three price time series that will be used, all including daily values for the front-month delivery contract and converted into euros per megawatt hour. Looking at this figure, it is difficult to derive any correlations. Therefore, as a first step, the correlation coefficients of coal with the other two fuels will be calculated over the full time series, using the Pearson Product Moment Correlation Coefficient (PPMCC, or “r”). The PPMCC is calculated using the following formula, with “X” being API2 and “Y” being the price of either TTF or Brent:
2 Dutch virtual trading hub for natural gas, considered a benchmark price for natural gas in continental Europe.
70
90
110
130
150USD/t
Qinhuangdao (6 000 kcal/kg)Qinhuangdao (5 500 kcal/kg)Qinhuangdao (4 900 kcal/kg)
70
90
110
130
150USD/t
Newcastle (6 000 kcal/kg)Australian off-spec (5 500 kcal/kg)Indonesian sub-bitumious (4 900 kcal/kg)
© O
EC
D/IE
A, 2
013

RECENT TRENDS IN INTERNATIONAL COAL TRADING
MEDIUM-TERM COAL MARKET REPORT 2013 59
Box 2.2 Does coal price follow oil and gas prices? (continued)
𝒓 =∑ (𝑿𝒊 − 𝑿�)(𝒀𝒊 − 𝒀�)𝒏𝒊=𝟏
�∑ (𝑿𝒊 − 𝑿�)𝟐𝒏𝒊=𝟏 �∑ (𝒀𝒊 − 𝒀�)𝟐𝒏
𝒊=𝟏
The result of this formula is a correlation coefficient “r”, which will always have a value of between -1 and 1, with values of -1 and 1 meaning perfect (negative) correlation and a value of 0 meaning no correlation at all. The interpretation of an “r” value can differ depending on the objective of the analysis. However, there seems to be some consensus that values higher than 0.7 (or -0.7) indicate a reasonably strong correlation between two time series, while values higher than 0.9 indicate a very strong correlation. Based on the PPMCC formula, the following correlation coefficients between daily front-month coal prices and daily gas/oil prices have been derived for the period January 2008 to April 2013:
API2-TTF: 0.70
API2-Brent: 0.53
The above coefficients lead us to conclude that coal and gas prices show a more similar pattern than coal and oil prices. This higher correlation could be explained by the interaction of coal and gas in European power generation markets. However, 0.70 (let alone 0.53) still does not indicate very strong correlation.
While the above coefficients are calculated over the entire observation period of 1 390 days, the strength of the correlations did vary within this time period. Therefore, a “rolling” daily correlation3 over the 252 preceding days (the number of trading days in a year) was also calculated (as seen in Figure 2.22), providing insight into the strength of the correlation during the observation period.
Figure 2.21 Price time series for API2 coal, TTF gas and Brent oil
Note: EUR/MWh = euros per megawatt hour.
Source: Bloomberg Professional service (2013), www.bloomberg.com/professional/ (accessed 1 September 2013).
3 Rolling correlation means that for each day the dataset over which the “r” coefficient is calculated changes with one day. One new day is added while the oldest day in the dataset is removed.
0
20
40
60EUR/MWh
API2 front month TTF front month Brent front month
© O
EC
D/IE
A, 2
013

RECENT TRENDS IN INTERNATIONAL COAL TRADING
60 MEDIUM-TERM COAL MARKET REPORT 2013
Box 2.2 Does coal price follow oil and gas prices? (continued)
Figure 2.22 252-day rolling correlations of coal with gas and oil
Source: Bloomberg Professional service (2013), www.bloomberg.com/professional/ (accessed 1 September 2013).
A look at the rolling correlations between coal and gas and coal and oil shows a strikingly strong correlation until mid-2011, quickly weakening thereafter. The main explanation could be the falling coal prices caused by the unprecedented current oversupply situation in the global coal market, meaning that natural gas lost its edge over coal as a fuel for power generation. With gas falling out of the merit order in most European countries, day-to-day fuel-switching interaction no longer played a major role in price formation for both fuels, possibly explaining the subsequently weak correlation. However, oil does not interact with steam coal in the European electricity sector.
Another interesting finding is the weak correlation among the three fuels in 2009, expressed by the falling correlation at the end of 2009. After the onset of the financial crisis in mid-2008, energy prices started falling rapidly and drastically, but at different times depending on the fuel. Gas prices started falling later than coal and oil prices, possibly driven by time lags in long-term oil-linked gas contracts, which still had a big impact on price formation at trading hubs. Coal prices started falling around the same time as – but much more than – oil prices, given that the short-run marginal production costs of coal resulted in a lower price floor than the short-run marginal costs of oil. Thus, the three fuels showed quite different trends in 2009, with gas prices falling and coal staying about flat throughout the year, while oil prices rising again during most of 2009.
Correlation of forward prices
So far, correlation coefficients have been calculated for what are known as the front-month products of the three fuels, meaning the respective contracts start delivering the month following the trading date.4 Since delivery follows shortly after the contract is concluded, short-term supply/demand disruptions (outages, military conflicts, etc.) can impact on the price formation of a fuel and consequently weaken the correlation with the other fuel that is not experiencing disruption at the same time. Since prices further on the forward curve are in general less affected by these usually short-term events, it would be interesting to see whether correlations between the fuel prices are indeed stronger further on the curve.
4 The contracts can also be financially settled.
-1
-0.5
0
0.5
1
Jan-09 Jul-09 Jan-10 Jul-10 Jan-11 Jul-11 Jan-12 Jul-12 Jan-13
API2-TTF 252-day rolling correlation API2-Brent 252-day rolling correlation
© O
EC
D/IE
A, 2
013

RECENT TRENDS IN INTERNATIONAL COAL TRADING
MEDIUM-TERM COAL MARKET REPORT 2013 61
Box 2.2 Does coal price follow oil and gas prices? (continued)
We therefore also chose to calculate correlations for daily prices of the three fuels’ year-ahead forward contracts.5 Between January 2008 and April 2013, the correlation coefficients are:
API2 year-ahead (YA)-TTF YA: 0.87
API2 YA-Brent YA: 0.69
In both cases, correlation is significantly stronger for the year-ahead forward products. In the case of coal and gas, the “r” coefficient is close to 0.9, implying a very strong correlation. Again, this can likely be explained by the interaction between the fuels in power generation. Utilities make money not only through “physical” power production, but also by taking positions in forwards markets. Often, dark and spark spread positions are traded simultaneously, linking the two forward contracts. Coal and oil also show a stronger correlation on the forwards market, although still much weaker than the coal-gas correlation. Still, the higher correlation coefficients found suggest that when short-term events play a less important role, macroeconomic factors or fuel substitution become more relevant to price formation.
Rolling correlations for year-ahead prices look largely similar to rolling correlation for front-month products and also started dropping in the second half of 2011. Interestingly, the gas coal trend showed a small lag with the month-ahead correlation trend, suggesting that some trends initially expected to be temporary also began to affect prices further on the curve. Apart from this, the main difference is that the year-ahead products show slightly higher correlation at the same points in time, even reaching almost 1 (for gas and coal) in mid-2009, as seen in Figure 2.23.
Co-integration
So far, our analysis has covered correlations among the three fuels. However, correlation is just one of the possible (and most direct) dependencies between the various time series of fuel prices. Coal, gas and/or oil prices can also be co-integrated. When time series are co-integrated, the combination of two (randomly moving) time series is stationary.6 In other words, although two variables can appear to behave randomly and independently, they will not drift too far away from each other when co-integrated.
To assess whether the three time series of coal, gas and oil prices are co-integrated, we used the very popular Augmented Dickey-Fuller test (ADF) statistical co-integration test. The ADF test basically serves to assess the likelihood that residuals of a linear combination of two time series form a stationary time series. If the t-statistic that results from the test exceeds a certain critical value, the 0-hypothesis that the two time series are not co-integrated can be rejected. To conclude with 95% confidence that the t-statistic found implies a co-integrative relationship, it should be smaller than the value -2.86.
Table 2.1 ADF test results
t-statistics
Coal-gas -2.5809 Coal-oil -1.5538 Coal-gas (YA) -2.7967 Coal-oil (YA) -2.1864
5 In the case of Brent, the futures curve consists of monthly products. Therefore, we used a Brent Calendar Year Outright Swap contract for the next year. 6 A stationary time series is a time series whose statistical measures, such as variance and mean, do not change over time.
© O
EC
D/IE
A, 2
013
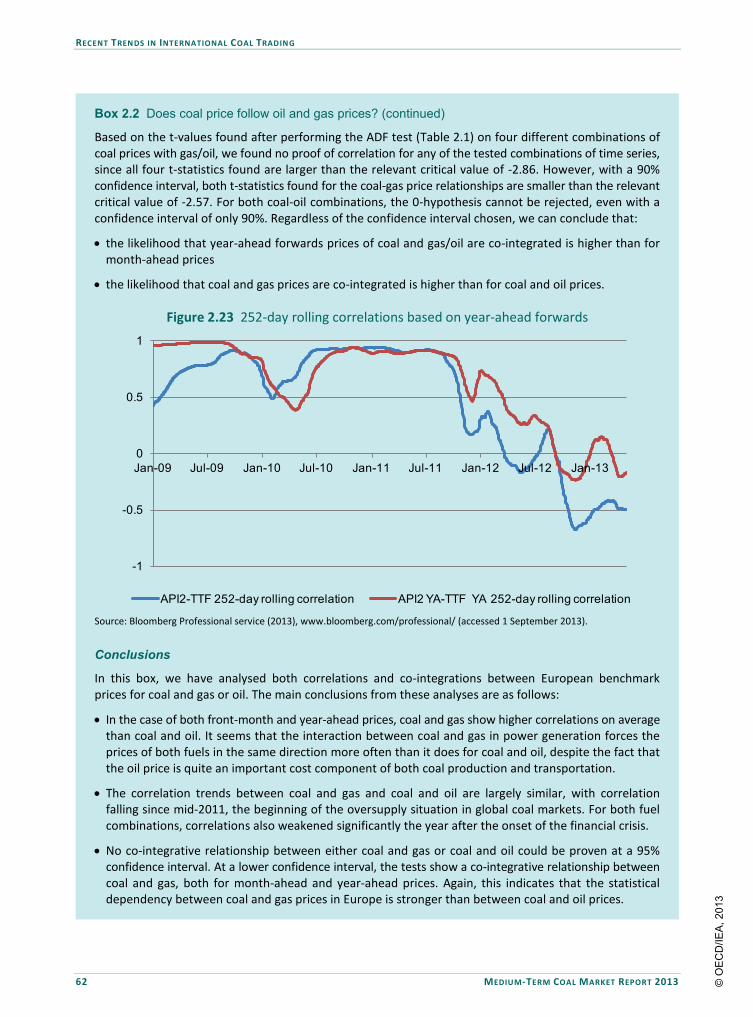
RECENT TRENDS IN INTERNATIONAL COAL TRADING
62 MEDIUM-TERM COAL MARKET REPORT 2013
Box 2.2 Does coal price follow oil and gas prices? (continued)
Based on the t-values found after performing the ADF test (Table 2.1) on four different combinations of coal prices with gas/oil, we found no proof of correlation for any of the tested combinations of time series, since all four t-statistics found are larger than the relevant critical value of -2.86. However, with a 90% confidence interval, both t-statistics found for the coal-gas price relationships are smaller than the relevant critical value of -2.57. For both coal-oil combinations, the 0-hypothesis cannot be rejected, even with a confidence interval of only 90%. Regardless of the confidence interval chosen, we can conclude that:
• the likelihood that year-ahead forwards prices of coal and gas/oil are co-integrated is higher than for month-ahead prices
• the likelihood that coal and gas prices are co-integrated is higher than for coal and oil prices.
Figure 2.23 252-day rolling correlations based on year-ahead forwards
Source: Bloomberg Professional service (2013), www.bloomberg.com/professional/ (accessed 1 September 2013).
Conclusions
In this box, we have analysed both correlations and co-integrations between European benchmark prices for coal and gas or oil. The main conclusions from these analyses are as follows:
• In the case of both front-month and year-ahead prices, coal and gas show higher correlations on average than coal and oil. It seems that the interaction between coal and gas in power generation forces the prices of both fuels in the same direction more often than it does for coal and oil, despite the fact that the oil price is quite an important cost component of both coal production and transportation.
• The correlation trends between coal and gas and coal and oil are largely similar, with correlation falling since mid-2011, the beginning of the oversupply situation in global coal markets. For both fuel combinations, correlations also weakened significantly the year after the onset of the financial crisis.
• No co-integrative relationship between either coal and gas or coal and oil could be proven at a 95% confidence interval. At a lower confidence interval, the tests show a co-integrative relationship between coal and gas, both for month-ahead and year-ahead prices. Again, this indicates that the statistical dependency between coal and gas prices in Europe is stronger than between coal and oil prices.
-1
-0.5
0
0.5
1
Jan-09 Jul-09 Jan-10 Jul-10 Jan-11 Jul-11 Jan-12 Jul-12 Jan-13
API2-TTF 252-day rolling correlation API2 YA-TTF YA 252-day rolling correlation
© O
EC
D/IE
A, 2
013

RECENT TRENDS IN INTERNATIONAL COAL TRADING
MEDIUM-TERM COAL MARKET REPORT 2013 63
Seaborne met coal prices The downward trend initiated in 2011 for met coal prices continued in 2012-13. In March 2011, the FOB marker price of Australian prime hard coking coal reached an all-time high of almost USD 330/t, fostered by a tight supply side due to the Queensland flooding and the impressive growth of Chinese steel and blast furnace iron (BFI) production. Prices then plummeted by USD 92/t between August 2011 and March 2012. After some months of stability, they again started falling in June 2012. Since then, the Australian prime hard coking coal price has lost another USD 86/t, dropping to USD 133/t in July 2013. Plummeting prices have been observed for all met coal types. The FOB marker price for US high-ash, high-volatile coal, for example, dropped more than 50% between February 2011 and July 2013. Surprisingly, a look at both global and Chinese BFI production shows that not only did BFI not decrease, it actually increased by 4.2% in China and 2.8% in the rest of the world between 2011 and 2012, an upward trend that also seems to hold true for 2013 (World Steel Association, 2013), as seen in Figure 2.24. Yet this growth in demand has been outperformed by the growth in global supply capacity, driven by the high 2011 met coal prices. Strong competition between met coal exporters has put pressure on prices ever since, with additional competition provided by Chinese domestic producers.
Figure 2.24 Development of met coal prices and monthly year-on-year differences in BFI production, 2011-13
Note: each bar displays the monthly BFI production in China and the rest of the world.
Sources: World Steel Association (various years), Crude Steel Production, Brussels, World Steel, www.worldsteel.org/statistics/crude-steel-production.html; McCloskey (2013), McCloskey Coal Reports 2010-2013, McCloskey’s, London, http://cr.mccloskeycoal.com; IEA analysis.
Coal forward prices Figure 2.25 shows the evolution of forward curves of API2 and API4 indexes between November 2012 and August 2013. Derivatives based on API2 and API4 account for roughly 90% of global coal derivative trade volume. Forward curves for both indexes have declined in 2013. API2 forwards for 2016 decreased from USD 116/t in November 2012 to USD 93/t in August 2013. Both indexes constantly showed a contango situation, perhaps indicating that traders perceive spot markets as better supplied than
-2
0
2
4
6
8
10
12
0
50
100
150
200
250
300
350Mt USD/t
China (right axis) ROW (right axis)Australian prime hard coking FOB US high-ash, high-volatile FOB
USD -86/t
USD -92/t
© O
EC
D/IE
A, 2
013

RECENT TRENDS IN INTERNATIONAL COAL TRADING
64 MEDIUM-TERM COAL MARKET REPORT 2013
future markets. A comparison of API2 forward prices (representing the Northwest European coal market) and API4 forward prices (representing Richards Bay FOB) shows the price difference ranging between USD 2/t and USD 4/t for 2014 and between USD 5/t and USD 6/t for 2017. This may suggest on the one hand, that markets do not currently foresee South African coal to be increasingly traded to northwest Europe and on the other hand, that they perceive South African exports as still related to the Northwest European coal market in 2017.
Figure 2.25 Forward curves of API2 and API4, 2012-13
Source: McCloskey (2013), McCloskey Coal Reports 2010-2013, McCloskey’s, London, http://cr.mccloskeycoal.com.
Box 2.3 Boom and bust: the development of mining companies’ stock prices and profits
Boom and bust
As with other resource prices, the development of coal prices strongly depends on current and expected future economic growth, i.e. the prices vary with the business cycle and development outlook. Furthermore, the coal market exhibits quite pronounced boom and bust cycles, with mining companies reacting to high price periods with a substantial increase in both investments and mergers and acquisitions.
The last five years have been particularly interesting, because global export prices for both met and thermal coal soared to all-time highs in 2008 and 2011. Each was followed by a pronounced drop – the first in 2008-09, as a result of the economic crisis, and the second starting in 2012, as a result of severe oversupply in the market. As an example of how volatile prices were from January 2008 until December 2012, the Newcastle FOB price of thermal coal (6 000 kcal/kg on a NAR basis) ranged from USD 61/t to USD 184/t, with an average of USD 103/t (see Figure 2.26). While this results in a standard deviation (SD) of almost USD 26/t over the entire period, a closer look at each year shows considerably higher volatility in 2008 (SD: USD 30.4/t) and 2012 (USD 12.6/t) than in 2009 (USD 7.1/t), 2010 (USD 5.5/t) and 2011 (USD 6.1/t).
Most large coal mining companies do not only operate coal mines, but also own a diversified portfolio of mining assets, some of which (like iron ore and coking coal) are complementary. Besides coal and iron ore, their other business activities include aluminium, copper, nickel, platinum, diamonds and gold. Adaro is an example of a company that is solely active in the coal business and also export-oriented. As Figure 2.26 suggests, Adaro’s share price and the Newcastle FOB price follow the same trend.
70
80
90
100
110
120
16 Nov 2012 16 Feb 201316 May 2013 16 Aug 2013
70
80
90
100
110
120USD/t API 4
70
80
90
100
110
120USD/t API 2
© O
EC
D/IE
A, 2
013

RECENT TRENDS IN INTERNATIONAL COAL TRADING
MEDIUM-TERM COAL MARKET REPORT 2013 65
Box 2.3 Boom and bust: the development of mining companies’ stock prices and profits (continued)
Figure 2.26 International coal and stock prices of coal exporter Adaro
Sources: Bloomberg Professional service (2013), www.bloomberg.com/professional/ (accessed 1 September 2013); McCloskey (2013), McCloskey Coal Reports 2010-2013, McCloskey’s, London, http://cr.mccloskeycoal.com.
Figure 2.27 Development of revenues and operational margin of three large mining companies
Notes: operational margin is defined as the ratio of earnings before interest and taxes (EBIT) and production volumes. Data reported by BHPB refer to financial years, e.g. 2012 data refer to the period from July 2011 to June 2012.
Sources: Anglo American (2008-12), Annual Reports, Anglo American, London; BHP Billiton (2008-12), Annual Reports, BHP Billiton, Melbourne; Glencore Xstrata (2008-12), Annual Reports, Glencore Xstrata, Zug, Switzerland.
0
50
100
150
200
00.050.1
0.150.2
0.250.3
0.350.4
USD/t (6 000 kcal/kg)USD
Adaro share price Newcastle thermal coal price (FOB)
A n g lo A m e r ic an B H P B X s t r a t a A n g lo A m e r ic B H P B X s t r a t a
T h e r m a l c o M e t a llu r g ic a l c oa
0
2 000
4 000
6 000
8 000
10 000
0
20
40
60
80
100
120
140
Anglo American
BHPB Xstrata Anglo American
BHPB Xstrata
Thermal coal Metallurgical coal
USD (million)USD/t
Operational margin (2008) Operational margin (2009) Operational margin (2010)Operational margin (2011) Operational margin (2012) Revenues 2008 (right axis)Revenues 2009 (right axis) Revenues 2010 (right axis) Revenues 2011 (right axis)Revenues 2012 (right axis)
© O
EC
D/IE
A, 2
013

RECENT TRENDS IN INTERNATIONAL COAL TRADING
66 MEDIUM-TERM COAL MARKET REPORT 2013
Box 2.3 Boom and bust: the development of mining companies’ stock prices and profits (continued)
A look at the revenues and operational margins of thermal and met coal sales of Anglo American, BHPB and Xstrata shows another interesting observation. Despite the stark decrease in coal export prices in 2012 (e.g. the annual average FOB price of Australian prime hard coking coal also dropped, from USD 293/t in 2011 to USD 192/t in 2012) the three companies’ revenues from thermal and met coal sales did not change drastically (see Figure 2.27). One reason is the increased production volumes, as with Xstrata met coal. Another partial explanation is that some thermal coal exports were sold under long-term contracts, thereby postponing (or at least dampening) the price hit on company revenues. The absence of a drop in the met coal revenues of BHPB may be due not only to the high quality of its export material, but to the fact that it reports its financial data for fiscal years – and average Australian met coal export prices in 2011/12 did not decrease dramatically over 2010/11. However, the three companies’ operational margins (here defined as EBIT per tonne of production) were severely affected, particularly in the case of met coal. Aside from the lower sales prices, their reduced 2012 profits were also caused by rising production costs due to (for example) higher labour costs in Australia and impairment charges of mining assets, such as Rio Tinto’s USD 3 billion write-off of its Mozambican met coal assets.
Coal supply costs Coal supply costs comprise the costs of mining, inland transportation, port operations and seaborne transport, as well as taxes and royalties. Unlike for oil and gas extraction, variable costs for coal mining make up a significant share of full costs, because the business is much less capital-intensive. Coal transport is more capital-intensive, with transport infrastructure (such as railways and ports) requiring high initial investments. Nevertheless, port fees and transportation tariffs can also be counted as variable costs. Besides production and transportation costs, another relevant cost factor in the international coal trade is currency exchange rates, which can increase or decrease a coal exporter’s cost competitiveness. In the seaborne coal trade, freight rates on the dry bulk market are also an important supply cost component. Development of input factor prices In most coal-exporting countries, mining accounts for the largest share of total supply costs. Variable mining costs (most often called mining cash-costs) include different input factors (such as materials and labour) and other costs (such as royalties or outside services). The breakdown strongly varies by country and mine, depending on geological conditions and the mining method applied. Materials most often account for over half of a mine’s cash-costs. When labour costs are low, such as in Indonesia, Colombia or South Africa, this share climbs to 75%. Diesel fuel, steel mill products, explosives, tyres and machinery are internationally traded commodities whose prices usually follow global trends, although regional distortions (like fuel subsidies) exist. Other inputs, such as electricity or water, follow national price developments. The cost of diesel fuel, which is also a relevant factor for railway coal transportation, increased strongly between 2010 and 2011. While prices have since been quite volatile, they have not increased significantly on an annual average. Prices of tyres and steel products rose roughly 20% until the end of 2011, but steel prices in particular have since declined by 10 index points. Explosives and machinery prices have increased steadily since January 2010, but more slowly than other commodity prices. Figure 2.28 shows the recent evolution of the main inputs.
© O
EC
D/IE
A, 2
013

RECENT TRENDS IN INTERNATIONAL COAL TRADING
MEDIUM-TERM COAL MARKET REPORT 2013 67
Figure 2.28 Indexed price development of select commodities used in coal mining
Source: US Bureau of Labor Statistics (2013a), Producer Price Data Commodity and Industry, United States Department of Labor, Washington, DC, www.bls.gov/data/.
Figure 2.29 Indexed labour cost development (in local currency) in select countries
Notes: data for Russia are only available until 2011 and for South Africa until 2012. Index: Q1 2010 = 100.
Sources: US Bureau of Labor Statistics (2013b), Employment, Hours, and Earnings from the Current Employment Statistics survey (National), Industry: Coal Mining (average hourly earning of all employees), United States Department of Labor, Washington, DC, www.bls.gov/data/; Statistics South Africa (2013), Quarterly Employment Statistic (QES), June 2013, Statistics South Africa, Johannesburg, www.statssa.gov.za/publications/P0277/P0277June2013.pdf; Federal State Statistics Service of the Russian Federation, Среднемесячная номинальная начисленная заработная плата по видам экономической деятельности (Average Monthly Nominal Accrued Wages by Kinds of Economic Activities), Federal State Statistics Service, Moscow, www.gks.ru/bgd/regl/b12_06/IssWWW.exe/Stg/d01/03-10.htm; Australian Bureau of Statistics (2013), 6345.0 Wage Price Index, Australia, June 2013, Australian Bureau of Statistics, Canberra, www.abs.gov.au/ausstats/[email protected]/mf/6345.0/.
Besides materials, labour costs are one of the largest components of mining costs. Depending on the country and mining technique, they can account for 20% to 50% of mining cash-costs. Typically,
80
90
100
110
120
130
140
150
160
Tyres Explosives Steel mill productsMachinery and equipment Diesel fuel
9095
100105110115120125130135140
Australia United States South Africa Russia
© O
EC
D/IE
A, 2
013

RECENT TRENDS IN INTERNATIONAL COAL TRADING
68 MEDIUM-TERM COAL MARKET REPORT 2013
salaries and wages are higher in countries such as the United States, Canada or Australia than in Colombia, Indonesia or South Africa. However, higher labour productivity at least partly compensates for this effect. Figure 2.29 shows the development of labour costs indexed to local currencies in four countries. Between 2010 and 2012, labour costs rose approximately 35% (the strongest increase) in South Africa, 15% in Australia and 10% in the United States. Although the relative labour cost increase was lower in the United States and Australia than in South Africa, labour costs increased more in absolute numbers in the United States and Australia. Cost increases in the coal industry – particularly in Australia – have been widely discussed. Even though costs have increased significantly in recent years in line with plummeting international steam coal prices, Australian steam coal exports reached an all-time high in 2012. What seems contradictory at first becomes clearer when studying Figure 2.30. The green line illustrates an indicative curve of FOB costs of Australian export capacities in 2012. FOB costs comprise mining costs, inland transportation tariffs, port charges, taxes and royalties. Generally, coal production is economical when the FOB price covers FOB costs. This is true for Australian exports of roughly 145 Mt (standardised to 6 000 kcal/kg).
Figure 2.30 Australian steam coal supply cost curves, export volumes and price levels, 2012
Notes: coal volumes, prices and costs are based on a calorific value of 6 000 kcal/kg. Short-term marginal costs comprise variable production costs, processing, overburden removal and royalties. For simplification, this analysis assumes that port usage and inland transportation are based solely on long-term contracts and are therefore not part of the short-term marginal costs. FOB costs comprise short-term marginal costs and the costs of inland transportation and port usage. Royalties are assumed to increase proportionally with the production output.
Sources: IEA Analysis from Wood MacKenzie (2013), “Coal modelling”, workshop presentation at the IEA, Paris, 25-26 April); McCloskey (2013), McCloskey Coal Reports 2010-2013, McCloskey’s, London, http://cr.mccloskeycoal.com; IEA analysis.
In 2012, Australian exports totalled 163 Mt, leaving 18 Mt of production that does not entirely cover FOB costs. Clearly, Figure 2.30 is a very simplified model of reality: FOB prices, for example, vary in the space of one year and coal qualities also differ. Yet there are rational economic reasons for producers to sell coal below FOB costs. For instance, because of high initial investments, port and railway capacities are sometimes marketed on long-term contracts. Thus, exporters sometimes have to pay port charges and railway tariffs regardless of whether they use the infrastructure. In other words, some cost components included in FOB costs are in fact not relevant to the production decision, and therefore,
0
20
40
60
80
100
120
140
160
180
0 20 40 60 80 100 120 140 160
USD/t
MtNewcastle FOB (2012 average) FOB costs Short-term marginal costs
Exports 2012
Exports 2012 covering FOB costs
© O
EC
D/IE
A, 2
013

RECENT TRENDS IN INTERNATIONAL COAL TRADING
MEDIUM-TERM COAL MARKET REPORT 2013 69
they are stranded costs rather than short-term marginal costs. The red line illustrates FOB costs net of port and railway transport costs. Comparing these costs to the average FOB price shows that a production of 163 Mt can be rational. It should be stressed, however, that this is a simplistic hypothesis. First, not every coal mine is bound by long-term take-or-pay contracts, since companies in the coal industry can (for example) be vertically integrated. Second, other cost components – like labour or machinery – do not necessarily need to be counted as short-term marginal costs. Currency exchange rates Where international coal trade is concerned, exchange rates are a relevant cost factor. Since international coal trades are mostly settled in USD, coal exporters generate a revenue stream in US currency, but pay many of the costs (such as labour costs, railway tariffs, port charges and royalties) in their domestic currency. Therefore, a depreciation of the local currency against the USD translates into a decrease in supply cost components for domestic exporters. Figure 2.31 illustrates the indexed development of currencies of key coal-exporting countries against the USD. Until mid-2011, all shown currencies appreciated against the USD. The Australian dollar (AUD) even appreciated by almost 15% over the beginning of 2010. Thus all exporters, and Australia in particular, incurred currency-based cost increases during that period. This trend stopped in mid-2011. Currencies in Australia, Canada and Colombia did not continue to appreciate, the Indonesian rupiah (IDR) and Russian ruble (RUB) depreciated by 10 index points against the USD, and the South African rand (ZAR) even devaluated by 35 index points in the last two years. Taking only 2013 into account, nearly all currencies of coal-exporting countries have depreciated against the USD, thereby fostering exports even at declining (USD-based) coal prices.
Figure 2.31 Indexed development of the USD against select currencies
Notes: COP = Colombian peso; CAD = Canadian dollar. The graph shows the indexed (Q1 2010 = 100) development of the USD against selected currencies, expressed as USD/domestic currency (e.g. USD/AUD). Therefore a devaluation of the USD (1 USD buys less units of another currency) results in a decline in the index.
Figure 2.32 displays this effect. The left chart shows the Newcastle FOB price in USD and AUD. The FOB price marker has declined by more than USD 10/t in 2013. Because the AUD has depreciated against
80
85
90
95
100
105
110
115
120
125
130
AUD IDR COP CNY RUB CAD ZAR
© O
EC
D/IE
A, 2
013

RECENT TRENDS IN INTERNATIONAL COAL TRADING
70 MEDIUM-TERM COAL MARKET REPORT 2013
the USD, the same price marker remains quite constant when expressed in AUD. Compared to the January 2013 currency exchange rate, the devaluation of the AUD has strengthened export revenues by 10 Australian dollars per tonne (AUD/t). We can observe a similar effect in South Africa, where the depreciation of the ZAR has at least partly alleviated the deterioration of USD-based steam coal prices.
Figure 2.32 FOB steam coal prices in USD and local currency (left: Newcastle, right: Richards Bay)
Note: ZAR/t = South African rand per tonne.
Source: McCloskey (2013), McCloskey Coal Reports 2010-2013, McCloskey’s, London, http://cr.mccloskeycoal.com; IEA analysis.
Dry bulk shipping market More than 90% of internationally traded coal is transported by ship from producing to consuming countries. The seaborne dry bulk shipping market is therefore an important component of the coal supply chain. Dry bulk freight vessels usually fall into four subclasses, depending on the weight they can carry, measured in deadweight tonnage (dwt): Handysize (10 000 dwt to 35 000 dwt), Handymax (35 000 dwt to 60 000 dwt), Panamax (60 000 dwt to 80 000 dwt) and Capesize (over 80 000 dwt). Besides coal, numerous goods (such as iron ore and related products, grain, bauxite, phosphates and cement) can be classified as dry bulk goods. An estimated 4 150 Mt of total dry bulk, consisting predominantly of iron ore (29%) and coal (27%), was seaborne traded in 2012. Iron ore (8.7% annual average growth) and coal (+6.7%) have grown more strongly in the last decade than the rest of the dry bulk market (+4.1%), driving the overall 1 700 Mt increase since 2003 (see Figure 2.33). International iron ore and coal shipping is mostly done with Panamax and Capesize vessels. The supply of bulk carrier capacity is rather inflexible. First, construction of new bulk carriers typically takes one to two years. Second, shipyards often have limited production capacity, due to a limited number of assembly docks. Ship orders are therefore queued, increasing construction time. This inflexibility was one reason for the high-volatile freight rates observed in the last decade. As seen in Figure 2.34, until 2008, dry bulk carrier capacity grew by around 25 Mdwt annually. Between 2007 and 2013, the fast-growing seaborne trade in iron ore and coal led to high capacity utilisation, and transport prices soared to record heights. Freight rates for transports from Richards Bay to Rotterdam rose to USD 50/t in 2007 and even USD 60/t in June 2008. These prices spurred huge investments, which led to a dramatic increase in dry bulk carrier capacity. In 2009, even though dry bulk transport demand dropped because of the global economic crisis, capacity grew by over 30 Mdwt;
70
80
90
100
110
120
130
70
80
90
100
110
120
130
Jan 12 Jul 12 Jan 13 Jul 13
AUD/tUSD/t
USD AUD AUD (1 Jan 2013)
0
140
280
420
560
700
840
980
0
20
40
60
80
100
120
140
Jan 10 Jan 11 Jan 12 Jan 13
ZAR/tUSD/t
USD ZAR
© O
EC
D/IE
A, 2
013

RECENT TRENDS IN INTERNATIONAL COAL TRADING
MEDIUM-TERM COAL MARKET REPORT 2013 71
from 2010 to 2012, the global fleet grew by more than 70 Mdwt every year. Overall capacity thus increased by more than 60% between 2009 and 2012, while transport demand grew less than 30%. It is therefore not surprising that prices plummeted to USD 5/t at the end of 2008. At the end of 2009, prices recovered to USD 23/t. At the end of 2011, they spiked again to USD 15/t. Since then, freight rates from Richards Bay to Rotterdam have stood between USD 6/t and USD 9/t, never exceeding 11 USD/t (until June 2013). In the second half of 2013, growth of iron ore imports to China (mainly through Capesize) and grain exports from United States (mainly through Panamax) has tightened the ship supply for coal transport, with an ensuing increase in freight rates (as shown in Figure 2.35).
Figure 2.33 Seaborne bulk trade, 2003-12 Figure 2.34 Development of the bulk carrier fleet, 2006-15
Note: Mdwt = million deadweight tonnage.
Source: IEA analysis, based on various sources.
Figure 2.35 Development of selected freight rates, 2002-13
Source: McCloskey (2013), McCloskey Coal Reports 2010-2013, McCloskey’s, London, http://cr.mccloskeycoal.com.
0
400
800
1 200
1 600
2 000Mt
Coal Iron ore Other
0
20
40
60
80
100
120
0
400
800MdwtMdwt
Bulk carrier capacity Projected capacityDeliveries (right axis) Scrapping (right axis)
0
10
20
30
40
50
60
70
80USD/t
Queensland – Rotterdam (150 000 t) Richards Bay – Rotterdam (150 000 t)
05
1015202530
USD/t
© O
EC
D/IE
A, 2
013

RECENT TRENDS IN INTERNATIONAL COAL TRADING
72 MEDIUM-TERM COAL MARKET REPORT 2013
Development of coal supply costs Between 2009 and 2011, coal supply costs for international coal trade increased substantially in all major exporting countries. However, costs seem to have dropped between 2011 and 2012. Whereas labour costs continued to increase, three developments had a bearish impact on coal supply costs in 2012. First, material costs stopped increasing. While the prices of diesel fuel, tyres and steel products in particular skyrocketed between 2009 and 2011, average prices did not further increase in 2012 and prices of steel products even decreased. Second, the currency appreciation, which drove up international coal supply costs between 2009 and 2011, stopped in 2012 and currencies in Indonesia, Russia and South Africa even depreciated on average. Third, freight rates to Europe further decreased by at least USD 2/t, to USD 3/t. To illustrate this development, Figure 2.36 shows indicative steam coal supply costs from selected coal exporters to northwest Europe (ARA ports). These developments also hold true for met coal supply costs. To allow for a comparison of mining and transport costs in different countries, taxes and royalties are not included in the figure.
Figure 2.36 Indicative steam coal supply costs to northwest Europe by supply chain component and by country, 2009-12
Note: indicative supply costs shown in this figure do not include taxes and royalties.
Sources: IEA analysis, based on several sources (see the figures in this section).
The country that has suffered the strongest increases in production costs in recent years is Australia. The appreciation of the AUD against the USD affected the competitiveness of the Australian mining sector more than currency appreciation in many other exporting countries. Labour costs – which are paid in local currency – have increased strongly in Australia due to a shortage in skilled labour, whereas labour productivity has decreased. Since labour costs account for a large share of FOB costs, the currency impact is more significant in Australia than in Indonesia, for example, where they are relatively low.
0
30
60
90
120
2009
2010
2011
2012
2009
2010
2011
2012
2009
2010
2011
2012
2009
2010
2011
2012
2009
2010
2011
2012
2009
2010
2011
2012
2009
2010
2011
2012
2009
2010
2011
2012
Colombia Indonesia South Africa opencast
South Africa underground
New South Wales
(Australia) opencast
New South Wales
(Australia) underground
Russia Central Appalachia
(United States)
USD/t
Mining Coal processing Inland transport Port and loading Shipping to Northwest Europe
© O
EC
D/IE
A, 2
013

RECENT TRENDS IN INTERNATIONAL COAL TRADING
MEDIUM-TERM COAL MARKET REPORT 2013 73
Box 2.4 The interdependency of the markets for coking coal and iron ore
Steel can be produced via the “oxygen route” or the “electric route” (see Box 3.3). If steel is produced via the “oxygen route”, steel production requires pig iron or scrap. Given the limited availability of scrap, most steel production comes from pig iron. Pig iron is produced in a BF using iron ore and coking coal as basic inputs. Neither coking coal nor iron ore can be substituted in the process of pig iron making. In economic terms, both commodities are complementary input factors, i.e. iron ore requires coking coal and vice versa, coking coal requires iron ore to produce the final product, pig iron. From the perspective of a BF operator, increasing prices for iron ore and coking coal lead to higher production costs for pig iron. If the pig iron producer wanted to pass through these costs, demand would decrease. Following this logic, a higher price of coking coal would decrease demand for pig iron; since iron ore is a complementary input factor, demand for it would decrease as well. Thus, markets for both commodities are inevitably linked.
The setting of both complementary input factors, iron ore and coking coal, becomes even more interesting when considering the market structure of both markets. Both coking coal and iron ore are internationally traded commodities. In 2012, international seaborne trade accounted for around 250 Mt (27%) of global coking coal consumption and close to 1 200 Mt (around 60%) of global iron ore consumption. Moreover, both seaborne markets are characterised by a high market concentration and some players have a significant share in both the iron ore and the coking coal market. Consequently, large companies active in those markets may be able to exercise market power.
Table 2.2 Production volumes of select mining companies in 2012 (Mt)
Iron ore % Coking coal % BHPB 187 16 54 21 Rio Tinto 253 21 15 6 Vale 320 27 5 2 Global seaborne trade 1 200 250
Note: production volumes include total production of mines in which a company has stakes.
Sources: World Steel Association (various years), Crude Steel Production, Brussels, World Steel, www.worldsteel.org/statistics/BFI-production.html; BHP Billiton (2012), Annual Report, BHP Billiton, Melbourne; Rio Tinto (2012), Annual Report, Rio Tinto, London and Melbourne; Vale (2012), Annual Report, Vale, Rio de Janeiro; IEA analysis.
The world’s largest iron ore export company, the Brazilian giant Vale, produced 320 Mt of iron ore in 2012, most of it destined for international markets. The biggest coking coal exporter, BHPB, sold 54 Mt in 2012. Interestingly, BHPB is also the world’s third-largest iron ore exporter, with an annual production of 187 Mt in 2012. Meanwhile, Vale increased production of coking coal in Mozambique and Australia, such that annual production amounted to over 5 Mt in 2012. Rio Tinto, the world’s second-largest iron ore exporter (253 Mt in 2012), is also a relevant exporter of coking coal, having produced 15 Mt in 2012.
The existence of two interdependent markets featuring players with relevant positions in both markets gives rise to some interesting strategic perspectives. For example, a company might find it profitable to increase supply in the coking coal market in order to push down coking coal prices, thereby creating room for higher prices in the iron ore business. Economic theory suggests that a vertical integrated company may be better off optimising the output of both business units simultaneously, rather than division by division. However, the salary of a business unit’s chief executive officer may depend more on the profit of the respective business unit than on the company-level profit, making it more complicated to co-ordinate the business units’ efforts. Hecking and Panke (2013) find evidence that vertically integrated companies operate more on a business unit level than on a company level.
© O
EC
D/IE
A, 2
013

RECENT TRENDS IN INTERNATIONAL COAL TRADING
74 MEDIUM-TERM COAL MARKET REPORT 2013
Other production input factors have become more costly as well. The price of electricity – a significant cost position, particularly for underground operations – rose by more than 70% after 2009 due to higher grid tariffs and other government charges, while rising fuel costs and lower truck productivity due to sharper environmental regulations caused significant increases in open-cast mining costs. In July 2012, the government reduced the fuel tax credit to the mining sector by AUD 0.0621 per litre, further increasing fuel costs. These developments not only impacted on the costs of mining, but also on the cost of inland transportation and port usage, further increasing Australian FOB costs. The supply costs of met coal have not escaped cost increases either. The FOB supply costs of met coal are usually higher than those of thermal coal: the higher prices of met coal (above USD 320/t in 2011) drove investments in production capacity at higher-cost mines. However, prices have plummeted since mid-2011. In January 2012, met coal FOB prices ranged from USD 140/t to USD 225/t, depending on coal quality. In December 2012, prices decreased to between USD 120/t and USD 160/t, rendering production unprofitable for many exporters (see Figure 2.37).
Figure 2.37 Indicative met coal FOB cost curve and FOB price levels, 2012
Notes: FOB price levels are monthly averages derived from different price indexes, such as Australian prime hard coking, Australian low-volatile PCI, US high-ash, high-volatile and US low volatile. Price levels of certain met coal types can deviate from these indicative figures. FOB costs comprise variable production costs, processing, overburden removal, royalties, port usage and inland transportation.
Sources: Wood MacKenzie (2013), “Coal modelling”, workshop presentation at the IEA, Paris, 25-26 April; McCloskey (2013), McCloskey Coal Reports 2010-2013, McCloskey’s, London, http://cr.mccloskeycoal.com; IEA analysis.
References Australian Bureau of Statistics (2013), 6345.0 Wage Price Index, Australia, June 2013, Australian Bureau of Statistics, Canberra, www.abs.gov.au/ausstats/[email protected]/mf/6345.0/. Anglo American (2008-12), Annual Reports, Anglo American, London. Bloomberg Professional service (2013), www.bloomberg.com/professional/ (accessed 1 September 2013).
0
50
100
150
200
250
300
0 50 100 150 200 250
USD/t
MtAustralia Canada Russia United States Other
© O
EC
D/IE
A, 2
013

RECENT TRENDS IN INTERNATIONAL COAL TRADING
MEDIUM-TERM COAL MARKET REPORT 2013 75
EIA (US Energy Information Administration) (2013), Quarterly Coal Reports 2002 through 2012, EIA, Washington, DC. Federal State Statistics Service of the Russian Federation, Среднемесячная номинальная начисленная заработная плата по видам экономической деятельности (Average Monthly Nominal Accrued Wages by Kinds of Economic Activities), Federal State Statistics Service, Moscow, www.gks.ru/bgd/regl/b12_06/IssWWW.exe/Stg/d01/03-10.htm. Glencore Xstrata (2008-12), Annual Reports, Glencore Xstrata, Zug, Switzerland. Hecking H. and T. Panke (2013), Quantity-setting oligopolies in complementary input markets, EWI Working Paper, Cologne, www.ewi.uni-koeln.de/fileadmin/user_upload/Publikationen/Working_Paper/EWI_WP_13-18_quantity-setting_oligopolies_in_complementary_input_markets.pdf. McCloskey (2013), McCloskey Coal Reports 2010-2013, McCloskey’s, London, http://cr.mccloskeycoal.com. Rio Tinto (2012), Annual Report, Rio Tinto, London and Melbourne. RZD (Russian Railways) (various years), Annual Report, RZD, Moscow. Statistics South Africa (2013), Quarterly Employment Statistic (QES), June 2013, Statistics South Africa, Johannesburg, www.statssa.gov.za/publications/P0277/P0277June2013.pdf. US Bureau of Labor Statistics (2013a), Producer Price Data Commodity and Industry, United States Department of Labor, Washington, DC, www.bls.gov/data/. US Bureau of Labor Statistics (2013b), Employment, Hours, and Earnings from the Current Employment Statistics survey (National), Industry: Coal Mining (average hourly earning of all employees), United States Department of Labor, Washington, DC, www.bls.gov/data/. Vale (2012), Annual Report, Vale, Rio de Janeiro. VDKI (Verein der Kohlenimporteure e.V.) (2013), Annual Report 2013: German Hard Coal Importer’s Association, VDKI, Hamburg. Wood MacKenzie (2013), “Coal modelling”, workshop presentation at the IEA, Paris, 25-26 April. World Steel Association (various years), Crude Steel Production, Brussels, World Steel, www.worldsteel.org/statistics/BFI-production.html.
© O
EC
D/IE
A, 2
013

MEDIUM-TERM PROJECTIONS OF DEMAND AND SUPPLY
76 MEDIUM-TERM COAL MARKET REPORT 2013
3. MEDIUM-TERM PROJECTIONS OF DEMAND AND SUPPLY
Summary • In the Base Case Scenario (BCS), global coal demand grows 2.3% per year, from 5 530 million
tonnes of coal-equivalent (Mtce) in 2012 to 6 347 Mtce in 2018. Coal continues to be the fossil fuel with the largest growth in absolute terms, although gas grows 2.4% over the same period.
• Coal demand among Organisation for Economic Co-operation and Development (OECD) member countries remains almost flat until 2018. Decreasing coal demand in OECD Europe (-1.0% per year) and the United States (-0.1% per year) is compensated by the projected increase (+1.0% per year) in OECD Asia Oceania.
• Non-OECD economies drive all growth in coal demand, which post an average growth rate of 3.1% per year until 2018, accounting for 77% of global coal use in 2018. China is once again the engine, contributing almost 60% (476 Mtce) of incremental coal demand in 2018.
• Chinese demand is subject to highly uncertain developments, such as energy efficiency improvements, elasticity of electricity in relation to gross domestic product (GDP), energy diversification and, potentially, coal conversion. The transition to a less coal-dependent economy would be influenced by gas scarcity or the cost evolution of renewables. While demand from planned coal conversion projects might amount to 325 Mtce by 2018, the projects’ progress is uncertain due to high capital intensity, water issues and environmental impacts.
• Global coal supply is projected to grow by 681 Mtce, to 6 347 Mtce in 2018. Non-OECD countries – foremost China – increase coal production by 594 Mtce per year in 2018. Coal supply in OECD member countries will grow by 87 Mtce, with incremental volume coming mainly from Australia.
Introduction This year’s Medium-Term Coal Market Report (MTCMR) introduces a new classification of demand projection. While the coal demand forecast was subdivided into power and non-power coal demand in the two previous editions of the MTCMR, the 2013 edition provides an outlook on the development of demand by coal type. The demand forecast we present in this chapter is subdivided into thermal coal and lignite demand and metallurgical coal (met coal) demand. This is a more market-oriented approach, as met coal is priced and traded differently than thermal coal and lignite. As with the MTCMR 2011 and MTCMR 2012, the International Energy Agency (IEA) provides projections for the three types of coal for both OECD member countries and non-OECD countries. Coal usage is driven by factors such as the relative prices of coal and its substitutes (particularly for power generation and industry), economic and population growth, and electrification rates. However, similar growth rates of the GDP in two countries may result in different growth rates for coal demand, depending on the country’s average per-capita income (used as a measure of its development level), resource endowment and energy policy, among others. To account for the diverse influences, the MTCMR 2013 bases demand projections on country-specific econometric estimations, e.g. the elasticity
© O
EC
D/IE
A, 2
013

MEDIUM-TERM PROJECTIONS OF DEMAND AND SUPPLY
MEDIUM-TERM COAL MARKET REPORT 2013 77
of thermal coal demand to GDP or population growth. Using assumptions on various relevant parameters (such as GDP and population growth forecasts provided by the International Monetary Fund (IMF), fuel prices and average efficiency development of coal-fired power plants in the various countries) allows us to derive demand projections specific to the country and coal type. Drawing on the broad expertise of the IEA on primary energy markets enables consistent demand estimates that account for development in the other primary energy markets, such as natural gas, renewable energies or crude oil. Given recent developments in the international coal market and the high uncertainty companies involved in coal production, trading or consumption face in forecasting international coal market developments, the MTCMR 2013 continues its tradition of providing sensitivity analyses in addition to the BCS. In contrast to the two previous editions, this report features not one, but two sensitivity cases, the Chinese Low-Demand Case (CLDC) and the Indian High-Demand Case (IHDC). This allows us to capture a wide range of uncertainties affecting global market demand, supply and trade. Assumptions GDP growth is probably the single most important driver of global coal use. Both the BCS and the demand in this report’s sensitivity analyses are based on the April 2013 IMF forecast (IMF, 2013) that global GDP will grow on average by 4.2% per year from 2013 to 2018.1 Comparing the April 2013 IMF forecast with the April 2012 forecast used in last year’s MTCMR (IEA, 2012a) shows that the IMF revised its projections downward for the period 2012-17, with the compound average growth rate (CAGR) almost 0.2 percentage points lower than the previous year (4.0% versus 4.2%). However, the 0.2% CAGR is as high for the 2013-18 outlook period of the MTCMR 2013 as it was for the outlook period (2012-17) of the 2012 report. The bulk of growth comes from non-OECD economies, which are projected to grow at 5.9% per year over 2012-18, while OECD member countries will increase their cumulative GDP by 2.2% per year. OECD member countries are not expected to exhibit substantial growth prior to 2014. Due to the continued economic struggles in OECD Europe, their real 2013 GDP growth is 1.3%. After 2014, however, the IMF projects resumed economic growth in Europe exceeding 2% per year from 2016 to 2018. OECD Europe will grow on average 1.6% per year. Forecasts for OECD Americas are more positive, with average growth of 3.0% per year, mostly stemming from economic development in the United States. OECD Asia Oceania is expected to grow at 2.2%, slightly less than in the 2012 forecast, with Korea providing the biggest spark, thanks to real growth of 3.8% per year over 2013-18. The share of non-OECD economies in global GDP based on purchasing power parity and constant prices (2010 United States dollars [USD]) is projected to rise from nearly 48% in 2013 to 52% in 2018, due to average annual economic growth almost three times higher than in OECD member countries. Asian economies are projected to maintain strong growth rates between 2013 and 2018, with China growing at 8.4% per year. India and Indonesia have projected growth of over 6.4% per year, even though the IMF forecasts lower growth for both countries than in its April 2012 projections. The revision is far more substantial for India, whose five-year GDP growth is expected to drop by almost 1.5 percentage points. By contrast, other developing Asian economies (5.2% growth per year) and African economies (5.3%) maintain overall strong growth rates. Latin America’s GDP will increase by 3.9% per year. Non-OECD Europe/Eurasia (3.7%) and the Middle East (3.8%) will maintain similar growth rates during this outlook as those set out in the IMF April 2012 projections. 1 The IMF published a new forecast in October 2013. This analysis is however based on the forecast of April 2013.
© O
EC
D/IE
A, 2
013

MEDIUM-TERM PROJECTIONS OF DEMAND AND SUPPLY
78 MEDIUM-TERM COAL MARKET REPORT 2013
The MTCMR 2013 considers the evolution of fuel prices as a major input for the coal market equilibrium models featured in our trade projections. These figures are typically derived from forward price curves (with adjustments) and explicitly not to be interpreted as official IEA forecasts. The price paths for oil, gas and coal are consistent with IEA (2013a) and IEA (2013b). Nominal IEA average oil import price amounted to USD 109 per barrel (USD/bbl) on average in 2012 and is assumed to remain at this level in 2013, declining afterwards from USD 105/bbl in 2014 to USD 93/bbl in 2018.
Figure 3.1 Regional (real) steam coal price assumptions, 2012-18, delivered to the power plant
Notes: USD2012/GJ = 2012 USD per gigajoule. Unless otherwise indicated, all material in figures and tables derives from IEA data and analysis.
Competition between natural gas and coal is particularly fierce in the power sector of OECD member countries, including the United States and most of OECD Europe. The natural gas market continues to lack sufficient interregional arbitrage (due, among other things, to higher seaborne transportation costs, infrastructure constraints and oil-price-indexed long-term contracts). Regional gas price divergence among the United States, Europe and Asia is therefore assumed to persist over the outlook period, rendering coal-to-gas competition in Asian economies almost impossible, at least under current market conditions. After temporarily falling below USD 2 per million British thermal unit (USD/MBtu) in April 2012 and averaging USD 2.8/MBtu over the entire year, the Henry Hub gas price is assumed to remain just below the USD 4/MBtu threshold in 2013, increasing progressively to USD 4.6/MBtu by 2018. Continental Europe will continue to see a mix of spot and oil indexation. The average USD 10.8/MBtu import price over 2013-18 will be slightly higher than for British gas users, as the spot price at the national balancing point will amount to USD 10.4/MBtu on average. Gas prices in OECD Asia Oceania (represented by Japan) are expected to remain well above European prices, despite some potentially positive developments in hub-based gas trading in Asia. The price for liquefied natural gas imports is assumed to be USD 15/MBtu on average. Regional coal prices in this outlook are based on forward curves subject to individual adjustments, e.g. for transport and handling costs. Prices for coal delivered to power plants are generally assumed to remain flat in most countries (see Figure 3.1). India is an exception: thanks to an expected increase in steam coal imports and a slow to moderate rise of domestic coal prices, average delivery prices to power plants are assumed to double (to USD 2 per gigajoule). Nevertheless, delivery prices in India are still expected to amount to half the costs paid by other countries in Figure 3.1.
0
1
2
3
4
5
2012 2014 2016 2018
United States (Eastern) Northwest Europe (Continental)Japan China (Southeast Coast)India
USD2012/GJ
© O
EC
D/IE
A, 2
013

MEDIUM-TERM PROJECTIONS OF DEMAND AND SUPPLY
MEDIUM-TERM COAL MARKET REPORT 2013 79
Projections of global coal demand in the BCS In the BCS, global coal demand is projected to grow by 14.8% (2.3% per year on average), from 5 530 Mtce in 2012 to 6 347 Mtce in 2018. Thus, considering the average annual growth rate of 3.5% over the last five years, coal demand growth is projected to slow down. Almost 60% (476 Mtce) of incremental global coal demand can be attributed to increased use in China, which already accounted for more than 50% of global coal demand in energy content in 2012. In relative terms, the Other developing Asia country grouping leads the way (7.2% growth per year over 2012-18), followed by Latin America (5.4%) and India (4.8%). Thus, non-OECD economies clearly drive global coal use, with an aggregated growth rate of 3.1% per year during the outlook period. By 2018, coal consumption in non-OECD economies accounts for 77% of global coal use. While coal demand among non-OECD economies is expected to continue on its recent growth path, coal use in OECD member countries remains almost flat (0.0% per year). Absolute coal demand increases by only 1 Mtce, from 1 458 Mtce in 2012 to 1 459 Mtce in 2018. Coal demand decreases in OECD Europe (-1.0% per year) and the United States (-0.1% per year), which together account for more than two-thirds of OECD coal consumption. However, coal demand in OECD Europe is expected to decline continuously, contrary to the United States, where it grows in the first half of the outlook period and drops in the second half. The decline in United States (US) coal use is counterbalanced by the other OECD Americas economies, resulting in almost zero growth on a country grouping level from 2012 to 2018. Coal demand in OECD Asia Oceania is projected to increase by 22 Mtce, or 1.0% per year. OECD coal demand projection, 2013-18 Thermal coal and lignite demand
As Figure 3.2 shows, demand for thermal and lignite coal in OECD member countries is projected to decrease slightly from 1 276 Mtce in 2012 to 1 266 Mtce in 2018, despite slight growth (to 1 295 Mtce) until 2014. OECD countries’ global share of consumption will further decrease, from 27% in 2013 to 24% in 2018. The vast majority (89%) of their thermal coal and lignite consumption continues to be for power generation. Other important usage sectors are district heating, as well as the cement, iron and steel industries. US lignite and thermal coal demand in power generation accounts for more than 43% of total OECD consumption throughout the outlook period. The sharp rise in gas prices and power demand in 2013 drives coal demand growth for power generation. In 2014, thermal coal and lignite demand is projected to increase by a mere 4.6% in total compared with 2012. From 2015 onward, it will decrease to 2012 levels for several reasons. Retirements of coal-fired power plants are expected to amount to 35 gigawatts (GW) until 2018, driven by their age structure and the mercury and air toxins standards. Moreover, US President Barack Obama has announced further measures to curb carbon emissions. Given that US gas prices are not expected to skyrocket in coming years, large-scale investments in new coal-fired capacities are unlikely in the current political and economic environment, especially given United States Environmental Protection Agency regulations on new coal plants. Although utilisation rates of the remaining coal-fired power plants might increase, projections show US thermal coal and lignite demand of 585 Mtce in 2018 compared with 589 Mtce in 2012. In OECD Europe, coal and lignite power generation will remain at the high level of 2012 in the near future, but will become more bearish over the outlook period. Total consumption of lignite and thermal
© O
EC
D/IE
A, 2
013

MEDIUM-TERM PROJECTIONS OF DEMAND AND SUPPLY
80 MEDIUM-TERM COAL MARKET REPORT 2013
coal is projected to drop, from 371 Mtce in 2012 to 348 Mtce in 2018. Since gas prices in Europe are not expected to plummet and carbon dioxide (CO2) price futures do not indicate an upward tendency, a significant fuel switch from coal-to-gas seems unlikely until 2018. European power demand, however, does not signal a rise in coal-fired generation. First, the IMF in April 2013 has corrected the expected European GDP growth downward. Second, European energy policy aims to further increase energy efficiency, with the ambitious target of enhancing renewable power generation. Third, investors in coal-fired power plants perceive a high political uncertainty over a further stripping of CO2 allowances and plans to install CO2 price floors. Further taking into account the low power prices, we do not expect large-scale investments in steam coal-fired power plants during the outlook period. Three notable exceptions are Turkey, which plans to increase coal-fired capacity to satisfy its growing energy needs, and Germany and Netherlands, with new capacity coming online owing to long-standing decisions.
Figure 3.2 Projection of thermal coal and lignite demand for OECD member countries
* Estimate.
Thermal coal and lignite consumption in OECD Asia Oceania is projected to grow by 0.8% per year, from 274 Mtce in 2012 to 287 Mtce in 2018. This development is driven by Korea (3.5% GDP growth) and Japan (1.4%). Increasing power consumption in Korea has fostered investment in new coal-fired power plants, and at least 10 GW will come online during the outlook period. Japan also sees increasing coal consumption from power generation. The Haramachi power plant is back in operation after the Great East Japan Earthquake and tsunami. New capacity (such as in Hitachinaka and Hirono) is about to come online and the Osaki plant (170 megawatts [MW]) is scheduled to come online in 2017. Met coal demand
Among OECD member countries, met coal demand accounted for approximately 12.5% of total coal use (182 Mtce) in 2012. Met coal demand is now projected to grow moderately at 1.0% per year, to 193 Mtce by the end of the outlook period. Growth is driven by increasing demand from OECD Asia Oceania and OECD Americas, while OECD Europe met coal demand is expected to fall during the outlook period. These developments mirror, among other things, the respective economic outlook of the three country groupings.
0
200
400
600
800
1 000
1 200
1 400
2011 2012* 2014 2016 2018
Mtce
OECD Europe OECD Asia Oceania OECD Americas excl. United States United States
© O
EC
D/IE
A, 2
013

MEDIUM-TERM PROJECTIONS OF DEMAND AND SUPPLY
MEDIUM-TERM COAL MARKET REPORT 2013 81
OECD Europe’s met coal use is projected to decrease from 71 Mtce in 2012 to 69 Mtce in 2018, a decline of 0.3% per year (see Figure 3.3). However, use differs within OECD Europe countries. Fuelled by its economic growth, Turkey continues its recent ramp-up of steel production (+9.4% per year on average since 2005), thereby increasing its need for met coal imports. Meanwhile, Germany and the United Kingdom will slightly decrease their use, due to stagnating steel production, efficiency gains and increasing scrap use.
Figure 3.3 Projection of met coal demand for OECD member countries
* Estimate.
Met coal demand among OECD Americas economies increases by 3 Mtce (+12.2%), from 27 Mtce in 2012 to 30 Mtce in 2018. This amounts to 1.9% growth per year on average, the highest relative growth among the three OECD country groupings. The United States accounts for around 70% of met coal demand, and a similar share of OECD Americas incremental met coal use, through 2018. The country benefits from increasing industrial production, spurred by its healthy economic growth (+2.9% per year on average) during the outlook period. The remaining incremental demand comes from Chile and Mexico, both of which realise moderate growth in met coal use. While demand in OECD Americas grows the fastest, OECD Asia Oceania is projected to increase demand most in absolute terms, from 85 Mtce in 2012 to 93 Mtce in 2018 (+8 Mtce). The bulk of use comes from Korea, whose demand rises by almost 5 Mtce to 37 Mtce by 2018, in line with increasing crude steel output. Japan, the world’s second-largest met coal consumer, is projected to increase demand by more than 2 Mtce (4.4%) during the outlook period. Non-OECD coal demand projection, 2013-18 Thermal coal and lignite demand
Non-OECD countries account for the entire growth of global thermal coal and lignite consumption until 2018. As Figure 3.4 shows, demand will rise from 3 384 Mtce in 2012 to 4 084 Mtce in 2018. While the 3.2% growth rate per year will be significantly lower than over the last decade (+7.1% per year), the 700 Mtce increase is higher than the total current thermal coal and lignite consumption of
0
50
100
150
200
250
2011 2012* 2014 2016 2018
Mtce
OECD Europe OECD Asia Oceania OECD Americas excl. United States United States
© O
EC
D/IE
A, 2
013

MEDIUM-TERM PROJECTIONS OF DEMAND AND SUPPLY
82 MEDIUM-TERM COAL MARKET REPORT 2013
the United States and Germany. Power generation remains the most important driver of these coal types, increasing its share from 60% to 62% of total end-use over the outlook period.
Figure 3.4 Projection of thermal coal and lignite demand for non-OECD economies
* Estimate.
China accounts for more than half of non-OECD coal demand growth. Its annual thermal coal consumption is projected to grow from 2 277 Mtce in 2012 to 2 669 Mtce in 2018. Thermal coal demand rises 3.4% in the power sector, but only 1.6% in other sectors. While coal demand is impressive in terms of absolute growth, it is projected to slow down compared with the last decade as China seeks to lessen its coal dependency. To this end, China introduced the first of seven emission trading schemes in June 2013. A complete roll-out is projected by 2014 in Shenzhen, Beijing, Shanghai, Tianjin and Chongqing, as well as in the Guangdong and Hubei provinces. Once in place, the seven schemes will account for around 7% of China’s total emissions. For example, the first scheme in Shenzhen (launched in June) covers approximately 635 industrial and construction companies, accounting for 38% of the city’s emissions in 2010. China has thus taken its first step towards what might become a nationwide emission trading scheme, although it is unlikely to materialise before the end of this decade. On the other hand, demand forecasts for assumed GDP growth, energy intensity, changes in industry structure or diversification of primary energy sources in China are highly uncertain. Figure 3.5 illustrates the uncertainties over Chinese coal demand development (including met coal) until 2018. The IMF forecasts an average 8.3% GDP growth per year over the outlook period, i.e. total growth of 62% by 2018. If coal demand growth was business-as-usual (BAU), i.e. coal demand grew at the same speed as GDP (assuming constant electricity and coal intensity and no modernisation of the power plant fleet), coal demand would increase by more than 1 700 Mtce. If all known and planned coal conversion projects were also fully realised, demand would rise by another 325 Mtce within the outlook period.
0
500
1 000
1 500
2 000
2 500
3 000
3 500
4 000
4 500
2011 2012* 2014 2016 2018
Mtce
China India Non-OECD Europe/Eurasia Other developing Asia Other non-OECD
© O
EC
D/IE
A, 2
013

MEDIUM-TERM PROJECTIONS OF DEMAND AND SUPPLY
MEDIUM-TERM COAL MARKET REPORT 2013 83
Figure 3.5 Uncertainties of Chinese coal demand until 2018
* Estimate.
However, the new Chinese government now wants to push an economic growth model based on “quality for quantity”. As a consequence of the 12th Five-Year Plan (FYP) (2012-17) policies, the economic model change and urban pollution issues, the government wishes to implement policies on energy and coal intensity. GDP growth and electricity demand (and indirectly, coal demand) are projected to decouple due to intensified energy-efficient measures and structural change towards less power-intensive sectors. Remarkably, the projected decrease in electricity intensity of GDP leads to a reduction of coal consumption equal to the aggregated annual German and British coal consumption. Moreover, China has set ambitious targets to diversify primary energy sources for power generation. The installation of significant renewable energy, gas and nuclear power plant capacities is projected to decrease the share of coal in power generation, curbing Chinese coal demand. The costs of renewables and domestic production of natural gas, especially unconventional gas, are two factors of uncertainty with a potentially major impact on Chinese coal demand; we assume IEA projections for both gas and renewable generation (IEA, 2013b, 2013c). Another important factor is whether coal-fired power plants will maintain the higher efficiency path of the last decade over the outlook period. Coal demand growth rates are also likely to decouple from GDP growth rates in the non-power sector. Most growth has already occurred in both of the largest coal-consuming non-power sectors, i.e. iron and steel and cement production. Improvements in the energy efficiency of production processes and structural changes in Chinese industry will significantly lower the coal intensity of GDP. One special case is coal conversion, perhaps the “sleeping giant” of Chinese coal demand. Although about 325 Mtce of planned coal-to-gas, coal-to-liquids and coal-to-chemicals projects are in the pipeline, it is highly uncertain that all of these projects will be realised in time (or realised at all) within the outlook period. Coal conversion requires high capital investment; there is no guarantee that it will attract investors. Additionally, water scarcity in some Chinese provinces is a critical issue, as coal conversion is very water-intensive (see Box 3.1). Furthermore, without carbon capture and storage, CO2 emissions are higher than just using gas or oil. However, coal conversion could be a source of huge coal demand growth in the future and it is likely that we will revise upward our current projections of 100 Mtce.
BAU growth
Electricity intensity of GDP
Diversification
Modernisation of power plantsPlanned coal
conversion
Coal intensity of GDP (non-power)
Unrealised coal conversion
World thermal seaborne
trade in 2018
0
1 000
2 000
3 000
4 000
5 000
2012* 2018
Mtce
© O
EC
D/IE
A, 2
013

MEDIUM-TERM PROJECTIONS OF DEMAND AND SUPPLY
84 MEDIUM-TERM COAL MARKET REPORT 2013
Box 3.1 Water in China: growing needs, bigger issue
Agriculture, industry and domestic use concentrate most water use and consumption. While most water resources are theoretically renewable, depletion will eventually occur if they are extracted faster than the recharge rate. In many areas of China, increasing water consumption can result in persistent and growing water depletion. Because of wastewater pollution, 21% of available surface water resources in China are not suited for agricultural use.
China’s current total annual water use intensity – i.e. the relation between annual water use and total resources – is 26% (602 billion cubic metres per year [bcm/yr] of 2 326 bcm/yr). Use intensities above 20% generally mean that regions are experiencing severe water supply problems, which need to be addressed by re-using wastewater, exploiting aquifers or desalinating seawater. For example, over the last decade China has sourced its growing total water use (+52.4 bcm/yr, or +10%) from surface and groundwater; today, around 18% (110 bcm/yr) of total water use is supplied by groundwater resources (NBS, 2012). The highest sectoral growth of the last decade occurred in industry (+59%, or +30.8 bcm/yr). Household use and environmental protection provided the balance, while agricultural use slightly declined. Coal-related water use (which includes mining, i.e. dust suppression and re-vegetation, coal washing, coal conversion and most importantly, coal-based power generation) accounts for 18% (108 bcm/yr) of total national water use. It is only second to agriculture, which alone accounts for around 61%, followed by domestic and environmental use (close to 15%) and non-coal-related industrial use (6%). These figures show the importance of coal in managing water use, and vice versa.
Water consumption reflects the share of use that is not returned to national water resources. Coal-based water consumption is 0.8% of total national resources, much lower than for water withdrawal. This significant difference is mostly driven by the power generation sector, where high use-to-consumption rates from once-through cooling-systems (IEA, 2012b) show a strong impact. Nevertheless, this gap can shrink in the future as higher shares of power generation technologies with low water use are deployed in response to water efficiency programmes. While these technologies reduce water use, they also lead to higher levels of water consumption, which could lead to higher levels of permanent water resource depletion.
Chinese policy will have to continue to address future water use by all sectors, including coal. Water pricing reforms, caps on national water use (635 bcm/yr to 2015 and 700 bcm/yr to 2030) and improved enforcement procedures will raise efficiency. In the power sector, this implies more frequent deployment of coal-fired power plants with lower use rates, but higher consumption rates (IEA, 2012b). Assuming the projections of this MTCMR are correct, water use in mining, coal conversion and power generation will lead to coal-related growth in water use of 11.6 bcm/yr over the forecast period, raising overall coal-related water use to 120 bcm/yr – not a dramatic change from the current numbers.
However, a nationwide view can be misleading, since water availability varies considerably among provinces, with potential implications on expected economic developments. Almost 60% of China’s population lives within 19 provinces and cities, which only hold 20% of China’s water resources. Further, more than 80% of China’s coal reserves lie in water-stressed or water-scarce regions. The northeast provinces especially face considerable water constraints, with some provinces even grappling with absolute scarcity levels. Moreover, use intensity in these regions very often exceeds or approaches the 20% threshold. Differences among, and issues within, provinces already require a combination of measures, including further development of water resources and water storage facilities, increased productivity of existing water supplies, enhanced regional transport of water (e.g. the expensive and challenging 36 bcm/yr to 44 bcm/yr South-North Water Transfer Project) and increased interprovincial and international food trades. Finally, an examination of the similar issue at the county level is likely to reveal a bleaker picture of regional water discrepancy in China.
© O
EC
D/IE
A, 2
013

MEDIUM-TERM PROJECTIONS OF DEMAND AND SUPPLY
MEDIUM-TERM COAL MARKET REPORT 2013 85
Box 3.1 Water in China: growing needs, bigger issue (continued)
Map 3.1 Water resource scarcity in China, 2012 and 2018
Note: km3 = cubic kilometre.
Sources: NBS (National Bureau of Statistics of China) (2012), China Statistical Yearbook 2012, www.stats.gov.cn/tjsj/ndsj/2012/indexeh.htm; IEA analysis.
All these measures will likely become necessary to support the expected expansion of coal mining, coal conversion and power generation within specific provinces already facing absolute water scarcity (Shanxi, Ningxia) or water stress (Inner Mongolia, Shaanxi). Whereas these provinces have exceeded or are approaching 20% water use intensity, they often have plans, or are part of significant plans, to expand their provincial coal extraction and/or use. The 12th FYP establishes five “national comprehensive energy bases” in Shanxi, the Ordos basin (overlapping Gansu, Shaanxi, Shanxi, Ningxia and Inner Mongolia), Eastern Inner Mongolia, Southwest China and Xinjiang. The idea is to convert coal into electricity and oil products and transport the energy to demand centres, thereby concentrating 73% of total primary energy produced in China. About half of the energy produced in these energy bases is expected to be transported to the “main energy-consuming zone”.
Inner Mongolia, Shanxi, Shaanxi and Ningxia alone may account for over 90% of national incremental coal-related water use over the forecast period. Coal-related water use could rise by 130% of current use per year in Shanxi and 42% of water use per year in Inner Mongolia, quickly closing today’s gaps between available annual water resources and water used (49% in Shanxi and 57% in Inner Mongolia) to below 10% in Shanxi and 46% in Inner Mongolia. Ningxia could demand further interprovincial water supplies to avoid increasing its high use intensity of groundwater resources (25%).
© O
EC
D/IE
A, 2
013

MEDIUM-TERM PROJECTIONS OF DEMAND AND SUPPLY
86 MEDIUM-TERM COAL MARKET REPORT 2013
Box 3.1 Water in China: growing needs, bigger issue (continued)
With big coal expansion plans, Xinjiang can raise its provincial water use by 13% over the outlook period; however, coal-related water use will remain at a moderate 6% of total use and at 3.6% use intensity. As water use intensity in the province is already above 60% (mostly driven by agriculture), continued efficiencies will need to be found in water scarcity management and infrastructure development. National and provincial water allocation, water pricing and cost developments might impact on the growth level and location of coal-based water use.
Future developments in the Chinese energy sector underline the high uncertainty of Chinese coal demand, both upside and downside. This is aggravated by the possibility that the GDP forecast could also deviate from actual Chinese economic growth. Comparing uncertainty on China with total global seaborne trade volume in 2018 (see Figure 3.5), the high risk that players active on this market are exposed to with respect to Chinese coal demand becomes obvious. Behind China, India accounts for one-fifth of global demand growth until the end of the outlook period. With demand projected to grow by 146 Mtce (+4.8% per year), India will overtake the United States as the second-largest global consumer of thermal coal and lignite. Since the IMF forecasts average 6.2% GDP growth for India during the outlook period, the coal intensity of GDP will further decrease. The key driver of Indian coal demand is the power sector. In recent years, coal-fired power plants have consumed around 71% of total Indian thermal coal and lignite demand, generating over two-thirds of the country’s total power. Although India’s Planning Commission is keen to diversify primary energy sources, coal will remain the backbone of power generation in the medium term. According to the 12th FYP , India is planning to install nearly 70 GW of new coal-fired power plants, at least 50% of which are supercritical, i.e. more efficient. In the last 20 years, however, India has only realised 50% to 75% of its planned power generation capacity extensions. Taking this trend and the improved fuel efficiency of supercritical power plants into account, Indian coal demand in the power sector will grow by 3.9%. In other non-OECD countries in Asia, particularly Indonesia, Viet Nam, Thailand, Malaysia and the Philippines, thermal coal (including lignite) demand will grow by 113 Mtce until 2018. This group of countries is thus growing the fastest, with 7.3% average growth per year. Demand growth is more moderate in Non-OECD Europe/Eurasia (+1.0%). Other non-OECD countries in Africa, the Middle East and Latin America will increase their thermal coal demand by 34 Mtce. With more than 90% of power generation based on coal, South Africa is the world’s fourth-largest consumer, and by far the largest consumer of steam coal of the countries mentioned above. Eskom, the seventh-largest power producer in terms of capacity, is currently building two coal-fired power plants in Medupi and Kusile, with a total capacity of 9.6 GW. Although construction is currently delayed, both plants and another plant in Khanyisa (450 MW) are expected to be commissioned by the end of the outlook period. Met coal demand
Non-OECD countries accounted for 79% (688 Mtce) of global met coal demand in 2012. By 2018, this share is projected to reach 81% – 2.6% growth (116 Mtce) per year over the outlook period (see Figure 3.6). China is responsible for 72% (84 Mtce) of total non-OECD incremental met coal
© O
EC
D/IE
A, 2
013

MEDIUM-TERM PROJECTIONS OF DEMAND AND SUPPLY
MEDIUM-TERM COAL MARKET REPORT 2013 87
demand (116 Mtce), increasing demand from 529 Mtce in 2012 to 613 Mtce in 2018 as a result of the continued expansion of steel production (see Box 3.3). However, growing use of direct-reduced iron (DRI) and scrap will somewhat limit growth in met coal consumption.
Figure 3.6 Projection of met coal demand for non-OECD economies
* Estimate.
India surpassed Russia and became the fourth-largest producer of crude steel behind China, Japan and the United States in 2009. The country produced 77 million tonnes (Mt) in 2012. With GDP projected to grow by 6.5% per year on average (thanks in large part to infrastructure investments), India is likely to surpass or at least challenge Japan, the second-largest crude steel producer (107 Mt in 2012) and the United States, the third-largest producer (89 Mt). Thus, despite its high share of DRI production, India’s met coal demand is projected to exhibit the second-largest increase of any single country. It is surpassed only by China, whose met coal use is projected to grow from 39 Mtce in 2012 to 56 Mtce in 2018 (+17 Mtce, or 6.5% per year). Non-OECD Europe/Eurasia, the second-largest met coal-consuming region, is not projected to increase substantially during the outlook period. Growth will amount to a mere 0.6% per year (+3 Mtce only), from 91 Mtce in 2012 to 94 Mtce in 2018. Latin America registers the fastest growth in met coal demand of the non-OECD country groupings. From 2012 to 2018, consumption is projected to increase by an impressive 61% (+8.2% per year on average), albeit starting from the relatively low level of 15 Mtce in 2012. The key driver is Brazil. Thanks to its huge deposits of high-quality iron ore, the country already ranks among the top ten producers of crude steel and is one of the largest exporters of semi-finished and finished steel products. Yet Brazilian steel exports have dipped in recent years, while production of crude steel has continued to grow, in line with domestic consumption. With Brazil’s GDP set to grow by 3.9% per year during the outlook period, crude steel production is expected to increase at a similar pace, also spurring met coal demand.
0
100
200
300
400
500
600
700
800
900
2011 2012* 2014 2016 2018
Mtce
China India Non-OECD Europe/Eurasia Other developing Asia Other non-OECD
© O
EC
D/IE
A, 2
013

MEDIUM-TERM PROJECTIONS OF DEMAND AND SUPPLY
88 MEDIUM-TERM COAL MARKET REPORT 2013
Box 3.2 Who is more dependent on coal?
As seen in Figure 3.7, since 1990, non-OECD countries have consumed more primary energy from coal than OECD member countries. Whereas OECD member countries have slightly decreased coal consumption since then, non-OECD countries have more than doubled their coal demand. Demand projections until 2018 indicate that this trend will continue: the entire growth in global coal demand derives from non-OECD countries, which consume more than three times as much coal as OECD members in 2018. Given these numbers, one might say that many non-OECD countries are heavily dependent on coal.
Figure 3.7 Coal consumption of OECD member countries versus non-OECD countries, 1980-2018
However, a look at the per-capita coal consumption may show a different picture. The left chart of Figure 3.8 illustrates per-capita primary energy consumption of OECD member and non-OECD countries between 1980 and 2018 (projected). Although the gap between the OECD and the rest of the world has shrunk since 2000, the per-capita coal consumption of OECD member countries was 64% higher in 2012, and will remain 42% higher in 2018, than in non-OECD countries.
Figure 3.8 Per-capita coal consumption Figure 3.9 Per-capita coal consumption of OECD member countries in power generation, 2011 versus non-OECD countries, 1980-2018
*Estimate.
Note: tce/capita = tonnes of coal-equivalent per capita.
Sources: IMF (2013), World Economic Outlook Database, April 2013, Washington, DC, www.imf.org/external/pubs/ft/weo/2013/01/ weodata/index.aspx; IEA analysis.
0
1 000
2 000
3 000
4 000
5 000
6 000Mtce
OECD non-OECD OECD projections non-OECD projections
0
0.5
1
1.5
2
OECD non-OECDOECD projections non-OECD projections
tce/capita
0
0.5
1
1.5
2
2.5
3tce/capita
© O
EC
D/IE
A, 2
013

MEDIUM-TERM PROJECTIONS OF DEMAND AND SUPPLY
MEDIUM-TERM COAL MARKET REPORT 2013 89
Box 3.2 Who is more dependent on coal? (continued)
The situation is similar in the power sector. China, India and Indonesia have increased coal-fired generation substantially in recent years. Coal is the backbone of their power systems. In 2011, their combined coal consumption for power generation alone was higher than the entire OECD coal demand. Meanwhile, countries like Germany or Denmark are intensifying renewable power generation and coal-fired generation in the United States is under pressure from inexpensive natural gas. Yet another look at the per-capita coal consumption for power generation (see Figure 3.9) shows that China, which generates roughly 80% of its total power from coal, is in the same range as Germany or Denmark. Per-capita coal consumption for power generation in the United States is even twice as high.
Projections of global coal demand in alternative scenarios (CLDC and IHDC) Assessing the future development of coal demand in different countries is a challenging task entailing a high degree of uncertainty. Given the importance of China and India in the development of global coal demand, this report contains two sensitivity cases, the CLDC and the IHDC. The IEA would like to stress that these cases represent neither a forecast nor the opinion of the IEA on future developments in these economies. Rather, they are sensitivity cases that serve to quantify magnitudes of uncertainty on coal consumption, production and trade flows. Projections of global coal demand in the CLDC, 2013-18 The CLDC takes into account two major uncertainties when projecting Chinese coal demand. First, the decrease in electricity intensity of the GDP is twice as high as in the BCS. In other words, electricity consumption is assumed to decouple from the Chinese GDP twice the difference projected in the BCS, which implies lower coal generation. Second, the amount of coal used for coal conversion to liquids, natural gas and chemicals is assumed to be half as high as in the BCS. The other factors of uncertainty, particularly IMF projections for GDP growth or the share of coal in power generation, remain unchanged. As this sensitivity analysis focuses only on thermal coal, met coal projections remain unchanged.
Figure 3.10 Projection of Chinese and rest of world (ROW) coal demand in the BCS and CLDC
* Estimate.
0
500
1 000
1 500
2 000
2 500
3 000
3 500
2012* 2014 2016 2018
Mtce
China BCS China CLDC ROW BCS ROW CLDC
© O
EC
D/IE
A, 2
013

MEDIUM-TERM PROJECTIONS OF DEMAND AND SUPPLY
90 MEDIUM-TERM COAL MARKET REPORT 2013
Total Chinese coal consumption in the CLDC amounts to 3 101 Mtce in 2018, a growth rate of 1.7% per year on average, 0.9 percentage points below the growth rate in the BCS. Chinese coal demand is therefore 182 Mtce lower in the CLDC than in the BCS. This difference is even higher than current Chinese imports. Lower Chinese demand will decrease coal prices and demand in other countries will react. The rest of the world will increase annual coal consumption by 42 Mtce until 2018 in the CLDC, compared to 3 065 Mtce in the BCS. Figure 3.10 summarises these results. Projections of global coal demand in the IHDC, 2013-18 The IHDC assumes that generation capacity of coal-fired power plants is extended according to the targets in the 12th FYP. To assess the impacts of higher Indian import dependency, domestic coal supply capacities are identical to those in the BCS. In the IHDC, larger capacities of coal-fired power plants increase Indian coal demand to 736 Mtce and coal consumption is therefore 79 Mtce higher than in the BCS. Indian coal demand grows by 6.9% per year, 2 percentage points higher than in the BCS. International coal prices will be higher, due to higher Indian demand on the seaborne market. Therefore, countries in the rest of the world will reduce demand by 32 Mtce in 2018. Projections of global coal supply Global coal supply is projected to amount to 6 347 Mtce in 2018, up from 5 666 Mtce in 2012.2 Total incremental mining activity is 681 Mtce, equivalent to 1.9% growth per year. More than 80% of additional production is thermal coal and lignite. Having decreased from 2011 to 2012 in OECD member countries, coal production will recover and grow by 1.0% per year, to 1 440 Mtce in 2018. Non-OECD countries increase coal production by 594 Mtce, so that these countries will produce about 77% of total global coal by 2018. Thermal coal and lignite supply projection, 2013-18 Total production of thermal coal and lignite grows by 1.9% per year, to 5 350 Mtce in 2018. OECD member countries contribute 12% (67 Mtce) of incremental supply totalling 560 Mtce. Australia, the second-largest producer and leading exporter in the OECD, increases production (particularly of thermal coal) by 59 Mtce, overtaking Russia as the sixth-largest producer of thermal coal. While coal production in the United States, the largest OECD producer, declined sharply between 2011 and 2012, it will remain rather constant over the outlook period. Non-OECD countries increase thermal coal and lignite supply by 494 Mtce between 2013 and 2018, 2.1% growth per year on average. In 2018, China alone will supply 2 480 Mtce of the non-OECD 4 206 Mtce total, contributing 44% of incremental global supply. China remains by far the world’s largest thermal coal producer, although its 46% share of total global supply remains constant. In 2018, China will produce nearly four times more thermal coal and lignite than the United States (the second-largest producer) and over five times more than Indonesia (the new third-largest producer). Figure 3.11 shows those developments. India is projected to increase supply by 2.6% per year over the outlook period, far more than its trend of the last three years (+0.7% on average) would suggest. But with demand projected to increase by 2 All coal supply figures given in this chapter refer to the BCS only. We discuss the other CLDC and IHDC sensitivity cases in the chapter “Medium-term projections of seaborne trade”. Although total demand and supply are different in each of the three cases, changes in supply are minor compared to overall supply volume. Production data for CLDC and IHDC are available in the annex.
© O
EC
D/IE
A, 2
013

MEDIUM-TERM PROJECTIONS OF DEMAND AND SUPPLY
MEDIUM-TERM COAL MARKET REPORT 2013 91
146 Mtce (+4.8% per year) until 2018, the supply increase is rather sluggish. Coal India Limited, which accounts for around 80% of Indian coal production, is still struggling with problems such as environmental constraints and insufficient infrastructure. By the end of the outlook period, Indonesia will switch positions with India to become the world’s third-largest coal producer. Indonesian thermal coal and lignite production is projected to increase by 4.4% per year, to a total of 457 Mtce in 2018. Supplies from Africa and the Middle East increase by 3.0% per year. This growth is mainly driven by incremental South African domestic demand, but also by rail expansions of the critical export route to the Richards Bay Coal Terminal (RBCT). In Latin America, and particularly Colombia, supplies increase by 25 Mtce thanks to new Colombian export capacity scheduled to come online between 2012 and 2018.
Figure 3.11 Projection of thermal coal and lignite supply
* Estimate.
Met coal supply projection, 2013-18 Even though the three largest exporting countries, Australia, Canada and the United States, are members of the OECD, only slightly over 30% of the global met coal supply can be attributed to OECD member countries. Non-OECD countries are the main drivers of both demand and supply in the international met coal market. This demonstrates that indigenous (particularly Chinese) production meets most consumption needs (see Figure 3.12). In fact, supply not traded internationally accounts for about two-thirds of global met coal production. From 2012 to 2018, the global met coal supply is projected to grow by 121 Mtce (+2.2% per year on average), from 876 Mtce in 2012 to 997 Mtce by 2018. Non-OECD countries are responsible for over 80% of incremental supply. Met coal output increases by around 100 Mtce, from 600 Mtce in 2012 to 701 Mtce in 2018. Supply in OECD member countries rises by 20 Mtce, despite a projected decrease in OECD Europe production linked to the phasing-out of coal production in Germany towards the end of the outlook. Virtually all incremental supply from OECD member countries comes from Australia, with some additional volumes from Canada (see chapter “Medium-term Projections of Seaborne Coal Trade”).
0
1 000
2 000
3 000
4 000
5 000
2011 2012* 2014 2016 2018
OECD Americas OECD Europe OECD Asia OceaniaChina Non-OECD Europe/Eurasia Other developing AsiaOthers
Mtce
© O
EC
D/IE
A, 2
013

MEDIUM-TERM PROJECTIONS OF DEMAND AND SUPPLY
92 MEDIUM-TERM COAL MARKET REPORT 2013
Box 3.3 The “oxygen route” versus the “electric route”: two routes for steel making
Figure 3.13 shows that crude steel is produced using basic oxygen furnaces (BOFs), in which iron ore and coking coal are the main inputs, or electric arc furnaces (EAFs), in which power and scrap are the main inputs. While the basic oxygen steel-making process is energy self-sufficient (autogenous), i.e. the required thermal energy is generated during the process, EAF steel making is not. Another important difference concerns coal use, since the “oxygen route” necessarily uses coke, and hence coking coal (substitutes like charcoal are insufficient to meet steel demand), to produce crude steel. By contrast, EAF steel making requires only lower-quality hard coal (thermal coal). Besides coal, the other main raw material required in steel making is iron ore. Re-using existing steel-containing products by recycling them (steel scrap) helps reduce the steel industry’s need for raw materials in both processes depicted below.
Figure 3.12 Crude steel production overview
Note: BF = blast furnace; PCI = pulverised coal injection.
A BOF is basically a tiltable mounted cylindrical vessel made of material that is stable (refractory) at high temperatures. A typical BOF in the United States is around 10 metres (m) high, has an outside diameter of approximately 8 m (with a barrel lining of 0.90 m) and a working volume of 225 cubic metres. To produce crude steel, the BOF is charged with liquid pig iron (also referred to as hot metal) and steel scrap, with the former accounting for 70% to 80% of total input; nearly pure oxygen (> 90%) is added (“blown”) onto the steel and iron alloy using a water-cooled lance. The oxygen ignites the carbon in the alloy, increasing the heat in the BOF to around 1 700°C, causing the scrap to melt and reducing the iron’s carbon content. After 15 to 20 minutes of blowing and once the remaining impurities have been removed (e.g. using limestone), the BOF is tilted and the steel poured into a ladle, ready for further refinery. The BOF produces one batch (“heat”) roughly every 40 minutes.
Crude steel
BOF EAF
BF
Pig iron
DRI plant
DRI
Sinter plant Coke battery Pellet plant
Iron oreCoalCoking coal
PCI
Sinter
Iron ore
Lump coke
Scrap steel
Pellets
“Oxygen Route” “Electric Route”
Input Production facility©
OE
CD
/IEA
, 201
3

MEDIUM-TERM PROJECTIONS OF DEMAND AND SUPPLY
MEDIUM-TERM COAL MARKET REPORT 2013 93
Box 3.3 The “oxygen route” versus the “electric route”: two routes for steel making (continued)
By contrast, an operating cycle in an EAF takes approximately 50% longer (60 minutes). The working volume of an EAF is also typically smaller than that of a BOF, though furnace design can vary widely. An EAF consists of a vessel featuring a lower (often hemispherical) bowl made of refractory material, topped by a removable roof. The vessel is installed on a tilting platform. If the EAF is large, it is usually water-cooled. The retractable roof contains one or more (most often three) electrodes, depending on whether the EAF is a direct- or alternating-current furnace. To produce steel, the EAF is first charged with scrap which, depending on quality, may be complemented with DRI. Next, the roof is closed and the electrodes used to strike an arc onto the scrap, which starts to melt. Initially only a medium voltage level can be used, but with the increasing heat in the furnace, the electrodes are moved into the molten scrap, allowing the arc to stabilise and higher voltage levels to be applied. In addition to the electrodes, chemical energy is used to melt the scrap, e.g. by using oxy-fuel burners. Once the scrap is completely molten, oxygen can be added directly to the bath, causing an exothermic reaction (as with the BOF). After refining and deslagging (removing impurities) operations, the steel is ready to be tapped, i.e. poured into a ladle for further transfer.
The use of coal in steel making
Steel and coal are closely linked. As shown in Figure 3.13, increasing steel production may trigger a rise in hard coal demand in many different ways. One of the major uses of coal in steel making is to produce coke, which then serves to maintain the iron production process in a blast furnace (BF). As a rule of thumb, producing 1 tonne (t) of coke requires around 1.25 t of coking coal. In pig iron production, coke has three major roles: first, as a fuel (providing heat); second, as a chemical-reducing agent (reducing iron oxides); and third, as a permeable support. While coke is essential as a permeable support for the BF charge, its two other roles can be substituted by oil, gas, coal or plastics. Coking coal is scarce and therefore very expensive – especially the highest qualities. As a consequence, coke has increasingly been substituted over the last decades, particularly through the PCI method. Injecting pulverised coal together with hot air into the BF propagates coal and coke combustion, which in turn increases BF performance and reduces production costs, since cheaper (thermal) coal can be used. Furthermore, a PCI plant costs around one-fourth as much as a coke oven, thus reducing investment costs. According to the World Steel Association, 1 t of PCI coal displaces about 1.4 t of coking coal. Therefore, the coke rate, i.e. the weight of coke required to produce 1 t of iron, stands at approximately 0.25 t, down from 1 t some 40 years ago. Yet producing 1 t of steel using the oxygen route still requires approximately 800 kilograms (kg) of coal.
As described earlier, the electric route requires the input of neither coke nor coal. However, the whole process of producing crude steel in an EAF is still very energy-intensive, as it uses electricity to melt the steel scrap. Since EAFs are often used in countries that rely heavily on coal-fired power plants to generate electricity, 150 kg of coal are required to produce 1 t of steel in an EAF. Pellet production from iron ore also requires a high amount of energy, further increasing the overall coal intensity of the electric route. Last but not least, scrap was once steel just made from iron ore and coal.
“China is coal and coal is China” – this provocatively short summary of global coal markets also proves true for met coal production taken alone. Almost 60% (+70 Mtce) of additional global supply projected to come online from 2012 to 2018 is mined on Chinese soil. The country’s met coal output increases by 2.3% per year, from 466 Mtce in 2012 to 535 Mtce in 2018. Indian coal companies mined around 39 Mtce of coking coal in 2012. However, the bulk share of indigenous supply cannot be used in met coal processes, mainly because of its quality. Instead, it is used
© O
EC
D/IE
A, 2
013

MEDIUM-TERM PROJECTIONS OF DEMAND AND SUPPLY
94 MEDIUM-TERM COAL MARKET REPORT 2013
as thermal coal. Supply of coal for met purposes is projected to reach 11 Mtce in 2018. India’s import needs increase further, with incremental demand reaching 17 Mtce by the end of the projection period. Two other non-OECD country groupings, Africa and the Middle East (+17% per year) and Other developing Asia (+6.7% per year), stand out in terms of projected met coal production growth. In both cases, a single country is responsible for most of the supply increase: Mozambique in Africa and the Middle East (see the chapter “Medium-term Projections of Seaborne Coal Trade”) and Mongolia in Other developing Asia. Nearly the entire increase (11 Mtce between 2012 and 2018) occurs in Mongolia, confirming its status as one of the most important international suppliers of met coal to China. Indonesia also raises its output, albeit at a significantly lower level and speed.
Figure 3.13 Projection of met coal supply
* Estimate.
References IEA (International Energy Agency) (2012a), Medium-Term Coal Market Report 2012, OECD/IEA, Paris. IEA (2012b), World Energy Outlook 2012, OECD/IEA, Paris. IEA (2013a), Medium-Term Oil Market Report 2013, OECD/IEA, Paris. IEA (2013b), Medium-Term Gas Market Report 2013, OECD/IEA, Paris. IEA (2013c), Medium-Term Renewable Energy Market Report 2013, OECD/IEA, Paris. IMF (International Monetary Fund) (2013), World Economic Outlook Database, April 2013, Washington, DC, www.imf.org/external/pubs/ft/weo/2013/01/weodata/index.aspx. NBS (National Bureau of Statistics of China) (2012), China Statistical Yearbook 2012, www.stats.gov.cn/tjsj/ndsj/2012/indexeh.htm.
0
200
400
600
800
1 000
2011 2012* 2014 2016 2018
OECD Americas OECD Europe OECD Asia OceaniaChina Non-OECD Europe/Eurasia Other developing AsiaOthers
Mtce
© O
EC
D/IE
A, 2
013

MEDIUM-TERM PROJECTIONS OF SEABORNE COAL TRADE
MEDIUM-TERM COAL MARKET REPORT 2013 95
4. MEDIUM-TERM PROJECTIONS OF SEABORNE COAL TRADE
Summary • International seaborne hard coal trade is projected to grow by 226 million tonnes of coal-equivalent
(Mtce) to 1 204 Mtce in 2018 in the Base Case Scenario (BCS). Seaborne thermal coal trade alone accounts for 913 Mtce in 2018, growing by 176 Mtce compared to 2012.
• In the BCS, the group of Organisation for Economic Co-operation and Development (OECD) member countries will become almost self-sufficient in coal consumption. This development is mainly driven by sluggish coal demand in the United States and OECD Europe and increasing Australian exports of both metallurgical coal (met coal) and steam coal.
• International seaborne coal trade will further shift to the Pacific basin. By 2018, around four-fifths of seaborne traded thermal coal and two-thirds of met coal will be destined for Asia. India is the growth engine, with thermal coal imports alone projected to grow by 85 Mtce, or almost 12% per year, until 2018.
• Incremental seaborne exports come predominantly from Australia and Indonesia. Australia is projected to increase annual thermal and met coal exports by 79 Mtce until 2018. Indonesia will increase coal production, particularly of thermal coal, by 72 Mtce over the outlook period and will remain the world’s largest coal exporter.
• Exports from high-cost mines in Australia and the United States are most affected in the Chinese Low-Demand Case (CLDC). In 2018, Chinese thermal coal imports will be 76 Mtce lower in the CLDC than in the BCS. Although lower demand would be partly offset by higher imports from other countries (such as India), high-cost producers would struggle.
Assumptions and methodology This report uses spatial equilibrium simulation models to derive medium-term projections of international thermal coal1 and met coal2 trade. The model estimates trade flows between exporting and importing countries until 2018, based on data about the future development of coal demand, transport, production costs and capacities. Economic theory states that trade flows in well integrated and competitive commodity markets reflect a cost-minimal allocation among production, consumption, exports and imports, subject to mining and infrastructure capacity constraints. The supply side of hard coal trade is characterised by a few multinational companies, state-run entities and a large number of smaller players. Although some objections regarding the existence of a perfectly competitive market structure may arise, the rather low market concentration justifies considering hard coal trade as competitive. Global hard coal markets are further assumed to be well integrated.
1 See Paulus and Trüby (2011) for a detailed model description. 2 For further details, please refer to Trüby (2012).
© O
EC
D/IE
A, 2
013
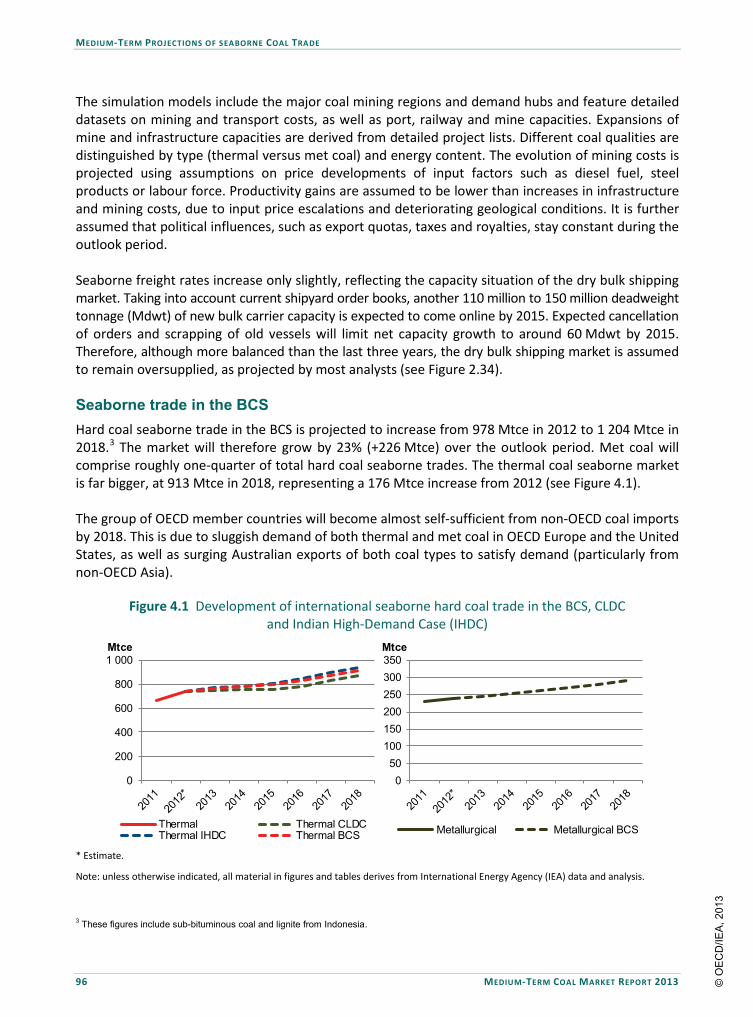
MEDIUM-TERM PROJECTIONS OF SEABORNE COAL TRADE
96 MEDIUM-TERM COAL MARKET REPORT 2013
The simulation models include the major coal mining regions and demand hubs and feature detailed datasets on mining and transport costs, as well as port, railway and mine capacities. Expansions of mine and infrastructure capacities are derived from detailed project lists. Different coal qualities are distinguished by type (thermal versus met coal) and energy content. The evolution of mining costs is projected using assumptions on price developments of input factors such as diesel fuel, steel products or labour force. Productivity gains are assumed to be lower than increases in infrastructure and mining costs, due to input price escalations and deteriorating geological conditions. It is further assumed that political influences, such as export quotas, taxes and royalties, stay constant during the outlook period. Seaborne freight rates increase only slightly, reflecting the capacity situation of the dry bulk shipping market. Taking into account current shipyard order books, another 110 million to 150 million deadweight tonnage (Mdwt) of new bulk carrier capacity is expected to come online by 2015. Expected cancellation of orders and scrapping of old vessels will limit net capacity growth to around 60 Mdwt by 2015. Therefore, although more balanced than the last three years, the dry bulk shipping market is assumed to remain oversupplied, as projected by most analysts (see Figure 2.34). Seaborne trade in the BCS Hard coal seaborne trade in the BCS is projected to increase from 978 Mtce in 2012 to 1 204 Mtce in 2018.3 The market will therefore grow by 23% (+226 Mtce) over the outlook period. Met coal will comprise roughly one-quarter of total hard coal seaborne trades. The thermal coal seaborne market is far bigger, at 913 Mtce in 2018, representing a 176 Mtce increase from 2012 (see Figure 4.1). The group of OECD member countries will become almost self-sufficient from non-OECD coal imports by 2018. This is due to sluggish demand of both thermal and met coal in OECD Europe and the United States, as well as surging Australian exports of both coal types to satisfy demand (particularly from non-OECD Asia).
Figure 4.1 Development of international seaborne hard coal trade in the BCS, CLDC and Indian High-Demand Case (IHDC)
* Estimate.
Note: unless otherwise indicated, all material in figures and tables derives from International Energy Agency (IEA) data and analysis.
3 These figures include sub-bituminous coal and lignite from Indonesia.
0
200
400
600
800
1 000Mtce
Thermal Thermal CLDCThermal IHDC Thermal BCS
0 50
100 150 200 250 300 350Mtce
Metallurgical Metallurgical BCS
© O
EC
D/IE
A, 2
013

MEDIUM-TERM PROJECTIONS OF SEABORNE COAL TRADE
MEDIUM-TERM COAL MARKET REPORT 2013 97
Seaborne thermal coal trade projection, 2013-18 According to projections, seaborne thermal coal trade will increase from an estimated 738 Mtce in 2012 to 913 Mtce in 2018, growing by 3.6% per year over the outlook period. Thus, compared to the average annual growth rate of 8.1% over the last five years, growth is slowing down. Its share of total global thermal coal demand increases slightly, from 17% in 2012 to 18% in 2018. Since European and North American import demand declines, Asian countries account for the entire market growth of seaborne coal trade. While imports to the Atlantic basin decrease by 23 Mtce until 2018, imports to the Pacific basin increase by 199 Mtce. By 2018, 81% of seaborne traded thermal coal is destined for Asia – particularly China; and also India, which accounts for 48% of incremental market growth. China remains the largest importer, increasing imports from 164 Mtce in 2012 to 192 Mtce in 2018. Although former projections showed India becoming the largest thermal coal importer within this decade, China will keep its position as the world’s leading importer: the low price level of internationally traded steam coal currently motivates Chinese coal buyers to do arbitrage by buying coal from the international market when it is cheaper than domestic coal. Consequently, China increased its seaborne thermal coal imports significantly between 2011 and 2012, to 164 Mtce. In the first half of 2013, Chinese imports grew again, albeit at a lower growth rate of 7.6%. Since forward prices do not indicate strong future price increases, this trend is projected to continue until the middle of the decade. Thereafter, imports maintain their level, with no significant growth. Whereas discussions are taking place on removing the export tax on steam coal, this has not been considered in this report, as it is not fully decided. If the export tax is removed, we should expect more exports from China to Japan, Korea and Chinese Taipei and more imports to South China, probably resulting in lower net imports to China. Chinese imports are fostered not only by the low prices of internationally traded thermal coal, but also by increasing domestic demand. Although roughly one-quarter of incremental demand comes from the conversion of locally mined and processed coal, growing demand for thermal coal used in power generation is driving Chinese imports. That said, new inland railway capacities will foster competition between domestic and imported coal. In 2014, the Jinchi line linking Inner Mongolia to Liaoning port will become operational, providing a capacity of 100 million tonnes per year (Mtpa). Two other lines (Caofeidian port/Hebei in Inner Mongolia and Rizhao port/Shandong in Shanxi), each with 200 Mtpa transport capacity, are expected to be operational by 2014-15. These railways will somewhat limit import demand. Hence over the outlook period, Chinese imports are projected to grow by an annual 2.6%, contributing 16% to incremental global seaborne trade of thermal coal. Imports to China will, however, remain volatile in the medium term, as buyers use short-term arbitrage possibilities between domestic and international markets to bring prices to equilibrium. India increases seaborne imports to 175 Mtce (+85 Mtce) in 2018, an impressive annual growth of 11.7%. After 2015, India will become the second-largest thermal coal importer, surpassing Japan and further closing the gap with China. Because of environmental restrictions and infrastructure bottlenecks, Indian domestic coal supply will not keep pace with rising thermal coal demand. Despite serious electricity tariff issues affecting the profitability of power plants, Indian thermal coal demand is projected to increase by 4.7% per year. Yet supplies only grow by 2.6% per year, aggravating the country’s dependency on thermal coal imports.
© O
EC
D/IE
A, 2
013

MEDIUM-TERM PROJECTIONS OF SEABORNE COAL TRADE
98 MEDIUM-TERM COAL MARKET REPORT 2013
Southeast Asian nations such as Malaysia, Thailand or the Philippines also play a major role in fostering global thermal coal seaborne imports. Demand projections show their imports surging by more than 50 Mtce over the outlook period. These countries are subsumed in Figure 4.2 as “Other”, together with the United States and other smaller importing countries. But United States (US) imports are comparably small, at 6 Mtce in 2012, dropping to below 3 Mtce by 2018 due to the sluggish outlook for US thermal coal demand.
Figure 4.2 Seaborne thermal coal imports in the BCS
* Estimate.
Imports will also decrease in European and Mediterranean countries. After a significant increase to 165 Mtce in 2012 (+17 Mtce year-on-year), import demand will decrease to 145 Mtce until 2018, when it will again reach 2011 levels. In many European countries, including the United Kingdom, Spain and Germany, thermal coal demand is projected to decline over the outlook period, reducing import needs. Turkey, on the other hand, will further increase coal imports as demand rises in line with high gross domestic product (GDP) growth rates. The United Kingdom’s decreasing coal production also limits the drop in European import demand. Growth rates in Korea (+2.5%) and Japan (+1.2%) mean that import demand increases more slowly than in non-OECD Asian countries. New coal-fired generation will foster demand in both of these import-dependent countries. Hence, imports will increase by 13 Mtce in Korea and 8 Mtce in Japan between 2012 and 2018. Indonesia will retain its current status as the world’s leading exporter. Exports will continue to surge by 72 Mtce, or 3.6% per year on average. During the first half of the outlook period, exports will reach year-on-year growth rates of 3.8% driven by surging Chinese import demand. Over 40% of incremental global import demand until 2018 will originate from Indonesia. By then, the country will have a 41% market share of global thermal coal seaborne exports. Much of Indonesian coal has rather low calorific value and its average quality will presumably continue to decline over the outlook period. Although the country will still remain in the lower half of
0
200
400
600
800
1 000
2011 2012* 2014 2016 2018
Mtce
Europe and Mediterranean JapanKorea Chinese TaipeiChina IndiaLatin America Other
© O
EC
D/IE
A, 2
013

MEDIUM-TERM PROJECTIONS OF SEABORNE COAL TRADE
MEDIUM-TERM COAL MARKET REPORT 2013 99
the global supply curve, increasing distances from mining regions to ports may cause future cost increases. Additionally, export capacity might be limited by surging domestic coal demand. Aside from these potential constraints, perspectives for Indonesian coal exports are prosperous in the near future, as China and India (the two main importers of Indonesian coal) and other emerging Asian importers (including Thailand, Malaysia and the Philippines) are expected to increase demand. Demand growth in Asia will also boost Australian exports (see Figure 4.3), which are projected to increase to 189 Mtce (+50 Mtce) in 2018, mainly destined for the Pacific market. Thus, 28% of incremental global thermal coal exports stem from Australia, which will remain the world’s second-largest exporter of thermal coal. Additional export capacity is about to come online, both in terms of port infrastructure and mines (predominantly from the Bowen basin and New South Wales). The current low coal prices raise concerns about the economic feasibility of projects in the Galilee basin, which is not expected to produce exports over the outlook period. Australian coal production is nevertheless subject to some uncertainties. First, the future prospects of the national carbon dioxide policy are unclear, as the newly elected government is set to change the current legislation. Second, environmental concerns have an increasing bearing on the construction of new infrastructure. Third, Australian exporters have lost cost competitiveness due to high labour costs, tax increases and the strength of the Australian dollar. As a result, limiting cost escalations will be crucial to increasing export volumes, given competition from other higher-cost producers such as the United States and Russia. Despite recent issues with strikes and guerrilla attacks, Colombia is projected to continue its surge in exports as new scheduled port and mining capacity come online during the forecast period. Seaborne exports rise by 3.6% (+18 Mtce) per year. Although exports to the Asian market increase steadily, the main importers of Colombian coal remain Latin America and Europe. While their total demand is not expected to grow by 2018, low production costs and high coal quality allow Colombian producers to increase export volumes, working at high capacity utilisation. South Africa’s coal exports face the bottleneck of rail infrastructure connecting the Central basin with the RBCT. Thanks to additional capacity announced by the state-owned rail operator Transnet, South African exports are projected to grow to 75 Mtce by 2018; they will continue to shift to the Pacific basin due to bearish demand development in the Atlantic basin. If rail capacity can be increased, the country’s low production costs will spur additional exports. The United States has traditionally been a swing supplier in the thermal coal seaborne trade, since its export capacities are at the higher end of the global supply curve. Mining costs from Central Appalachian coal fields are relatively high. Additionally, exporters bear significant inland transport costs of up to United States dollars (USD) 30 per tonne (USD/t) when transporting coal, for example from Central Appalachia to East coast ports. As US demand grows over the next couple of years, US exports become more expensive. They start to decline slightly (from 42 Mtce in 2012 to 39 Mtce in 2014, even though global import demand is surging, rising again to 55 Mtce in 2018). By 2015, US thermal coal consumption declines again, freeing and increasing lower-cost volumes for the export market, mainly Europe. While the Powder River basin is cost-competitive in Asian markets, we do not project significant exports, mainly because of infrastructure challenges.
© O
EC
D/IE
A, 2
013

MEDIUM-TERM PROJECTIONS OF SEABORNE COAL TRADE
100 MEDIUM-TERM COAL MARKET REPORT 2013
One competitor for European thermal coal imports is Russia, which (like the United States) is a higher-cost supplier. The enormous inland transport distances from the coal mines, e.g. in the Kuznetsk basin, to Russian ports in the east and west are an important cost driver (see Figure 2.11). Given the tough competition with US exporters in Europe and declining European import demand, Russian exports will increasingly shift towards Asia via its East coast ports. Fostered by surging Asian import demand, Russian seaborne thermal coal exports will increase by 14 Mtce over the outlook period, to 96 Mtce in 2018.
Figure 4.3 Seaborne thermal coal exports in the BCS
* Estimate.
Seaborne met coal trade projection, 2013-18 In the BCS, seaborne trade is projected to grow by 3.2% per year from 2012 to 2018. It will outpace met demand, which rises on average by 2.3% per year. Consequently, the share of seaborne trade in total demand increases from 28% in 2012 to 29% in 2018. In this scenario, met coal trade stands at 290 Mtce in 2018, from 240 Mtce in 2012 (+50 Mtce). As in the past decade, the key drivers are the prosperous Asian economies, whose expected GDP growth translates into an increasing need for steel and therefore met coal. The Pacific basin accounted for around 72% of total seaborne imports in 2012 (see Figure 4.4), making it the cornerstone of international met coal trade. Despite a projected increase of imports in all key Asian economies, the Pacific basin’s share of internationally shipped met coal will remain constant. Met coal imports by Latin America (foremost Brazil) will increase, as will European imports, due to declining indigenous production. Among the importing countries in the Pacific basin, India leads the way in terms of relative growth, with a projected 6% annual increase during the outlook period (+13 Mtce by 2018). The country’s high import growth rates result from limited indigenous high-quality coking coal production and deposits and high capital-intensive economic growth (with gross capital formation at 36% of total GDP). With total imports rising from 32 Mtce in 2012 to 45 Mtce in 2018, India becomes the third-largest met coal importer worldwide.
0
200
400
600
800
1 000
2011 2012* 2014 2016 2018
Mtce
Australia Indonesia Russia China South Africa Colombia United States Other
© O
EC
D/IE
A, 2
013

MEDIUM-TERM PROJECTIONS OF SEABORNE COAL TRADE
MEDIUM-TERM COAL MARKET REPORT 2013 101
In 2012, China, the world’s largest met coal consumer, sourced over 10% of its final consumption from foreign mines; nearly one-third of its total imports (18 Mtce) came from Mongolia. Fuelled by the drop in international price levels, Chinese seaborne imports increased by 9 Mtce in 2012 over 2011. As the international met coal market is expected to remain well supplied, China retains its position as the second-largest seaborne importer: its imports grow by 3.0% (8 Mtce) per year, to 48 Mtce in 2018. Mongolia, the world’s largest overland met coal exporter, is highly competitive in the Chinese hinterland and northernmost demand regions. Mongolia’s typical production costs range from USD 10/t to USD 25/t; other costs (coal preparation, transport, royalties and other taxes) add another USD 30/t to USD 40/t. Consequently, its overland exports of met coal to China are projected to increase to 30 Mtce in 2018, from 18 Mtce in 2012 (+12 Mtce). Thus Chinese imported met coal totals 78 Mtce in 2018.
Figure 4.4 Seaborne met coal imports in the BCS
* Estimate.
Despite losing its position as the world’s largest importer of met coal to China in 2012, Japan remains the leader in seaborne imports throughout the outlook period. However, sluggish GDP growth and mature domestic steel industry will result in modest met imports, with average 1.0% annual growth from 2012 to 2018. Japanese met coal imports amount to 53 Mtce in 2017, up from 50 Mtce in 2012 and only slightly higher than in 2011. By contrast, the International Monetary Fund expects higher GDP growth in Korea (+3.5%) and Chinese Taipei (+3.8%) during the outlook period. As neither country has indigenous met coal production, any increasing demand directly translates into higher imports. Korea’s imports thus stand at 36 Mtce in 2018, up from 30 Mtce in 2012 (+2.8% per year). Chinese Taipei’s imports grow to 11 Mtce (+5.0% per year), but from a lower level of 8 Mtce in 2012. Met coal imports from countries located in the Atlantic basin grow from 70 Mtce to just over 85 Mtce in 2018. Brazil and Turkey are projected to realise the highest import growth, but the trajectories of their country groupings differ. While Latin America increases its imports from 14 Mtce in 2012 to 23 Mtce in 2018 (+7.8% per year), European and Mediterranean countries increase theirs from 63 Mtce in 2012 to 71 Mtce in 2018 (+2.1% per year). The reasons for the growth also differ. Latin America (particularly Brazil) has plentiful high-quality iron ore at reasonably low production
0
50
100
150
200
250
300
350
2011 2012* 2014 2016 2018
Mtce
China India Europe and Mediterranean Japan Korea Other
© O
EC
D/IE
A, 2
013

MEDIUM-TERM PROJECTIONS OF SEABORNE COAL TRADE
102 MEDIUM-TERM COAL MARKET REPORT 2013
costs. This provides an excellent basis for sustained growth in its steel industry, also benefitting the growing economy (3.5% GDP growth per year until 2018). By contrast, the already mature steel industry in northwest Europe is not expected to exhibit much growth. However, due to the decline of indigenous met coal production (particularly in Germany), the need for seaborne imports grows over the outlook period. Met coal – particularly high-quality (hard) coking coal – is unevenly distributed around the globe. The skewed distribution of reserves is mirrored in the country shares of total seaborne exports, as Australia alone accounts for almost 60% of shipped met coal in 2012. Three countries – Australia, the United States and Canada – account for almost the entire seaborne trade (91% in 2012), as shown in Figure 4.5. Due to developments in Russia and Mozambique, we project the share of the “big three” to decrease to 87% by 2018, leaving the international market still vulnerable to supply disruptions caused by bad weather or labour strikes. Australian met coal exports are projected to grow by 29 Mtce (+21%) to 168 Mtce in 2018, a 3.3% annual average. Even though Australia grew its exports by 13 Mtce in the first two years of the outlook period, exports still have not reached their record 153 Mtce level of 2010 by 2014. Consequently, incremental exports would be cut in half if the starting year of the outlook was 2010. Although the outlook for Australian exports is by no means bleak, it is still far less bullish than in the first decade of this century, when met coal exports grew at 4.6% per year. This less optimistic view on Australia is obviously caused by the less impressive growth of total met coal demand, as well as by the increase in production and investment costs. Producers that do not export top-tier coking coal suffer from the substantial increase in labour and land costs caused by (among others things) the country’s resource boom, which also boosted its economy. As a result of the cost increases, a significant share of Australian met coal exports moved to the upper third of the seaborne supply cost curve, exposing some of the exports to the risk of continued low international prices.
Figure 4.5 Seaborne met coal exports in the BCS
* Estimate.
0
50
100
150
200
250
300
350
2011 2012* 2014 2016 2018
Mtce
Australia Canada Mozambique Russia United States Other
© O
EC
D/IE
A, 2
013

MEDIUM-TERM PROJECTIONS OF SEABORNE COAL TRADE
MEDIUM-TERM COAL MARKET REPORT 2013 103
With significant coking coal reserves in British Columbia and the expansion of the Ridley Terminal in Prince Rupert underway, Canada is well positioned to benefit from the growth in import volumes of Asian countries such as China, Korea and Japan. Consequently, its met coal exports increase by 6 Mtce, from 25 Mtce in 2012 to 31 Mtce in 2018 (+3.7% per year). Although Russia is not located entirely either in the Pacific or the Atlantic basin, its met coal exports benefit from developments in both. Most of its export growth is destined for China and other Asian countries. Increasing export volumes from the Elga mine (operated by Mechel and located close to the Chinese border) will help increase exports to the Pacific basin in the second half of the outlook period. In total, Russian met coal exports grow at an impressive 8.6% per year, from 11 Mtce in 2012 to 19 Mtce in 2018. Despite its status as the second-largest met coal exporter, the United States faces the highest production costs of the top three exporting countries. Exports from the Appalachian basin – the only source of US met coal exports – are projected to decline from their second-highest level of 55 Mtce in 2012 to 49 Mtce in 2014 as a result of continued low international prices and increased seaborne exports from Australia and Russia. In the second half of the outlook period, met coal exports pick up again to reach 53 Mtce in 2018, spurred by an increase in seaborne import demand growth. Met coal exports from Mozambique gained significant momentum in 2012, with exports reaching 3 Mtce. We expect this momentum to carry over and exports to reach 9 Mtce by 2018 (+6 Mtce). Two mines currently account for all exports: Vale’s Moatize mine (80%) and Rio Tinto’s Benga mine. These two mines are responsible for the bulk share of incremental exports during the outlook period, as they have access to the only current viable large-scale export link, namely the Sena railway to the port of Beira. A new line to the port of Nacala may also increase export capacities. Seaborne thermal coal trade projections in alternative scenarios, 2013-18 The CLDC As shown in Figure 4.1, Chinese thermal coal demand in the CLDC is assumed to be 182 Mtce lower in 2018 than in the BCS, due to decreasing electricity intensity of GDP and the lower number of coal conversion projects completed by 2018. This amount is only slightly below total 2018 Chinese imports in the BCS (192 Mtce). In the CLDC, lower Chinese demand will affect both imports and domestic production. China will import only 116 Mtce in 2018 – 76 Mtce less than in the BCS. Whereas Chinese thermal coal imports grow by an annual 2.6% in the BCS, they shrink by 5.7% in the CLDC. India will become the world’s largest thermal coal importer by 2016. Japan will also surpass China over the outlook horizon. Chinese domestic thermal coal production in 2018 will be 106 Mtce lower in the CLDC than in the BCS, for two main reasons. First, lower demand makes high-cost mines unprofitable in the short run, so that these mines decrease output. Second, since fewer coal conversion projects are realised in the CLDC, the amount of coal production that would only be used locally in the main coal conversion regions is lower. The low import demand from China implies a slower market growth of seaborne thermal coal trade over the outlook period. Instead of growing by 3.6% per year as in the BCS, the market only grows by 2.8% per year in the CLDC. Although Chinese imports in 2018 decrease by 76 Mtce relative to the BCS, total global imports only decrease by 43 Mtce. As seen in Figure 4.6, additional imports from other countries (+33 Mtce) partly compensate for the lower Chinese import demand: the low demand
© O
EC
D/IE
A, 2
013

MEDIUM-TERM PROJECTIONS OF SEABORNE COAL TRADE
104 MEDIUM-TERM COAL MARKET REPORT 2013
causes prices for seaborne traded thermal coal to plummet, putting many high-cost exporters out of business. In the CLDC, for example, import price in Europe (in real euros) is projected to be USD 10/t lower and Japanese import price USD 14/t lower than in the BCS. As a reaction to plummeting prices, import demand from importing countries other than China therefore increase compared to the BCS. India increases its thermal coal imports most of all the importing countries due to the low Chinese demand. In the CLDC, Indian imports 191 Mtce in 2018, 16 Mtce more than in the BCS and more than twice its 2012 imports. Sluggish seaborne import prices cause imports to partly crowd out domestic Indian production, despite its relatively low cost (even taking into account the cost of inland transport to the coasts). In addition, the low price levels do not provide economic incentives for Indian companies to expand domestic production capacity. Demand reaction is quite low in Japan and Korea where, despite some seasonality, load factors of coal-fired power plants are relatively high and fuel-switching potential is limited. The differences in coal consumption between the BCS and the CLDC affect most of the major exporting countries, except South Africa and Colombia, which are rather low-cost producers. Higher-cost producers, such as Australia and the United States, are most affected by the slowdown in Chinese demand. In 2018, Australian exports are 23 Mtce lower in the CLDC than in the BCS. Bearish coal consumption in China significantly reduces production volumes, particularly in higher-cost mines. Moreover, investors delay capacity expansions as they anticipate sluggish Chinese demand development.
Figure 4.6 Differences in seaborne thermal coal trade between the BCS and CLDC
The United States, the second-largest thermal coal OECD exporter behind Australia, is likewise affected. In the CLDC, US exports would decline by 12 Mtce in 2018 compared to the BCS. Even though Europe, not China, is the most important export market for the United States in the BCS, lower Chinese demand would nevertheless push US exports down. Declining Chinese imports would make the Pacific basin less attractive in terms of prices. Even taking into account partial compensation by growing Indian imports, exporters like Russia or South Africa would intensify sales to Europe. Likewise, Colombia – which exports some coal to Asia in the BCS – would instead sell these volumes to the European market. The sharper competition for European demand would crowd out production from higher-cost mines (e.g. in Central Appalachia).
-100
-80
-60
-40
-20
0
20
40
2014 2016 2018
Mtce
Australia Russia United States Other exporters China Other importers
© O
EC
D/IE
A, 2
013

MEDIUM-TERM PROJECTIONS OF SEABORNE COAL TRADE
MEDIUM-TERM COAL MARKET REPORT 2013 105
Likewise, Russian exports would be affected by low Chinese demand. First, lower demand in the Pacific basin would push some Russian higher-cost suppliers out of the Asian market. Second, some of these volumes would be pushed towards Europe, entering into competition with US exports. Nevertheless, Russian exports would only be 4 Mtce lower in the CLDC than in the BCS by 2018. In the Pacific market, Russian supplies are cost-competitive with Australian exports. Producers (e.g. from the Kuznetsk region) can also sell to Europe, where most Russian exports have some cost advantages over US exports. Finally, the Russian rail chain is generally willing to accept lower prices, rather than be saddled with underutilised infrastructure.
The IHDC The IHDC evaluates changes in Indian power policy that would drive the expansion of generation capacity of coal-fired power plants according to the targets set out in the 12th Five-Year Plan (2012-17). Indian demand for thermal coal is projected to reach 736 Mtce in 2018, 79 Mtce higher than in the BCS and representing a growth rate of 6.9% per year instead of 4.9%. This sensitivity case aims to assess the impacts of higher Indian import dependency. Therefore, Indian domestic coal supply capacities are identical in the IHDC and the BCS. India increases its imports of thermal coal to 249 Mtce in 2018 (+74 Mtce compared to the BCS). Having increased its imports by more than 250% within six years, India surpasses China as the number-one thermal coal importer by 2016. Rising Indian demand will also partly be met by growing use of higher-cost domestic supplies (+5 Mtce). India’s surging import demand leads to a market growth of total seaborne thermal coal trade. Compared to the BCS, the market grows to 940 Mtce by 2018 (+27 Mtce). Other countries reduce imports by 47 Mtce in 2018 as a reaction to Indian demand growth and rising price levels (see Figure 4.7).
Figure 4.7 Differences in seaborne thermal coal trade between the BCS and IHDC
-60
-40
-20
0
20
40
60
80
2014 2016 2018
Mtce
Australia Russia United States Other exporters India Other importers
© O
EC
D/IE
A, 2
013

MEDIUM-TERM PROJECTIONS OF SEABORNE COAL TRADE
106 MEDIUM-TERM COAL MARKET REPORT 2013
Box 4.1 Are we overstating China’s importance?
• China is the world’s number-one coal consumer, coal producer and coal importer.
• China consumed more than 50% of global coal demand in 2012, measured in energy units. The biggest oil and gas consumer, the United States, has a share of 21% of both global oil and gas demand.
• Putting the total annual Chinese coal demand (3 678 million tonnes [Mt]) in a coal train, the train would measure over 550 000 kilometres, 1.5 times the distance between the Moon and the Earth.
• In 2012, China consumed over four times more thermal coal and almost ten times more met coal than the respective number-two consumers, the United States and Russia.
• Chinese coal consumption has tripled since 1997 and doubled since 2002.
• The energy content of total annual gas production of the United States, Russia and Qatar could satisfy Chinese primary energy demand from coal for six months.
• Chinese primary energy demand from coal exceeds the energy content of annual crude oil production of the Organization of the Petroleum Exporting Countries and Canada combined.
• Since 2000, global coal demand has increased by 2 169 Mtce, to which China contributed over 1 800 Mtce.
• The increase of Chinese coal consumption (130 Mtce) from 2011 to 2012 alone equals the total coal demand of Poland and the United Kingdom combined.
• China’s coal demand is projected to increase by 2.6% per year, or 476 Mtce in total, until 2018. Although 2.6% is its lowest coal demand growth since 2001, its incremental coal demand is larger than current coal demand of the European Union and Australia combined.
• Chinese coal-fired power plants generated 3 751 terawatt hours (TWh); they contributed 17% of global power generation in 2011.
• Total global wind power capacities would need to run for six years to replace Chinese coal-fired generation in 2012.
• Global solar photovoltaic capacities would need to run more than 30 years to replace Chinese coal-fired generation in 2012.
• China would need 38 Three Gorges Dams to replace 2012 coal-fired generation.
• Chinese coal-fired generation increased by 476 TWh between 2010 and 2011, an amount greater than the total annual wind, biomass and solar generation in OECD Europe in 2012 combined.
• In 2012, China produced 3 549 Mt of coal, almost four times as much as the United States, over six times more than India and over eight times more than Indonesia.
• China’s share in global coal production was 45%. In comparison, the largest oil supplier, Saudi Arabia, produced 13% of global oil production. The United States, the world’s largest gas producer, accounted for 20% of global gas production.
• China’s total coal production in 2012 would have the same volume as 1 400 Great Giza Pyramids.
• No country has ever imported as much coal within a year as China imported in 2012 (301 Mt).
• Taking into account imports and domestic coal transports along the Chinese coast, half of the globally shipped coal lands in China; in other words, every 100 minutes on average a Capesize ship (175 000 deadweight tonnage) full of coal docks in China.
© O
EC
D/IE
A, 2
013

MEDIUM-TERM PROJECTIONS OF SEABORNE COAL TRADE
MEDIUM-TERM COAL MARKET REPORT 2013 107
China is particularly affected and reduces imports by 42 Mtce. Both China and India are the main importers of Indonesian low calorific coal. Stronger Indian demand – and therefore higher Indian price levels – in the IHDC increasingly draws Indonesian volumes towards India and away from China. Chinese importers’ willingness to pay is lower, as the country has alternative domestic coal supply options. In other words, China reduces the arbitrage that has been observed in the BCS and replaces higher-priced imports with domestic production. Higher-cost producers Australia, Russia and the United States provide incremental trade volumes on the seaborne thermal coal market. In 2018, Australia increases its exports by 4 Mtce, and Russia by 2 Mtce, compared to the BCS. In terms of export volumes, US exporters benefit most from the high Indian demand, increasing exports by 17 Mtce in 2018. Yet the rise in US exports as a reaction to high Indian imports does not imply that India becomes a key importer of US coal. Although the trade between the United States and Asia increase in the CLDC, the effects of increased Indian imports must be examined on a global level: since rising Indian import demand leads to more bullish prices in the Pacific basin, exports from Colombia, South Africa and Russia are more attracted to Asia than to Europe. Higher-cost US exports thus become more competitive and are boosted on the European market. References Paulus M. and J. Trüby (2011), Coal Lumps vs. Electrons: How do Chinese Bulk Energy Transport Decision Affect the Global Steam Coal Market?, Energy Economics, Elsevier, Amsterdam. Trüby J. (2012), Strategic behaviour in international metallurgical coal markets, Energy Economics, Elsevier, Amsterdam.
© O
EC
D/IE
A, 2
013

EXPORT CAPACITY INVESTMENT OUTLOOK
108 MEDIUM-TERM COAL MARKET REPORT 2013
5. EXPORT CAPACITY INVESTMENT OUTLOOK Summary • Several mining and infrastructure projects worldwide have been delayed, postponed or
cancelled. Plummeting coal prices erode the projects’ net value and the current perception of an oversupplied market has led investors to act more cautiously than in the past.
• Nonetheless, new export mining capacity of 120 million tonnes per year (Mtpa) is classified as probable to come online by 2018. Half of the growth can be attributed to Australia, which will increase both thermal and metallurgical coal (met coal) capacity. Colombia also provides significant thermal coal capacities.
• Potential mining projects amount to more than 480 Mtpa by 2018. Some of these projects are
more likely to be realised, such as incremental volumes from Indonesia, while projects in the Galilee and Surat basins are unlikely to be realised due to low coal prices. However, their great potential must not be overlooked.
• Rail infrastructure remains the bottleneck for many mining projects worldwide. In South Africa
and Mozambique, incremental export capacity will stand and fall with new rail infrastructure. Indonesian efforts to increase exports also require new railway capacities.
Investment in export mining capacity Investments in export mining capacity are normally associated with lead times of several years. Therefore, analysing expansion projects currently under construction or in the planning stages allows us to estimate the development of export mining capacity in the years to come. Our methodology distinguishes between probable and potential expansion projects. Projects whose current status is either “approved”, “committed” or “under construction” are classified as probable additions. Less advanced projects whose current status is “feasibility study”, “environmental impact study” or “awaiting approvals” are classified as potential additions. Furthermore, potential additions are based on various estimates for countries, such as Indonesia, where detailed project lists were not available. For many probable and potential projects, the targeted mine capacity is rarely reached in the year of start-up, i.e. ramp-up of capacity might take a couple of years. In general, the timing and volume of mining capacity entering the market depends on various factors. First, the size of the resource base is a crucial factor in determining project capacity (see Box 5.1). Second, current and expected demand and price levels, as well as the expected position in the supply cost curve, are decisive to project profitability. Third, export mine projects stand and fall with the availability of export infrastructure, i.e. seaports and inland transports. Delays in the construction or expansion of infrastructure may substantially hamper the realisation of a mining project. Additionally, future regulatory frameworks, public opposition or political risks are key investor uncertainties with regard to a project’s realisation and economic success. Finally, access to capital, in particular for greenfield projects requiring new infrastructure, can be a critical issue. Until 2018, new export mining capacity classified as probable addition is slightly above 120 Mtpa, as shown in Figure 5.1. Half of the growth can be attributed to Australia and significant volumes to Colombia and Russia. While additional volumes from Mozambique and South Africa appear probable
© O
EC
D/IE
A, 2
013

EXPORT CAPACITY INVESTMENT OUTLOOK
MEDIUM-TERM COAL MARKET REPORT 2013 109
from today’s perspective, we cannot stress enough that project realisation will stand and fall with the construction of sufficient inland transport infrastructure. Compared to last year’s outlook (IEA, 2012), where probable expansions amounted to nearly 100 Mtpa to 2013 and 155 Mtpa to 2017, this year’s outlook shows different results for three main reasons. First, a significant number of projects came online in 2012 and are therefore not included this year. Second, few projects have become more probable in 2013. Driven by the lower-than-expected demand and current oversupply, investors have even postponed several projects. Third, the methodology has slightly changed. This year, we have changed the mechanism to account for ramp-up times of production capacity. Thus, the entire targeted production capacity of a project is not available in the first year after start-up. Depending on the project, we assume ramp-up times of two to six years.
Figure 5.1 Cumulative probable expansion of hard coal export mining capacity, 2013-18
Notes: unless otherwise indicated, all material in figures and tables derives from International Energy Agency data and analysis.
Figure 5.2 Cumulative probable and potential expansion of hard coal export mining capacity, 2013-18
0
20
40
60
80
100
120
140
2014 2016 2018
Mtpa
Australia Canada Russia Colombia South Africa Mozambique
0
100
200
300
400
500
600
700
2014 2016 2018
Mtpa
Probable Australia Indonesia CanadaRussia Colombia South Africa Mozambique
© O
EC
D/IE
A, 2
013

EXPORT CAPACITY INVESTMENT OUTLOOK
110 MEDIUM-TERM COAL MARKET REPORT 2013
Box 5.1 Resources and reserves
Articles and reports quite often refer to the remaining coal available for further exploitation with the words “resources” or “reserves”, sometimes used almost interchangeably. These terms are usually accompanied by some other word (“measured”, “indicated”, “inferred”, “identified”, “hypothetical”, “speculative”, etc.), making concepts hard to understand and figures difficult to compare. Furthermore, different countries have different methodologies and codes for reporting reserves and resources. The Australasian Code for Reporting Exploration Results, Mineral Resources and Ore Reserves (the JORC Code) is probably the best known. Of course, there are many others worldwide.
Coal resources are well distributed across the globe and coal is not subject to geopolitical tensions. Therefore, divergences among figures arise from different definitions, sources or estimation methods, rather than from political motivations.
This box intends only to offer the reader a very simple notion of what resources and reserves generally mean. Specialised literature (e.g. IEA, 2013a) can provide a deeper knowledge. It is worth remarking that not only do different countries use different concepts, but different bodies in the same country also often use different definitions for reserves, leading to different reserve and resources quantifications. Here, we explain the most frequently used terms.
“Reserves” should mean volumes of coal resources that have been properly documented and are economically exploitable at current prices, using current available technology. Therefore, reserves refer to demonstrated existing resources, excluding those that are not profitable or unavailable due to land restrictions, and applying the due mining recovery rates. The first message is that the number is a dynamic figure, which changes with prices, technological progress and policy developments. The terms recoverable reserves, proven reserves and proven recoverable reserves are widely and interchangeably used. However, a distinction is often made between proven and probable reserves, depending on the degree of confidence on the volume and quality of the resources.
“Resources” should mean proven amounts of coal resources that cannot currently be exploited for technical and/or economic reasons, as well as unproven but geologically possible coal resources that may be exploitable in future. Resources are usually classified as measured, indicated and inferred, depending on the degree of confidence about their volume and quality.
Resources do not usually include reserves. The term “total resources” is sometimes used – although not unanimously – to refer to the sum of reserves and resources. Using these definitions, it is easy to understand that profitable and recoverable measured resources should be equivalent to proven reserves, while profitable and recoverable indicated resources should be equivalent to probable reserves.
Company reports commonly use the term “marketable coal reserves”, representing beneficiated or otherwise enhanced coal product where modifications due to mining, dilution and processing are taken into account. Therefore, marketable coal reserves should be smaller than the reported proven reserves.
In addition to the global probable export mining capacity increase of 120 Mtpa, numerous potential projects amount to over 480 Mtpa until 2018 (see Figure 5.2). This does not imply that each of these projects will come online over the outlook horizon, or will be realised at all. Projects at such early stages can fizzle out due to (among others) missing financial funding or environmental constraints. Additionally, potential projects can be delayed for years. Besides, in the current situation of oversupplied markets and low prices, many potential projects are simply not profitable enough to be realised. Some potential projects are, however, assumed to come online in the latter part of the outlook period, in particular those that will have an attractive position on the supply cost curve. Information on specific Indonesian projects is scarce and all projects are therefore classified as potential. That said, Indonesia is expected
© O
EC
D/IE
A, 2
013

EXPORT CAPACITY INVESTMENT OUTLOOK
MEDIUM-TERM COAL MARKET REPORT 2013 111
to increase export capacity over the outlook period. Potential projects in South Africa and Mozambique require significant growth in export infrastructure (more than the infrastructure projects discussed here) and are not projected to come online during the outlook period. Investment in export infrastructure capacity Missing or congested port and railway infrastructure often hampers expanding mining capacity. Mozambique and South Africa are prominent examples of countries whose exports suffer because of deficient transport infrastructure. Numerous infrastructure projects are planned or under construction worldwide to increase coal exports. Sometimes, the local infrastructure operator (e.g. Transnet in South Africa or Aurizon in Australia) makes the investment. Other times, mining companies are vertically integrated and invest in their own railway infrastructure, as Vale plans to do in Mozambique. We discuss representative projects for several countries in the next section. Several port capacity projects are currently under construction, for example in Australia, Colombia and Canada. Numerous other projects are slated to come online through 2018. Because of low profitability, environmental concerns or poor inland transport infrastructure, not all of the planned port projects will be realised. Our projections indicate incremental coal terminal capacity of roughly 200 Mtpa by 2018 (Figure 5.3). Half of the incremental port handling capacity can be attributed to Australia and Indonesia.
Figure 5.3 Projected cumulative additions to coal terminal capacity, 2013-18
Regional analysis The following section will provide a regional analysis of current investment projects in both coal mining and export infrastructure over the outlook period. Australia Investment in export mining capacity Australian mining capacity expansions account for roughly half of global probable mining capacity additions during the outlook period. Projects that are either committed, approved or under
0
50
100
150
200
250
2014 2016 2018
Mtpa
Australia Indonesia Canada Russia Colombia United States Mozambique
© O
EC
D/IE
A, 2
013

EXPORT CAPACITY INVESTMENT OUTLOOK
112 MEDIUM-TERM COAL MARKET REPORT 2013
construction account for a total capacity growth of around 59 Mtpa through 2018. Capacity additions of 27 Mtpa will come online in New South Wales and the remainder in Queensland. Total investment costs are estimated at United States dollars (USD) 13 billion. With a total of 37 Mtpa, most of the capacity additions are expansions of existing mines. Other incremental capacity comes from four greenfield projects primarily intended for mining coking coal. The Daunia project by BHP Billiton Mitsubishi Alliance (BMA) officially opened in September 2013, with production expected to be ramped up to 4.5 Mtpa. One of the largest current mining projects is the Caval Ridge project by BMA. With an initial investment of USD 1.7 billion and a final capacity of 8 Mtpa, its first coal production is expected in 2014. Anglo American’s greenfield Grosvenor project is expected to come online in 2016, with an expected capacity of 5 Mtpa. Start-up of the Eagle Downs project (4.5 Mtpa, Aquila/Vale) has been postponed from 2016 to 2017 as a reaction to low coking coal prices. Besides the probable capacity additions, numerous potential projects with aggregated capacity additions of up to 230 Mtpa are also slated during the forecast period.1 Both capacity additions, however, have to be taken with care. Because of financing issues, low current coal prices and environmental constraints, a significant number of projects will not be realised. Furthermore, projects still at the feasibility stage are likely to be delayed. Many of the potential projects are located in the Galilee and Surat basins, whose development has been widely discussed in international coal trade. Four major projects in the Galilee basin alone account for a targeted capacity of 160 Mtpa. The Alpha Coal project (32 Mtpa) by GVK-Hancock Coal received environmental approval subject to conditions in 2012. The consortium is currently trying to find financing for the USD 10 billion budget. GVK also holds stakes in the Kevin’s Corner project, with an ultimate capacity of 30 Mtpa. The project received environmental approval in May 2013, subject to strict conditions on water management because of the tense water situation in the Galilee basin. As further approvals are needed, production is not scheduled to begin before 2018. The China First Coal project by Waratah Coal targets an operational capacity of 40 Mtpa, with a required funding of USD 8.8 billion. The project entails the construction of four underground mines, two surface mines and associated coal handling and processing facilities. While Queensland has given environmental approval subject to conditions, Commonwealth approval is still pending. Adani’s Carmichael Coal project (60 Mtpa) is currently undergoing the environmental impact screening process. Given the huge investment costs, current low coal prices and oversupply of the seaborne market, these projects are unlikely to realise during the outlook period. Investment in export infrastructure capacity
The recent growth of Australian coal port capacity is likely to continue. By the end of 2012, total port capacity stood at 463 Mtpa (BREE, 2013). By April 2013, three port projects were committed to come online by 2015, increasing Australian coal port capacity by 51 Mtpa to a total of 514 Mtpa. Phase 3 of the BMA Hay Point Coal Terminal (Queensland), extending capacity by 11 Mtpa, is scheduled to be operational by 2014. The first stage of Wiggins Island Coal Terminal in Gladstone (Queensland), with an ultimate capacity of 27 Mtpa, is currently under construction, but finalisation has been postponed until 2015. Completion of the third expansion stage of Newcastle Coal Infrastructure Group’s coal export terminal is projected by 2014, increasing the port’s capacity by another 13 Mtpa, to a total of 66 Mtpa. 1 The ultimate capacity, i.e. when production is fully ramped up, of all potential projects in Australia is almost 400 Mtpa.
© O
EC
D/IE
A, 2
013

EXPORT CAPACITY INVESTMENT OUTLOOK
MEDIUM-TERM COAL MARKET REPORT 2013 113
Besides projects under construction, there are numerous projects at less advanced stages, and therefore more likely to be cancelled or delayed. Many of these port infrastructure projects will serve to export coal from the mine expansion projects in the Galilee basin. GVK and Adani, both of which are planning major mine projects in the Galilee basin, are currently assessing the feasibility of expanding the Abbot Point port. When fully operational, these expansions would have capacity of over 120 Mtpa. However, final approval of these projects has not yet been granted. If the Australian Minister for the Environment approves them, we do not expect them to be realised during the outlook period, given the high investments required and current low thermal coal prices. In the past, rail infrastructure caused a bottleneck in Australian exports. Several finished projects have now eased the problem. The Australian rail freight operator Aurizon is working on increasing rail capacity in the Goonyella system, linking the Bowen basin and the Hay Point Coal Terminal. Additionally, the Wiggins Island rail project to connect the Wiggins Island Coal Terminal is slated to start operations by 2015, offering a capacity of 27 Mtpa when finalised. In order to connect the Alpha Coal and Kevin’s Corner projects in the Galilee basin with Abbot Point Coal Terminal, Aurizon and GVK-Hancock Coal have signed a non-binding agreement to develop 60 Mtpa of rail infrastructure capacity. Although Australia’s Minister for the Environment approved the project in 2012, the project will not realise unless mining operations in the Galilee basin begin. Colombia Investment in export mining capacity
The world’s fourth-largest thermal coal exporter, Colombia, is projected to increase its mining capacity over the outlook period. If all current mining projects were realised, capacity would increase by 48 Mtpa (20 Mtpa probable and 28 Mtpa potential). Incremental coking coal capacity will be below 3 Mtpa. A significant part of the potential capacity additions is the USD 4 billion project by MPX in the Colombian province of La Guajira. It is, however, on hold due to low price levels on the international thermal coal market. Other projects are in progress. Prodeco’s mining expansion project (21 Mtpa) is partially done and slated for completion in 2015. The Cerrejón mine (owned in equal proportions by Xstrata Coal, BHP Billiton and Anglo American) will increase its open-cut production from 32 Mtpa in 2012 to 40 Mtpa by the end of 2015; expansion is already halfway completed. The project investment is USD 1.3 billion, some of which is being spent on the expansion of Puerto Bolivar and railway infrastructure in the La Guajira province. Drummond plans to increase production in the El Descanso mine, but the time schedule is still unclear. The Landazuri coking coal project has been withdrawn due to high structural complexity. Investment in export infrastructure capacity
Transport infrastructure and port handling capacity in Colombia are traditionally highly utilised. In line with Colombian plans to increase exports, Colombian port and rail capacity is expected to grow over the outlook horizon. The big three Colombian coal producers, Cerrejón, Drummond and Prodeco, are all currently involved in port expansion projects. Prodeco recently opened Puerto Nuevo in Ciénaga. The USD 550 million investment has an export capacity of 21 Mtpa and implements a direct ship loading system for vessels up to 180 000 deadweight tonnage (dwt). Cerrejón is currently working on the expansion of Puerto Bolivar. The port will be dredged and another berth and ship loader installed. This port expansion is part of Cerrejón’s
© O
EC
D/IE
A, 2
013

EXPORT CAPACITY INVESTMENT OUTLOOK
114 MEDIUM-TERM COAL MARKET REPORT 2013
USD 1.3 billion project to increase mining and export capacity to 40 Mtpa by 2015. Drummond is currently installing a direct ship loading facility at Puerto Drummond, to the tune of USD 350 million. Additionally, Goldman Sachs has announced the approval of a USD 137 million investment expanding Rio Cordoba port’s capacity from 5 Mtpa to 12 Mtpa. It is, however, unlikely that the project will realise during the outlook period. Colombian port capacity is projected to increase by 29 Mtpa by 2018 (inclusive of Puerto Nuevo). Inland transport infrastructure is traditionally a critical issue in Colombia. Smaller mines in particular often have to transport coal by trucks, significantly increasing transport costs. Colombia has scrapped plans for a new USD 3 billion railway between central Colombia and the Caribbean ports. Instead, its Council of Ministers has approved an investment of up to USD 1.2 billion to improve navigability for barges on the Magdalena River. Construction is supposed to begin in 2014. This infrastructure project will connect the large met coal deposits in central Colombia with the port of Barranquilla, potentially decreasing transportation costs by an estimated 30%. Full completion of the project might take up to one decade. South Africa Investment in export mining capacity
South African export capacity is projected to grow by 10 Mtpa over the outlook horizon. Many new mining projects are currently under construction. Although the Grootegeluk expansion is one of the biggest projects (+14.6 Mtpa by 2014), much of it will supply Eskom’s Medupi power station and will not be available for export. This also holds true for the 2 Mtpa Kangala mine coming online in February 2014, as well as for the 2.3 Mtpa Elandspruit mine starting start production in 2015. The Australian/South African mining company Resource Generation is currently developing the Boikarabelo thermal coal project in the Waterberg region (6 Mtpa), with production to begin in 2015-16. A major part of the capacity is intended for exports, although Eskom has already contracted some volumes. Glencore Xstrata has the 6.6 Mtpa Tweefontein extension project in the pipeline, as well as an additional 3.6 Mtpa from Wonderfontein expected to come online in 2014-15. Numerous other projects are in the feasibility stage. Although several South African mining projects are in the pipeline, export capacity development is mainly determined by two aspects. First, domestic South African coal demand (particularly from Eskom’s power plants) will increase during the outlook period, competing with export demand. Second, many mining projects stand and fall with the capacity expansion of the congested railway infrastructure to the Richards Bay Coal Terminal (RBCT). Investment in export infrastructure capacity
Since the 2009 upgrade of the RBCT from 76 Mtpa to 91 Mtpa, the railway infrastructure linking the coal fields in the Central basin remains the factor constraining South African exports. In 2012, the local railway operator Transnet improved performance by reducing load and track maintenance times, which helped increase South African exports. Nonetheless, the port handling capacity remained underutilised, with total exports from Richards Bay amounting to 68 million tonnes (Mt) in 2012. Transnet is, however, planning to invest up to USD 31 billion over the next seven years to improve the South African rail network. It shall invest USD 3.2 billion to increase the export capacity of the Richards Bay coal corridor by 26 Mtpa by 2018-19. Transnet has announced capacity expansions for
© O
EC
D/IE
A, 2
013

EXPORT CAPACITY INVESTMENT OUTLOOK
MEDIUM-TERM COAL MARKET REPORT 2013 115
the coal-rich Waterberg basin for years. Transport capacity currently stands at roughly 6 Mtpa. While the long-term strategy foresees a 24 Mtpa capacity by 2018, the project is still at the feasibility stage. Transnet has, however, built a rail loop on the line which might increase capacity by 2.4 Mtpa in the short term. The company plans to add another 6.2 Mtpa by the end of 2014. Mozambique Investment in export mining capacity
The huge undeveloped coal reserves (23 000 Mt) in Mozambique’s Tete province have caught the attention of several big mining companies, such as Rio Tinto or Vale. The significant amount of coking coal expected in the ground has made the territory attractive for investors. But severe infrastructure problems relative to inland transports and ports have limited a fast unlocking of coal from Mozambique in recent years. Infrastructure will remain the constraining factor for investments in mining capacity during this decade. Given these restrictions, mining capacity is projected to increase by 12 Mtpa (of which 8 Mtpa is coking coal) over the outlook period.2 The biggest mining project right now is Vale’s Moatize, which is currently ramping up production to reach its targeted 11 Mtpa production capacity. Vale is currently constructing Moatize II in a bid to double capacity. The Revuboe project, one-third owned by Japanese steel manufacturer Nippon Steel, is an open-cut operation. It aims to start production in 2016 and reach 5 Mtpa production by 2019. A full 70% of the 1 400 Mt of estimated reserves are coking coal. Another steel company active in Mozambique is Jindal Steel & Power, which is developing the Chirodze coal mine in Tete. The mine is already producing (and aims to increase production up to 10 Mtpa), but it is trucking the output to the port of Beira at costs reported to be well above USD 100 per tonne (USD/t). Although production has already started, further development of Rio Tinto’s Mozambique investment is uncertain, as the company had to write-off around USD 3 billion in early 2013. Investment in export infrastructure capacity
Both railway capacity and port capacity are major problems for investors in the Tete province. The Sena railway, shared by Vale and Rio Tinto, is the only rail connection to the port of Beira. The official 6.5 Mtpa rail capacity is hard to realise given flooding, derailment and security issues. Rio Tinto’s plan to use the Zambezi River to barge coal to Beira was rejected by the government for environmental reasons. Trucking coal over the large distance of over 600 kilometres (km) is not an option either, given the prohibitively high costs. Given these obstacles, investors’ new hope is a new 900 km railway connection linking Moatize to the port of Nacala, which requires the construction of over 200 km of new rail through Malawi and the rehabilitation of 700 km of existing rail in Mozambique. Around 30% of construction is finished and first transports are expected in early 2015. The deepwater port of Nacala will be commissioned at the end of 2014, with an ultimate targeted capacity of 18 Mtpa. Since Vale is the project’s main funder, it is unclear how much capacity will be available to other companies.
2 The share of thermal coal that is produced along with coking coal increases thermal coal capacity, although it seems unlikely that thermal coal can be exported economically. This is already a problem for mining companies today; thermal coal prices are so low that thermal coal is stockpiled at the mines.
© O
EC
D/IE
A, 2
013

EXPORT CAPACITY INVESTMENT OUTLOOK
116 MEDIUM-TERM COAL MARKET REPORT 2013
Russia Investment in export mining capacity
Incremental Russian mining export capacity is difficult to project, as a significant share of production output is targeted for domestic demand. Probable expansions are rather conservatively estimated at 15 Mtpa of thermal and met coal in 2018. Another 29 Mtpa of potential projects could further increase mining capacity for coal exports. Russian coal producer Mechel’s Elga open-pit mine began producing in 2011, with a licence to increase production to 9 Mtpa of thermal and met coal by 2013. However, the company has announced that it will delay the expansion by two to three years due to the current low prices of thermal and met coal. The Amaam coking coal project in the Bering coal region is set for development in 2014, with a targeted capacity of 5 Mtpa in 2017 and an additional expansion later on. SUEK is currently developing the Apsat mine, which might increase coking coal capacity by up to 2.5 Mtpa by 2017. The KOKS Group is currently involved in the coking coal projects Butovskaya (up to 1.5 Mtpa by 2017) and Tikhova (up to 3 Mtpa by 2021). SBU-Coal is planning to start the Ananyinsky Zapadny anthracite mine by the end of 2013 and to reach ultimate 1.5 Mtpa capacity in 2018. SBU-Coal is also expanding the Pervomaysky thermal coal project, with expected capacity increase from 2 Mtpa to 10 Mtpa by 2017. The development of the Elegest coal deposit has been lagging since its former owner, Yenisei Industrial Company, went bankrupt. Russian company TEPK obtained the license in April 2013 and plans to achieve 15 Mtpa capacity as of 2017. The success of the project depends on the completion of the 400 km Elegest-Kyzyl-Kuragino railway. Investment in export infrastructure capacity
Increasing exports from Russia to the Pacific basin have triggered investment in new export infrastructure on Russia’s east coast. The Russian company TEPK, which is developing the Elegest coking coal deposit, has signed an agreement with the Russian authorities to build the 400 km railway infrastructure linking Elegesta with the port of Vanino by 2017. TPEK plans to build a new coal export terminal at Vanino with an ultimate capacity of 15 Mtpa. Tiger Realm, the developer of the Amaam mine, plans to build a coal export terminal at the Bering Sea and a railway connecting the terminal for USD 420 million. Additional potential port handling capacity during the outlook period might come from Port Taman (Black Sea), Murmansk (Barent Sea) or Vostochny (Far East Federal District). Indonesia Investment in export mining capacity
Incremental export mining capacity in Indonesia is always difficult to project, since project lists are generally not transparent. Therefore, the entire Indonesian mining capacity additions are classified as potential additions. In the last decade, Indonesia has seen a rapid growth of production. Given the vast coal reserves in South Sumatra and East and South Kalimantan in particular, potential export mining capacity additions are projected to exceed 100 Mtpa until the end of the outlook period. Since Indonesia has increased annual exports by at least 30 Mt per year since 2008, this estimate is rather conservative. All of the big coal mining companies in Indonesia plan to increase production in the years to come. Bumi Resources plans to increase production by up to 35 Mtpa in the next two years. Adaro and Bukit Asam each target an additional production of 5 Mtpa within the next year (VDKI, 2013) and
© O
EC
D/IE
A, 2
013

EXPORT CAPACITY INVESTMENT OUTLOOK
MEDIUM-TERM COAL MARKET REPORT 2013 117
medium-term prospects are even higher. Numerous smaller mine projects are at a rather advanced stage, including a 2 Mtpa sub-bituminous coal mine by Indus Coal in the Jambi Province and the 2.5 Mtpa Katingan Ria project by Realm Resources. Both are scheduled to start operations in 2014. Investment in export infrastructure capacity
Indonesia coal is primarily exported from six main coal terminals, which can handle ships of up to 180 000 dwt: Adang Bay, Banjarmasin, Samarind, Pulau Laut, Tanjung Bara and Kotabaru. Panamax freighters also have access to a number of smaller coal terminals. Coal port capacity is projected to increase by 50 Mtpa by 2018. However, data availability on Indonesian port infrastructure projects is rather poor. One example of well documented expansion is the coal port of Tarahan: Indonesian state-owned coal mining company Bukit Asam is reported to have invested USD 260 million to upgrade it from 15 Mtpa to 25 Mtpa. Port capacity is not expected to be a bottleneck for Indonesian exports over the outlook horizon. The expansion of inland infrastructure is much more critical. Since incremental mining capacities in Indonesia are increasingly located farther inland and less connected to navigable rivers, new rail infrastructure is needed to increase exports. Indonesian state-owned rail company KAI is about to invest USD 350 million to increase overall coal freight rail capacity, from 13 Mtpa in 2013 to 50 Mtpa by 2018. Together with the Indonesian government, Russian Railways is building a USD 2.4 billion railway project in East Kalimantan. The line is scheduled to start operations by 2017 with 20 Mtpa of initial transport capacity. Other projects are struggling: Adani has pulled out of a USD 1.7 billion joint railway and port infrastructure project with Bukit Asam, including a 250 km railway with a 35 Mtpa capacity. Another USD 2 billion project by Bukit Asam in South Sumatra has been delayed for several years, due to licensing issues. Canada Investment in export mining capacity
The bulk of Canadian coal exports are met coal. High 2011 prices triggered further investment in mining capacity in the met coal-rich country. By 2018, Canadian export mining capacity is projected to grow by 13 Mtpa (including 8 Mtpa of met coal). Although much of the resources are located in Western Canada, one of the most promising projects is the Donkin underground project in Nova Scotia, 30 km from the Atlantic coast. The project received a full permit in 2013 and production could start at the end of 2014, with a targeted capacity of 2.75 Mtpa. Coal reserves contain 75% high-volume coking coal and 25% thermal coal with basic specifications. With free-on-board (FOB) cash-costs under USD 60/t, the mine will be in the lower range of the supply cost curve. In the Peace River region of British Colombia, Anglo American is increasing capacity of the Trend Mine by 1 Mtpa to reach 2.5 Mtpa of mid-volatile and low-volatile coking coal by 2016. Numerous other projects may also play a role by the end of the decade, but growing environmental concerns on the part of the public, combined with low coking coal prices, are preventing investors from quickly increasing capacity. Canadian mining company Teck Resources has delayed the restart of the Quintette met coal mine (closed in 2002) because of low prices and limited demand on the met coal market. The company will reconsider the project in 2014 and production could start by 2015, with a 3.5 Mtpa capacity. The Vista Coal Project in Alberta is awaiting environmental approval, after which the thermal coal mine would have a 6 Mtpa capacity. Thanks to expected FOB cash-costs below USD 60/t, high-quality coal and port and rail agreements already in place with Ridley and
© O
EC
D/IE
A, 2
013

EXPORT CAPACITY INVESTMENT OUTLOOK
118 MEDIUM-TERM COAL MARKET REPORT 2013
Canada, coal exports appear to be realisable by 2015. The Sukunka (Xstrata Coal) and Carbon Creek (Cardero Coal) coking coal projects still have to undergo an environmental assessment by the Province of British Colombia. If these projects realise, they could increase met coal production capacity by 6.5 Mtpa over the outlook period. Investment in export infrastructure capacity
The bulk of Canadian port handling capacities is located at the west coast. Because of increasing exports of Canadian met coal and thermal coal from the Powder River basin, Canadian ports have recently been highly utilised. This triggered investments in capacity expansions of coal ports such as the Westshore Coal Terminal, whose expansion to 33 Mtpa was completed in 2013. The Ridley Coal Terminal is also being extended in a bid to double export capacity to 24 Mtpa. The USD 200 million project is expected to be completed by 2014. Neptune Bulk Terminal, the third-largest coal port in British Colombia, will expand coal capacity by 10 Mtpa to 18.5 Mtpa by 2015. United States Investment in export mining capacity
Due to the sluggish domestic demand expectation and low international prices, significant incremental export mining capacity is not expected to come online by the end of the outlook period. However, some very cost-competitive projects in the Illinois basin have a chance of being realised. Investment in export infrastructure capacity
One hotly discussed topic in international coal markets is the potential of coal exports from the PRB (see Box 5.2). Production costs are very low (USD 10/t) thanks to very high strip ratios of 1 to 2 or 3. Further, although its calorific value is rather low (around 4 900 kilocalories per kilogram [kcal/kg]), the Pacific basin is considered an attractive export market. The main problem is export infrastructure. Large transport distances to the west coast, combined with the difficult terrain over the Rocky Mountains, make it challenging to realise rail transports. In addition, coal port projects in Oregon and Washington on the west coast face strong public opposition. Future carbon emissions, as well as coal dust and noise emissions from the trains transporting coal, are some of the main environmental concerns. Several major west coast coal terminals have been the topic of recent discussion. In May 2013, Kinder Morgan dropped plans for the Port Westward Coal Terminal at St. Helens (Oregon). The Gateway Pacific Terminal (Washington), with a 22 Mtpa coal handling capacity, is another project under discussion. Several environmental impacts, including greenhouse gas emissions from coal burning and traffic impacts from coal trains, need to be reviewed, thus hindering realisation of the project. The 23 Mtpa Millennium Bulk Terminal project in Longview (Washington), has been opened to public scoping and faces strong public opposition. Given current difficulties in realising infrastructure and the low international thermal coal prices, exports from the PRB via the west coast of the United States are not projected during the outlook period. Some coal volumes will, however, be shipped through Canada. The Myrtle Grove, Ascension Parish and Houston port expansions in the Gulf of Mexico are projected to increase United States (US) export capacity by 22 Mtpa by 2018.
© O
EC
D/IE
A, 2
013

EXPORT CAPACITY INVESTMENT OUTLOOK
MEDIUM-TERM COAL MARKET REPORT 2013 119
Box 5.2 The PRB: a little bit more coal on the supply side
The vast coal reserves of the PRB are often discussed as a game changer in global coal markets. A simple analysis of the coal market fundamentals shows that the impact of PRB exports on global coal consumption is not very high, either in the short term or in the long term, compared with global levels. While this simple model is clearly a simplification and the reality is far more complex, these conclusions are still valid.
Figure 5.4 illustrates the short-term effects of coal exports from the PRB on the international steam coal market. We assume current additional export capacity of 150 Mtpa of PRB coal at FOB costs below USD 60/t. Thus, PRB coal would be fully competitive. The red line shows how these capacities would shift the global supply curve to the right. Global short-term import demand is rather insensitive to decreasing prices: in Europe, the high price difference between coal and natural gas has already triggered most fuel-switching potential. In Japan and Korea, coal capacities run at very high load factors and decreasing coal prices will not increase demand significantly in the short term. Chinese import demand is rather price-sensitive, as coal imports compete with domestic mines. Indian import demand is considered more price-sensitive than import demand in Europe, Japan and Korea.
Given these market fundamentals, an additional 150 Mtpa of PRB export capacities would crowd out domestic Chinese coal production and high-cost export mines, such as exist in Australia or Russia. Since the whole global seaborne market is interrelated, PRB exports might even cannibalise high-cost US mines, such as in Appalachia. The additional PRB export capacity would decrease international coal prices by roughly 15 USD/t; since domestic markets are often influenced by international markets, domestic prices would be under pressure as well. Global steam coal imports, predominantly by China and India, would increase by 44 Mt. Since part of the increased imports would displace Chinese domestic production, the overall increase of Chinese coal demand would be even lower: a USD 15/t price drop would decrease average Chinese power generation costs by roughly USD 5 per megawatt hour, which would in turn trigger higher electricity demand. However, assuming a Chinese power demand elasticity of below 0.15, the increase in coal consumption would be below 20 Mt. Domestic markets in most countries are more or less linked to international prices; hence, some reaction should be expected here as well. In 2012, however, global oversupply made steam coal prices fell by more than USD 20/t within one year and global steam coal demand grew at slower paces than in previous years.
Figure 5.5 shows the long-term supply and demand effects of PRB coal. The blue line represents long-term global supply costs, i.e. the full costs to produce coal with respect to the global reserve base. The cost curve is very flat, between 100 gigatonnes (Gt) and 600 Gt, with mine-mouth full costs ranging between USD 70/t and USD 95/t. PRB coal reserves are estimated at roughly 150 Gt. Part of the PRB coal reserves is minable at very low full costs, as coal can be mined in open-cast mines with high strip ratios of 1 to 3. Most of the vast PRB coal reserves range in the flat part of the cost curve. Long-term demand is more sensitive to prices. In the long run, new installations of coal-fired power plants, for example, create demand for coal; those investments will only be triggered if coal prices are competitive compared with prices of other primary energy sources. Given the supply cost curve, we assume a cumulated coal demand of roughly 380 Gt until 2050, in line with the 6°C Scenario presented in Energy Technology Perspectives 2012 (IEA, 2012).
In a situation where none of the PRB coal reserves were mined (e.g. due to institutional barriers), the long-term cost curve would shift to the left. In other words, without the PRB reserves, coal mining costs would increase and the reserve base would decrease by 150 Gt. However, since the global long-term supply cost curve is very flat, global long-term demand would be 12 Gt lower without the PRB reserves. This would amount to roughly 1.5 times the annual global coal production of 2012. Burning 12 Gt of coal would lead to roughly 22 Gt of carbon dioxide (CO2) emissions. In 2012, combined combustion of natural gas, oil and coal caused an estimated 31.6 Gt of global CO2 emissions (IEA, 2013c).
© O
EC
D/IE
A, 2
013

EXPORT CAPACITY INVESTMENT OUTLOOK
120 MEDIUM-TERM COAL MARKET REPORT 2013
Box 5.2 The PRB: a little bit more coal on the supply side (continued)
Figure 5.4 Short-term global FOB supply cost curve
Note: costs and volumes are standardised to a net calorific value of 6 000 kcal/kg.
Source: IEA (2013b), World Energy Outlook 2013, OECD/IEA, Paris.
The price effect of PRB coal would be roughly USD 8/t. This would mean that for a 1 gigawatt coal-fired power plant, the fuel cost difference within a year would be USD 17 million. This amount seems negligible to the investment decision when considering the high capital costs of a coal-fired power plant: the 1 percentage point interest rate difference already affects capital costs by more than USD 17 million. Additionally, the rather low price effect on coal would mean that a CO2 price increase of only USD 4/t would phase out 12 Gt of coal in the long term.
Figure 5.5 Indicative long-term global mine-mouth supply cost curve
0
20
40
60
80
100
120
0 100 200 300 400 500 600 700 800 900 1 000
USD/t
MtShort-term demand Supply cost curve with PRB Supply cost curve without PRB
0
80
160
240
0 100 200 300 400 500 600 700
USD/t
GtUncertainty Long-term demand curve With PRB Without PRB
PRB low cost
PRB other
© O
EC
D/IE
A, 2
013

EXPORT CAPACITY INVESTMENT OUTLOOK
MEDIUM-TERM COAL MARKET REPORT 2013 121
References BREE (Bureau of Resources and Energy Economics) (2013), Resources and Energy Major Projects, BREE, Canberra, www.bree.gov.au/documents/publications/remp/REMP-2013-04.pdf. IEA (International Energy Agencey) (2012), Energy Technology Perspectives 2012, OECD/IEA, Paris. IEA (2013a), Resources to Reserves, OECD/IEA, Paris. IEA (2013b), World Energy Outlook 2013, OECD/IEA, Paris. IEA (2013c), Redrawing the Energy-climate Map, OECD/IEA, Paris. VDKI (Verein der Kohlenimporteure e.V.) (2013), Annual Report 2013: German Hard Coal Importer’s Association, VDKI, Hamburg.
© O
EC
D/IE
A, 2
013
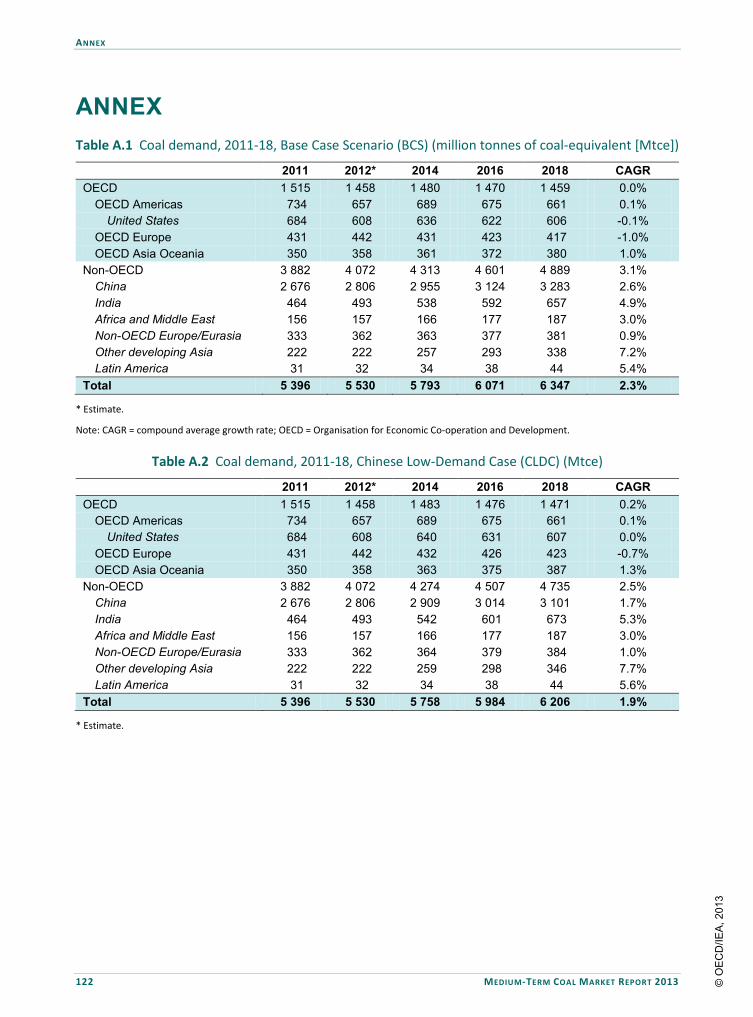
ANNEX
122 MEDIUM-TERM COAL MARKET REPORT 2013
ANNEX Table A.1 Coal demand, 2011-18, Base Case Scenario (BCS) (million tonnes of coal-equivalent [Mtce])
2011 2012* 2014 2016 2018 CAGR
OECD 1 515 1 458 1 480 1 470 1 459 0.0% OECD Americas 734 657 689 675 661 0.1%
United States 684 608 636 622 606 -0.1% OECD Europe 431 442 431 423 417 -1.0% OECD Asia Oceania 350 358 361 372 380 1.0%
Non-OECD 3 882 4 072 4 313 4 601 4 889 3.1% China 2 676 2 806 2 955 3 124 3 283 2.6% India 464 493 538 592 657 4.9% Africa and Middle East 156 157 166 177 187 3.0% Non-OECD Europe/Eurasia 333 362 363 377 381 0.9% Other developing Asia 222 222 257 293 338 7.2% Latin America 31 32 34 38 44 5.4%
Total 5 396 5 530 5 793 6 071 6 347 2.3%
* Estimate.
Note: CAGR = compound average growth rate; OECD = Organisation for Economic Co-operation and Development.
Table A.2 Coal demand, 2011-18, Chinese Low-Demand Case (CLDC) (Mtce)
2011 2012* 2014 2016 2018 CAGR
OECD 1 515 1 458 1 483 1 476 1 471 0.2% OECD Americas 734 657 689 675 661 0.1%
United States 684 608 640 631 607 0.0% OECD Europe 431 442 432 426 423 -0.7% OECD Asia Oceania 350 358 363 375 387 1.3%
Non-OECD 3 882 4 072 4 274 4 507 4 735 2.5% China 2 676 2 806 2 909 3 014 3 101 1.7% India 464 493 542 601 673 5.3% Africa and Middle East 156 157 166 177 187 3.0% Non-OECD Europe/Eurasia 333 362 364 379 384 1.0% Other developing Asia 222 222 259 298 346 7.7% Latin America 31 32 34 38 44 5.6%
Total 5 396 5 530 5 758 5 984 6 206 1.9%
* Estimate.
© O
EC
D/IE
A, 2
013
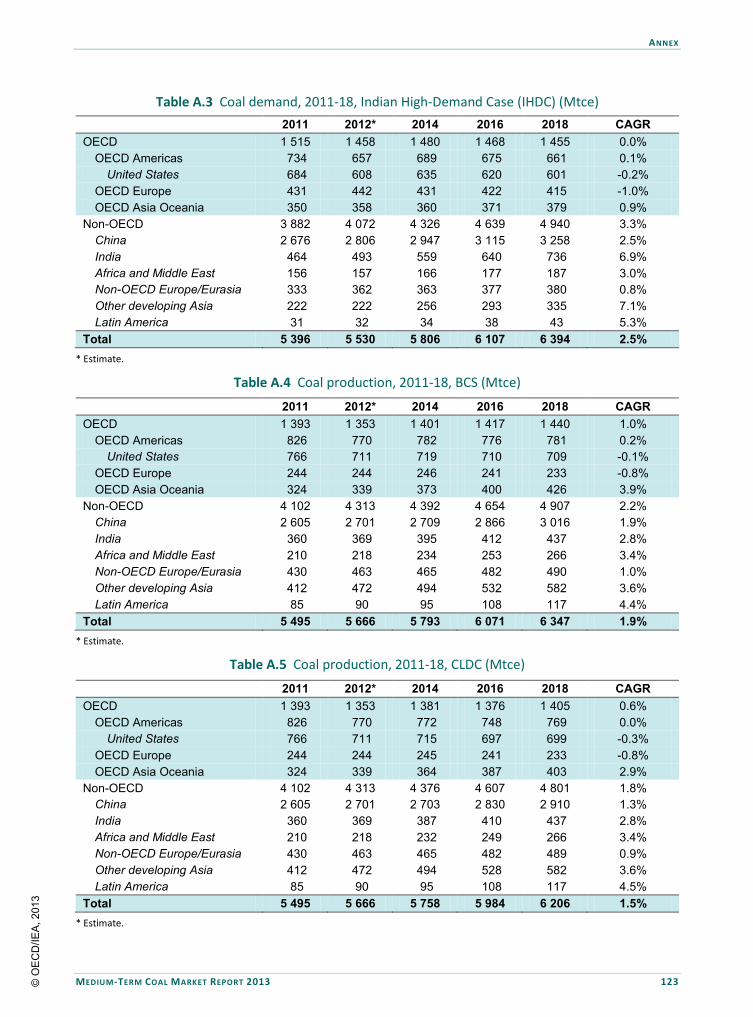
ANNEX
MEDIUM-TERM COAL MARKET REPORT 2013 123
Table A.3 Coal demand, 2011-18, Indian High-Demand Case (IHDC) (Mtce)
2011 2012* 2014 2016 2018 CAGR
OECD 1 515 1 458 1 480 1 468 1 455 0.0% OECD Americas 734 657 689 675 661 0.1%
United States 684 608 635 620 601 -0.2% OECD Europe 431 442 431 422 415 -1.0% OECD Asia Oceania 350 358 360 371 379 0.9%
Non-OECD 3 882 4 072 4 326 4 639 4 940 3.3% China 2 676 2 806 2 947 3 115 3 258 2.5% India 464 493 559 640 736 6.9% Africa and Middle East 156 157 166 177 187 3.0% Non-OECD Europe/Eurasia 333 362 363 377 380 0.8% Other developing Asia 222 222 256 293 335 7.1% Latin America 31 32 34 38 43 5.3%
Total 5 396 5 530 5 806 6 107 6 394 2.5% * Estimate.
Table A.4 Coal production, 2011-18, BCS (Mtce)
2011 2012* 2014 2016 2018 CAGR
OECD 1 393 1 353 1 401 1 417 1 440 1.0% OECD Americas 826 770 782 776 781 0.2%
United States 766 711 719 710 709 -0.1% OECD Europe 244 244 246 241 233 -0.8% OECD Asia Oceania 324 339 373 400 426 3.9%
Non-OECD 4 102 4 313 4 392 4 654 4 907 2.2% China 2 605 2 701 2 709 2 866 3 016 1.9% India 360 369 395 412 437 2.8% Africa and Middle East 210 218 234 253 266 3.4% Non-OECD Europe/Eurasia 430 463 465 482 490 1.0% Other developing Asia 412 472 494 532 582 3.6% Latin America 85 90 95 108 117 4.4%
Total 5 495 5 666 5 793 6 071 6 347 1.9% * Estimate.
Table A.5 Coal production, 2011-18, CLDC (Mtce)
2011 2012* 2014 2016 2018 CAGR
OECD 1 393 1 353 1 381 1 376 1 405 0.6% OECD Americas 826 770 772 748 769 0.0%
United States 766 711 715 697 699 -0.3% OECD Europe 244 244 245 241 233 -0.8% OECD Asia Oceania 324 339 364 387 403 2.9%
Non-OECD 4 102 4 313 4 376 4 607 4 801 1.8% China 2 605 2 701 2 703 2 830 2 910 1.3% India 360 369 387 410 437 2.8% Africa and Middle East 210 218 232 249 266 3.4% Non-OECD Europe/Eurasia 430 463 465 482 489 0.9% Other developing Asia 412 472 494 528 582 3.6% Latin America 85 90 95 108 117 4.5%
Total 5 495 5 666 5 758 5 984 6 206 1.5% * Estimate.
© O
EC
D/IE
A, 2
013

ANNEX
124 MEDIUM-TERM COAL MARKET REPORT 2013
Table A.6 Coal production, 2011-18, IHDC (Mtce)
2011 2012* 2014 2016 2018 CAGR
OECD 1 393 1 353 1 407 1 426 1 465 1.3% OECD Americas 826 770 784 780 798 0.6%
United States 766 711 718 712 720 0.2% OECD Europe 244 244 246 241 236 -0.6% OECD Asia Oceania 324 339 377 405 431 4.1%
Non-OECD 4 102 4 313 4 399 4 680 4 930 2.3% China 2 605 2 701 2 715 2 891 3 033 1.9% India 360 369 396 414 442 3.1% Africa and Middle East 210 218 234 253 266 3.4% Non-OECD Europe/Eurasia 430 463 465 482 490 1.0% Other developing Asia 412 472 494 532 582 3.6% Latin America 85 90 95 108 116 4.4%
Total 5 495 5 666 5 806 6 107 6 394 2.0%
* Estimate.
Table A.7 Hard coal net imports, 2011-18, BCS (Mtce)
2011 2012* 2014 2016 2018 CAGR
OECD 120 105 79 52 18 2.3% OECD Americas - 87 - 105 - 94 - 101 - 120 1.4%
United States - 77 - 94 - 83 - 88 - 103 -1.6% OECD Europe 192 203 185 182 184 - OECD Asia Oceania 15 6 - 12 - 29 - 46 -25.2%
Non-OECD - 120 - 105 - 79 - 52 - 18 -25.3% China 161 214 246 258 267 3.8% India 105 124 143 180 220 10.1% Africa and Middle East - 57 - 64 - 68 - 76 - 80 3.7% Non-OECD Europe/Eurasia - 80 - 88 - 102 - 105 - 109 3.6% Other developing Asia - 193 - 230 - 237 - 239 - 244 1.0% Latin America - 56 - 59 - 61 - 70 - 73 3.7%
* Estimate.
Table A.8 Hard coal net imports, 2011-18, CLDC (Mtce)
2011 2012* 2014 2016 2018 CAGR
OECD 120 105 102 100 66 -7.5% OECD Americas - 87 - 105 - 83 - 73 - 108 0.5%
United States - 77 - 94 - 75 - 66 - 92 -0.4% OECD Europe 192 203 187 185 190 -1.1% OECD Asia Oceania 15 6 - 1 - 11 - 16 -
Non-OECD - 120 - 105 - 102 - 100 - 66 -7.5% China 161 214 206 184 191 -1.9% India 105 124 155 191 236 11.4% Africa and Middle East - 57 - 64 - 66 - 72 - 80 3.7% Non-OECD Europe/Eurasia - 80 - 88 - 101 - 103 - 105 2.9% Other developing Asia - 193 - 230 - 235 - 230 - 236 0.4% Latin America - 56 - 59 - 61 - 70 - 73 3.6%
* Estimate.
© O
EC
D/IE
A, 2
013

ANNEX
MEDIUM-TERM COAL MARKET REPORT 2013 125
Table A.9 Hard coal net imports, 2011-18, IHDC (Mtce)
2011 2012* 2014 2016 2018 CAGR
OECD 120 105 73 42 - 10 - OECD Americas - 87 - 105 - 95 - 105 - 137 4.6%
United States - 77 - 94 - 83 - 93 - 120 4.0% OECD Europe 192 203 185 181 179 -2.1% OECD Asia Oceania 15 6 - 17 - 34 - 52 -
Non-OECD - 120 - 105 - 73 - 42 10 - China 161 214 233 223 225 0.9% India 105 124 163 226 294 15.5% Africa and Middle East - 57 - 64 - 68 - 76 - 80 3.7% Non-OECD Europe/Eurasia - 80 - 88 - 102 - 105 - 110 3.8% Other developing Asia - 193 - 230 - 238 - 240 - 246 1.2% Latin America - 56 - 59 - 61 - 70 - 73 3.7%
* Estimate.
Table A.10 Seaborne steam coal imports, 2011-18, BCS (Mtce)
2011 2012* 2014 2016 2018 CAGR
Europe and Mediterranean 148 165 148 142 145 -2.1% Japan 102 112 113 118 120 1.2% Korea 82 80 82 86 93 2.5% Chinese Taipei 53 50 54 56 60 3.1% China 126 164 187 189 192 2.6% India 73 90 107 140 175 11.7% Latin America 17 18 18 18 18 0.0% Other 64 59 68 84 110 11.0% Total 665 738 778 834 913 3.6%
* Estimate.
Table A.11 Seaborne steam coal exports, 2011-18, BCS (Mtce)
2011 2012* 2014 2016 2018 CAGR
Australia 126 140 150 165 189 5.2% South Africa 62 67 68 72 75 1.8% Indonesia 266 301 324 343 374 3.6% Russia 76 82 92 93 96 2.6% Colombia 72 76 77 87 94 3.6% China 12 8 5 3 3 -15.3% United States 29 42 39 43 55 4.7% Other 21 22 24 27 27 4.1% Total 665 738 778 834 913 3.6%
*Estimate.
© O
EC
D/IE
A, 2
013

ANNEX
126 MEDIUM-TERM COAL MARKET REPORT 2013
Table A.12 Seaborne metallurgical coal (met coal) imports, 2011-18, BCS, in Mtce
Mtce 2011 2012* 2014 2016 2018 CAGR Europe and Mediterranean 64 63 66 69 71 2.1% Japan 52 50 52 52 53 1.0% Korea 31 30 31 33 36 2.8% China 31 40 41 44 48 3.0% India 31 32 35 40 45 6.0% Other 22 25 28 32 37 6.7% Total 230 240 253 271 290 3.2%
* Estimate.
Table A.13 Seaborne met coal exports, 2011-18, BCS (Mtce)
2011 2012* 2014 2016 2018 CAGR
Australia 137 138 151 162 168 3.3% Canada 22 25 26 26 31 3.7% Mozambique 0 3 5 7 9 23.8% Russia 6 11 15 16 19 8.6% United States 56 55 49 50 53 -0.6% Other 10 8 8 9 10 5.2% Total 230 240 253 271 290 3.2%
* Estimate.
Table A.14 Seaborne steam coal imports, 2011-18, CLDS (Mtce)
2011 2012* 2014 2016 2018 CAGR
Europe and Mediterranean 148 165 149 144 150 -1.6% Japan 102 112 114 120 124 1.7% Korea 82 80 83 87 96 3.0% Chinese Taipei 53 50 55 57 62 3.7% China 126 164 147 115 116 -5.7% India 73 90 120 152 191 13.4% Latin America 17 18 15 16 18 0.5% Other 64 59 72 88 114 11.5% Total 665 738 755 781 870 2.8%
* Estimate.
Table A.15 Seaborne steam coal exports, 2011-18, CLDS (Mtce)
2011 2012* 2014 2016 2018 CAGR
Australia 126 140 141 152 167 3.0% South Africa 62 67 68 72 75 1.8% Indonesia 266 301 324 337 370 3.5% Russia 76 82 91 91 92 1.9% Colombia 72 76 77 87 94 3.6% China 12 8 5 3 3 -15.3% United States 29 42 28 16 43 0.4% Other 21 22 21 22 26 3.5% Total 665 738 755 781 870 2.8%
* Estimate.
© O
EC
D/IE
A, 2
013

ANNEX
MEDIUM-TERM COAL MARKET REPORT 2013 127
Table A.16 Seaborne steam coal imports, 2011-18, IHDC (Mtce)
2011 2012* 2014 2016 2018 CAGR
Europe and Mediterranean 148 165 148 141 143 -2.3% Japan 102 112 113 118 119 1.1% Korea 82 80 82 85 92 2.4% Chinese Taipei 53 50 54 56 60 3.0% China 126 164 174 155 150 -1.4% India 73 90 128 186 249 18.5% Latin America 17 18 15 16 18 -0.1% Other 64 59 71 86 109 10.8% Total 665 738 785 844 940 4.1%
* Estimate.
Table A.17 Seaborne steam coal exports, 2011-18, IHDC (Mtce)
2011 2012* 2014 2016 2018 CAGR
Australia 126 140 154 170 194 5.6% South Africa 62 67 68 72 75 1.8% Indonesia 266 301 325 343 374 3.7% Russia 76 82 92 94 97 2.9% Colombia 72 76 77 87 94 3.6% China 12 8 5 3 3 -15.3% United States 29 42 40 48 72 9.5% Other 21 22 24 27 30 5.9% Total 665 738 785 844 940 4.1%
* Estimate.
Table A.18 Coal demand, 2011-18, BCS (million tonnes [Mt])
2011 2012* 2014 2016 2018 CAGR
OECD 2 240 2 169 2 165 2 175 2 170 0.0% OECD Americas 992 892 919 905 888 -0.1%
United States 920 822 849 833 813 -0.2% OECD Europe 793 810 781 792 794 -0.3% OECD Asia Oceania 455 467 465 478 488 0.8%
Non-OECD 5 287 5 527 5 838 6 230 6 629 3.1% China 3 514 3 678 3 867 4 094 4 312 2.7% India 710 753 813 891 984 4.6% Africa and Middle East 203 205 212 234 249 3.3% Non-OECD Europe/Eurasia 545 574 581 596 600 0.8% Other developing Asia 281 281 323 368 429 7.3% Latin America 34 36 42 47 54 6.8%
Total 7 527 7 697 8 002 8 405 8 799 2.3%
* Estimate.
Note: projections have been produced in million tonnes of coal-equivalent. For reference, this Annex also includes coal volumes in million tonnes. We have not analysed the calorific values of coal to be produced; therefore, projections in million tonnes should be consulted with caution.
© O
EC
D/IE
A, 2
013

ANNEX
128 MEDIUM-TERM COAL MARKET REPORT 2013
Table A.19 Coal production, 2011-18, BCS (Mt)
2011 2012* 2014 2016 2018 CAGR
OECD 2 082 2 032 2 086 2 125 2 159 1.0% OECD Americas 1 089 1 017 1 034 1 028 1 035 0.3%
United States 1 006 935 946 937 935 0.0% OECD Europe 583 587 581 593 592 0.1% OECD Asia Oceania 410 428 471 503 533 3.7%
Non-OECD 5 526 5 799 5 916 6 280 6 640 2.3% China 3 419 3 549 3 554 3 767 3 974 1.9% India 582 595 632 662 703 2.8% Africa and Middle East 259 269 294 324 343 4.1% Non-OECD Europe/Eurasia 658 693 695 713 723 0.7% Other developing Asia 514 594 633 687 756 4.1% Latin America 94 99 108 127 141 6.1%
Total 7 608 7 831 8 002 8 405 8 799 2.0%
* Estimate.
Table A.20 Seaborne steam coal imports, 2011-18, BCS (Mt)
2011 2012* 2014 2016 2018 CAGR
Europe and Mediterranean 161 171 159 155 157 -1.3% Japan 120 132 132 138 141 1.1% Korea 97 94 96 101 111 2.8% Chinese Taipei 61 56 61 63 69 3.4% China 151 225 254 257 261 2.5% India 97 122 143 186 233 11.4% Latin America 18 19 19 19 20 0.8% Other 71 69 80 104 139 12.5% Total 775 887 944 1 023 1 131 4.1%
* Estimate.
Table A.21 Seaborne steam coal exports, 2011-18, BCS (Mt)
2011 2012* 2014 2016 2018 CAGR
Australia 145 160 173 193 223 5.6% South Africa 68 74 77 85 89 3.2% Indonesia 318 383 417 444 489 4.1% Russia 90 97 109 111 113 2.6% Colombia 78 82 86 102 113 5.6% China 13 10 6 4 4 -15.5% United States 34 51 45 51 65 4.1% Other 29 30 31 35 35 2.7% Total 775 887 944 1 023 1 131 4.1%
* Estimate.
© O
EC
D/IE
A, 2
013

ANNEX
MEDIUM-TERM COAL MARKET REPORT 2013 129
Table A.22 Seaborne met coal imports, 2011-18, BCS (Mt)
2011 2012* 2014 2016 2018 CAGR
Europe and Mediterranean 66 64 67 70 72 2.1% Japan 54 52 54 54 55 0.8% Korea 32 31 32 34 37 2.9% China 32 43 45 49 54 3.8% India 33 35 38 43 48 5.6% Other 24 25 28 33 38 7.0% Total 243 250 264 283 304 3.3%
* Estimate.
Table A.23 Seaborne met coal exports, 2011-18, BCS (Mt)
2011 2012* 2014 2016 2018 CAGR
Australia 140 142 154 165 171 3.3% Canada 27 29 30 30 36 3.7% Mozambique 0 3 5 8 10 23.8% Russia 7 11 15 17 20 11.0% United States 59 59 52 53 57 -0.6% Other 10 8 8 9 10 5.2% Total 243 250 264 283 304 3.3%
* Estimate.
Table A.24 Current coal mining projects
Country Project Company Type Estimated start-up
Estimated new capacity (Mtpa) Resource Status
Australia Alpha Coal Project
GVK – Hancock Coal N 2016 30 TC F
Australia Appin Area 9 BHP Billiton E 2016 3.5 CC C
Australia Ashton South East open-cut
Yancoal Australia E x 3.6 TC F
Australia Baralaba expansion
Cockatoo Coal E 2014 3.5 PCI, TC F
Australia Baralaba South Cockatoo Coal E 2014 3 PCI, TC F
Australia Bengalla expansion (stage 2)
Rio Tinto/ Wesfarmers E x 1.4 TC F
Australia Boggabri open-cut
Idemitsu Kosan E 2014 3.5 TC C
Australia Bundi Coal Project MetroCoal N 2017 5 TC F
Australia Byerwen Coal Project
QCoal/ JFE Steel
Corporation N 2015 10 CC F
Australia Carmichael Coal
Project (mine and rail)
Adani N 2016 60 TC F
Australia Caval Ridge BHP Billiton Mitsubishi
Alliance (BMA) N 2014 8 CC C
© O
EC
D/IE
A, 2
013

ANNEX
130 MEDIUM-TERM COAL MARKET REPORT 2013
Australia China First Coal project
Waratah Coal N 2017 40 TC F
Australia Coalpac consolidation Coalpac E 2016 1.6 TC F
Australia Cobbora Cobbora Holding
Company N 2015 12 TC F
Australia Codrilla Peabody Energy N 2017+ 3.2 PCI F
Australia Colton New Hope N 2015 0.5 CC F
Australia Comet Ridge Acacia
Coal/Bandanna Energy
N 2015 0.4 TC, CC F
Australia Curragh Mine Wesfarmers E x 1.5-2 CC F
Australia Dingo West Bandanna Energy E 2014 1 PCI, TC F
Australia Drake Coal project QCoal N 2014 6 TC, CC F
Australia Drayton South Anglo Coal Australia E 2015 4 TC F
Australia Duchess Paradise Rey Resources N 2015 2.5 TC F
Australia Duralie Extension project
Yancoal Australia E x 1.2 CC F
Australia Eagle Downs
(Peak Downs East underground)
Aquila Resources/
Vale N 2017 4.5 CC C
Australia Eaglefield Peabody Energy E 2015 5.2 CC F
Australia Elimatta New Hope N 2016 5 TC F
Australia Ellensfield coal mine project Vale N x 5.5 TC, CC F
Australia Foxleigh Plains Project
Anglo Coal Australia E 2014 1.4 PCI F
Australia Grosvenor underground
Anglo American N 2016 5 CC C
Australia Jax QCoal N x 1.8 CC F Australia Kevin’s Corner GVK N 2016 30 TC F Australia Maules Creek Whitehaven N 2014 10.8 TC, CC F
Australia Metropolitan Peabody Energy E 2015 1.5 CC C
Australia Middlemount (stage 2)
Peabody Energy/ YanCoal
E x 3.6 PCI, CC F
Australia Minyango Guangdong
Rising Assets Management
N 2014 7.5 TC, CC F
Australia Moolarben (stage 2)
Yancoal Australia E x 3 TC F
Australia Mt Thorley – Warkworth extension
Rio Tinto E x 0 TC F
Australia New Acland (stage 3)
New Hope Coal E 2016 2.7 TC F
© O
EC
D/IE
A, 2
013

ANNEX
MEDIUM-TERM COAL MARKET REPORT 2013 131
Australia North Surat – Collingwood
Project
Cockatoo Coal N 2015 6 TC F
Australia NRE No. 1 Colliery
Gujarat NRE Coking Coal E 2014 3 CC F
Australia NRE No. 1
Colliery (preliminary works project)
Gujarat NRE Coking Coal x 2015 x CC C
Australia Oaky Creek (phase 2)
Xstrata, Sumisho,
Itochu, ICRA OC
E x 5 CC F
Australia Orion Downs Endocoal N 2014 2.5 TC F
Australia Rolleston (phase 1)
Xstrata, Sumisho,
IRCA E 2014 3 TC C
Australia Rolleston (phase 2)
Xstrata, Sumisho,
IRCA E x 3 TC F
Australia Sarum Xstrata,
Itochu, ICRA NCA, Sumisho
N 2014 6.5 TC, CC F
Australia South Galilee Coal Project
(three phases)
Bandanna Energy N 2015 17 TC F
Australia Springsure Creek (stage 1)
Bandanna Energy N 2015 5.5 TC F
Australia Springsure Creek (stage 2)
Bandanna Energy E 2018+ 5.5 TC F
Australia Stratford Yancoal Australia x 2014 2.6 TC, CC F
Australia Taroborah Shenhuo International N 2015+ 2.3 CC F
Australia Taroom Cockatoo Coal N x 8 TC F
Australia Tarrawonga Expansion Whitehaven E x 1 PCI, TC F
Australia Teresa Linc Energy N 2016 8 PCI F
Australia The Range Project
Stanmore Coal N 2016 5 TC F
Australia Ulan West Xstrata, Mitsubishi E 2014 6.7 TC C
Australia Vermont East/ Wilunga
Peabody Energy N 2015 3 PCI, TC F
Australia Vickery Whitehaven N 2014 4.5 TC, CC F
Australia Wallarah
underground longwall
Korea Resources
Corp/ Sojitz Corp
N x 5 TC F
Australia Wards Well BMA N 2017 5 CC F
Australia Washpool coal project
Aquila Resources N x 2.6 CC F
Australia Watermark Shenhua Energy N 2015 6.15 TC F
© O
EC
D/IE
A, 2
013

ANNEX
132 MEDIUM-TERM COAL MARKET REPORT 2013
Australia West Wallsend Colliery
Xstrata and others E x x TC, CC F
Australia Wongai Project Aust-Pac Capital N x 1.5 CC F
Australia Wongawilli Colliery
Gujarat NRE Coking Coal E 2016 3 CC F
Australia Woori Cockatoo Coal N 2016 x TC F Canada Carbon Creek Cardero Coal N 2014 4 CC F
Canada Donkin Glencore
Xstrata, Morien Resources
N 2014 2.75 CC C
Canada Echo Hill Hillsborough Resources N x 1.5 TC F
Canada Horizon Peace River Coal N x 1.6 CC F
Canada Huguenot Colonial Coal N x 4 CC F Canada Murray River HD Mining N x 6 CC F
Canada Quintette Teck Resources N 2015 3.5 CC F
Canada Sukunka Glencore Xstrata N 2015 2.5 CC F
Canada Trend Anglo American E 2016 2.5 CC C
Canada Vista Coal Project Coalspur mines N 2015 6 TC F
Colombia Cerrejon expansion Cerrejon E 2015 8 TC C
Colombia El Descanso Drummond E x 12 TC F Colombia La Guarija MPX N x 20 TC x
Colombia La Jagua/ El Calenturitas Prodeco E 2015 6.4 TC C
Indonesia Adaro Wara Adaro E 2014 12 TC C Indonesia Jambi Indus Coal N 2014 2 TC F Indonesia Kantingan Ria Resources N 2014 2.5 TC F Indonesia MukoMuko Indus Coal N 2014 x TC F Indonesia Persada MEC Holdings N 2014 27.5 TC C Indonesia Samarangau Kideco E 2014 21 TC C
Indonesia Sangatta Bumi Resources E 2014 12 TC C
Mozambique Chirodze Jindal Steel & Power N 2013 10 CC C
Mozambique Moatize II Vale N x 11 CC F
Mozambique Revuboe Talbot,
Nippon Steel, POSCO
N 2016 5 CC F
Russia Amaam Tigers Realm N 2017 5 CC F Russia Amaam North Tigers Realm N 2015-16 1 CC F
Russia Ananyinsky Zapadny SBU N 2014 1.5 AN C
Russia Apsat SUEK N 2017 2.5 CC C Russia Butovskaya KOKS N 2017 1.5 CC F Russia Centralny Severstal x 2018 7.5 CC x Russia Chulmakanskoe Kolmar N 2015 3 x x
© O
EC
D/IE
A, 2
013

ANNEX
MEDIUM-TERM COAL MARKET REPORT 2013 133
Russia Denisovskoe Kolmar N x 3 x x Russia Elegest TEPK N 2018 3 CC F Russia Elga Mechel E 2015-16 9 TC, CC C Russia Karakanskoe Karakan Invest N x 4 x x Russia Mezhegey Evraz N 2014 1.3 CC x Russia Pervomaysky SBU E 2017 8 TC C Russia Sarbalinskaya OMK x 2018 2.5 CC x
Russia Sibirginskaya Yuzhny Kuzbass x 2015 2.4 CC x
Russia Usinskoe Severstal x 2018 2.5 CC x Russia Usinskoe – 3 NLMK x 2018 4.5 CC x Russia Zhernovskaya – 1 NLMK x 2016 3 CC x
South Africa Belfast Exxaro x x 1.8 x x
South Africa Boikarabelo Resource Generation N 2015-16 6 TC C
South Africa De Wittekranz Continental Coal N x 2.4 x F
South Africa Elandspruit Wescoal N 2015 2.3 TC C
South Africa Grootegeluk expansion Exxaro E 2014 14.6 TC C
South Africa Impumelelo Sasol N 2014 x x F South Africa Kangala Universal Coal N 2014 2 TC C
South Africa Kriel Anglo American N x 5-7 x F
South Africa New Largo Anglo American N x 12 x F
South Africa Roodekop Universal Coal N 2014 1 x F South Africa Shondoni Sasol N 2015 x x F
South Africa Smitspna Sekoko/
Firestone energy
N x > 1 x x
South Africa Sterkfontein Keaton Energy N x 1 x F
South Africa Tweefontain
Glencore Xstrata African
Rainbow Minerals
N 2015 6.6 TC C
South Africa Wonderfontein Glencore Xstrata N 2014-15 3.6 TC C
South Africa Zonnebloem Glencore Xstrata E 2017 2.4-8.5 x x
Notes: the table lists currently discussed mining projects according to publicly available information but has no claim to completeness. Data on the start-up data is according to public information but does not necessarily represent our view concerning expected export capacity additions. Data on the estimated capacity represents the targeted capacity, which is often not available in the year of start-up.
Type: N = new project; E = expansion.
Resource: TC = thermal coal; CC = coking coal; AN = anthracite; PCI = pulverised coal injection.
Status: F = feasibility; C = committed.
Sources: McCloskey (2013), McCloskey Coal Reports 2010-2013, McCloskey’s, London, http://cr.mccloskeycoal.com; BREE (Bureau of Resources and Energy Economics) (2013), Resources and Energy Major Projects, BREE, Canberra, www.bree.gov.au/documents/ publications/remp/REMP-2013-04.pdf; CIAB information; various sources.
© O
EC
D/IE
A, 2
013

GLOSSARY
134 MEDIUM-TERM COAL MARKET REPORT 2013
GLOSSARY Regional and country groupings Africa Algeria, Angola, Benin, Botswana, Cameroon, Congo, Democratic Republic of Congo, Côte d’Ivoire, Egypt, Eritrea, Ethiopia, Gabon, Ghana, Kenya, Libya, Morocco, Mozambique, Namibia, Nigeria, Senegal, South Africa, Sudan, United Republic of Tanzania, Togo, Tunisia, Zambia, Zimbabwe and other African countries (Burkina Faso, Burundi, Cape Verde, Central African Republic, Chad, Comoros, Djibouti, Equatorial Guinea, Gambia, Guinea, Guinea-Bissau, Lesotho, Liberia, Madagascar, Malawi, Mali, Mauritania, Mauritius, Niger, Reunion, Rwanda, Sao Tome and Principe, Seychelles, Sierra Leone, Somalia, Swaziland and Uganda). China Refers to the People’s Republic of China, including Hong Kong. Europe and Mediterranean Includes Non-OECD Europe/Eurasia, OECD Europe and North Africa regional groupings. Latin America Argentina, Bolivia, Brazil, Chile, Colombia, Costa Rica, Cuba, the Dominican Republic, Ecuador, El Salvador, Guatemala, Haiti, Honduras, Jamaica, Netherlands Antilles, Nicaragua, Panama, Paraguay, Peru, Trinidad and Tobago, Uruguay, Venezuela and other Latin American countries (Antigua and Barbuda, Aruba, Bahamas, Barbados, Belize, Bermudas, British Virgin Islands, Cayman Islands, Dominica, Falkland Islands (Malvinas), French Guyana, Grenada, Guadeloupe, Guyana, Martinique, Montserrat, St. Kitts and Nevis, Saint Lucia, Saint Pierre et Miquelon, St. Vincent and the Grenadines, Suriname and Turks and Caicos Islands). Non-OECD Europe/Eurasia Albania, Armenia, Azerbaijan, Belarus, Bosnia and Herzegovina, Bulgaria, Croatia, Georgia, Kazakhstan, Kyrgyz Republic, Latvia, Lithuania, the Former Yugoslav Republic of Macedonia, Moldova, Romania, Russian Federation, Serbia, Tajikistan, Turkmenistan, Ukraine and Uzbekistan. North Africa Algeria, Egypt, Libya, Morocco and Tunisia. OECD Includes OECD Europe, OECD Americas and OECD Asia Oceania regional groupings. OECD Americas Canada, Chile, Mexico and United States. OECD Asia Oceania Australia, Japan, Korea and New Zealand. For statistical reasons, this region also includes Israel.1 1 The statistical data for Israel are supplied by and under the responsibility of the relevant Israeli authorities. The use of such data by the OECD and/or the IEA is without prejudice to the status of the Golan Heights, East Jerusalem and Israeli settlements in the West Bank under the terms of international law.
© O
EC
D/IE
A, 2
013

GLOSSARY
MEDIUM-TERM COAL MARKET REPORT 2013 135
OECD Europe Austria, Belgium, Czech Republic, Denmark, Estonia, Finland, France, Germany, Greece, Hungary, Iceland, Ireland, Italy, Luxembourg, Netherlands, Norway, Poland, Portugal, Slovak Republic, Slovenia, Spain, Sweden, Switzerland, Turkey and United Kingdom. Other developing Asia Non-OECD Asia regional grouping excluding China and India. Acronyms, abbreviations, currency codes and units of measure Acronyms and abbreviations ADF Augmented Dickey Fuller test API Argus McCloskey’s Coal Price Index ARA Amsterdam Rotterdam Antwerpen ASEAN Association of Southeast Asian Nations BAU business-as-usual BCS Base Case Scenario BF blast furnace BFI blast furnace iron BHPB BHP Billiton BMA BHP Billiton Mitsubishi Alliance BOF basic oxygen furnace CAGR compound average growth rate CAPP Central Appalachia CCL Central Coalfields Limited CFR cost freight CIF cost insurance freight CIL Coal India Limited CLDC Chinese Low-Demand Case CO2 carbon dioxide DRI direct-reduced iron EAF electric arc furnace EBIT earnings before interest and taxes EIA US Energy Information Administration EPA US Environmental Protection Agency FOB free-on-board FYP Five-Year Plan GCV gross calorific value GDP gross domestic product GMDCL Gujarat Mineral Development Corporation Limited HG high grade IEA International Energy Agency IHDC Indian High-Demand Case IMF International Monetary Fund JORC Australasian Code for Reporting Exploration Results, Mineral Resources and Ore Reserves Ltd. Limited
© O
EC
D/IE
A, 2
013

GLOSSARY
136 MEDIUM-TERM COAL MARKET REPORT 2013
MCL Mahanadi Coalfields Limited MTCMR Medium-Term Coal Market Report MGR merry-go-round NAPP Northern Appalachia NAR net-as-received NCL Northern Coalfields Limited NLC Neyveli Lignite Corporation NDRC National Development and Reform Commission OECD Organisation for Economic Co-operation and Development PCI pulverised coal injection PPMCC Pearson Product Moment Correlation Coefficient PRB Powder River basin RBCT Richard’s Bay Coal Terminal Ro reflectance in oil ROM run-of-mine ROW rest of world SAPP Southern Appalachia SCCL Singareni Collieries Company Limited SD standard deviation SECL South Eastern Coalfields Limited SG standard grade TTF title transfer facility UHG ultra-high grade US United States UT Union Territory VAT value-added tax WCL Western Coalfields Limited YA year-ahead Currency codes AUD Australian dollar CAD Canadian dollar CNY Yuan renminbi COP Colombian peso IDR Indonesian rupiah RUB Russian ruble USD US dollar ZAR South African rand Units of measure AUD/t Australian dollars per tonne bcm/yr billion cubic metres per year Btu/lb British thermal units per imperial pound dwt deadweight tonnage EUR/MWh euros per megawatt hour gce grams of coal-equivalent
© O
EC
D/IE
A, 2
013

GLOSSARY
MEDIUM-TERM COAL MARKET REPORT 2013 137
gce/USD2005 grams of coal-equivalent per 2005 US dollars Gt gigatonne GW gigawatt GW/yr gigawatts per year GWh gigawatt hour GWh/yr gigawatt hours per year kg kilogram km kilometre km3 square kilometre km/h kilometre per hour kcal/kg kilocalories per kilogram kWh/capita kilowatt hours per capita m metre Mdwt million deadweight tonnage Mt million tonnes Mtce million tonnes of coal-equivalent Mtpa million tonnes per year MW megawatt t tonne tce/capita tonnes of coal-equivalent per capita tkm tonne-kilometre TWh terawatt hour USD2012/GJ 2012 US dollars per gigajoule USD/bbl US dollars per barrel USD/d US dollars per day USD/MBtu US dollars per million British thermal units USD/t US dollars per tonne USD/tkm US dollars per tonne-kilometre ZAR/t South African rand per tonne
© O
EC
D/IE
A, 2
013

© O
EC
D/IE
A, 2
013

International Energy Agency • 9 rue de la Fédération • 75739 Paris Cedex 15, France
Buy IEA publications online:
www.iea.org/books
PDF versions available at 20% discount
A number of books printed before January 2012
are now available free of charge in pdf format
on our website
Onlinebookshop
Tel: +33 (0)1 40 57 66 90
E-mail: [email protected]
© O
EC
D/IE
A, 2
013

This publication reflects the views of the International Energy Agency (IEA) Secretariat but does not necessarily reflect those of individual IEA member countries. The IEA makes no representation or
warranty, express or implied, in respect to the publication’s contents (including its completeness or accuracy) and shall not be responsible for any use of, or reliance on, the publication.
This document and any map included herein are without prejudice to the status of or sovereignty over any territory, to the delimitation of international frontiers and boundaries and to the name of
any territory, city or area.
IEA Publications, 9, rue de la Fédération, 75739 Paris cedex 15
Printed in France by IEA, December 2013 (612013101P1) ISBN 9789264191204; ISSN 2307-0315
Cover design: IEA. Photo credits: © GraphicObsession
© O
EC
D/IE
A, 2
013

© O
EC
D/IE
A, 2
013

Market Trends and Projections to 2018
€100 (61 2013 10 1P1) ISSN 2307-0315ISBN: 978 92 64 19120 4
Medium-Term Market Report 2013
COAL
The Medium-Term Coal Market Report 2013 provides IEA forecasts on coal markets
for the coming five years as well as an in-depth analysis of recent developments in
global coal demand, supply and trade. This third annual report shows that while
coal continues to be a growing source of primary energy worldwide, its future is
increasingly tied to developments in non-OECD countries, led by China.
Coal is both the leading fuel source behind the growth of OECD non-members
and the leading source of power generation in OECD countries. Yet the current
low prices for coal add a new challenge to the sector, which is facing uncertainty
due to increasing environmental legislation and competition from other fuels, like
US shale gas or European renewables.
This report examines, among other things, how coal producers will be affected by
such low prices; whether those depressed prices will boost the fuel’s consumption;
if other developing countries will follow in China’s footsteps by increasingly relying
on coal to fuel economic growth; and, above all, whether the strong growth of coal
in China will continue between now and 2018.©
OE
CD
/IEA
, 201
3