meet the author webcast public health reports meet the author webcast socioeconomic status and risk...
TRANSCRIPT

Public Health ReportsMeet the Author WebcastMeet the Author Webcast
Socioeconomic Status and Risk of Diabetes-Related Morality
in the United StatesWith Author:
Sharon Saydah, PhD Centers for Disease Control and Prevention
TODAY - 1:00-2:00ET
To join the conference call, dial: 1-866-951-1151 Access Code: 8768832
Instruction for one credit in Certified in Public Health Continuing Education Practice will be given when the webcast concludes

Socioeconomic Status and Risk of Diabetes-Related Morality
in the United States
May-June 2010, Volume 125-3
Public Health ReportsMeet the Author WebcastMeet the Author Webcast
Sharon Saydah, PhD Centers for Disease Control and Prevention

Sharon Saydah, PhDDivision of Diabetes TranslationCenters for Disease Control and Prevention
Socioeconomic Status and Risk of Diabetes-Related Morality in the
United States
Disclaimer
The views and interpretations presented in this paper are those of the authors and do not necessarily represent the official position of the Centers for Disease Control and Prevention.
Objectives
• Examine socioeconomic (SES) differences in diabetes mortality in the United States.
• Highlight the importance of SES in assessing the social determinants of diabetes mortality.
• Discuss the strengths and challenges of using national data to examine SES of diabetes.

Trends in diabetes-related mortality in the United States
Saydah S. Eberhardt M. Chapter 12 “Diabetes and Mortality” in Diabetes Public Health: From Data to Policy, In press, Figure 1.
Background
• Diabetes was the 7th leading cause of death in the United States 2007.
• Diabetes mortality is a focus area of Healthy People 2010.– Goal to eliminate health disparities.– Tracks diabetes-related mortality for
different education groups.
• Few prospective studies on socioeconomic differences in diabetes-related mortality.

Previous studies
• American Cancer Society cohorts (1959 - 1972 and 1982 -1996)– Inverse gradient for education and
diabetes mortality– No information on race/ethnicity or
income
• National Longitudinal Mortality Study (1979 -1989)– Strong inverse relationship with income
and diabetes mortality
Methods: Data sources
• National Health Interview Survey (NHIS)– In-person survey – Years included 1990 through 2000
• Linked mortality files– National death index– Follow-up through December 31,
2002

Methods: Analytic sample• Inclusion criteria
– Aged 25 years and older at time of interview
– Non-Hispanic white, non-Hispanic black, and Hispanic
– Complete information on all variables of interest
– Final sample size n = 527,426
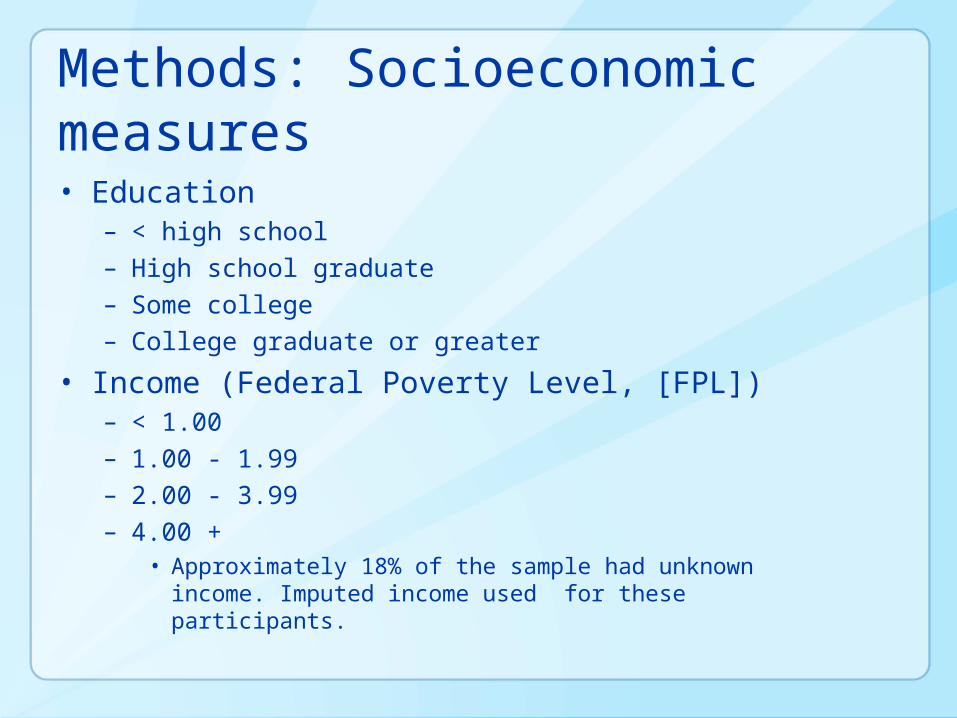
Methods: Socioeconomic measures• Education
– < high school– High school graduate– Some college– College graduate or greater
• Income (Federal Poverty Level, [FPL])– < 1.00– 1.00 - 1.99– 2.00 - 3.99– 4.00 +
• Approximately 18% of the sample had unknown income. Imputed income used for these participants.

Methods: Covariates• Sex• Race/ethnicity• Martial status
– Married– Divorced/separated/widowed– Never married
• Body mass index (BMI) kg/m2
– Based on self reported height and weight– Underweight, normal, overweight, obese
and extremely obese

Methods: Outcome
• Deaths ascertained from time of interview to December 31, 2002
• Diabetes-related mortality– Includes deaths with diabetes indicated
as an underlying or contributing cause
• Number of diabetes deaths = 5,613• Mean follow-up = 6.4 person years
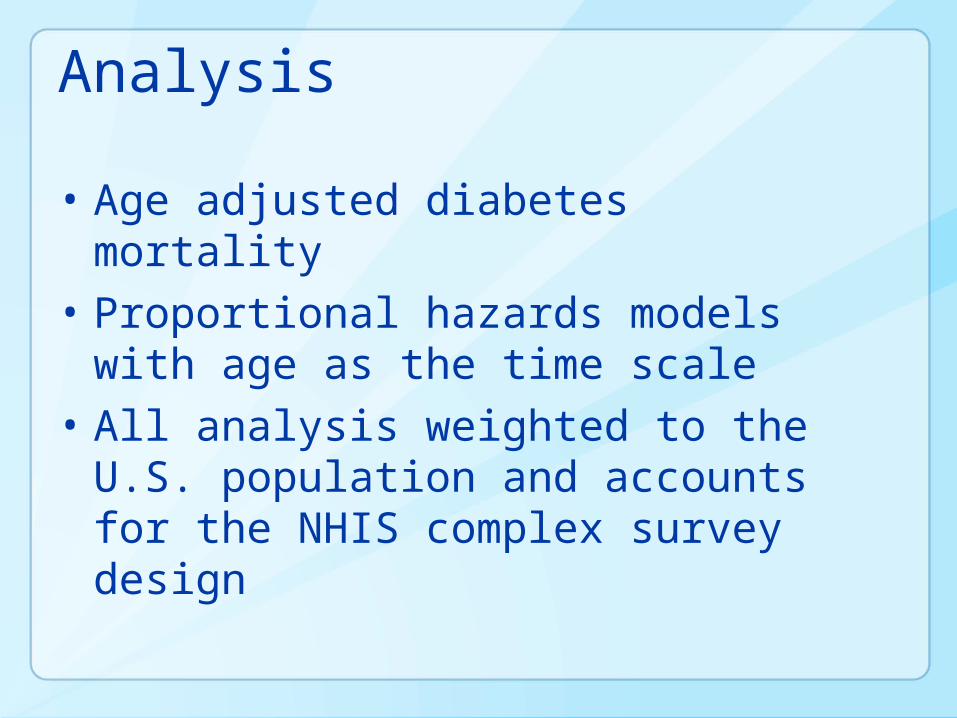
Analysis
• Age adjusted diabetes mortality• Proportional hazards models with
age as the time scale• All analysis weighted to the U.S.
population and accounts for the NHIS complex survey design

Analysis
• Calculated percentage explained by the covariates in the model:
% explained = (RH unadjusted – RH adjusted)
(RH unadjusted – 1)

Baseline characteristics aged 25 years and older in NHIS 1990-2000, United States
Overall < High school
High school Some college
College degree
Age, yrs 48.4 56.2 45.4 45.2 48.9
Male, %* 48.0 47.3 45.6 46.7 53.2
NH white, %* 81.8 67.3 83.4 83.0 89.6
NH black, %* 11.2 16.3 11.3 11.4 6.9
Hispanic, %* 7.0 16.4 5.3 5.6 3.5
Married, %* 67.5 58.7 68.8 68.1 72.0
Divorced/widowed, %* 20.6 31.0 20.9 19.6 12.8
Never married, %* 12.0 10.3 10.4 12.4 15.2
Underweight, %* 2.3 2.9 2.2 2.1 2.2
Normal, %* 42.1 36.1 40.8 41.8 49.0
Overweight, %* 35.7 36.5 36.0 35.7 34.8
Obese, %* 13.2 16.0 13.8 13.3 9.8
Extremely obese, %* 6.7 8.4 7.2 7.2 4.2
* Statistically different across the Federal Poverty Level (FPL) groups based on 2 p < 0.001

Baseline characteristics aged 25 years and older in NHIS 1990-2000, United States
< 100% FPL 100-199% FPL 200-299% FPL 300-399% FPL ≥ 400% FPL
Age, yrs 48.9 51.4 48.6 46.6 47.3
Male, %* 37.5 44.3 48.2 49.8 52.2
NH white, %* 57.3 74.5 83.0 86.9 90.0
NH black, %* 26.3 15.0 10.5 8.3 6.4
Hispanic, %* 16.4 10.5 6.6 4.8 3.6
Married, %* 41.0 59.3 69.8 75.1 74.7
Divorced/widowed, %* 39.3 28.8 19.6 14.8 13.8
Never married, %* 19.7 11.9 10.6 10.1 11.5
Underweight, %* 3.6 2.8 2.3 2.1 1.8
Normal, %* 37.9 40.1 41.7 43.4 44.1
Overweight, %* 32.3 34.7 35.7 36.2 37.2
Obese, %* 15.6 14.3 13.7 12.4 11.9
Extremely obese, %* 10.6 8.2 6.7 5.9 5.1
* Statistically different across the Federal Poverty Level (FPL) groups based on 2 p < 0.001

Percentage of adults by education and poverty level, NHIS 1990-2000
< 100% FPL 100-199% FPL
200-299% FPL
300-399% FPL
≥ 400% FPL
< High school *
48.8 34.0 17.9 10.3 5.2
High school graduate *
32.1 39.9 41.3 36.1 26.2
Some college *
14.0 18.4 25.1 27.4 26.8
College graduate *
5.2 7.7 15.7 26.2 41.8
* Statistically different across the education groups based on 2 p < 0.001
FPL = Federal Poverty Level

Diabetes-related mortality by education level
0
50
100
150
200
250
Men Women Non-Hispanic white
Non-Hispanic black
Hispanic
< HS HS grad Some college College grad
Age adjusted to the 2000 U.S. standard populationRates per 100,000 person years

Diabetes-related mortality by Federal Poverty Level (FPL)
0
50
100
150
200
250
Men Women Non-Hispanic white
Non-Hispanic black
Hispanic
< 100% FPL 100-199% FPL 200-299%FPL
300-399% FPL 400%+
Age adjusted to the 2000 U.S. standard populationRates per 100,000 person years

Risk of diabetes-related mortality by education level
Education level
Model 1: RH (95%
CI)
Model 2: RH (95%
CI)
Model 3: RH (95%
CI)
% explained (model 3
compared to 1)
< HS 2.46 (2.15, 2.82)
2.27 (1.98, 2.61)
2.05 (1.78, 2.35)
28%
HS grad 1.60 (1.39, 1.83)
1.65 (1.44, 1.90)
1.57 (1.37, 1.80)
5%
Some college
1.48 (1.27, 1.74)
1.52 (1.30, 1.70)
1.46 (1.25, 1.71)
4%
College grad
1.00 (reference)
1.00 (reference)
1.00 (reference)
Relative hazards (RH) based on proportional hazards model with age as the time scale. Model 1: adjusted for socioeconomic status indicator only Model 2: model 1 additionally adjusted for demographic characteristics Model 3: model 2 additionally adjusted for BMI

Risk of diabetes-related mortality by education level
Education level
Model 3: RH (95% CI)
Model 4: RH (95% CI)
% explained (model 4
compared to 3)
< HS 2.05 (1.78, 2.35)
1.55 (1.34, 1.80)
48%
HS grad 1.57 (1.37, 1.80)
1.32 (1.15, 1.53)
44%
Some college 1.46 (1.25, 1.71)
1.33 (1.13, 1.56)
28%
College grad 1.00 (reference)
1.00 (reference)
Relative hazards (RH) based on proportional hazards model with age as the time scale. Model 3: adjusted for socioeconomic status indicator, demographics and BMI Model 4: model 3 additionally adjusted for FPL

Risk of diabetes-related mortality by Federal Poverty LevelFederal Poverty Level
Model 1: RH (95%
CI)
Model 2: RH (95%
CI)
Model 3: RH (95%
CI)
% explained (model 3
compared to 1)
< 100% 2.94 (2.53, 3.42)
2.64 (2.25, 3.10)
2.41 (2.05, 2.84)
27%
100-199% 2.21(1.92, 2.54)
2.11(1.83, 2.43)
1.98 (1.71, 2.28)
19%
200-299% 1.81(1.56, 2.10)
1.78 (1.53, 2.06)
1.70 (1.47, 1.97)
14%
300-399% 1.24 (1.05, 1.46)
1.23 (1.04, 1.45)
1.20 (1.02, 1.42)
17%
≥ 400% 1.00 (reference)
1.00 (reference)
1.00 (reference)Relative hazards (RH) based on proportional hazards model with age as the time scale.
Model 1: Adjusted for socioeconomic status indicator only Model 2: Model 1 additionally adjusted for demographic characteristics Model 3: Model 2 additionally adjusted for BMI

Risk of diabetes-related mortality by Federal Poverty LevelFederal Poverty Level
Model 3: RH (95% CI)
Model 4: RH (95% CI)
% explained (model 4
compared to 3)
< 100% 2.41 (2.05, 2.84)
2.07 (1.73, 2.46)
27%
100-199% 1.98 (1.71, 2.28)
1.73 (1.48, 2.02)
19%
200-299% 1.70 (1.47, 1.97)
1.55 (1.33, 1.81)
14%
300-399% 1.20 (1.02, 1.42)
1.14 (0.96, 1.35)
17%
≥ 400% 1.00 (reference)
1.00 (reference)Relative hazards (RH) based on proportional hazards model with age as the time scale.
Model 3: adjusted for socioeconomic status indicator , demographics and BMI Model 4: model 3 additionally adjusted for education levels
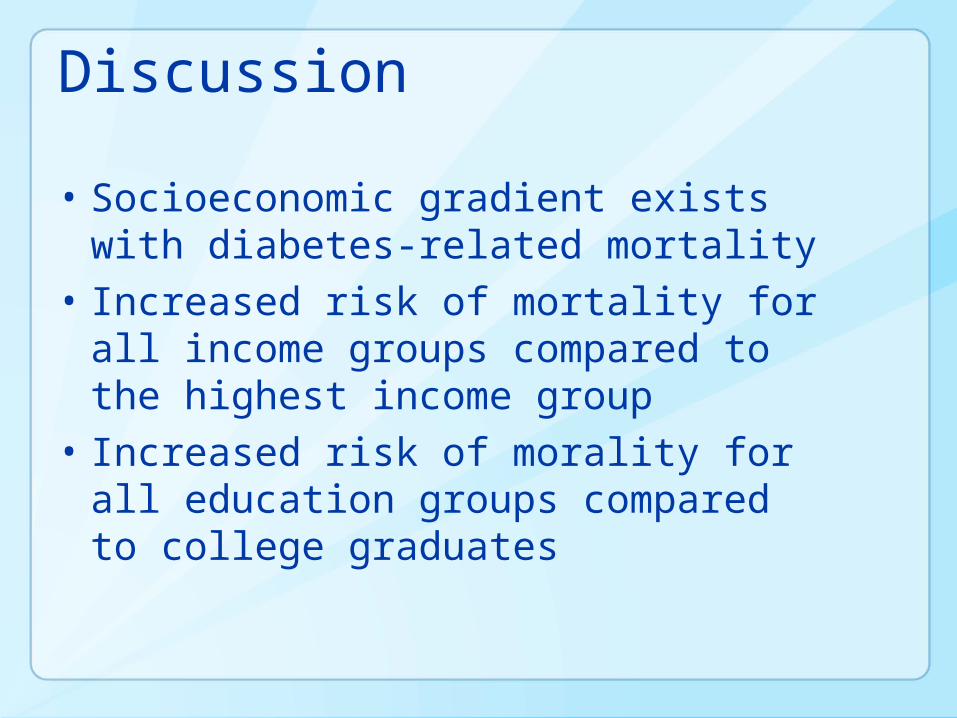
Discussion
• Socioeconomic gradient exists with diabetes-related mortality
• Increased risk of mortality for all income groups compared to the highest income group
• Increased risk of morality for all education groups compared to college graduates

Limitations
• Possible underreporting of diabetes morality on death certificates– Not known whether underreporting
differs by socio-economic status in U.S.
– U.K.P.D.S. study found lower social class more likely to have diabetes coded on death certificate
• Education and income only measured at baseline
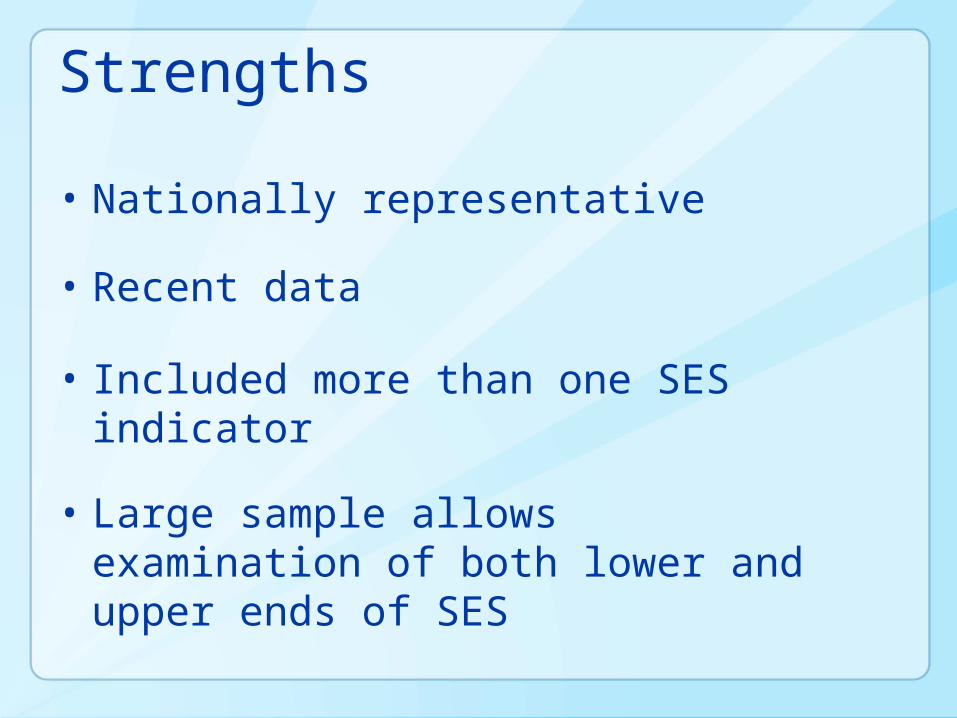
Strengths
• Nationally representative
• Recent data
• Included more than one SES indicator
• Large sample allows examination of both lower and upper ends of SES

Conclusions
• Reducing overall diabetes mortality and disparities in diabetes mortality an important goal for federal programs.– Healthy People 2010– National Diabetes Education Program
• Diabetes mortality research provides guidance for primary, secondary tertiary diabetes prevention efforts

Socioeconomic Status and Risk of Diabetes-Related Morality
in the United States
Questions and AnswersQuestions and Answers
Sharon Saydah, PhD Centers for Disease Control
and Prevention

Public Health ReportsMeet the Author WebcastMeet the Author Webcast
http://www.publichealthreports.org
Next Webcast: December 7th, 1:00 ET Tracking Parent's Concerns about Childhood Vaccines –
A Public Health Surveillance SystemWith:Philip Smith, PhD CDC, National Center for Immunization and Respiratory
Disease
Edgar Marcuse, MD, MPHWashington University School of Public Health
Certification in Public Health Continuing Education Practice, please go to:http://www.shoppublichealth.org/
Link to the CE credits is on the left side of the page