meeting information - allindata
TRANSCRIPT
Meeting Information
▪ Conference Line: 1-562-247-8422
▪ Access Code: 660-067-854 #
▪ Enter your audio PIN ID #
▪ Technical difficulties? Email [email protected]

Improving Precision in Public
Health through Innovative
Data Sharing Approaches
January 10, 20182:00 p.m. – 3:00 p.m. ET
All In Project Showcase Webinar

Chat Feature
▪ To share questions or comments using the chat feature:
▪ Type into the question box on the right side of your screen and click the “send” button.

All In: Data for Community Health
1. Support a movement acknowledging the social determinants of health
2. Build an evidence base for the field of multi-sector data integration to improve health
3. Utilize the power of peer learning and collaboration

We are All In!
COMMUNITY HEALTH PEER LEARNING PROGRAM
NPO: AcademyHealth, Washington DC
Funded by the federal Office of the National Coordinator
15 former grantees
BUILD HEALTH CHALLENGE
Funded by 10 national & local funders (including Advisory Board, de
Beaumont Foundation, the Colorado Health Foundation, The KresgeFoundation and Robert Wood
Johnson Foundation)
18 former grantees, 19 current grantees
DATA ACROSS SECTORS FOR HEALTH
NPO: Illinois Public Health Institute in partnership with the Michigan Public
Health Institute
Funded by the Robert Wood Johnson Foundation
10 grantees
CONNECTING COMMUNITIES AND CARE
Funded by the Colorado Health Foundation
14 grantees
PUBLIC HEALTH NATIONAL CENTER FOR INNOVATIONS
Funded by the Robert Wood Johnson Foundation
9 grantees

Speakers
Michael Fried, MS,
Chief Information
Officer, Baltimore City
Health Department
Jessica Solomon
Fisher, MCP,
Chief Innovation
Officer, Public Health
National Center for
Innovations
Raed Mansour, MS,
Director, Office of
Innovation, Chicago
Department of Public
Health

Childhood Lead Paint Hazard
Data Sharing Across Sectors of Health
Support for this project is provided by the Data Across Sectors of Health grant from the Robert Wood Johnson Foundation

Innovate “Inside the Box” of Policies

zz
Government Infrastructure
Culture of InnovationPublic Health System, Communities of Practice, etc.

Pathways to Discovery & Development

Lead Poisoning Rates Decreasing
• In Chicago, almost 90%
of the housing stock built
before 1978. There are
~1M addresses
• Chicago has seen
significant progress in
reducing the number of
children diagnosed with
elevated blood lead
levels.
• In the 1990s, 1 in 4
Chicago children tested
had a BLL of at least 10
μg/dL, that number is
now less than 1 in 100
children.

Big DataYEARS RECORDS VARIABLES OWNER
Blood Lead Level 1995 - Present 2,700,000First name, last name, date of birth, address, blood lead level, sample type, sample date
CDPH LeadProgram
Home Inspection Records Summary 1989 -Present 66,000
Date of initial inspection, lead based paint hazard (yes/no), location of lead-based paint hazards (interior/exterior/both/), date complied, address
CDPH LeadProgram
Women, Infants and Children 1994 - Present 180,000First name, last name, date of birth, address, sociodemographics
CDPH WIC Program
Building Permits 2006 - Present 400,000 Address, issue date, permit typeChicago Department of
Buildings(Chicago Data Portal)
Building Violations 2006 - Present 1,500,000Address, violation Date, violation description, violation ordinance, inspection status
Chicago Department of Buildings (Chicago Data Portal)
Building Footprints 2015 800,000Year of building construction, physical condition, number of units, stories (floors), vacancy status
Chicago Department of Buildings(Github)
Cook County Assessor 2013 800,000Address, assessed property values, building classifications, building characteristics
2014 Cook County Assessor
Chicago Census Boundaries 2010 800 Shape File Chicago Data Portal
Chicago Ward Boundaries 2015 50 Shape File Chicago Data Portal
American Community Survey 2005 - 2014 800Census tract variables including socio-demographics, education, health insurance, home ownership.
US Census Bureau
Frequently Occurring Surnames 2000 150,000 Census surname ethnicity US Census Bureau

CHILD POISONED LEAD IDENTIFIED
REMEDIATION
MITAGATION
ABATEMENT
REACTIVE
PROACTIVE
• Proactive identification of infants under 12 months and pregnant women who are at risk of lead exposure, with existing lead safe strategies, before lead poisoned - primary, upstream prevention.

Data Science for Social Good 2014Historical Validation

Blood TestsHome
InspectionsCensus ACS Assessor
Building
Footprints
WIC Data
Spatio-Temporal
Features
Spatial
Features
Prototype
Model
Building permits
violations
Model Field Validation
See Organizational & Data Readiness Tools at
http://dsapp.uchicago.edu/projects/health/lead-prevention

Erie Family Health Center:
Teen & Young Adult Health Center
West Town Health Center
Near North Health Service Corporation:
Komed Holman Health Center
North Kostner Health Center
• Lead paint hazards persists
in some communities
• Children in low opportunity
index neighborhoods are
5x more likely to have an
elevated blood lead level
than those in high
opportunity
neighborhoods

ONC HIT: API’s can Revolutionize Health Care Data Sharinghttps://www.healthit.gov/api-education-module/story_html5.html
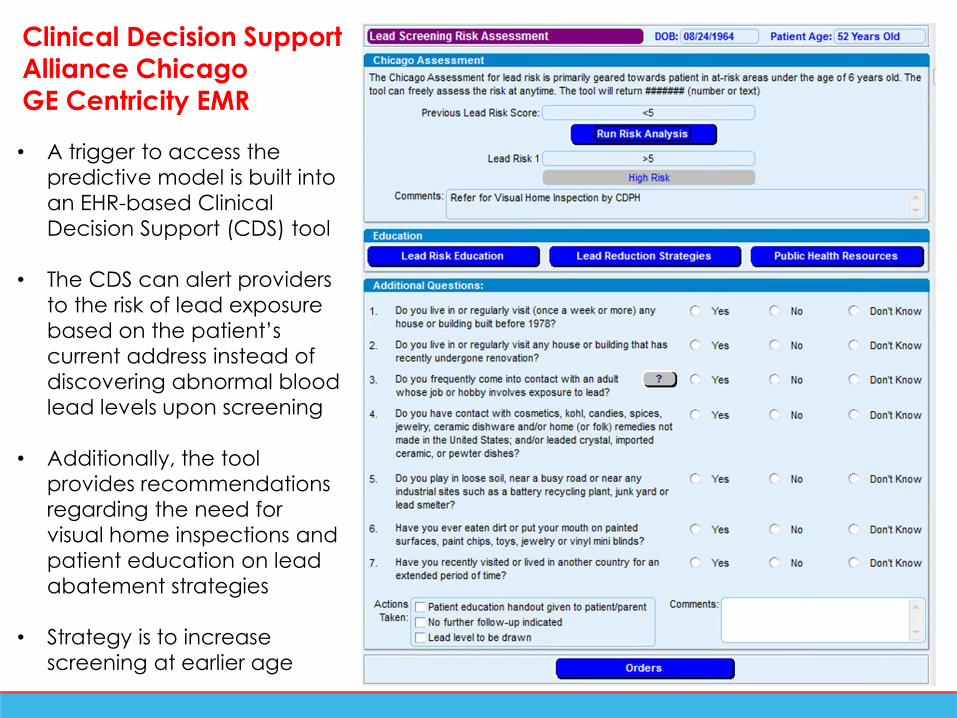
• A trigger to access the
predictive model is built into
an EHR-based Clinical
Decision Support (CDS) tool
• The CDS can alert providers
to the risk of lead exposure
based on the patient’s
current address instead of
discovering abnormal blood
lead levels upon screening
• Additionally, the tool
provides recommendations
regarding the need for
visual home inspections and
patient education on lead
abatement strategies
• Strategy is to increase
screening at earlier age
Clinical Decision SupportAlliance Chicago
GE Centricity EMR

Open Source – Spurs Innovation• Repeatable
• Reproducible
• Replicable
https://github.com/Chicago/lead-model
https://github.com/Chicago/lead-etl
https://github.com/Chicago/lead-safe-api-docs

/ChicagoPublicHealth
@ChiPublicHealth
www.CityofChicago.org/Health
Thank You!
Raed Mansour, MS
Director of Innovation
Leana Wen, M.D., M.Sc.Commissioner of Health, Baltimore City
Catherine E. PughMayor, Baltimore City
@Bmore_Healthy@DrLeanaWen
BaltimoreHealth
health.baltimorecity.gov
BFRIEND Innovations in Acronyms
Our Goal
To decrease the rate of falls leading to an Emergency Department visit or a hospital admission among older adults by one-third in three years in Baltimore City.
Our Approach
• To combine the ability of BCHD to view data with the availability of information in CRISP to create a near real-time surveillance tool for falls in Baltimore City.
• Created a falls dashboard in CRISP
• Tells us number and rate of ED visits and hospitalizations due to falls across Baltimore City
• Updated each month
• Created the ability to take in partner data for analysis
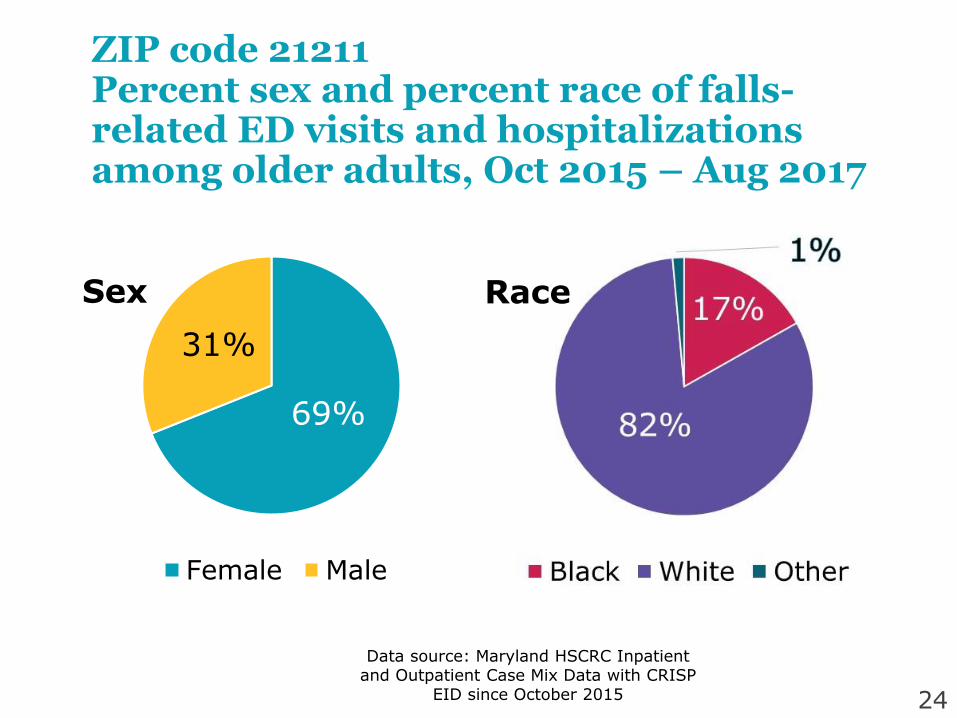
69%
31%
Female Male
ZIP code 21211 Percent sex and percent race of falls-related ED visits and hospitalizations among older adults, Oct 2015 – Aug 2017
24
Data source: Maryland HSCRC Inpatient and Outpatient Case Mix Data with CRISP
EID since October 2015
Sex Race

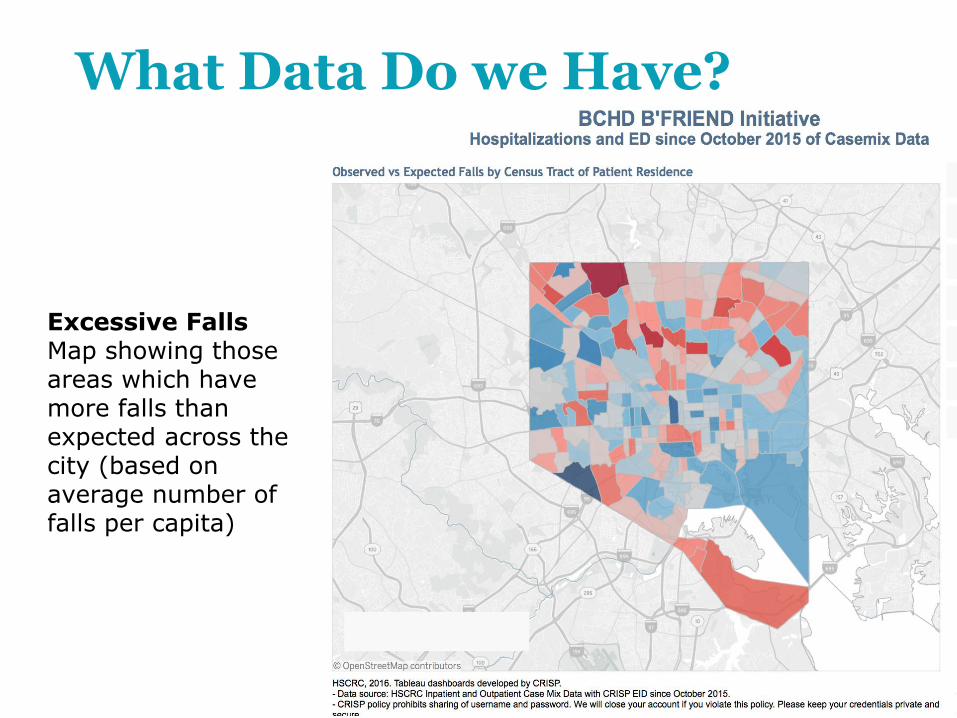
What Data Do we Have?
Rate MapMap showing the rate of ED visits and hospitalizations per capita due to falls
What Data Do we Have?
Excessive FallsMap showing those areas which have more falls than expected across the city (based on average number of falls per capita)

What Data Do We Have?
Hotspot CapabilitiesHampden is a hotspot for falls

What Have We Learned?
• There are hotspots – but many people live there!
• We don’t want to displace older adults by penalizing specific landlords, we need to bring our collective services together to address these issues
• Repeat falls are driving the rates higher• We need to work with individuals who have
experienced falls to reduce future risk
• Falls are a complex issue!• We need to work together to address
identified hotspots
Process Lessons Learned
Working across sectors can be more difficult than one expects
Local government bureaucracy and politics present notable challenges to innovation
ContractingChanges in elected/appointed leadersLegal agreements
Local and meaningful data excite partners and create momentum for real change!
29
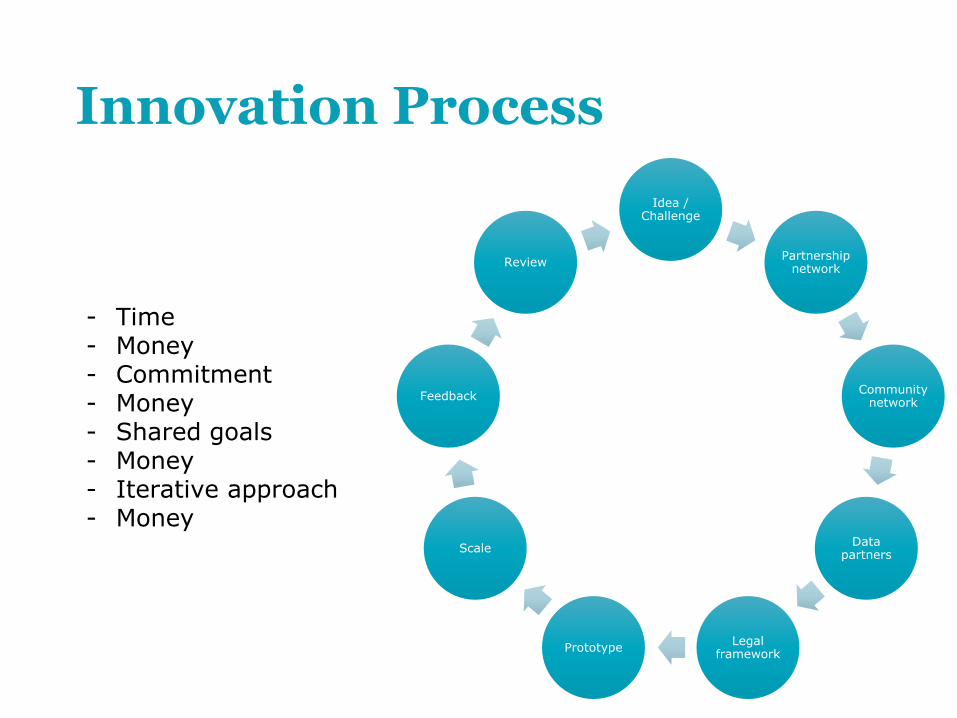
Innovation Process
Idea / Challenge
Partnership network
Community network
Data partners
Legal framework
Prototype
Scale
Feedback
Review
- Time- Money- Commitment- Money- Shared goals- Money- Iterative approach- Money

Continue using B’FRIEND for surveillance and targeting falls prevention activities
Incorporate additional data from sources such as EMS calls for service, transportation, older adult home visiting programs, weather, etc.
Conduct further epidemiologic and geospatial analyses (“hot spots”)
Next Steps
31

Reflections on All-In and Dash
• Love the network!!
• Critical support for proof of concept that have broader implications
• Site visits expand reach
• Would love to do it again!
Upcoming All In Events
▪ Next All In Project Showcase Webinar
Wednesday, February 28 from 3:00 – 4:00 pm ET
▪ Communities Joined in Action Conference
February 14 – 16 in Atlanta, GA
Email Peter Eckart ([email protected]) about All In networking opportunities

Connect with Us!
▪ Visit our website: allindata.org
▪ Sign up for our online community: allin.healthdoers.org
▪ Follow #AllInData4Health on Twitter
▪ Sign up for news from All In
▪ Contact information for speakers
▪ Michael Fried: [email protected]
▪ Raed Mansour: [email protected]
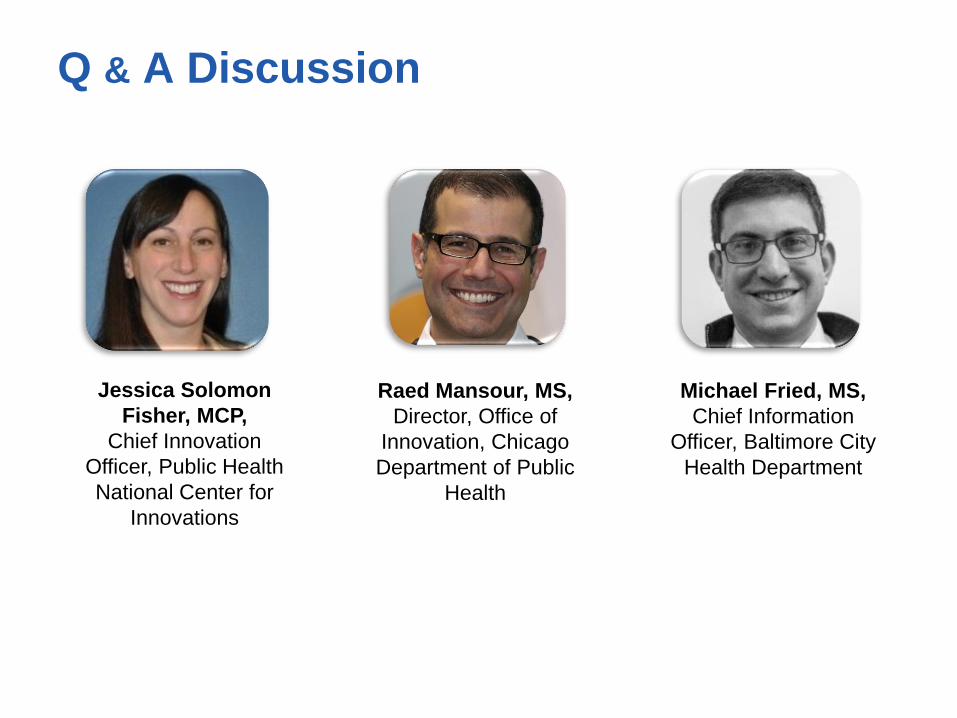
Q & A Discussion
Michael Fried, MS,
Chief Information
Officer, Baltimore City
Health Department
Jessica Solomon
Fisher, MCP,
Chief Innovation
Officer, Public Health
National Center for
Innovations
Raed Mansour, MS,
Director, Office of
Innovation, Chicago
Department of Public
Health

Next Steps
▪ Share your feedback
Please complete the evaluation survey following the webinar
▪ Resource list, slides, and recording will be posted
Available online at allindata.org/resources
Thanks for participating!